Article

Global Study of Human Heart Rhythm Synchronization with the Earth’s Time Varying Magnetic Field

by
Inga Timofejeva
1,*,
Rollin McCraty
2,
Mike Atkinson
2,
Abdullah A. Alabdulgader
3,
Alfonsas Vainoras
4,
Mantas Landauskas
1,
Vaiva Šiaučiūnaitė
1 and
Minvydas Ragulskis
1
1
Department of Mathematical Modelling, Kaunas University of Technology, 51368 Kaunas, Lithuania
2
HeartMath Institute, Boulder Creek, CA 95006, USA
3
Research and Scientific Bio-Computing, Prince Sultan Cardiac Center, Alhasa, Hofuf 31982, Saudi Arabia
4
Cardiology Institute, Lithuanian University of Health Sciences, 44307 Kaunas, Lithuania
*
Author to whom correspondence should be addressed.
Appl. Sci. 2021, 11(7), 2935; https://doi.org/10.3390/app11072935
Submission received: 14 February 2021 / Revised: 19 March 2021 / Accepted: 22 March 2021 / Published: 25 March 2021
(This article belongs to the Special Issue Selected Papers from IMETI 2020)

Abstract

:
Changes in geomagnetic conditions have been shown to affect the rhythms produced by the brain and heart and that human autonomic nervous system activity reflected in heart rate variability (HRV) over longer time periods can synchronize to changes in the amplitude of resonant frequencies produced by geomagnetic field-line and Schumann resonances. During a 15-day period, 104 participants located in California, Lithuania, Saudi Arabia, New Zealand, and England underwent continuous ambulatory HRV monitoring. The local time varying magnetic field (LMF) intensity was obtained using a time synchronized and calibrated network of magnetometers located at five monitoring sites in the same geographical locations as the participant groups. This paper focuses on the results of an experiment conducted within the larger study where all of the participants simultaneously did a heart-focused meditation called a Heart Lock-In (HLI) for a 15-min period. The participant’s level of HRV coherence and HRV synchronization to each other before, during and after the HLI and the synchronization between participants’ HRV and local time varying magnetic field power during each 24-h period were computed for each participant and group with near-optimal chaotic attractor embedding techniques. In analysis of the participants HRV coherence before, during and after the HLI, most of the groups showed significantly increased coherence during the HLI period. The pairwise heart rhythm synchronization between participants’ in each group was assessed by determining the Euclidean distance of the optimal time lag vectors of each participant to all other participants in their group. The group member’s heart rhythms were significantly more synchronized with each other during the HLI period in all the groups. The participants’ daily LMF-HRV-synchronization was calculated for each day over an 11-day period, which provided a 5-day period before, the day of and 5-days after the HLI day. The only day where all the groups HRV was positively correlated with the LMF was on the day of the HLI and the synchronization between the HRV and LMF for all the groups was significantly higher than most of the other days.

1. Introduction

1.1. Literature Overview

Every cell of a biological system, embedded within the Sun and Earth’s magnetic fields is continuously affected by the fluctuations of these magnetic fields that span over a wide range of frequencies [1]. Numerous studies exploring the connection between magnetic activity and biological systems of various living organisms were performed in recent years. For instance, the authors of [2] presented a biocompass model that may assist in fully uncovering the molecular mechanism of animal magnetoreception. Moreover, an evidence for the link between the natural extremely low frequency (ELF) fields and those found in many living organisms, was presented in [3]. In [4], the impact of weak geomagnetic disturbances on rat’s biological systems was investigated and it was concluded that such disturbances affect cardiac and autonomic nervous system (ANS) functions. Similar effects emerge as human physiological systems get exposed to various changes in geomagnetic dynamics. Geomagnetic field line resonances as well as Schumann resonances (SR), occurring in the space between surface of the Earth and the ionosphere, produce a range of resonant frequencies that directly overlap with those of the human brain, ANS and cardiovascular system. Rhythms produced by the brain and heart are affected by the changes in geomagnetic conditions more strongly than the other physiological systems studied so far [5,6,7,8,9,10,11,12]. Authors of [13] have shown that exposure to SR field induces a stress response process that results in the reduction of creatine kinase release of cardiac cell cultures. It was demonstrated in [14] via the artificial simulation of geomagnetic storm that such geomagnetic activity can cause a significant cardiovascular response. Moreover, results presented in [15] suggest that there is a connection between short-term geomagnetic disturbances and the number of deaths from cardiovascular diseases and myocardial infarction. The study conducted in [16] has shown that magnetic field changes can affect and enhance HRV indices involved in anti-aging or longevity. The study exploring a possible link between sunspots and pandemics related to the hypothesized possibility that microscopic biological entities can penetrate the interplanetary magnetic field barrier and reach the stratosphere during solar minimum was presented in [17].
Numerous research illustrates the influence of geomagnetic and solar activity on various physiological rhythms as well as the possible synchronization between the two [18,19,20,21,22]. Moreover, recent studies that involved continuous monitoring of heart rate variability (HRV) over longer time periods have revealed a surprising degree of synchronization between ANS activity and the changes in the amplitude of resonant frequencies produced by geomagnetic field-line resonances, Alfvén waves (AW) and the SR [23]. These studies also found that the participants exhibited a hitherto unknown slow wave rhythm of approximately 2.5 days in their HRV which was highly synchronized among the study participants and the time-varying magnetic field data [11,23]. Another relevant study examined changes in HRV in response to changes in geomagnetic, solar and cosmic ray activity over a five-month period. This study confirmed that daily ANS activity responds to changes in geomagnetic and solar activity during periods of normal undisturbed activity and it is initiated at different times after the changes in the various environmental factors and persist over varying time periods [24].
HRV characterizes the change in the time intervals between adjacent pairs of heartbeats and is an important measure reflecting ANS dynamics [25]. Patterns observed in HRV reveal the functional status of codependent regulatory systems that operate over different time scales to adapt to environmental and psychological challenges [26]. For instance, lower degrees of variation in age-adjusted HRV indicate chronic stress, pathology, or insufficient functioning in regulatory systems in the neuroaxis, and are associated with all-cause mortality while higher degree of variation indicate resiliency and capacity to self-regulate and adapt to changing demands [26,27].
Processes within the magnetosphere and the solar wind excite a broad range of magnetic waves that are typically present globally, although there are significant local differences. The most well known are SR. The frequencies of SR are approximately 7.83 Hz, 14, 20, 26, 33, 39, and 45 Hz, which closely correspond with human brainwaves (alpha (8–12 Hz), beta (12–30 Hz), and gamma (30–100 Hz) [28]. Persinger et al. has found that the power within EEG spectral profiles has repeated periods of coherence with the first three SR resonance frequencies (7–8 Hz, 13–14 Hz, and 19–20 Hz) in real-time and suggests that fluctuations in the SRs can affect brain activity, including modulations in cognition [29]. Substantially less research has examined the effects of ultra-low frequency (ULF) waves on physiological functions.
The primary source of ultra-low frequency waves in the magnetosphere are field-line resonances, which have the largest amplitudes of the all the magnetic waves [30]. The ionosphere, which surrounds the Earth, is a highly ionized plasma layer threaded by magnetic fields. As first described by Hannes Alfven, charged high-energy particles spiraling around the magnetic field lines explain how ultra-low-frequency waves (AW) are created [31]. Magnetic field lines, which have lengths several times the Earth’s radius, are excited and vibrate at their resonant frequency, similar to plucking a guitar string. The length of the field lines, field strength, and the speed and density of the solar wind affect their frequency [32]. The longer the field line the lower the resonant frequency. Changes in solar wind speed and polarity of the interplanetary magnetic field can have large effects on the waves, as measured on the surface of the Earth [33]. Magnetic oscillations with frequencies below 1 hertz that have sinusoidal waveforms are classified as pulsations continuous (Pc) and irregular waveforms are classified as pulsations irregular (Pi). They are further subdivided into frequency ranges, which are associated with different mechanisms. Magnetic standing waves with frequencies up to 5 hertz are typically excited by geomagnetic sub-storms are classified as Pc1 and 2, and field-line resonances in the range between 1 mHz and 100 mHz (periods of 1000 to 10 s) are classified as Pc3 to Pc5 waves [32].

1.2. Motivation

Several studies have found that an increase in field-line resonances can lead to changes in cardiovascular function [18,21,23,34]. Given the recent findings, that human HRV exhibits a much slower wave rhythm than had been previously identified, which can also synchronize to changes in the spectral power of field-line resonant frequencies, this study extends previous studies in several ways. Firstly, the previous studies used groups that located in one geographical area. Here we recruited groups located in five countries with a large geographical separation in order to determine if the HRV synchronization to the field-line resonances occurs globally, and determine if there are differing field-line resonant frequencies in different locations.
Furthermore, one of the recent studies demonstrated that participant’s psychological state and quality of social interactions between group members is related to the degree of HRV synchronization with the magnetic field activity and other participants in the group [11]. Another research study hypothesized that an individual in a state of physiological or HRV coherence is more likely to be coupled to and have a higher degree of synchronization with Earth’s magnetic field [28]. In order to test this assumption, this study also inspected the potential effects of a heart-focused meditation technique called the Heart Lock-In (HLI), which has been shown to increase the coherence in one’s heart rhythms as well as increase the synchronization of heart rhythms between participants in a group setting [35].
A newly developed and validated methodology utilizing near-optimal chaotic attractor embedding techniques was used in order to enhance the assessment of physiological synchronization and identify individuals’ response patterns [11]. Consequently, we were able to identify specific patterns of synchronization between HRV and local magnetic field activity, and assess potential effects of participants being in a state of HRV coherence on synchronization to each other and with the earth’s magnetic field in diverse groups of people located in different countries around the planet.
The main objective of this paper is to determine if the results reported in [11,23] could be replicated on a global scale, and to determine if the participants’ degree of synchronization with each other and local magnetic field could be increased by using a technique known to increase heart rhythm coherence.
This paper is organized as follows. The overview and the details of HRV and local magnetic field data acquisition and filtering are presented in Section 2.1, Section 2.2, Section 2.3 and Section 2.5. The steps as well as the observed effects of the used Heart Lock-In meditation technique are given in Section 2.4. The procedure used for the evaluation of synchronization between participants’ HRV and local magnetic field is presented in Section 2.6. The main idea of this procedure is based on the fact that the data signal can be used to reconstruct the underlying chaotic dynamical system corresponding to the observed phenomena (for example, heart rate variability or local magnetic field spectral power, etc.). In order for such reconstruction to be meaningful and to preserve the properties of the underlying dynamical system, the optimal reconstruction parameters should be selected. The comparison of such optimal parameters corresponding to two data signals allows to assess the synchronization between these signals. Section 2.7 and Section 2.8 overview the details of the analysis of synchronization between participants’ HRV and Earth’s magnetic field. The results of this analysis are given Section 3. The summary of the obtained results as well as possible limitations and suggestions for the future studies are presented in Section 4 and Section 5.

2. Materials and Methods

2.1. Participants

During the 15-day period between 26 February and 13 March 2015, 104 participants located in California, Lithuania, Saudi Arabia, New Zealand, and England participated in the study (note that only 11-days from 28 February to 11 March were chosen for further investigation as will be explained in further sections). The selection of those particular countries was based on the geographical locations where the magnetometers of the Global Coherence Monitoring Network [28] are installed. All the participants were healthy and either worked or attended classes during daytime hours. The Lithuanian group consisted of 20 medical students attending the Lithuanian University of Health Sciences. The California group consisted of 20 individuals, 16 were employees at the HeartMath Institute (HMI) in Boulder Creek, California and worked in offices at two separate locations about 5 miles apart. Two of these employees lived and worked remotely, one in in a nearby town and the other in southern California. The remaining four participants were acquaintances from the local community. The New Zealand group consisted of 22 individuals, located in Aotearoa and were from an array of different cultural origins and backgrounds. Eleven of the group were staff members of Freedom Farms who founded an organization called The Embassy of Peace. The other eleven participants had a connection with the organization and all the group member are reported to have longstanding and meaningful relationships with each other. The Saudi Arabia group consisted of 20 medical students attending the college of medicine at the King Faisal University. The group located in England consisted of 7 business leaders who worked in a shared office location. The other 7 were people known to the study coordinator with an interest in HeartMath and personal, social and global coherence and were located in different UK locations.
Each location had a local site coordinator who was responsible for participant recruitment, logistics coordination and participant training in the study procedures and use of the HRV recorders. Study coordinators in the 5 countries recruited a total of 104 participants, one participant failed to return their HRV recorder at the end of the study so the number of participants dropped to 103 at the end of the study. Seven participants in New Zealand did not participate in the Heart Lock-In experiment and were not used in the current analysis. The mean age (SD) of the 96 participants in the analysis was, 36 (15.1) years consisting of 56 females and 40 males. Table 1 contains the age and gender breakdown for all participants by country.
Local study coordinator in each country excluded candidates that had any of the following conditions; heart disease of any type, heart irregularities (arrhythmia, fibrillation etc.), hypertension, diabetes, severe anxiety or depression that requires prescription medication, and conditions like sleep apnea that requiring the use of a CPA.

2.2. HRV Data Collection

HRV is a non-invasive measure which reveals the dynamic activity of individual’s ANS [25]. The participants all had 24-h ambulatory HRV recordings recorded daily over a two-week period from 26 February to 12 March 2015. Each participant was instructed on how to attach, start, and stop the recorders at the start of the study (Bodyguard2, Firstbeat Technologies Ltd., Jyväskylä, Finland) by the site coordinator who retrieved the data from the HRV recorders and uploaded it to the FTP data collection site.
Moreover, participants were provided instructions for notating daily activities such as sleep and waking times, etc. They were shown how to pause the HRV recorder after waking and had up to one hour to bathe before restarting the recorder. Ambu Blue Sensor L microporous disposable electrodes were located in a modified V5 position. Skation was minimized by encouraging the participants to place the electrodes at three different locations near the V5 position. The inter-beat-interval (IBI) was calculated by the HRV recorder from the electrocardiogram with a sample rate of 1000 Hz. The RR intervals were stored in the HRV recorders memory which was then uploaded to the study FTP site at the end of the study.
The HRV data were then downloaded to a workstation and analyzed using DADiSP 6.7. IBIs less or greater than 30% of the mean of the previous four intervals were removed from the analysis record. Following the automated editing process, all recordings were reviewed manually by an experienced technician and, where needed, corrected. All of the HRV recordings were segmented into consecutive 5-min segments as established by the HRV Task Force [36] standards. Any 5-min segment with >10% of the IBIs either removed or missing were excluded from the analysis. The local time stamps in the HRV recordings were converted to Coordinated Universal Time (UTC) to insure synchronization between participants in different locations and with the magnetic field data.
Allowing for a staggered start and end of the HRV data recording because of the different time zones of the participants, HRV data was recorded over a 15-day period in order to collect 14 full days of data. Of the planned 32,256 h of recording (96 participants × 14 days × 24 h), after accounting for missed recordings, data clearing and editing 95% (30,621 h.) were available. Only 7 participants had fewer than 80% of the planned hours of recording and only two of these were under 70%.

2.3. Magnetic Field Data

The local magnetic field intensity data was obtained using magnetometers (Zonge Engineering ANT-4) located at five sites, namely, Lithuania, Boulder Creek, CA, USA, the eastern province of Saudi Arabia and the north island of New Zealand. All of those devices are part of the Global Coherence Monitoring Network [28]. Two magnetometers are positioned in the north–south and east–west axes at each site in order to measure the time-varying magnetic field strengths (sensitivity 1 pT) over a wide frequency range (0.01–300 Hz) while maintaining a flat frequency response. The sampling rate of each magnetometer is 130 Hz. The magnetic field intensity data is captured by data acquisition infrastructure, stamped with the global positioning system time, and transmitted to a common server. As mentioned previously, the groups of participants are located not far (up to several hundreds of kilometers) from the sites where the magnetometers are installed. Such a proximity does help to ensure that local magnetic field data registered by the magnetometers does correspond to actual fluctuations of the magnetic fields at the sites of the experiment [28].

2.4. Heart Lock-In Procedure

On 5 March, each group met in person at each location and all groups simultaneously participated in the Heart Lock-In (HLI) technique for a 15-min period.
A group Skype call was set up in order for the groups to feel more connected with each other. The steps to the HLI technique were read so that all the group members could hear them over the computer’s speakers. The HLI technique focuses on building the capacity to sustain heartfelt positive emotions [37]. The steps of HLI read [38] (p. 126):
“Step 1: Focus your attention in the area of the heart. Imagine your breath is flowing in and out of your heart or chest area, breathing a little slower and deeper than usual.
Step 2: Activate and sustain a regenerative feeling such as appreciation, care or compassion.
Step 3: Radiate that renewing feeling to yourself and others.”
Use of this technique is typically accompanied by feelings of peacefulness, harmony, and a sense of inner warmth, and is often an effective means to diffuse accumulated stress and negative feelings and has been shown as a reliable method of increasing heart rhythms coherence [37].

2.5. Computation of the Power of the Local Magnetic Field

The spectral power of the local magnetic field was computed using the magnetic field intensity values and applying the algorithm denoted in [11] as Algorithm A. The main steps of the algorithm included the computation of the spectrogram of the magnetic field intensity for consecutive one-second time intervals, determining a spectrum amplitude and summing the spectral power values in the frequency range between 0.2 and 3.5 Hz, which we have defined as the ULF power in previous studies [11,23,24].
The magnetic field spectral power time series at each site was then filtered to remove transit noise due to lightning, human-made sources, etc. with a Hampel since it filters the noise with much less distortion of low-level signal dynamics as compared to classical median filter approaches [39,40,41,42,43]. This procedure replaces the value in a data window with the median if it differs from the median by more than three standard deviations. The optimal size of the data window for the Hampel filter was derived as follows: Local magnetic field spectral power time series were filtered using data windows of sizes from 2 to 24 h, i.e., from S 1 = 7200 up to S 86 , 340 = 86,400 elements. Note that the spectral power data series corresponded to 11 days. At some sites, the noise was continuous over relatively long intervals due to lightning storms; therefore, a wide filtering data window was necessary to remove outliers from the spectral power data. The difference between standard deviations of filtered and non-filtered data Δ σ i = | σ i σ n f | , i = 1 , , 86,340 was computed for each data window, thus obtaining the discrete function Δ σ i that estimates the influence of different size data windows on the filtering effect. The discrete derivative of the obtained function D i = Δ σ i Δ σ i 1 , i = 2 , , 86,340 was calculated in order to estimate the difference in filtering results for consecutive data windows (see Figure 1). The discrete derivative D i was smoothed using a moving average technique in order to obtain the function D i ^ describing slow dynamics of the derivative (Figure 1).
The degree of tolerance used in this study was set to ε = 0.01 . Thus, the optimal size of the filtering data window was selected as the maximal data window satisfying D i ^ > ε . It can be observed from Figure 1 that the optimal length filtering data window corresponding to such criteria is 36,000 elements, i.e., 10 h of local magnetic field spectral power data. This procedure was used for the computation of the spectral power at the magnetometers located in California, Lithuania, New Zealand and Saudi Arabia. As there was not a magnetometer site located in the United Kingdom, Lithuania’s magnetic field data was used for the analysis of the UK participants.

2.6. Synchronization between Participants’ HRV and Earth’s Magnetic Field

In order to assess the degree of synchronization between groups’ HRV and local magnetic field spectral power (computed as described in previous subsection), techniques proposed and validated in [11,44] were employed. The key concept of the applied approach is the existence of such mapping that allows to reduce data signal to one integer characterizing the dynamical properties of the analyzed series from the geometrical perspective. Namely, the integer corresponds to the time lag value that maximizes the area of the attractor reconstructed from the analyzed signal.
The procedure denoted in [11] as Algorithm C was slightly modified in order to yield a single scalar value corresponding to the synchronization between analyzed data signals. The short outline of the modified algorithm is presented below.
Consider two synchronously sampled data series R R   =   R R 1 , , R R n and M   =   M 1 , , M n corresponding to participant’s HRV (RR) and local magnetic field (M) spectral power, respectively.
  • Data signals RR and M are divided into T 5-min-long observation windows (according to HRV analysis standards) [36] and optimal time lag values are computed for each observation window (using the procedure presented in [11] and summarized above) for HRV time series τ * ( R R )   =   τ * 1 ( R R ) , , τ * T ( R R ) and magnetic field spectral power data signal τ * ( M )   =   τ * 1 ( M ) , , τ * T ( M ) . This procedure maps RR and M data series to integer vectors, describing dynamical and geometrical properties of those series.
  • Obtained optimal time lag vectors are smoothed via the computation of moving average in order to identify averaged changes in time lags for HRV τ ¯ * ( R R ) and magnetic field data τ ¯ * ( M ) . The size of the observation window used for the moving average is 20 data points.
  • Pearson correlation coefficient C ( R R , M )   =   ρ τ ¯ * ( R R ) , τ ¯ * ( M ) is calculated between averaged optimal time lag vectors. Resulting value C ( R R , M ) is considered as the degree of synchronization between analyzed HRV and magnetic field spectral power signals. Naturally, higher value of C ( R R , M ) corresponds to a higher degree of synchronization and vice versa ( C ( R R , M ) [ 1 , 1 ] ). Note that the assumption of the normality of data series used in further analysis was verified.
Let R R ( k )   =   R R 1 ( k ) , , R R n ( k ) , k   =   1 , , K is a set of HRV data signals, where R R ( k ) corresponds to k-th participant from one of the considered countries. The mean synchronization between groups’ HRV and respective magnetic field spectral power signal is calculated as the mean correlation coefficient C ( R R ( 1 K ) , M )   =   1 K k   =   1 K C ( R R ( k ) , M ) , where C ( R R ( k ) , M ) is the synchronization between k-th participant’s HRV and magnetic field data signals computed via the procedure described above.

2.7. Statistical Analysis

The following statistical tests are used in the further study in order to evaluate the statistical significance of the obtained results:
  • Pearson correlation significance test (Null Hypothesis H 0 : C ( R R ( 1 K ) , M )   =   0 ) is used in order to assess the statistical significance of the synchronization between participants’ HRV and Earth’s magnetic field obtained via the technique described in previous subsection.
  • The Repeated Measures design is used with multiple measures of the same variable taken on the same subjects under different conditions or at two or more times. The assumption of sphericity was tested using Mauchly’s Test of Sphericity, any violations of the assumption that occurred are noted in the results tables along with their correction procedure. When used, post hoc multiple comparison tests were corrected with the Bonferroni test that adjusts the observed significance level for the fact that multiple comparisons were made. In this study, Repeated Measures ANOVA was used to examine differences in the mean LMF-HRV-correlations over time. It was also used to test for differences in HRV coherence, and heart rhythm synchronization before, during and after practice of the Heart Lock-In technique.

2.8. Analysis of Synchronization between Participants’ HRV and Local Magnetic Field Power

Procedures for the analysis of synchronization between participants’ HRV and local magnetic field (LMF) power time series, described in previous sections, were applied separately for each location since local magnetic field power was different for each country. Since the HLI took place for a 15-min period at 17:00 p.m. (UTC time), on 5 March 2015, we calculated participants’ LMF-HRV-synchronization over an 11-day period between 28 February and 11 March. In this study, the “day” is defined as a 24-h period starting at 17:00 p.m. as this is the time of the Global Heart Lock-In. This provided a 5-day period before, the day of and 5-days after the HLI day in order to compare the synchronization between participants’ HRV and magnetic field activity on the day of the HLI to the days before and afterwards.

3. Results

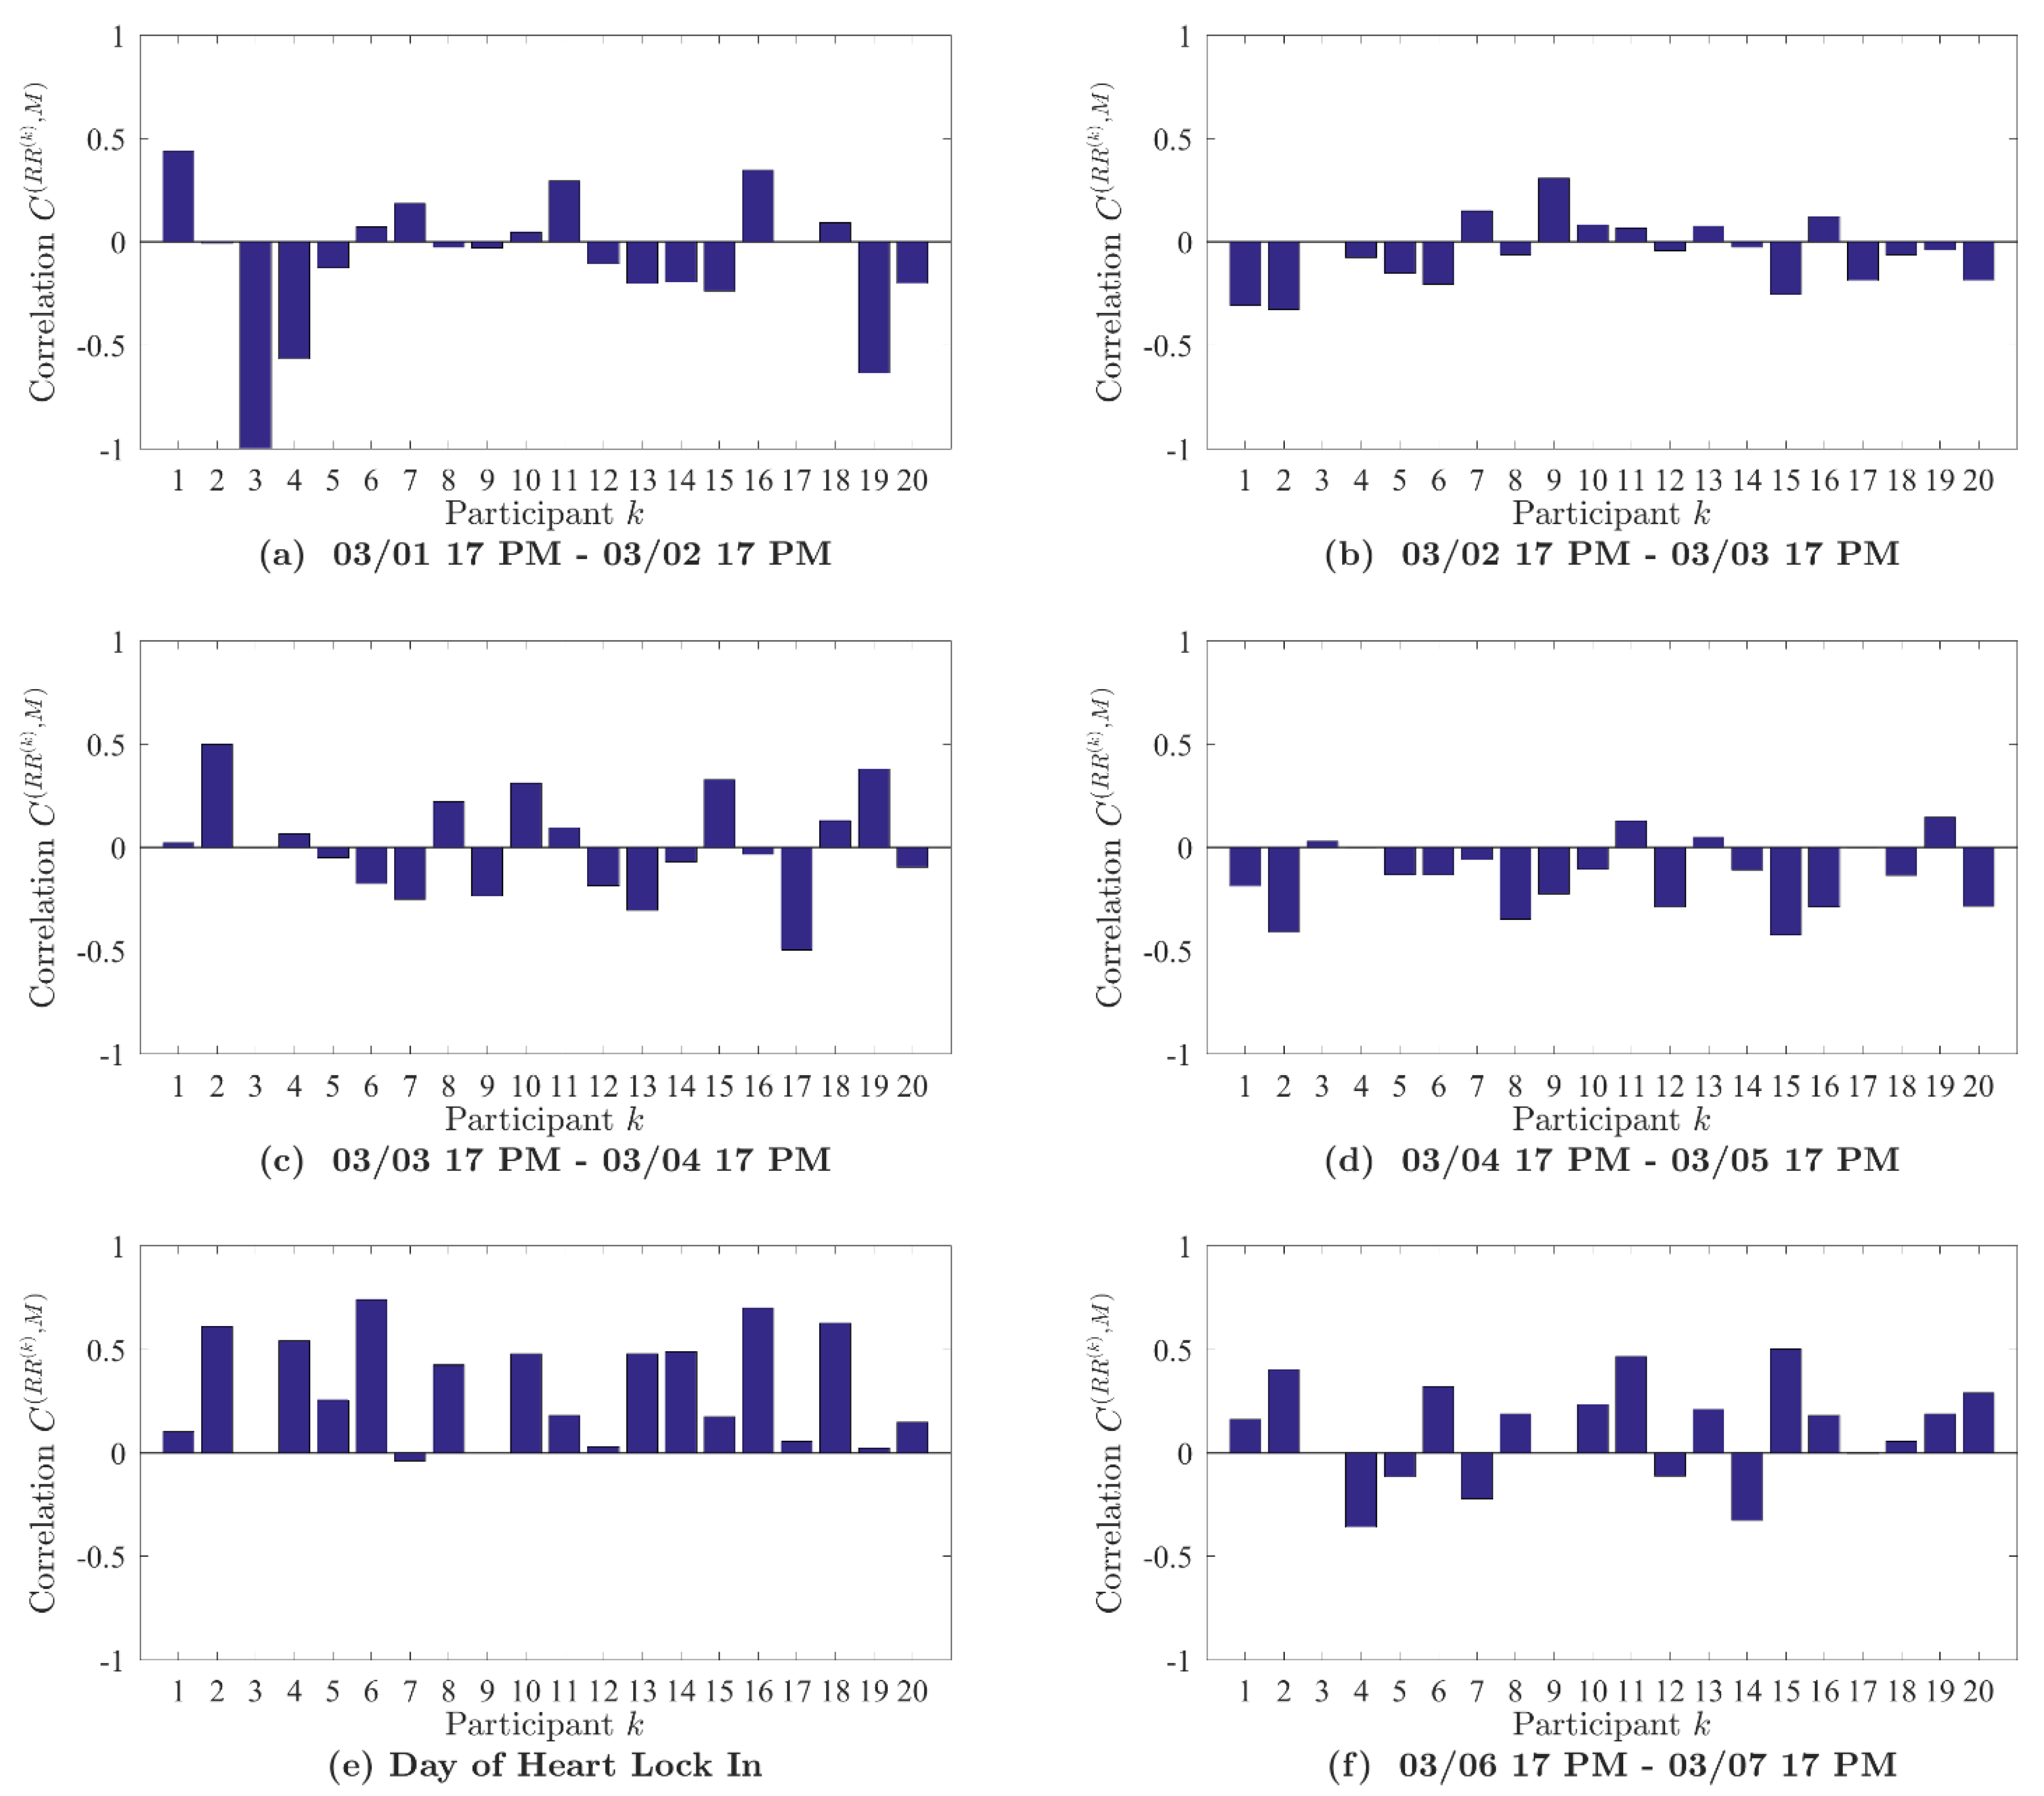
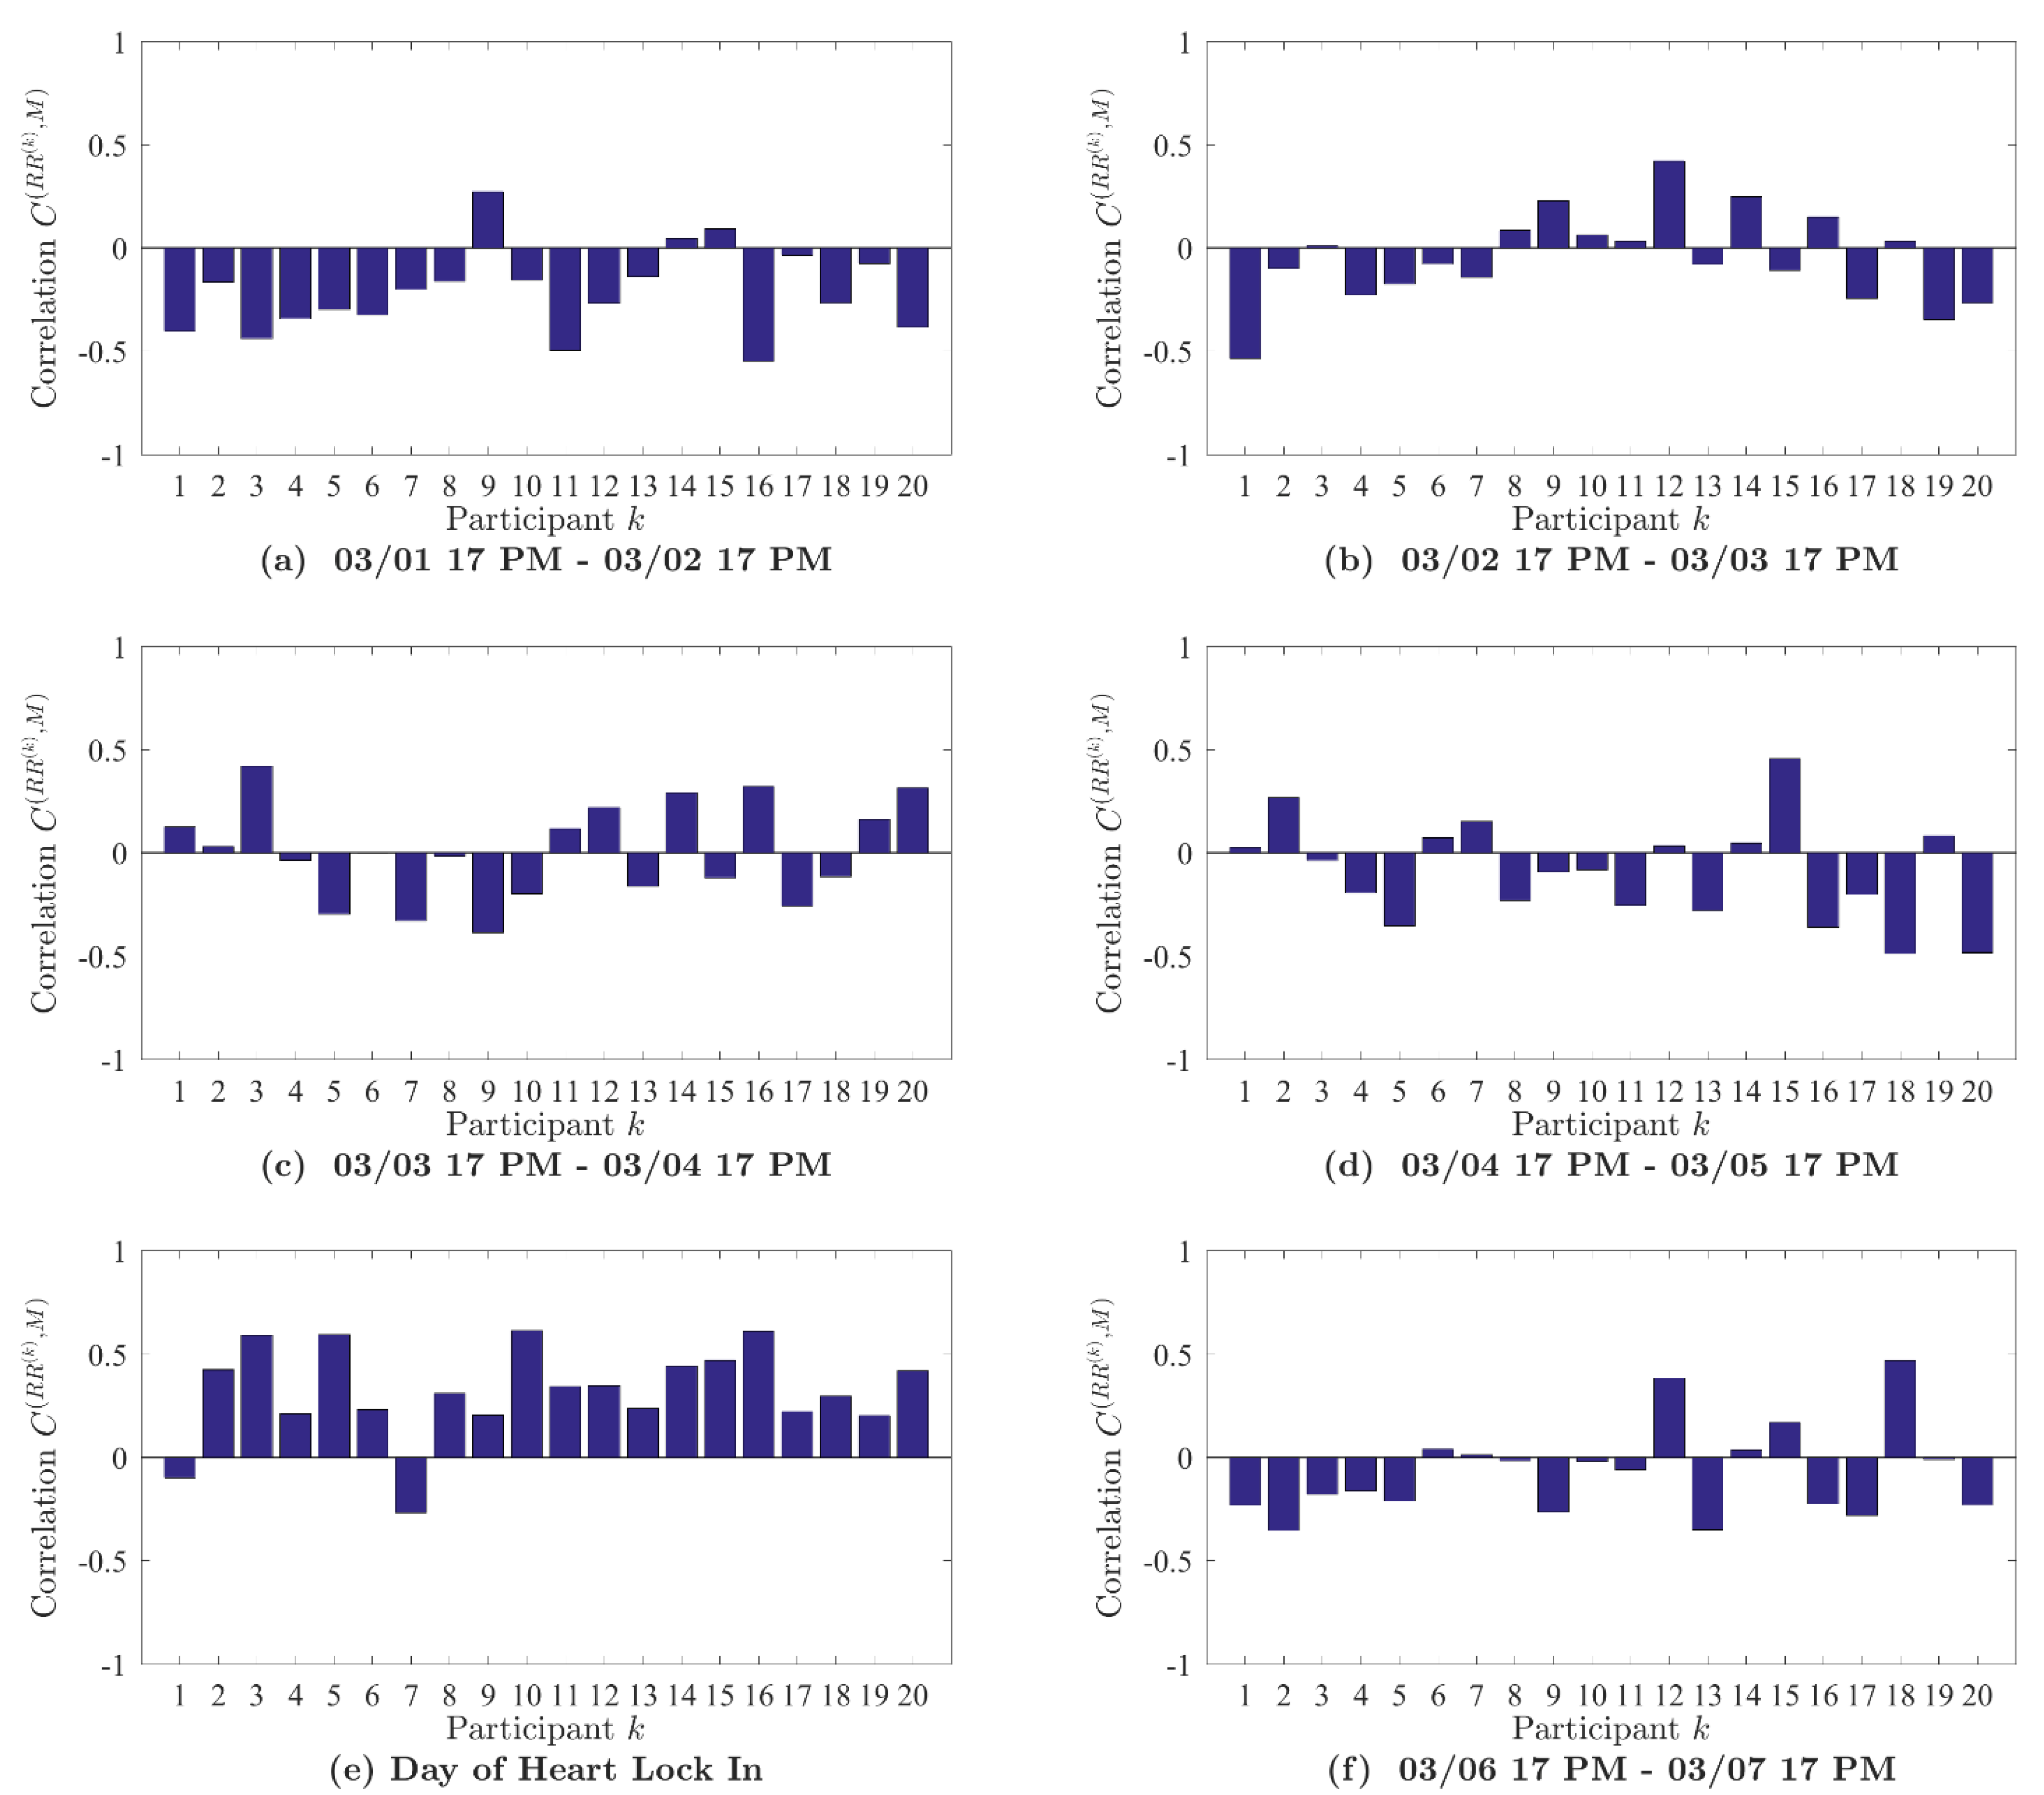
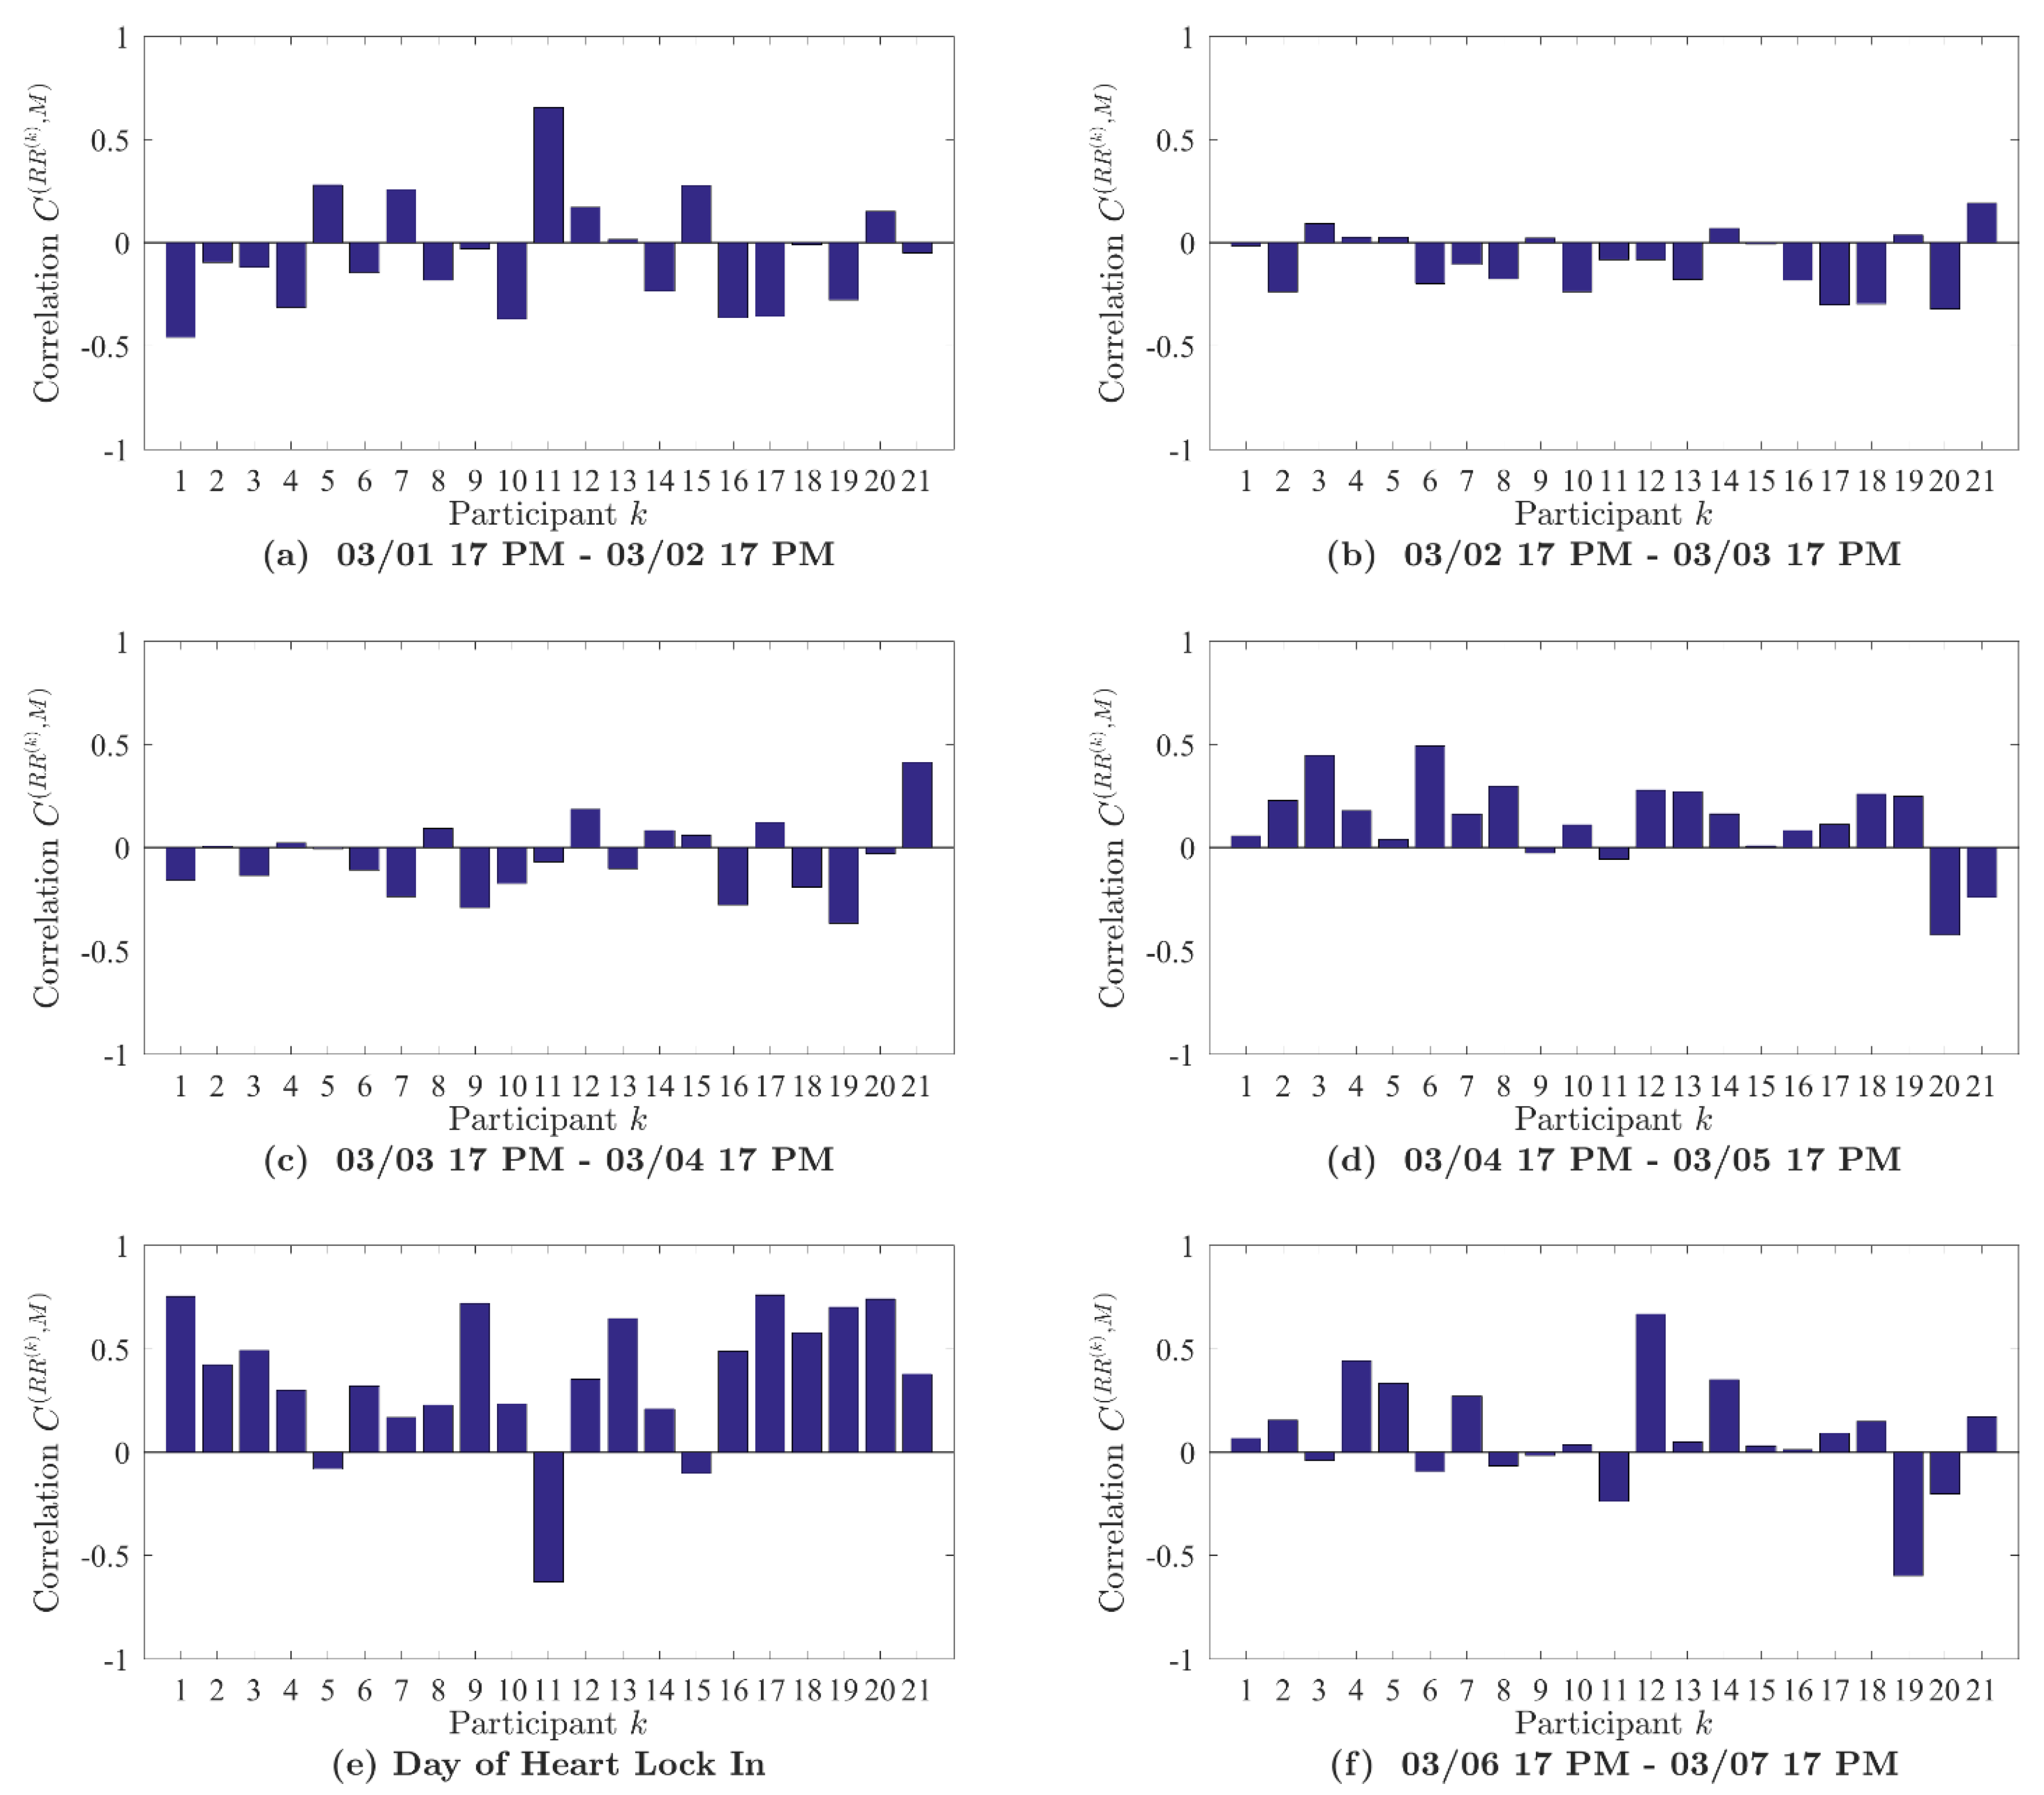
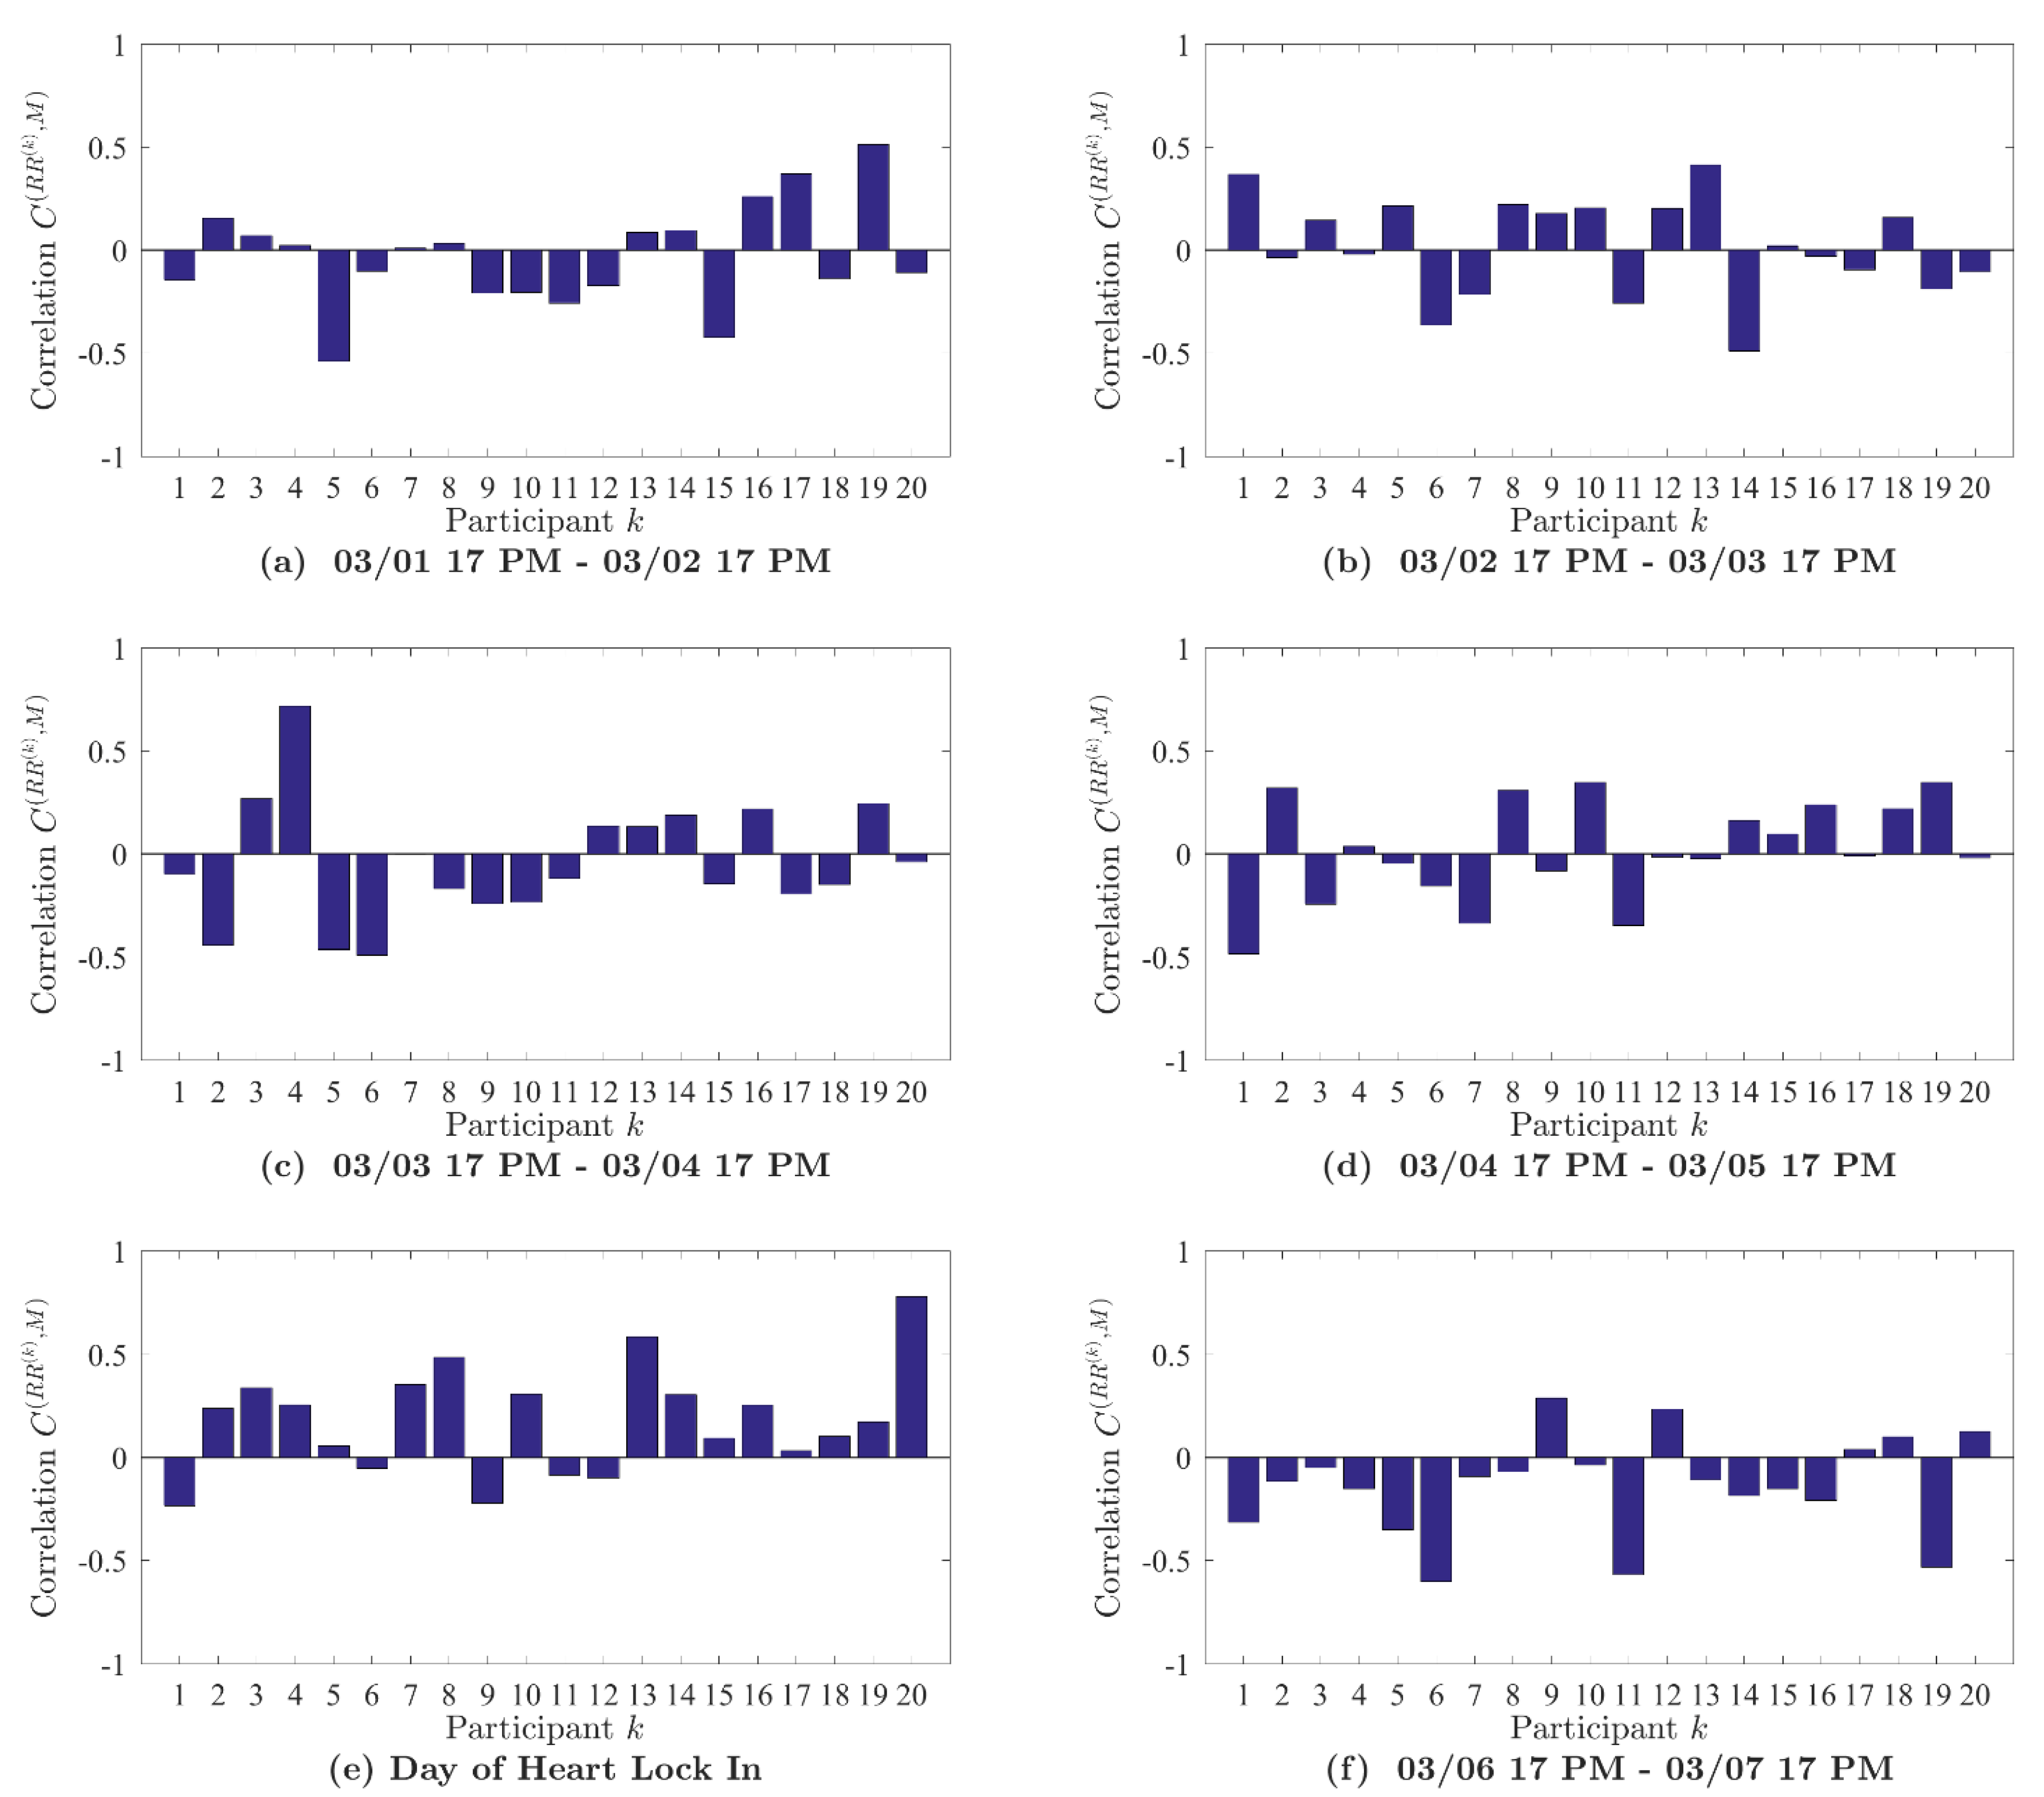
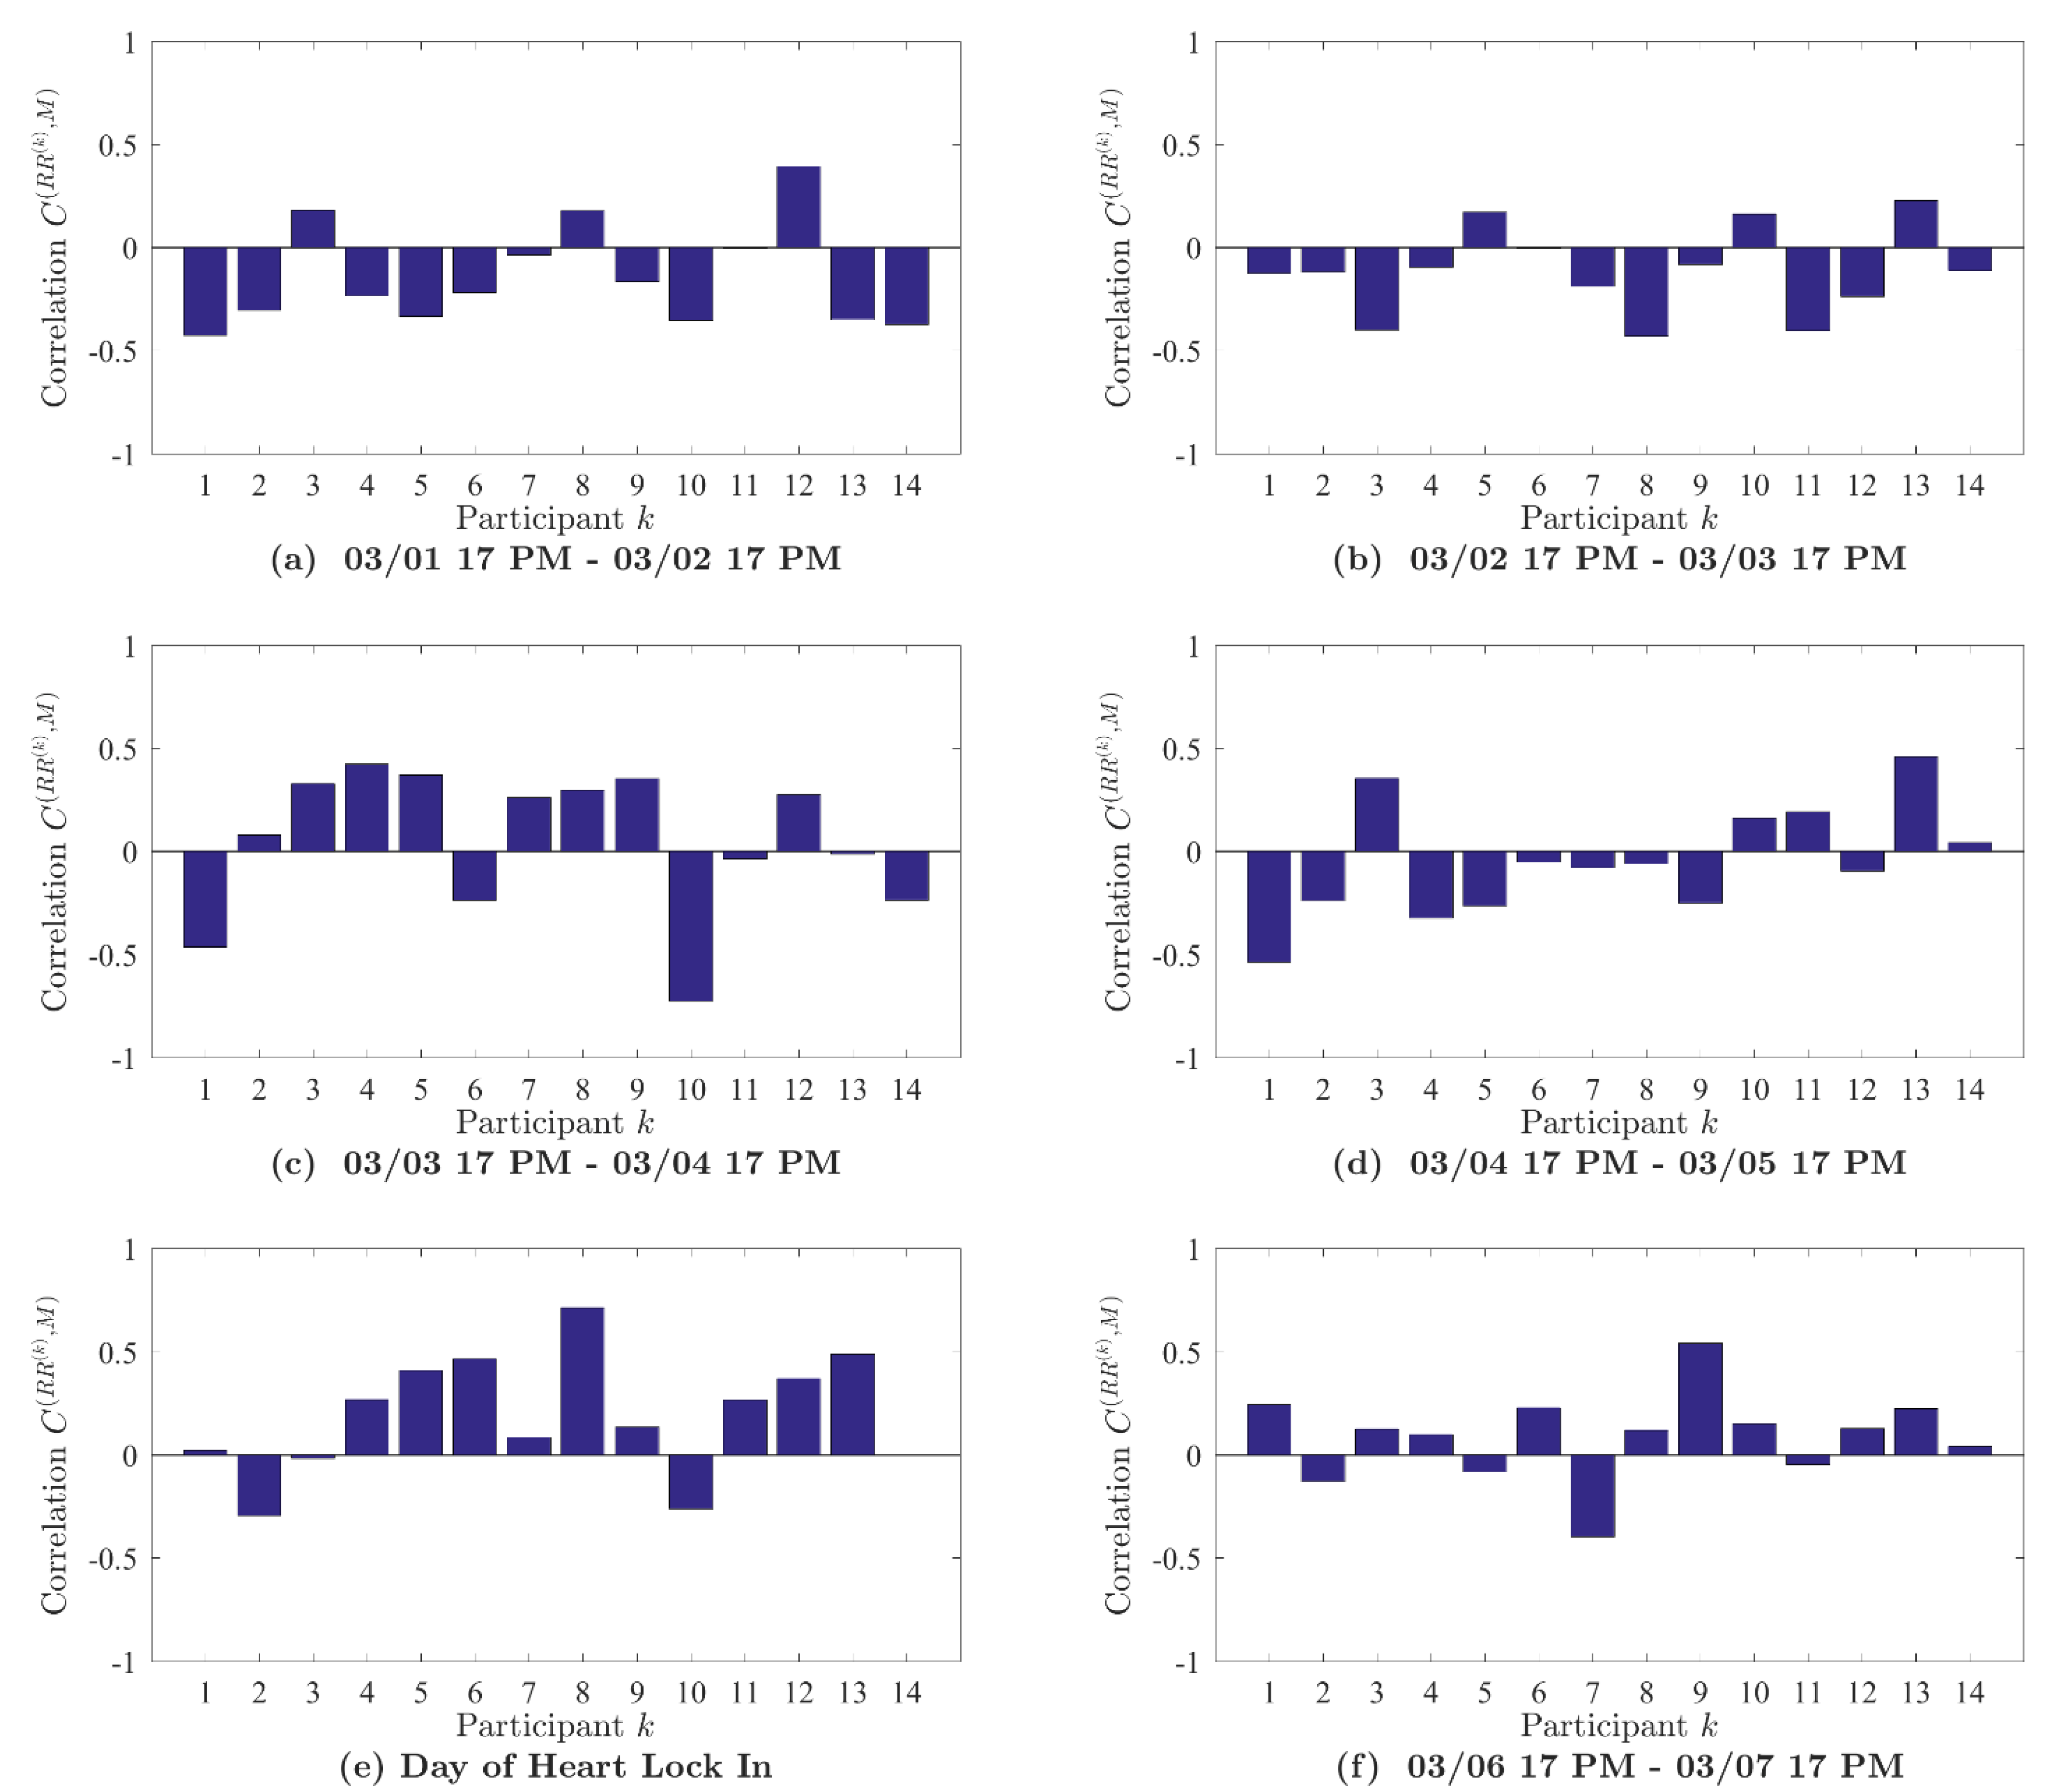
Figures, showing the LMF-HRV-correlations at individual level across a six-day period are displayed in Appendix A.
A repeated measures analysis of variance (ANOVA) was performed in order to determine the statistical significance of the differences between the correlations. The repeated measures ANOVA examines the mean difference within subjects across 10 days of the experiment (28 February–11 March).
Knowing that there were regional differences in the LMF we first tested LMF-HRV-correlation coefficients for all participants to see if they differed by location over the 11-day study period. Using Repeated Measures ANOVA significant differences were found between participants at the five different location groups over the 11-day study period (Day * Location, p < 0.001 ). Given this finding the initial desire to test all participants together as one group became inappropriate and was abandoned.
Next, we performed a repeated measures ANOVA separately for each of the groups at each location. Significant differences in the mean LMF-HRV-correlations were found between days for each group as shown in Table 2. Note that since one of the objectives of the study was to observe the effects of the applied Heart Lock-In procedure, individuals whose HRV data corresponding to the Heart Lock-In time period was either missing or too noisy were excluded from the further study.
Statistical significance of the mean synchronization between participants’ HRV and LMF activity was analyzed using the Pearson correlation significance test. p Values yielded by the test are displayed in Table 3. It can be noted that mean LMF-HRV-synchronization on day 6 (HLI day) was significantly different from zero for all five groups.
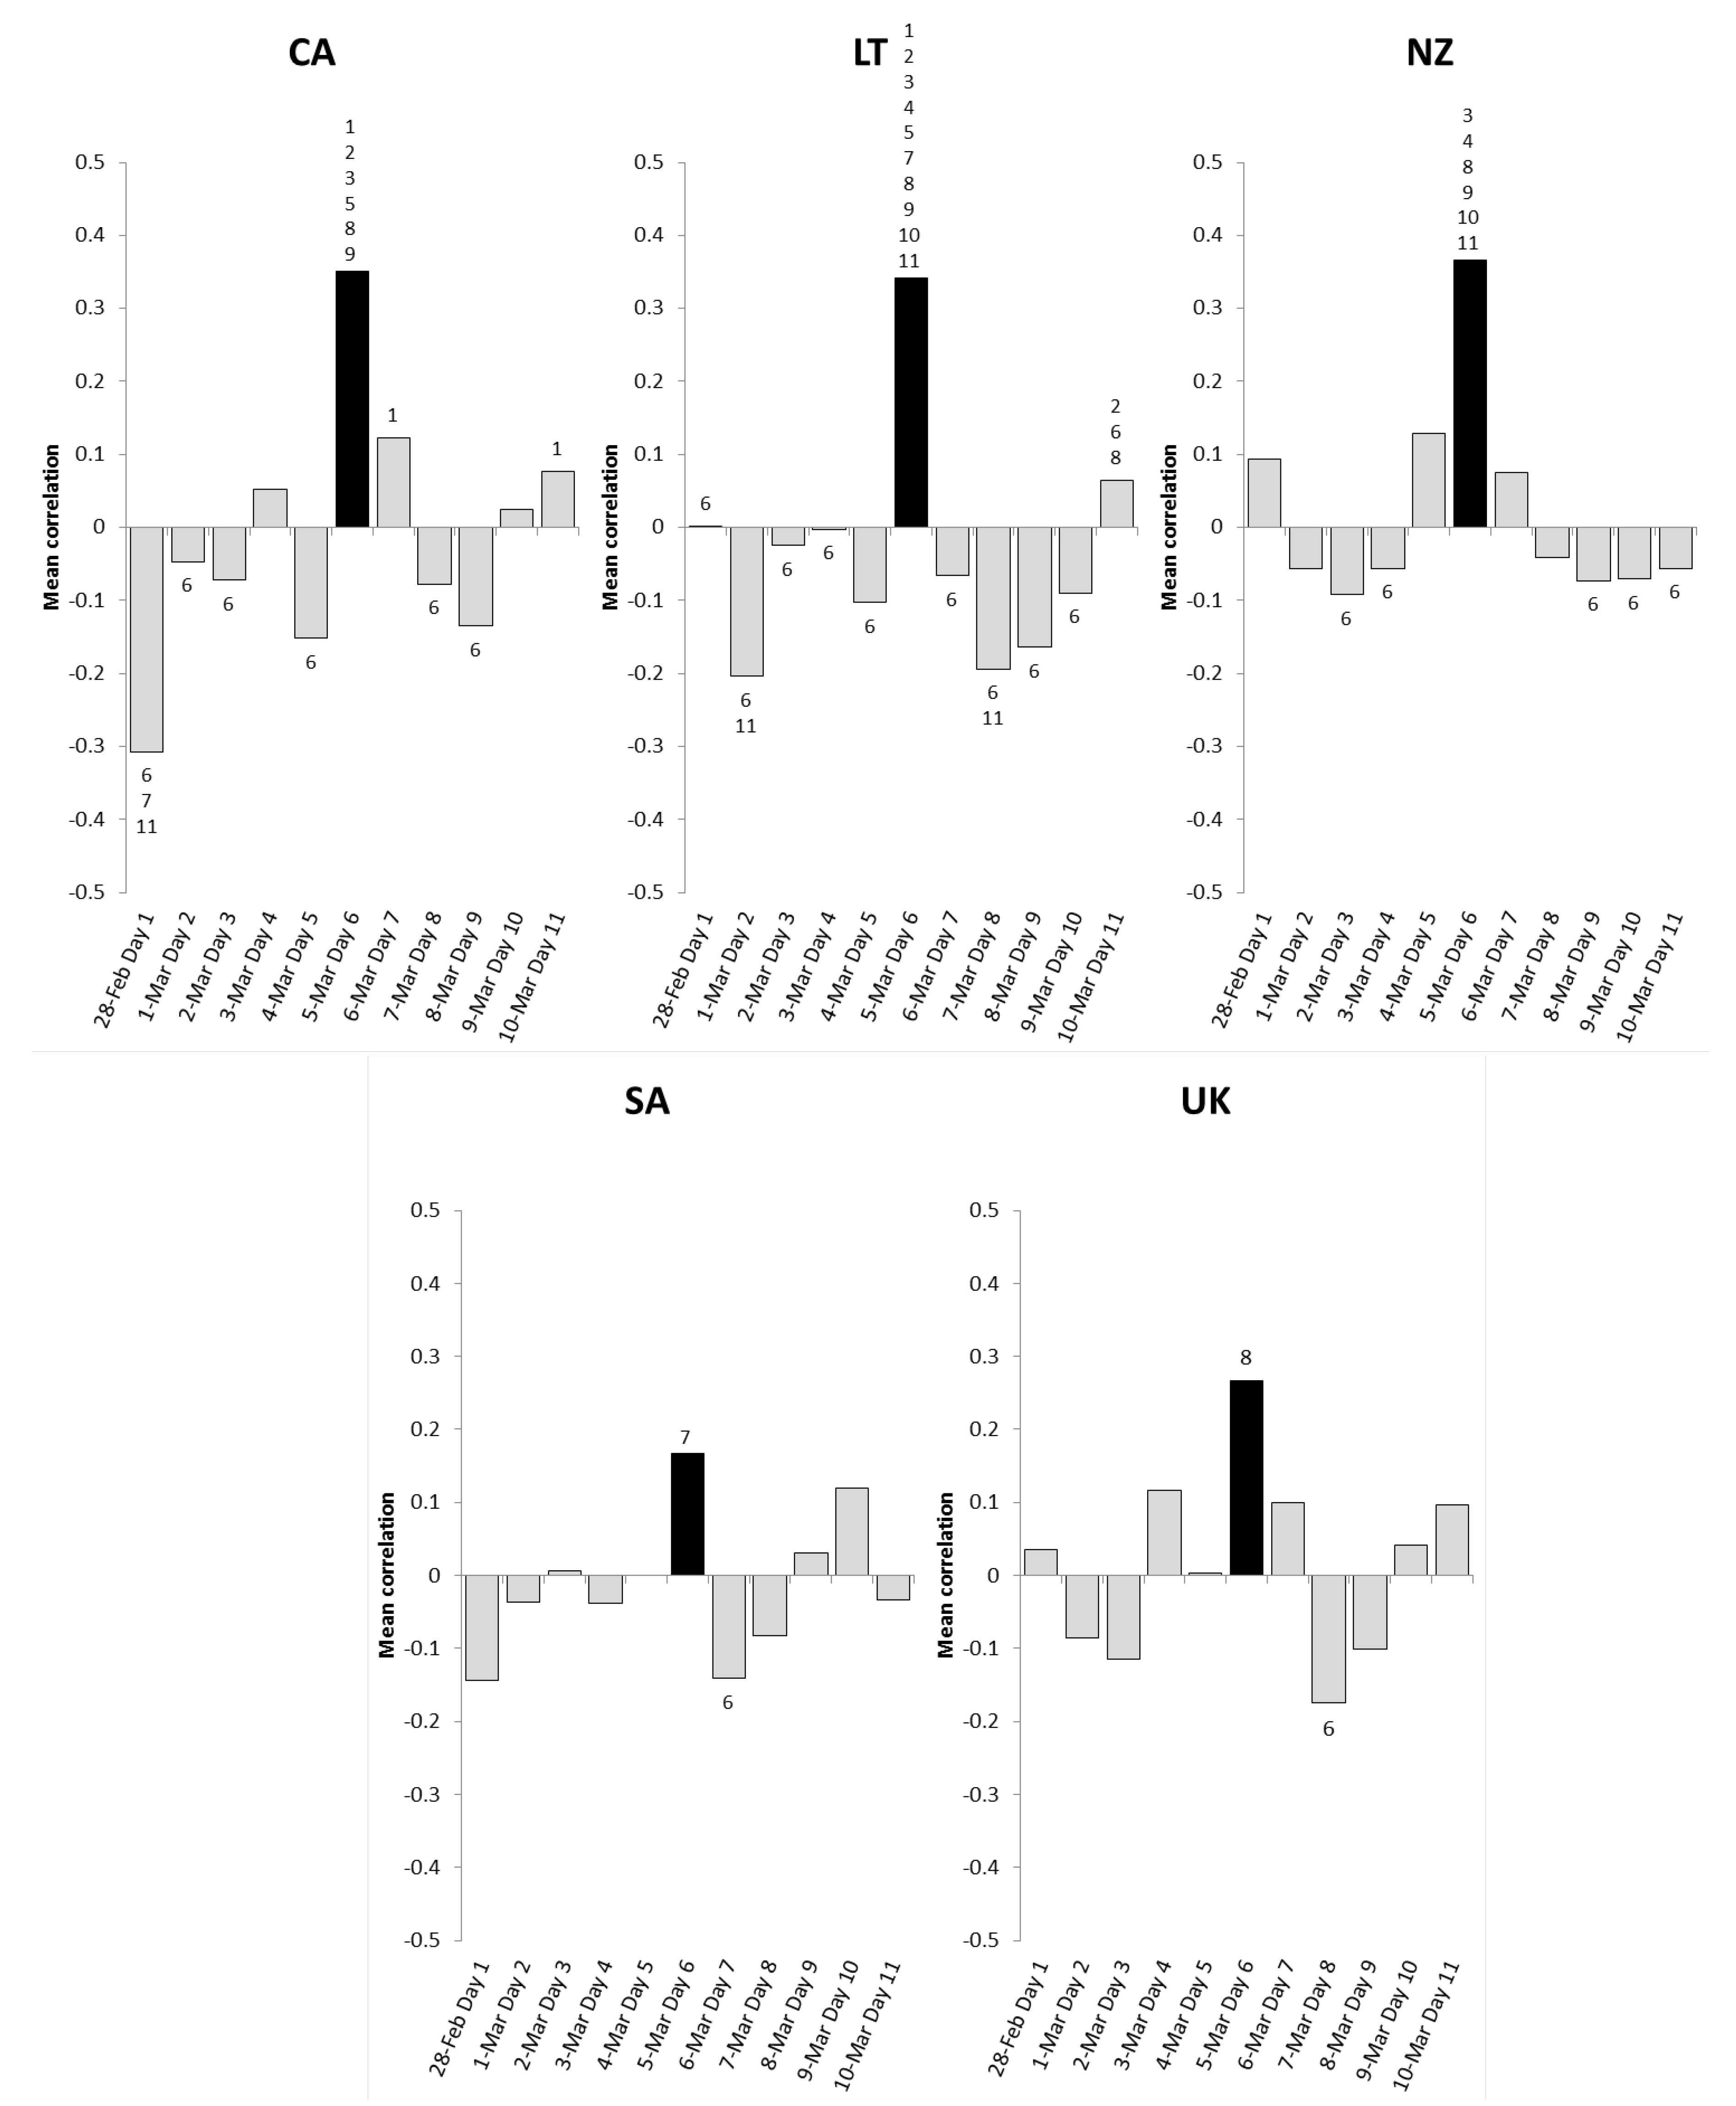
Post hoc tests for all pairwise comparisons between days for each group location are shown in Figure 2 and Figure 3 and Table 4, Table 5, Table 6, Table 7 and Table 8.
As shown in Figure 3, in the Lithuania group, day 6 (HLI day) was significantly different to all other days in the study period. Day 11 was different from three of the other days (including day 6). In terms of significant differences between days, the California and New Zealand groups were next with the HLI day (day 6) being significantly different from six of the other days. Day 6 was also significantly different than day 7 in the Saudi Arabia group, and day 6 was significantly different than day 8 in the UK group.
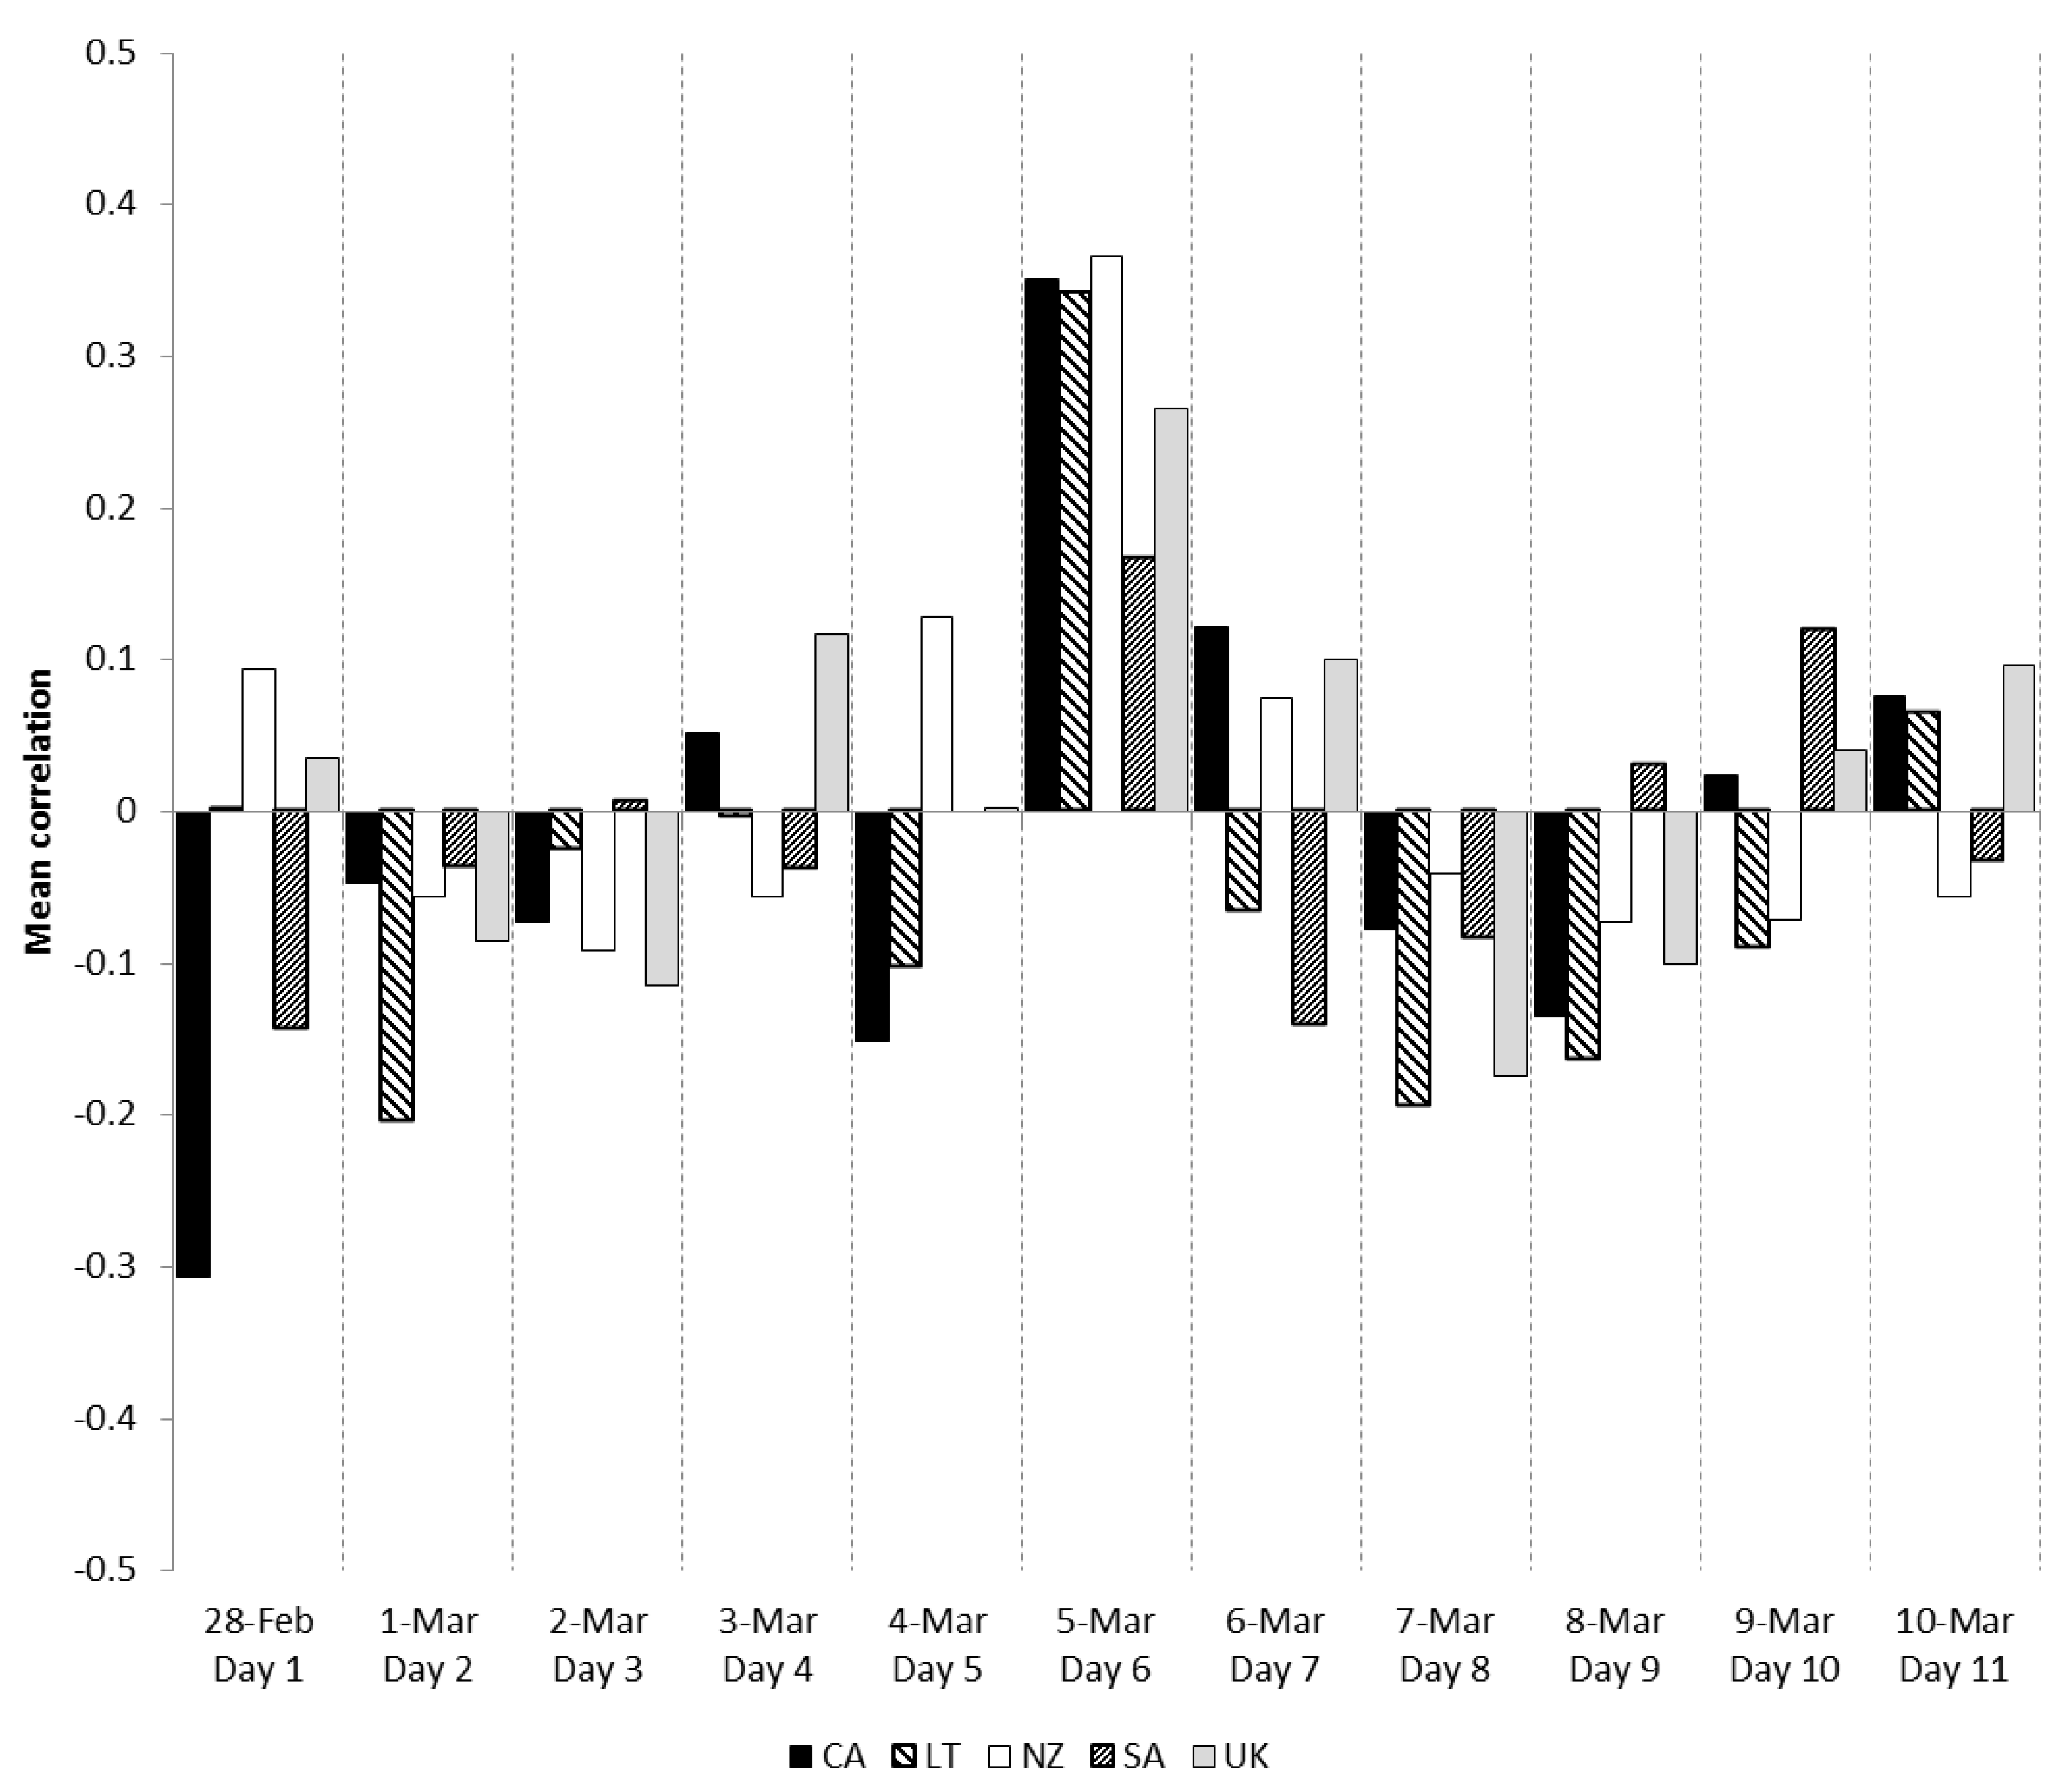
The pattern of differences can be seen most clearly in Figure 2. Intriguingly, the only day of study period where all the groups HRV was positively correlated with the LMF was on the day 6, which was the day of the HLI and the correlations between the HRV and LMF for all the groups was substantially higher on that day.

3.1. Analysis of Heart Rhythm Coherence during the Heart Lock-In

In order to assess the changes in heart rhythm coherence of the participants within each group before, during and after the HLI, a mean HRV coherence score was calculated for each participant. A coherent heart rhythm is defined as a relatively harmonic (sine wave-like) signal with a very narrow, high-amplitude peak in the low frequency region (typically around 0.1 Hz) of the power spectrum with no major peaks in the other bands [45]. Coherence was assessed by identifying the maximum peak in the 0.04–0.26 Hz range of the HRV power spectrum from all 1 min segments of the HRV time series, calculating the integral in a window 0.030 Hz wide, centered on the highest peak in that region, and then calculating the total power of the entire spectrum. The normalized coherence ratio is formulated as: (Peak Power/Total Power). A number of studies have shown that emotional states tend to be reflected in the patterns of the HRV rhythm independent of changes in the amount of HRV (quantity characterizing the variability in the measurements of inter-beat intervals), although emotional state related changes in the amount of HRV can also occur [45,46,47]. Heartfelt positive emotions are associated with a more coherent rhythm, as opposed to emotions such as impatience, anxiety, and anger [46,47,48].
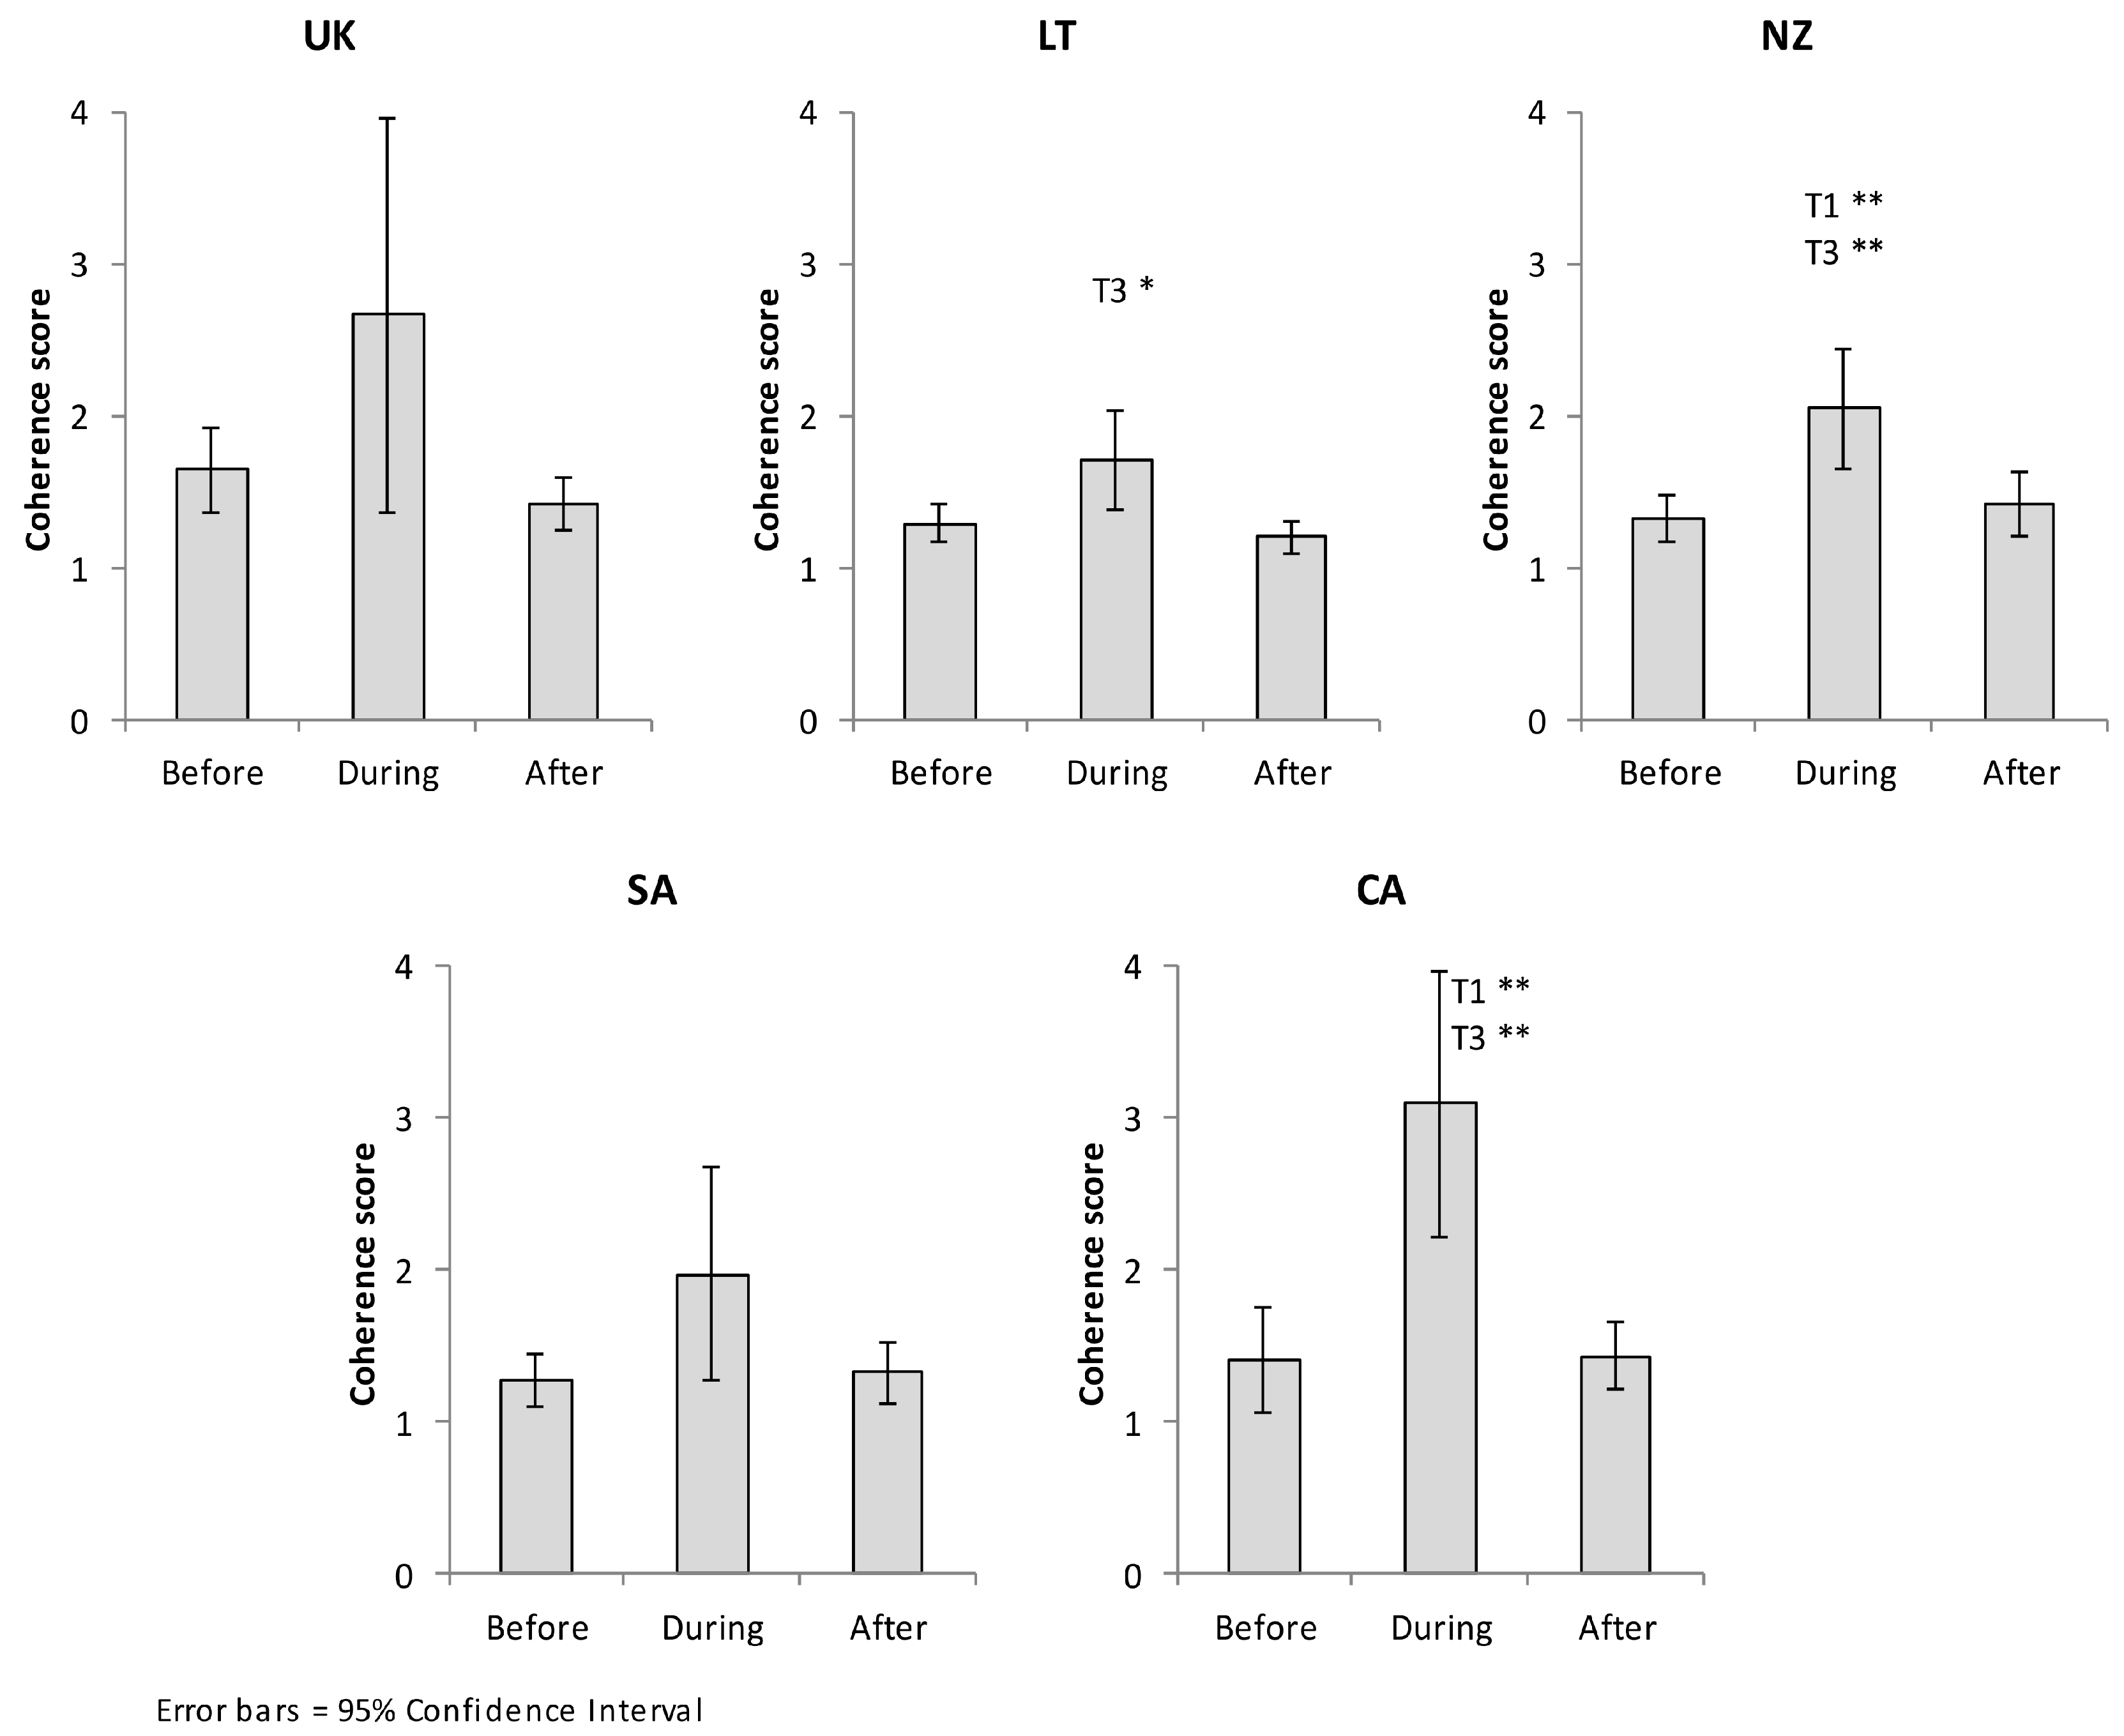
A coherence score below one is considered as low coherence, scores between one and two as medium, and scores above two as high levels of coherence. With practice using the HLI technique, individual coherence scores are typically in the 3 to 6 range. The results of a repeated measures ANOVA test of within-subjects effects is shown in Figure 4 and Table 9.
The California and New Zealand group members’ HRV coherence was significantly higher during the HLI period than before (p < 0.01) and after (p < 0.01) the HLI period. In the Lithuanian group, the HRV coherence was significantly higher during the HLI period than the period after it (p < 0.05). There were no significant differences between the three periods in the UK and Saudi Arabia groups HRV coherence although there was a trend of increased coherence during the HLI period, and likely did not reach significance due to the low number of participants (9 and 11, respectively) that had usable data during all three periods.

3.2. Analysis of Pairwise HRV Synchronization between Group Members

In order to assess the pairwise heart rhythm synchronization among participants within each group before, during and after the Heart Lock-in period, we employed a similar chaotic attractor embedding technique which is described in [24]. Using this technique, an approximately 300 data point long series of each participant’s HRV was used for each optimal time lag value. Each period was 15-min long, which corresponded to 1800 data points. After the application of this algorithm on each participant’s HRV data, we obtained six optimal time lag values for each 15-min period, before, during and after the HLI.
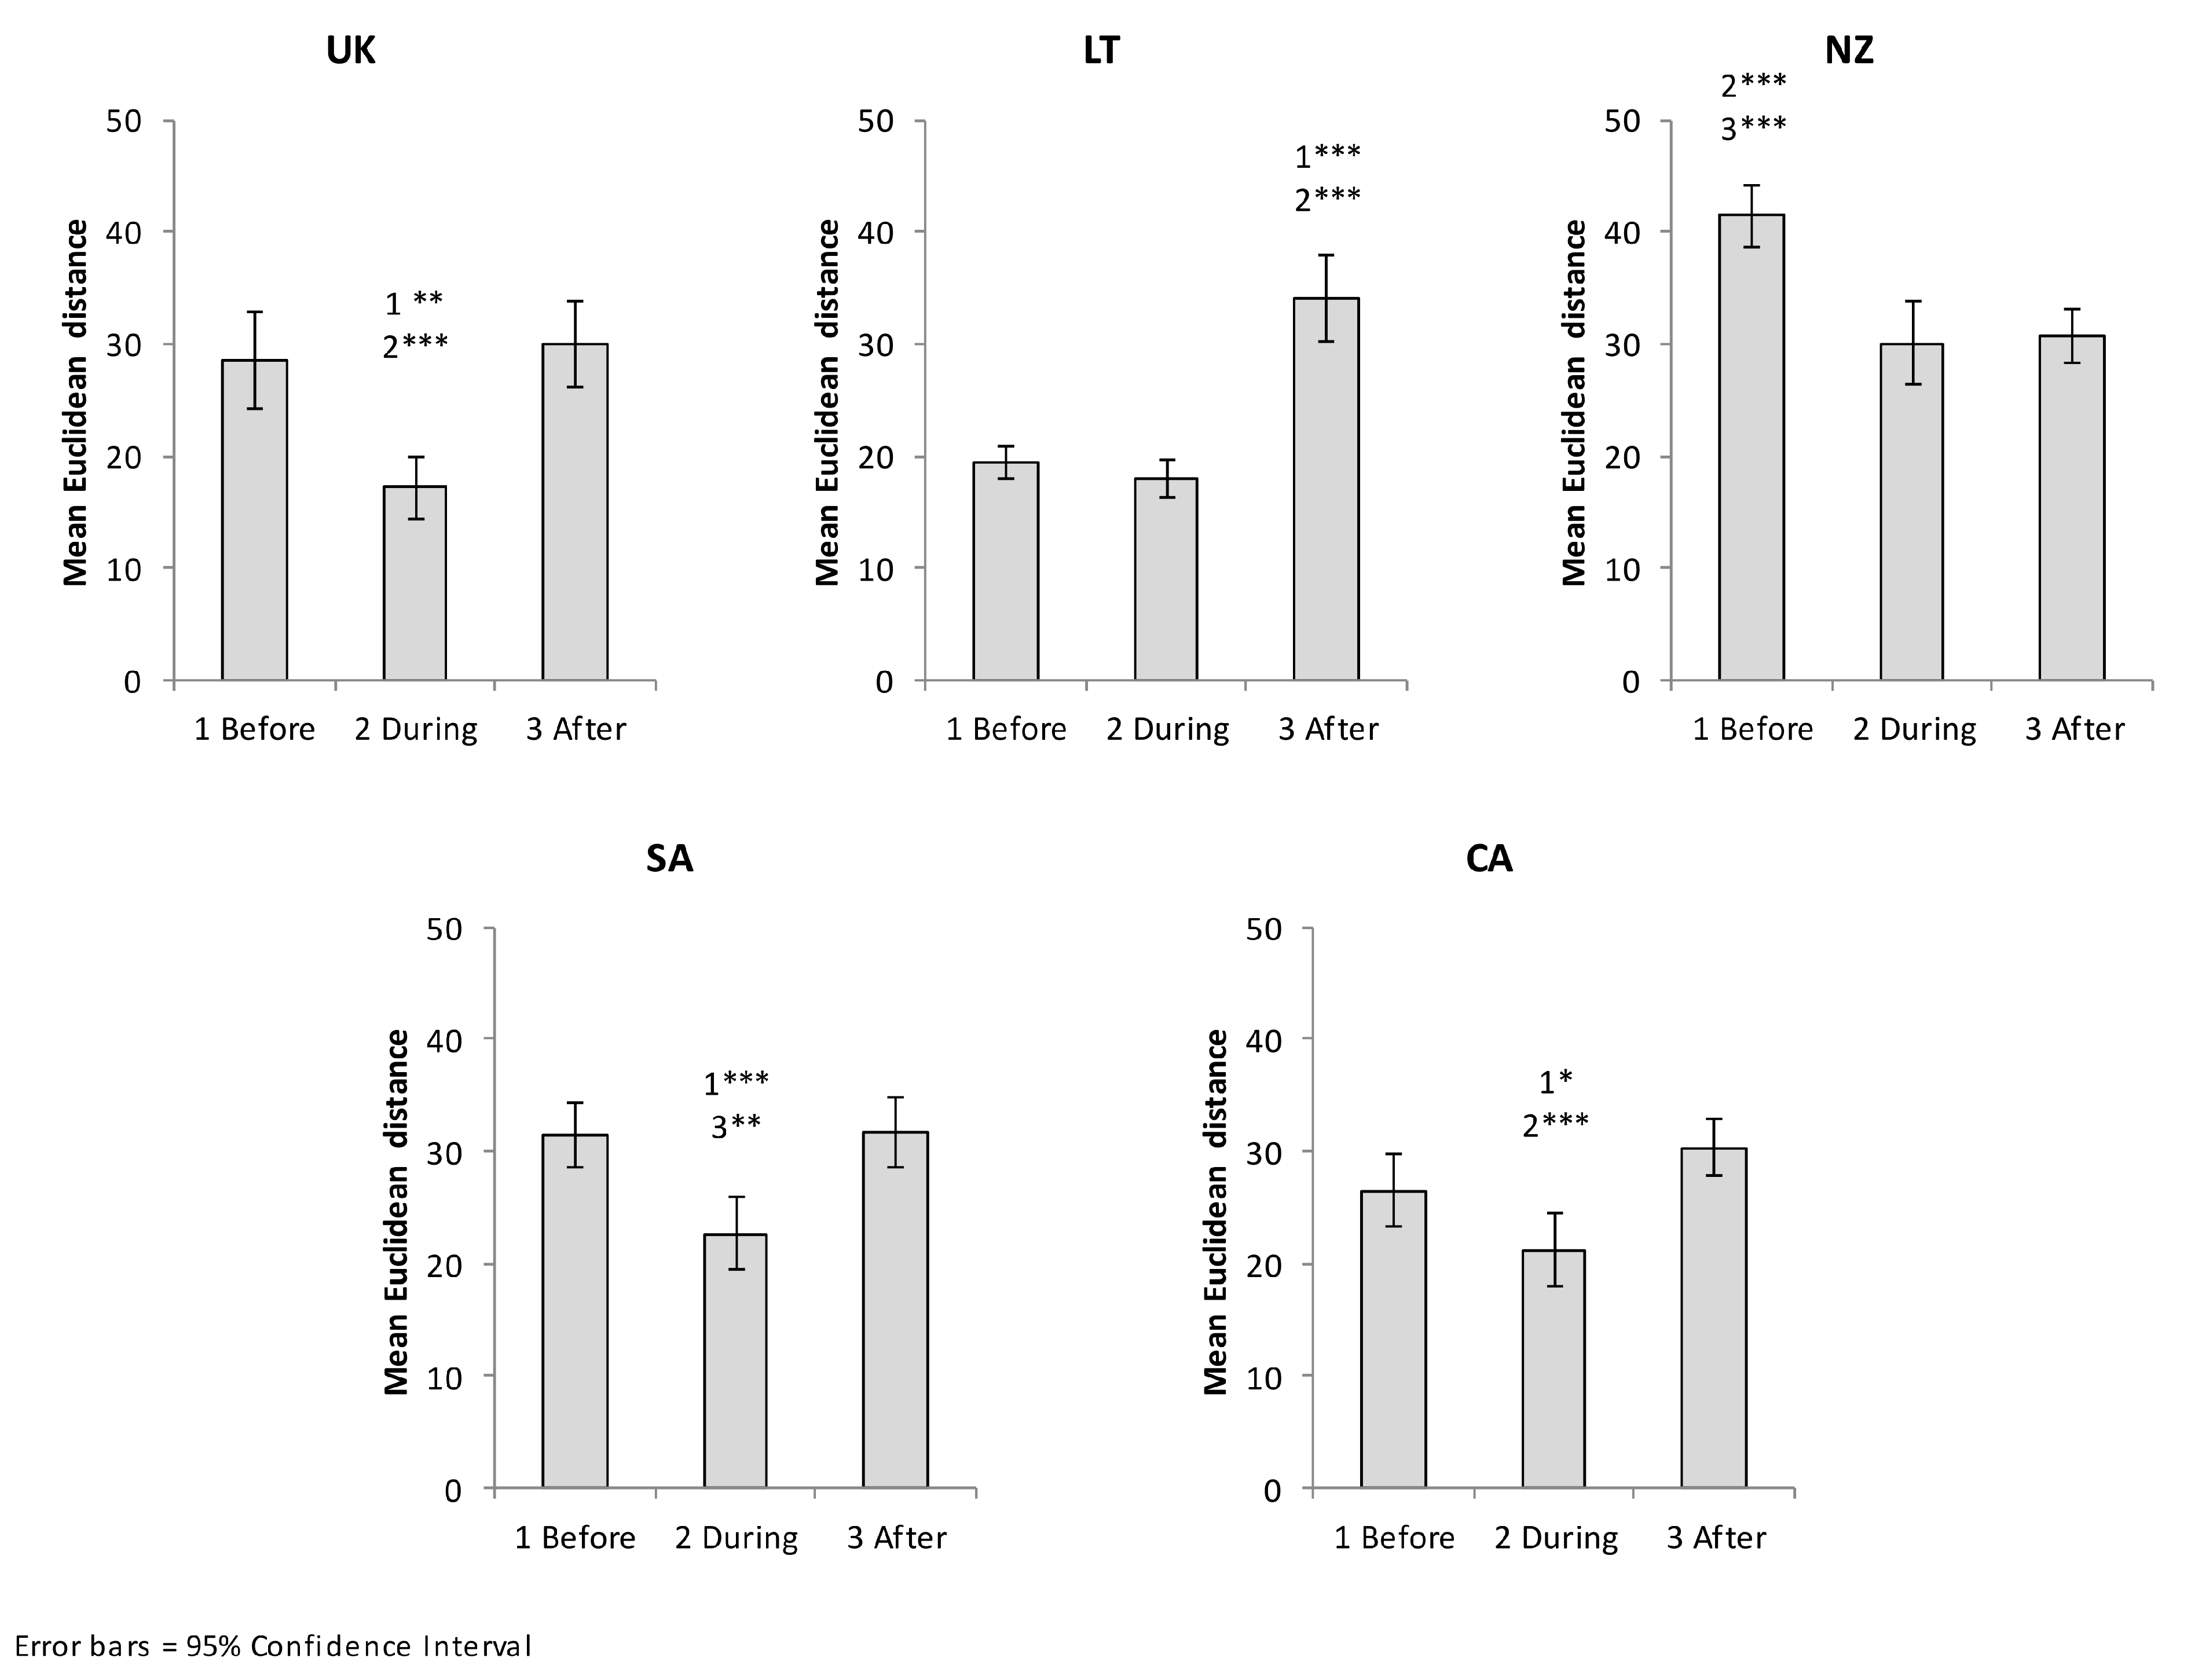
The sequences of optimal time lag values for all participants from each group, for each time period, were analyzed separately. In order to assess the pairwise heart rhythm synchronization between participants’, we computed the Euclidean distance of the optimal time lag vectors of each participant to all other participants in their group and calculated the average distance for all participants. The lower the mean Euclidean distances, the higher the level of pairwise synchronization. Figures, corresponding to individual HRV pairwise synchronization results for each of the groups before, during and after the Heart Lock-In (HLI) are displayed in Appendix B. The results of a repeated measures ANOVA test of within-subjects effects are shown in Figure 5 and Table 10.
The California group members’ heart rhythms were significantly more synchronized with each other during the HLI period than before (p < 0.05) and after (p < 0.001) the HLI period, and the same pattern was found in the UK group, (p < 0.01 before), (p < 0.001 after), and the Saudi Arabia group (p < 0.001 before), (p < 0.01 after). In the Lithuania group, the members HRV rhythms were significantly more synchronized before (p < 0.001) and during the HLI as compared to the period following it (p < 0.001). In the New Zealand group, the heart rhythms among the group members was more synchronized during (p < 0.001) and after the HLI (p < 0.001) periods.

4. Discussion

This study was unique in several important ways. First, we utilized near-optimal chaotic attractor embedding techniques to assess the effects of participants being in a state of HRV coherence on synchronization to each other and with the earth’s magnetic field. Secondly, it was the first study to do continuous simultaneous long-term HRV monitoring on groups of participants located in different countries, with local magnetic field monitoring stations distributed around the planet. Finally, it was the first study to examine the impact of increasing participants’ HRV coherence on synchronization of their heart rhythms to the resonant frequencies in the LMF.
The participants used the HLI technique, which is a heart-focused meditation where they focused attention in the area of the heart and intentionally activated and radiated positive feelings to others in the study for a 15-min period. In analysis of the groups HRV coherence before, during and after the HLI, the California and New Zealand group members had the largest increase in HRV coherence during the HLI period. This is not surprising as these two groups had the most experience with using this technique. However, all the groups showed increased coherence and the group average coherence scores for all of the groups was in the range that is considered as high coherence during the HLI.
The group locations were chosen so that they were in the same areas where we have magnetic field monitoring stations in order to compare the groups HRV with the local magnetic fields which were different at the various locations. Therefore, the analysis of synchronization between participants’ HRV and LMF power were computed separately for each group’s location. Since the global HLI took place for a 15-min period at 17:00 p.m. (UTC time), a “day” was defined as a 24-h period starting at 17:00 p.m. We calculated participants’ daily LMF-HRV-synchronization over an 11-day period, which provided a 5-day period before, the day of and 5-days after the HLI day.
The only day where all the groups HRV was positively correlated with the LMF was on the day of the HLI and the synchronization between the HRV and LMF for all the groups was significantly higher than most of the other days. It has been observed that individuals have widely varying levels of sensitivity to changes in the Earth’s magnetic field, and can respond in opposite ways to fluctuations in the same environmental variable [49]. When looking at the LMF-HRV-correlations at individual level (shown in Appendix information) across all groups, it is clear that the same individuals degree of HRV synchronization with the LMF not only varies day to day but can also be positively correlated on some days and negatively correlated on others. However, at the group level there are some days when the majority of the participants were either positively or negatively correlated. During the study period, the overall group level trend was toward negative correlations to changes in the LMF. It is currently unclear why on some days the groups were positively correlated while on others they were negatively correlated or why on the day of the HLI the vast majority of the participants’ and all the groups were strongly positively correlated with changes in the LMF.
We also examined the synchronization between the group members within each of the groups before, during and after the HLI that all the groups did at the same time. Keep in mind that lower values in Figure 5 represent a higher level of synchronization among the group members. In the time period before the HLI the group members gathered together in the same rooms preparing for the HLI and as group were already tending towards being in a more coherent state. There was a clear increase in HRV coherence during the HLI period, especially in the California group which had the familiarity and practice shifting into and sustaining a coherent state. The New Zealand group who were also more familiar with meditation and the HLI also had a significant increase in HRV coherence at the group level. Previous research has shown that being in a coherent state was significantly related to the likelihood of increased pairwise synchronization between participants [50] and the findings from this study are in line with this previous finding. All of the groups pairwise HRV synchronization with the exception of the Lithuania group was significantly increased during the HLI when the group members were in a more coherent state and the Lithuania group had a high level of synchronization in the period before the HLI which is why they did not show a significant increase in pairwise synchronization during the HLI. Most of the groups synchronization significantly decreased in the period following the HLI. This is likely due to the fact that they got up and started to go about their next activity shortly after the HLI was completed. The only exception to this was the New Zealand group who stayed together after the HLI for another group activity, who remained more significantly synchronized than the pre-HLI period.
Without doubts, there are other environmental factors that do affect HRV. For example, the altitude is one of the factors which does have an effect to HRV. However, we would like to stress that all participants were staying at the same geographic location during the whole 11-day period—meaning that the altitude was constant for all participants during the whole experiment.
On a longer timescale, the average daily temperature is a factor related to the time of the year. The time of the year is again directly related to LMF ([24]). The incline of the rotation axis of the Earth does result into a different average intensity of the solar wind received at that particular geographic location. The solar wind does interact with the Earth’s magnetic field. However, again, the time of year can be ignored as a slowly changing variable during the 11-day period.
The average daily temperature, the humidity, the air pressure, the oxygen level, the lighting storms also can change due to some fluctuations of local climatic conditions. However, those fluctuations are not correlated at different geographic locations. However, the highest degree of synchronization was observed at the same day at all different geographic locations around the globe. The performed statistical analysis have shown that with statistical significance it can be stated that HLI technique does help to improve the coherence between HRV and LMF.

Limitations and Suggestions for Future Studies

Possible limitations of the computational techniques used in this study are firstly related to the limitations of the geometrical synchronization detection algorithm. This algorithm is based on the comparison of optimal time lags in finite observation windows. The optimality of a time lag is defined by the maximal area of the embedded attractor in the delay coordinate space. In other words, the geometrical synchronization detection algorithm does identify the rate of synchronization between two (or more) time series in terms of the similarity between optimal time delays reconstructed for each individual time series. It is well understood that the objective of any optimal time delay selection method is making the components of reconstructed vectors independent as far as possible, yet not too far to keep the information about dynamic properties of the embedded time series. However, it is not possible to determine optimal time lags for a completely random time series—because then the area of the embedded attractor does not depend on the time lag [51]. In other words, the presented computational techniques would fail if one of the analyzed time series is a completely random noise. The optimal embedding algorithms still work if the signal to noise ratio is low [52]—but one should make sure that the analyzed signals are not random. Otherwise, the resulting data on the geometrical synchronization may not be reliable. However, both the HRV and geomagnetic data analyzed with the algorithm in this study are clearly non-random data sets, therefore this is not an issue in the context of this study.
Another limitation of the study is that the activity of the various groups was not controlled during the analysis periods before and immediately after participating in the Heart Lock-Ins. In future studies this should be controlled for as in some of the groups during the pre-lock-In period the participants may have been socializing, while other groups were more introspective in preparation for the heart focused meditation. In the post-lock-in period, in some groups, the participants immediately got up and moved on to their next activity while some remained seated for a while longer. This is most likely why the findings of the HRV synchronization among the group participants during the pre and post segments were different.
Finally, in future studies, it would be more ideal to have a method for tighter control synchronization of HRV recorders. Although steps were taken to synchronize the timing of the bodyguard recorders, there could have been up to several seconds of differences in the time synchronization. This was not likely to have affected the results as the primary analysis was done over 24-h time blocks.

5. Conclusions

In conclusion, this study has confirmed and significantly expanded the results from previous studies. It confirmed that slower rhythms in participants HRV on the day corresponding to the application of Heart Lock-In technique can and do synchronize to changes of the local magnetic field on a global scale. The participants’ HRV synchronization with the local magnetic field activity was calculated for each day over an 11-day period providing a 5-day period before, the day of and 5-days after the day all the participants participated in the 15-min heart focused meditation. The analysis of the participants HRV coherence before, during and after the Heart Lock-In confirmed that most of the groups showed significantly increased coherence during the meditation period and the analysis of heart rhythm synchronization between group members’ found that participants heart rhythms were significantly more synchronized with each other during the meditation period in all the groups.
The only day where all the groups HRV was positively correlated with the local magnetic field activity was on the day of the meditation and the synchronization between the participants HRV and local magnetic field activity for all the groups was significantly higher than most of the other days.

Author Contributions

Conceptualization, I.T., R.M., A.V. and M.R.; Data curation, R.M., M.A., A.A.A., A.V., M.L. and V.Š.; Formal analysis, I.T., R.M., A.V. and M.R.; Investigation, I.T. and M.A.; Methodology, I.T., R.M. and A.V.; Project administration, R.M., A.V. and M.R.; Resources, R.M., M.A., A.A.A., A.V., M.L. and V.Š.; Software, I.T., M.A. and M.L.; Supervision, R.M., A.V. and M.R.; Validation, I.T. and M.A.; Visualization, I.T. and M.A.; Writing—original draft, I.T. and M.A.; Writing—review and editing, I.T., R.M. and M.A. All authors have read and agreed to the published version of the manuscript.

Funding

This research received no external funding.

Institutional Review Board Statement

The study was conducted according to the guidelines of the Declaration of Helsinki, and approved by the Kaunas Regional Ethics Committee for Biomedical Investigations (No. BE-2-51, 23 December 2015).

Informed Consent Statement

Informed consent was obtained from all subjects involved in the study.

Data Availability Statement

All datasets analysed in the current study are available from the corresponding author on reasonable request.

Acknowledgments

The authors want to express their appreciation for each of the local study coordinators. Without them, the study would not have been possible. Jackie Waterman was the coordinator for the California group, Jane Corbett for the UK group, Abdullah A. Alabdulgader for the Saudi Arabia group, Inga Timofejeva for the Lithuania groups and Carey from The Embassy of Peace.

Conflicts of Interest

The authors declare no conflict of interest.

Appendix A

Figure A1, Figure A2, Figure A3, Figure A4 and Figure A5 show the LMF-HRV-correlations at individual level across a six-day period. The plot labeled (e) in each of the Figures is the day of the HLI. It can clearly be seen that for all five countries, almost all of the participants’ LMF-HRV-correlations shifted to being positively correlated, and had the highest correlations (synchronization) during the day of the Heart Lock-In.
Figure A1. The results of the analysis of the LMF-HRV-synchronization for California. Each part of the figure displays participants’ LMF-HRV-synchronization for the indicated day. Plot (e) corresponds to the day of the Heart Lock-In. Note that almost all of the participants’ HRV signals shifted to being positively correlated (synchronized) with LMF, and the highest LMF-HRV-synchronization values were obtained during the day of the Heart Lock-In.
Applsci 11 02935 g0a1
Figure A2. The results of the analysis of the LMF-HRV-synchronization for Lithuania. Each part of the figure displays participants’ LMF-HRV-synchronization for the indicated day. Plot (e) corresponds to the day of the Heart Lock-In. Note that almost all of the participants’ HRV signals shifted to being positively correlated (synchronized) with LMF, and the highest LMF-HRV-synchronization values were obtained during the day of the Heart Lock-In.
Applsci 11 02935 g0a2
Figure A3. The results of the analysis of the LMF-HRV-synchronization for New Zealand. Each part of the figure displays participants’ LMF-HRV-synchronization for the indicated day. Plot (e) corresponds to the day of the Heart Lock-In. Note that for almost all of the participants’ the highest positive LMF-HRV-synchronization values were obtained during the day of the Heart Lock-In.
Applsci 11 02935 g0a3
Figure A4. The results of the analysis of the LMF-HRV-synchronization for Saudi Arabia. Each part of the figure displays participants’ LMF-HRV-synchronization for the indicated day. Plot (e) corresponds to the day of the Heart Lock-In. Note that most of the participants’ HRV signals shifted to being positively correlated (synchronized) with LMF on the day of the Heart Lock-In.
Applsci 11 02935 g0a4
Figure A5. The results of the analysis of the LMF-HRV-synchronization for UK. Each part of the figure displays participants’ LMF-HRV-synchronization for the indicated day. Plot (e) corresponds to the day of the Heart Lock-In. Note that most of the participants’ HRV signals shifted to being positively correlated (synchronized) with LMF on the day of the Heart Lock-In.
Applsci 11 02935 g0a5

Appendix B

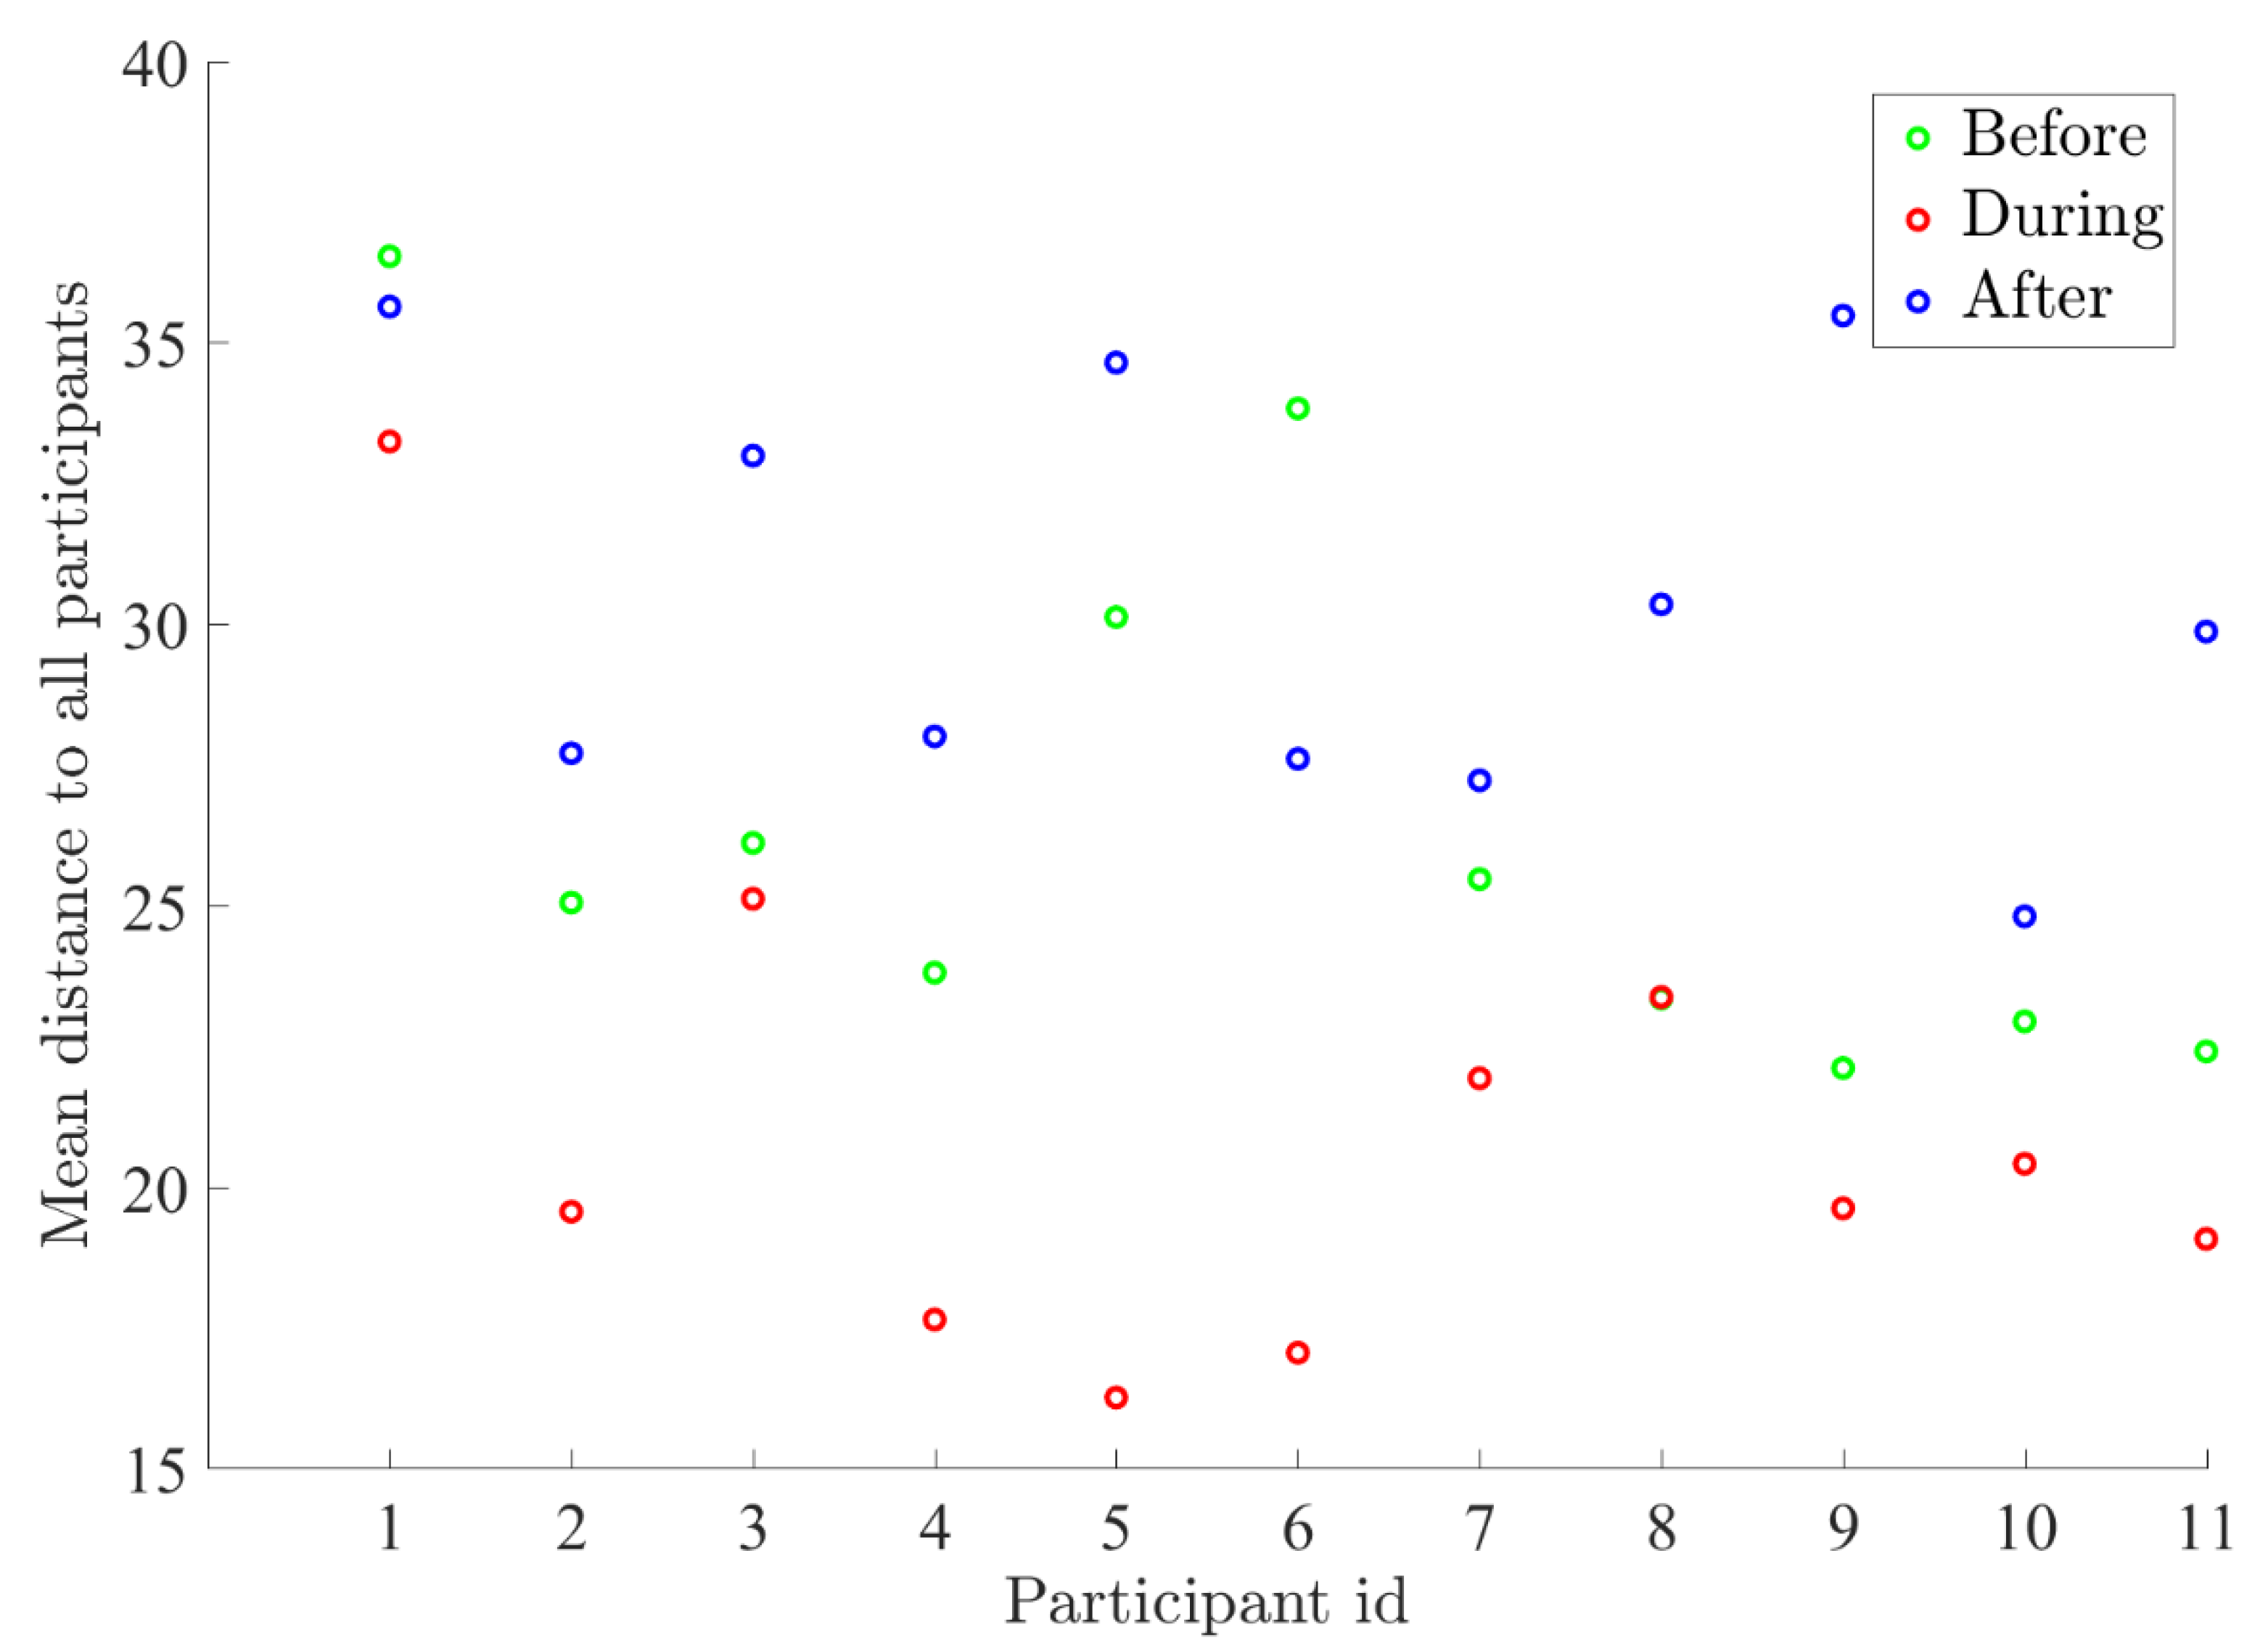
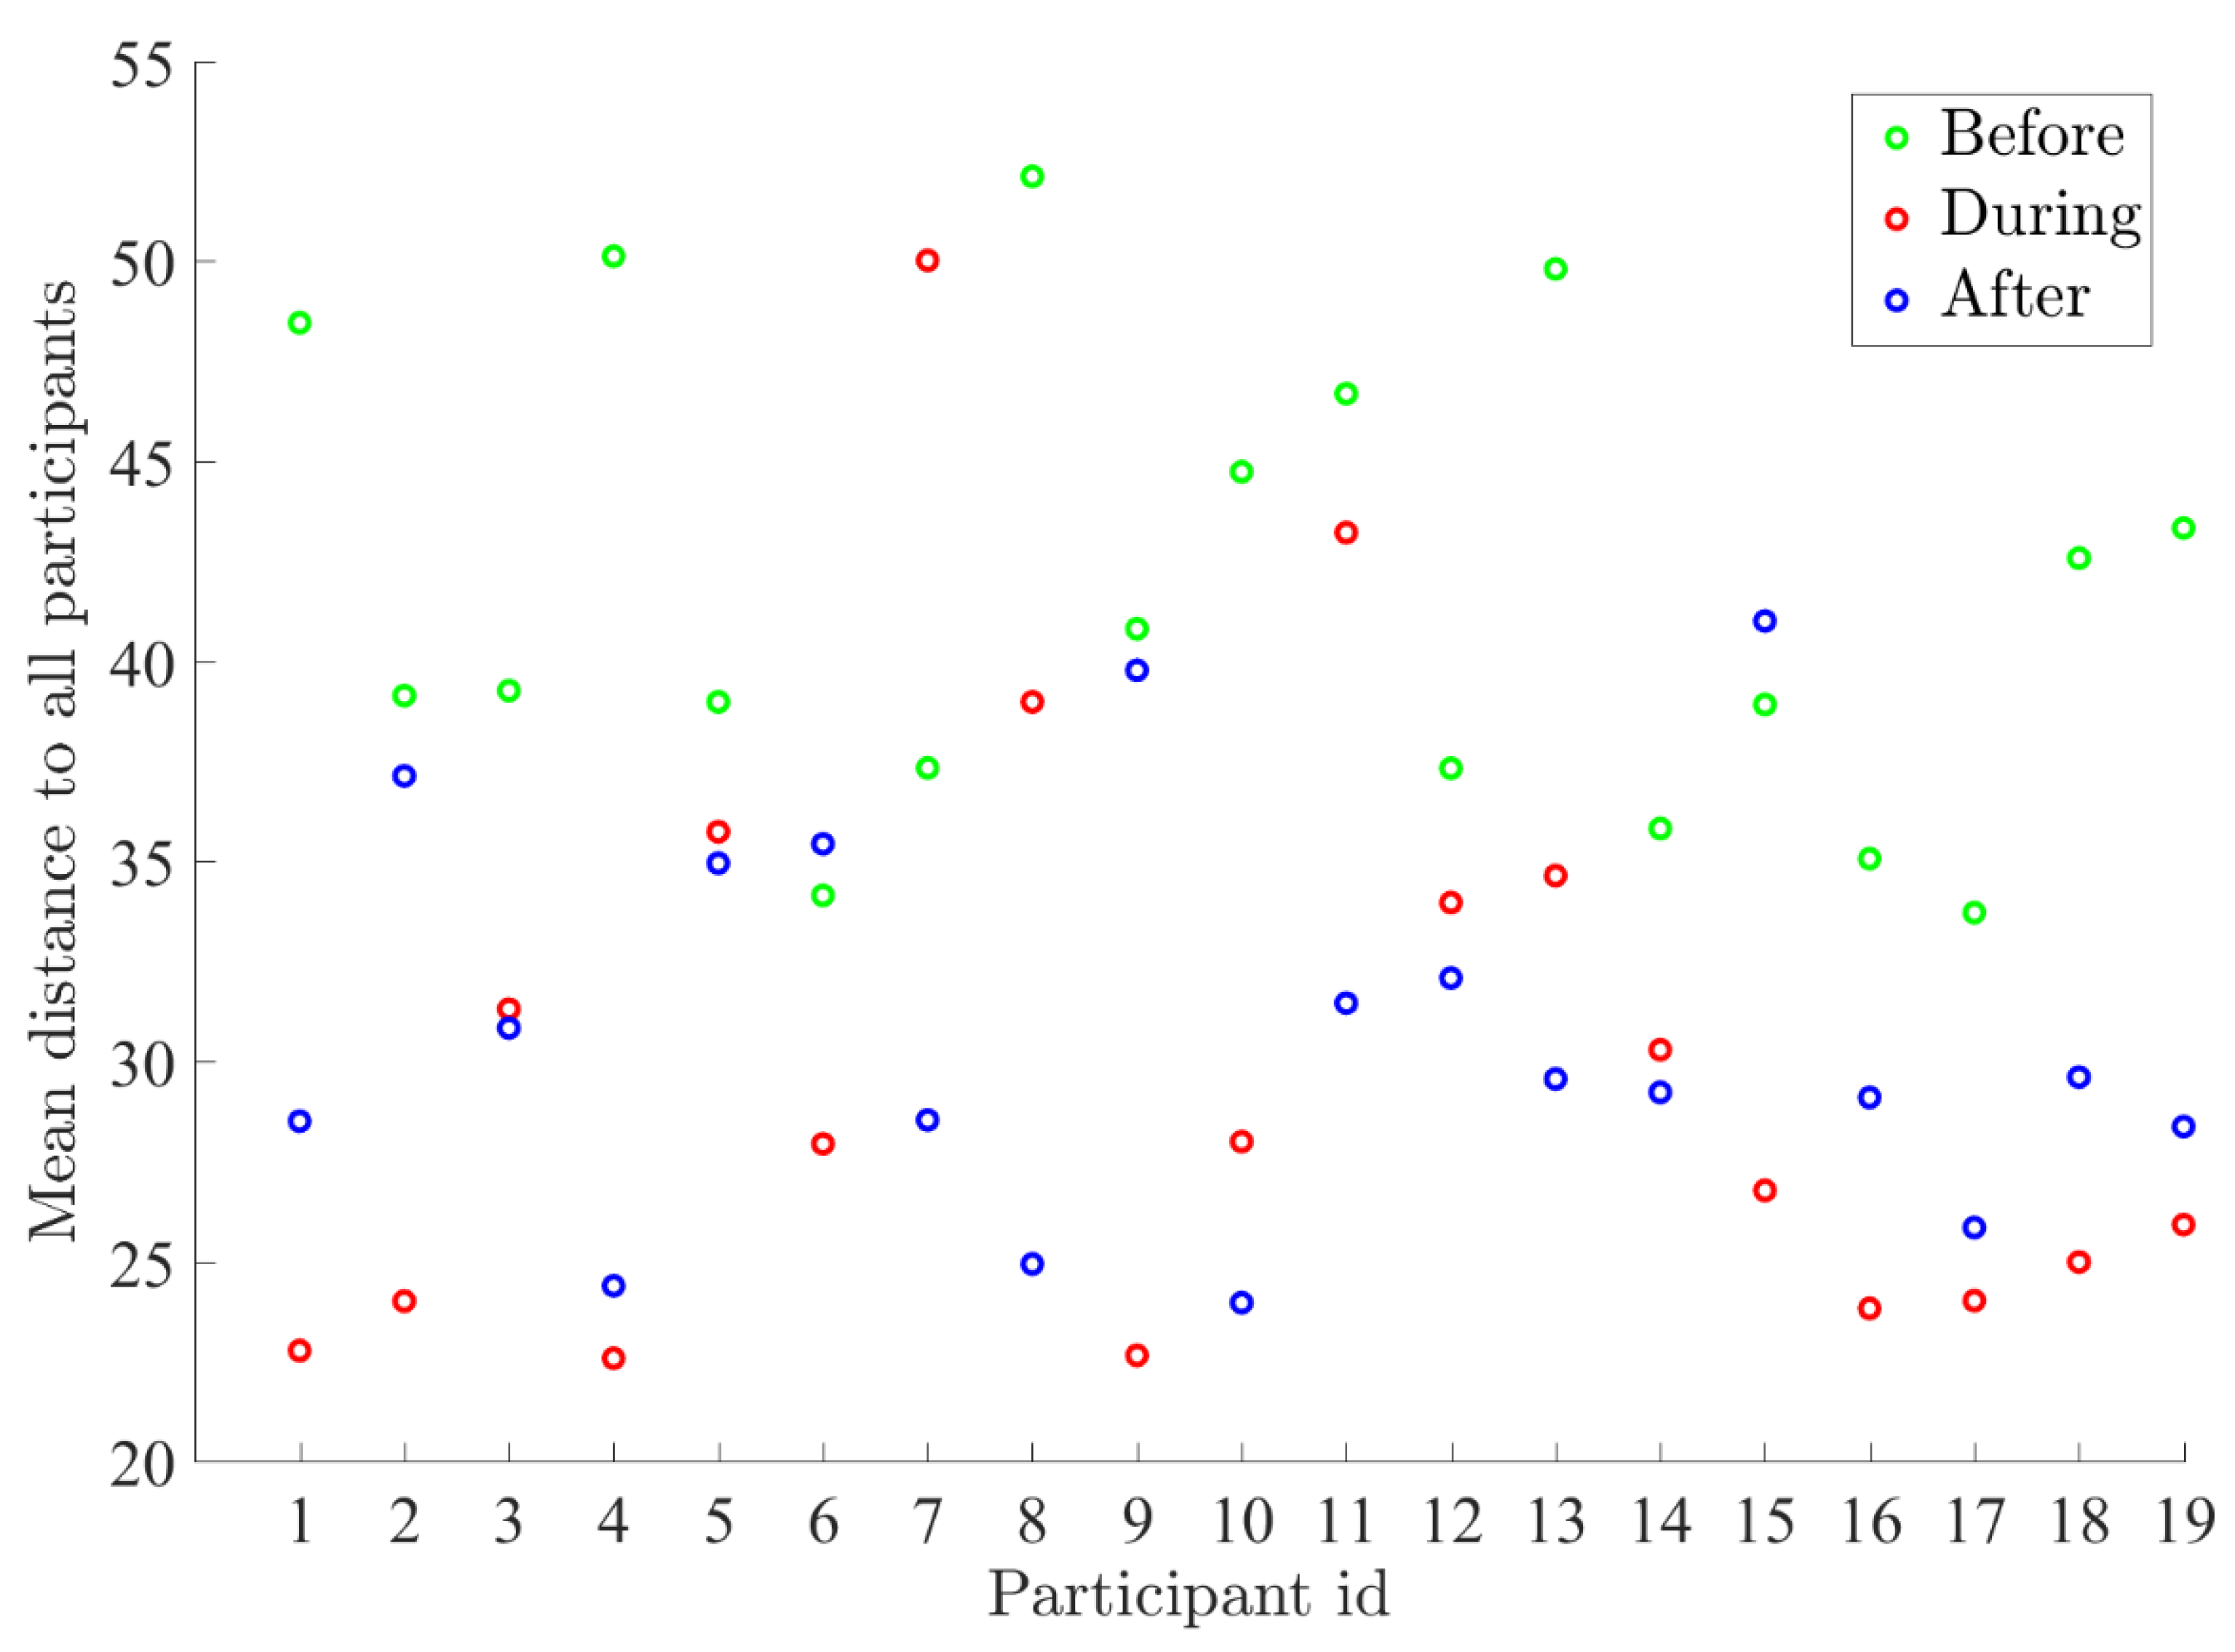
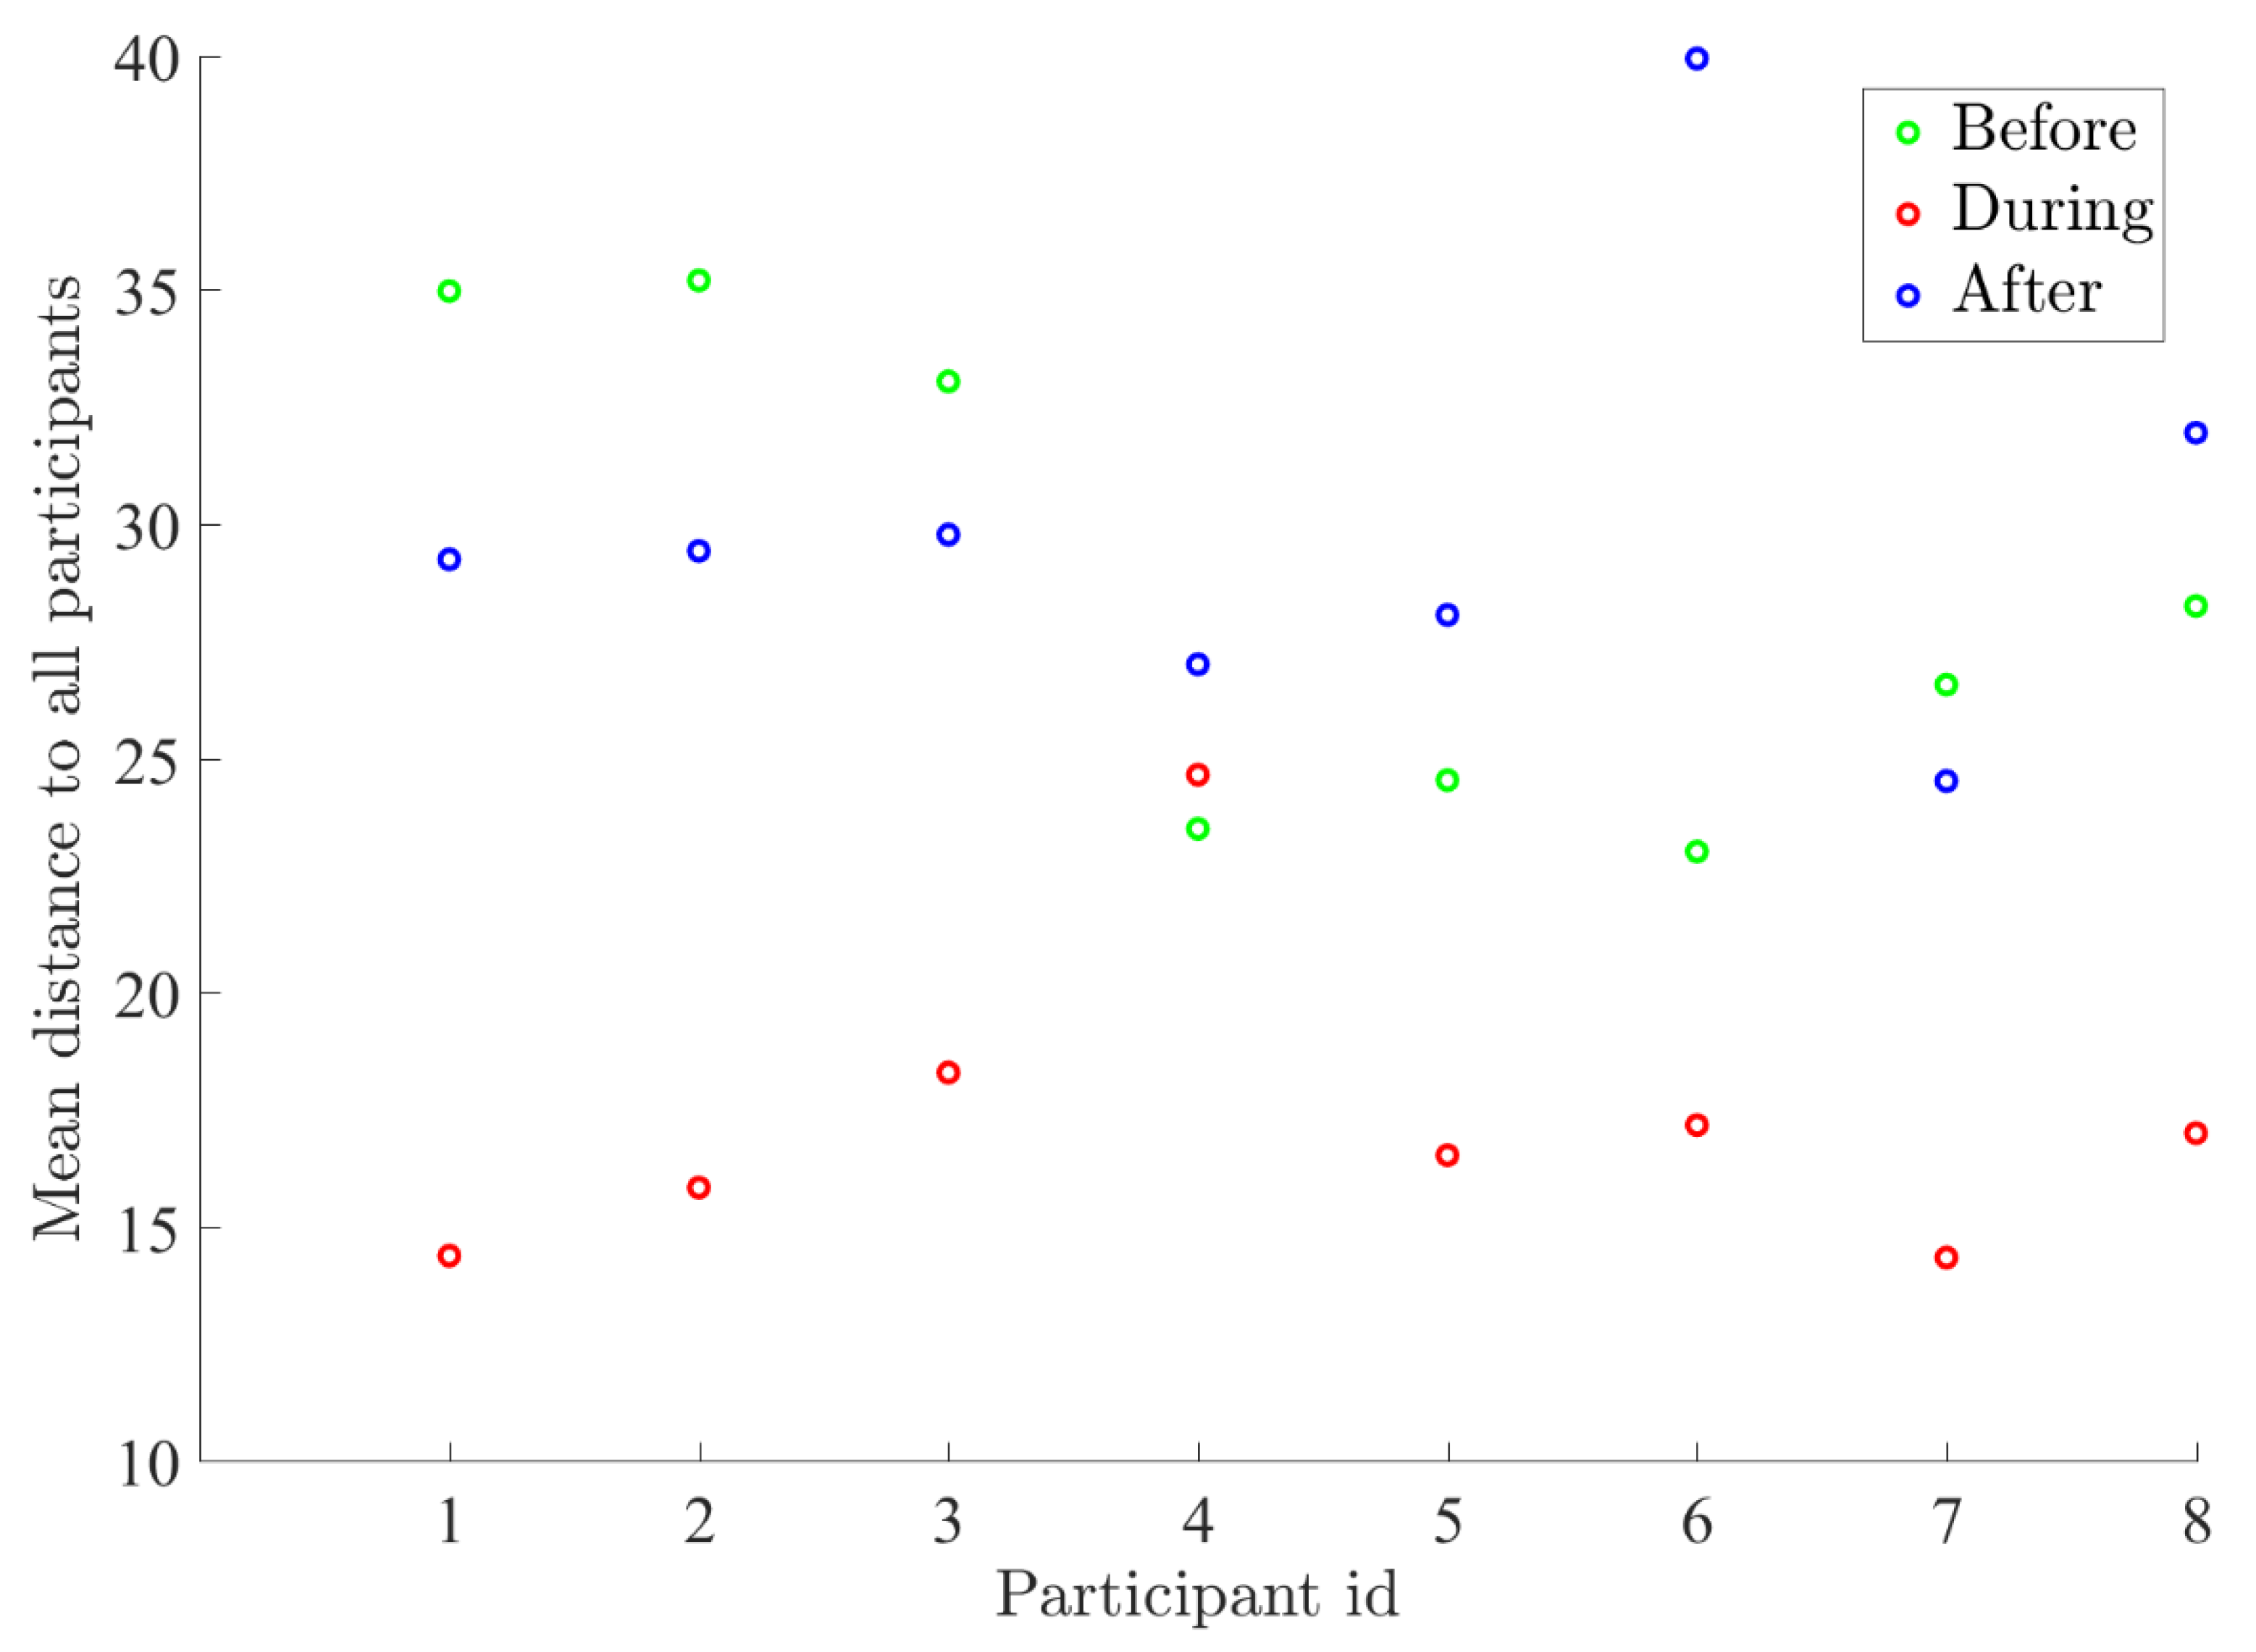
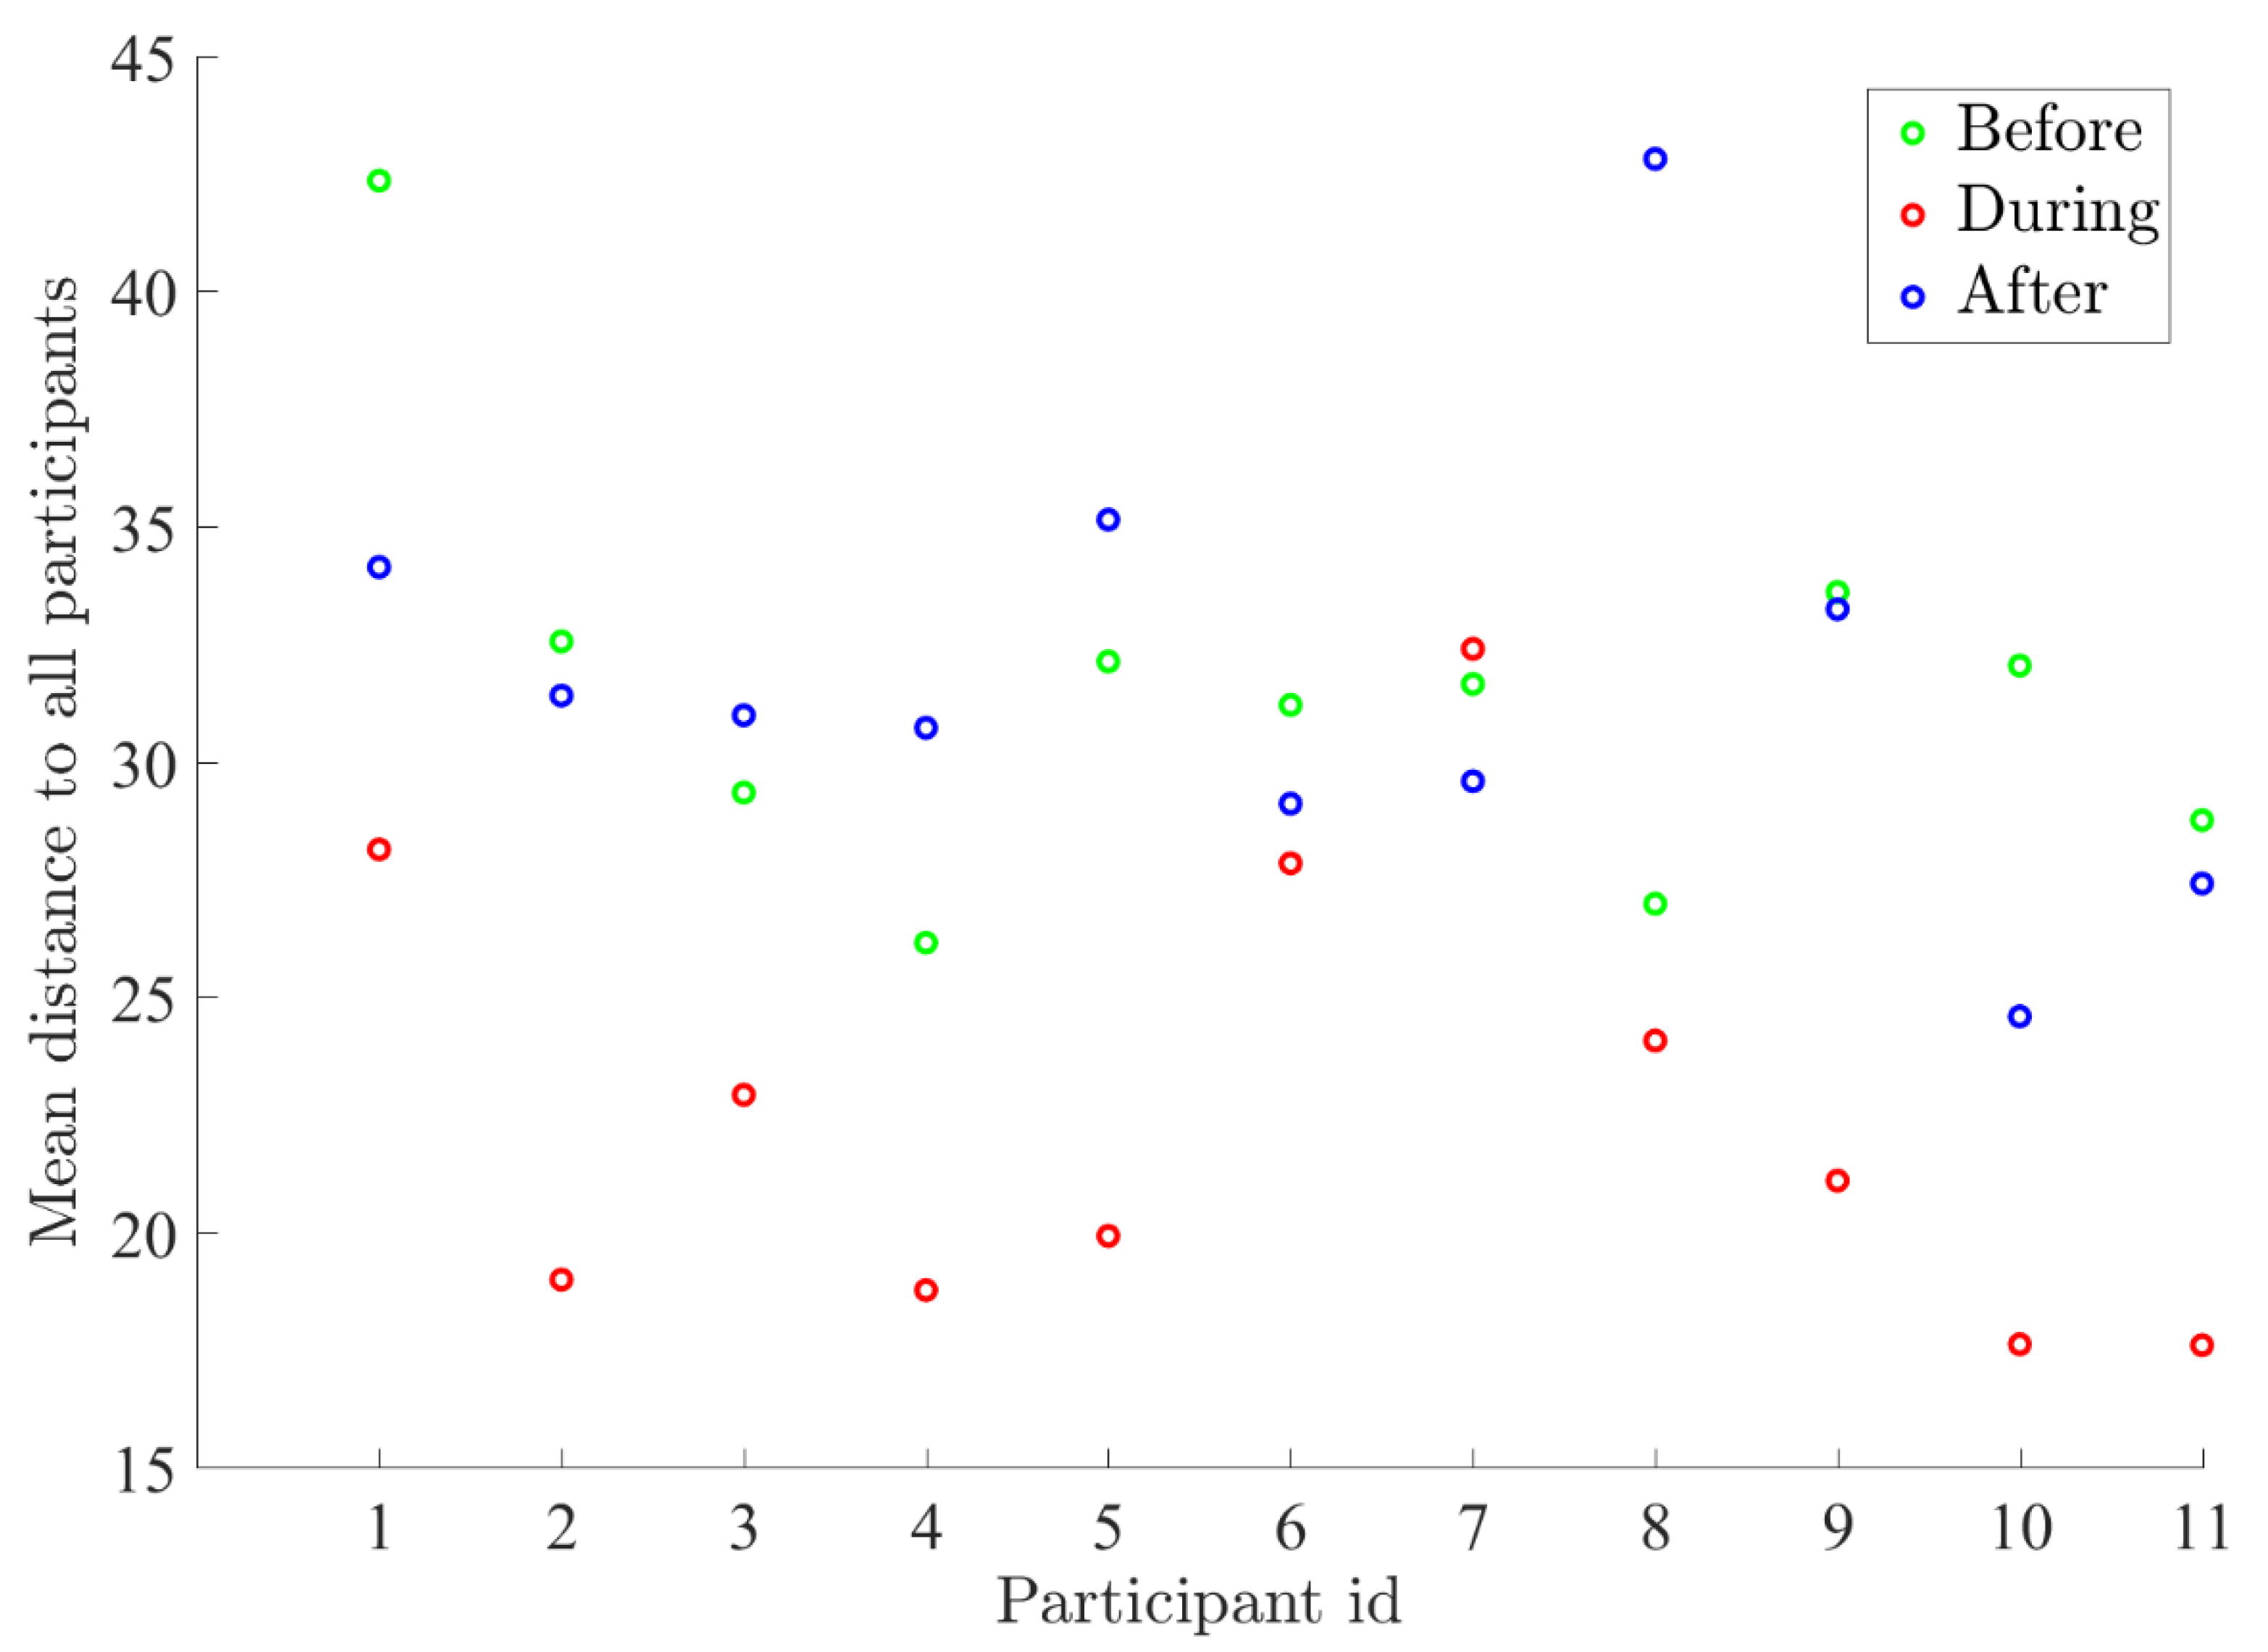
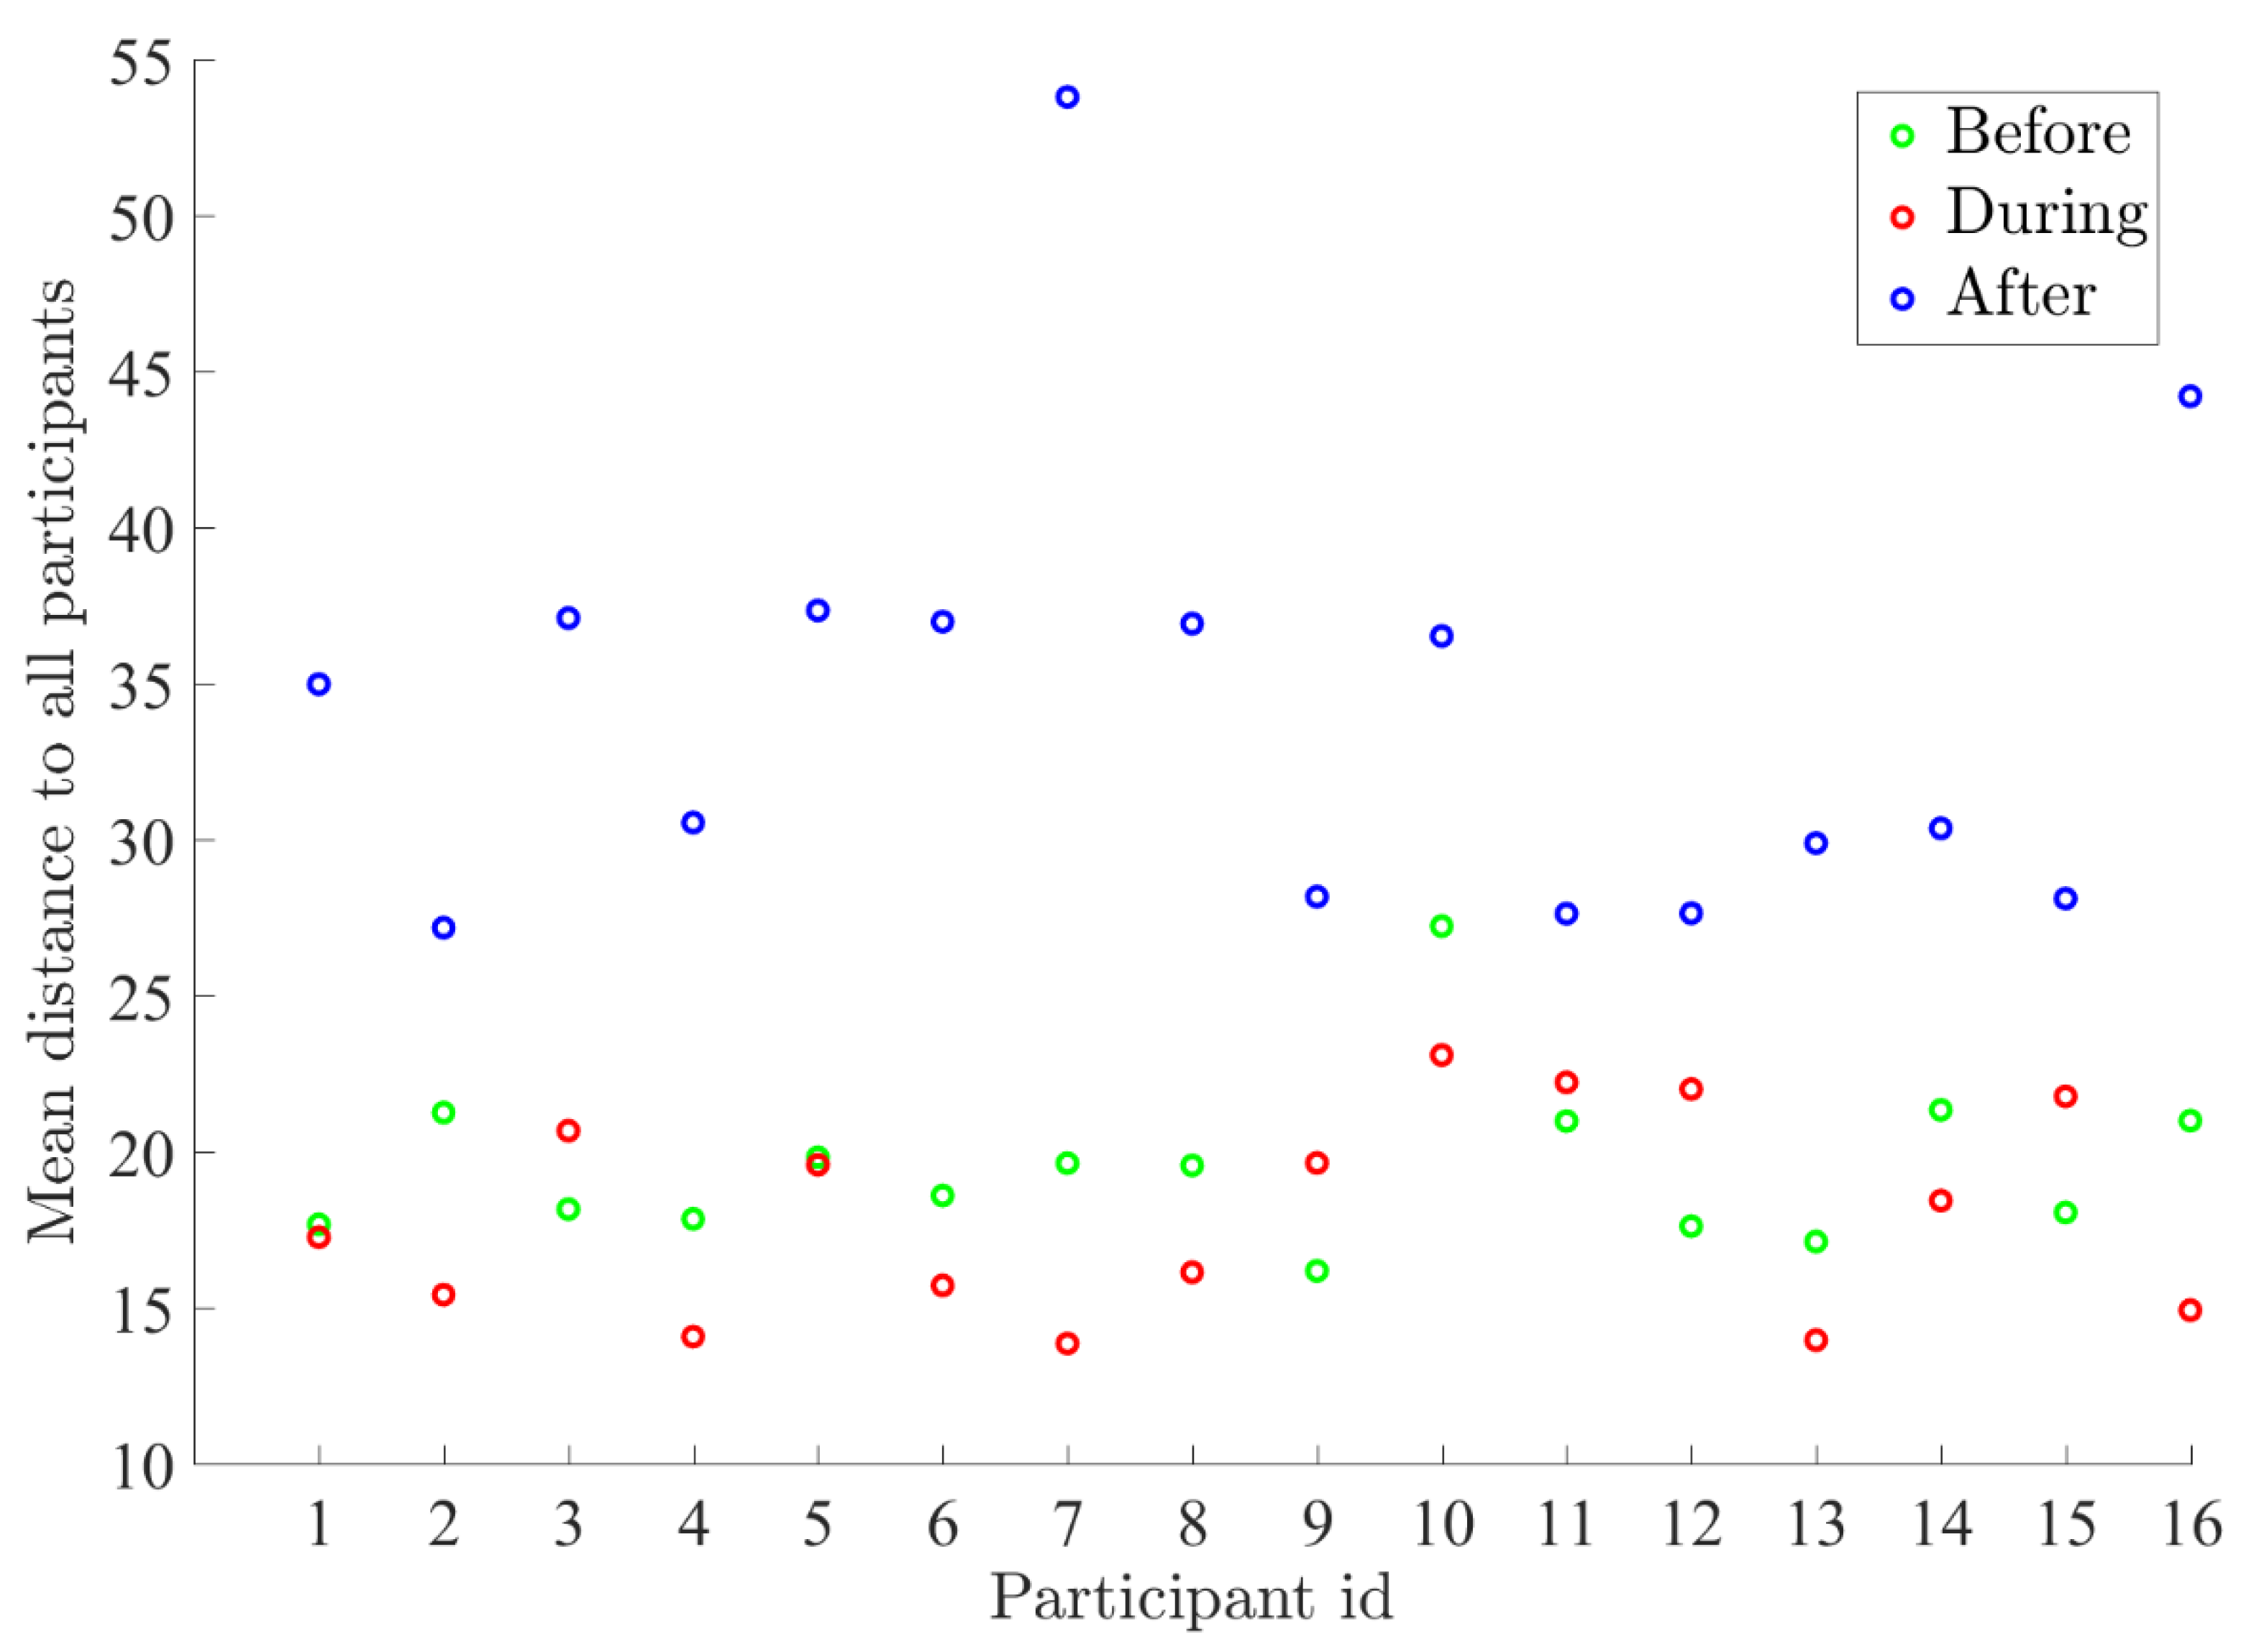
Figure A6, Figure A7, Figure A8, Figure A9 and Figure A10 show the individual HRV pairwise synchronization results for each of the groups 15 min before, during and after the Heart Lock-In (HLI) (note that participants whose HRV data (corresponding to the mentioned time period) was overly noisy were excluded from this analysis). The following figures display the mean Euclidean distance (measure of pairwise synchronization) between each participant and all other individuals in the group. Green, red and blue circles correspond to the mean Euclidean distance before, during and after the Heart Lock-In. Note, that a smaller distance corresponds to higher levels of synchronization.
Figure A6. Pairwise synchronization for California’s group. For the majority of participants (10 out of 11) the mean Euclidean distance during the HLI was smaller than before the Heart Lock-In. This means those individuals were more coherent with the group during the Heart Lock-In than they were before. The mean distance after the HLI is bigger (for the majority of participants) than before the application of the technique.
Applsci 11 02935 g0a6
Figure A7. Pairwise synchronization for New Zealand’s group. For the majority of participants (18 out of 19) the mean Euclidean distance during the HLI was smaller than before the HLI, indicating that those participants were more coherent with the group during the HLI than they were before. The mean distance after the HLI is also smaller (for the majority of participants) than before the Heart Lock-In.
Applsci 11 02935 g0a7
Figure A8. Pairwise synchronization for United Kingdom’s group. For the majority of participants (7 out of 8) the mean Euclidean distance during the HLI was smaller than before the HLI, indicating that the participants were more coherent with the group during the HLI than they were before it. The mean distance after the Heart Lock-In procedure is smaller than before the Heart Lock-In for four out of the eight participants.
Applsci 11 02935 g0a8
Figure A9. Pairwise synchronization for Saudi Arabia’s group. For the majority of participants (10 out of 11) the mean Euclidean distance during the HLI was smaller than before the HLI, indicating that the participants were more coherent with the group during the HLI than they were before it. The mean distance after the HLI is smaller than before the Heart Lock-In for 7 out of 11 participants.
Applsci 11 02935 g0a9
Figure A10. Pairwise synchronization for Lithuania’s group. For the majority of participants (11 out of 16) the mean Euclidean distance during the HLI was smaller than before the HLI, indicating that those participants were more coherent with the group during the HLI than they were before it. The mean distance after the HLI is larger (for all participants) than before the HLI. Three participants who were outliers and extremely far away from others during the HLI were removed from the analysis.
Applsci 11 02935 g0a10

References

  1. Cornélissen, G.; Halberg, F.; Schwartzkopff, O.; Delmore, P.; Katinas, G.; Hunter, D.; Tarquini, B.; Tarquini, R.; Perfetto, F.; Watanabe, Y.; et al. Chronomes, time structures, for chronobioengineering for “a full life”. Biomed. Instrum. Technol. 1999, 33, 152–187. [Google Scholar]
  2. Qin, S.; Yin, H.; Yang, C.; Dou, Y.; Liu, Z.; Zhang, P.; Yu, H.; Huang, Y.; Feng, J.; Hao, J.; et al. A magnetic protein biocompass. Nat. Mater. 2016, 15, 217–226. [Google Scholar] [CrossRef]
  3. Price, C.; Williams, E.; Elhalel, G.; Sentman, D. Natural ELF fields in the atmosphere and in living organisms. Int. J. Biometeorol. 2020, 65, 85–928. [Google Scholar] [CrossRef]
  4. Kuzmenko, N.; Shchegolev, B.; Pliss, M.; Tsyrlin, V. The Influence of Weak Geomagnetic Disturbances on the Rat Cardiovascular System under Natural and Shielded Geomagnetic Field Conditions. Biophysics 2019, 64, 109–116. [Google Scholar] [CrossRef]
  5. Otsuka, K.; Cornelissen, G.; Norboo, T.; Takasugi, E.; Halberg, F. Chronomics and “glocal”(combined global and local) assessment of human life. Prog. Theor. Phys. Suppl. 2008, 173, 134–152. [Google Scholar] [CrossRef]
  6. Dimitrova, S.; Stoilova, I.; Cholakov, I. Influence of local geomagnetic storms on arterial blood pressure. Bioelectromagn. J. Bioelectromagn. Soc. Soc. Phys. Regul. Biol. Med. Eur. Bioelectromagn. Assoc. 2004, 25, 408–414. [Google Scholar] [CrossRef] [PubMed]
  7. Hamer, J. Biological entrainment of the human brain by low frequency radiation. Northrop Space Labs 1965, 36, 65–199. [Google Scholar]
  8. Oraevskiĭ, V.; Breus, T.; Baevskiĭ, R.; Rapoport, S.; Petrov, V.; Barsukova, Z.; Rogoza, A. Effect of geomagnetic activity on the functional status of the body. Biofizika 1998, 43, 819. [Google Scholar] [PubMed]
  9. Pobachenko, S.; Kolesnik, A.; Borodin, A.; Kalyuzhin, V. The contingency of parameters of human encephalograms and Schumann resonance electromagnetic fields revealed in monitoring studies. Biophysics 2006, 51, 480–483. [Google Scholar] [CrossRef]
  10. Cornélissen, G.; Halberg, F.; Breus, T.; Syutkina, E.V.; Baevsky, R.; Weydahl, A.; Watanabe, Y.; Otsuka, K.; Siegelova, J.; Fiser, B.; et al. Non-photic solar associations of heart rate variability and myocardial infarction. J. Atmos. Sol. Terr. Phys. 2002, 64, 707–720. [Google Scholar] [CrossRef]
  11. Timofejeva, I.; McCraty, R.; Atkinson, M.; Joffe, R.; Vainoras, A.; Alabdulgader, A.A.; Ragulskis, M. Identification of a group’s physiological synchronization with earth’s magnetic field. Int. J. Environ. Res. Public Health 2017, 14, 998. [Google Scholar] [CrossRef] [Green Version]
  12. Wang, C.X.; Hilburn, I.A.; Wu, D.A.; Mizuhara, Y.; Cousté, C.P.; Abrahams, J.N.; Bernstein, S.E.; Matani, A.; Shimojo, S.; Kirschvink, J.L. Transduction of the geomagnetic field as evidenced from alpha-band activity in the human brain. Eneuro 2019. [Google Scholar] [CrossRef] [Green Version]
  13. Elhalel, G.; Price, C.; Fixler, D.; Shainberg, A. Cardioprotection from stress conditions by weak magnetic fields in the Schumann Resonance band. Sci. Rep. 2019, 9, 1–10. [Google Scholar] [CrossRef] [Green Version]
  14. Pishchalnikov, R.; Gurfinkel, Y.; Sarimov, R.; Vasin, A.; Sasonko, M.; Matveeva, T.; Binhi, V.; Baranov, M. Cardiovascular response as a marker of environmental stress caused by variations in geomagnetic field and local weather. Biomed. Signal Process. Control 2019, 51, 401–410. [Google Scholar] [CrossRef]
  15. Vieira, C.L.Z.; Alvares, D.; Blomberg, A.; Schwartz, J.; Coull, B.; Huang, S.; Koutrakis, P. Geomagnetic disturbances driven by solar activity enhance total and cardiovascular mortality risk in 263 US cities. Environ. Health 2019, 18, 83. [Google Scholar] [CrossRef] [PubMed] [Green Version]
  16. Otsuka, K.; Cornelissen, G.; Kubo, Y.; Shibata, K.; Mizuno, K.; Ohshima, H.; Furukawa, S.; Mukai, C. Anti-aging effects of long-term space missions, estimated by heart rate variability. Sci. Rep. 2019, 9, 1–12. [Google Scholar]
  17. Wickramasinghe, N.; Steele, E.J.; Wainwright, M.; Tokoro, G.; Fernando, M.; Qu, J. Sunspot Cycle Minima and Pandemics: The Case for Vigilance? JAsBO 2017, 5, 159. [Google Scholar]
  18. Doronin, V.; Parfentĕv, V.; Tleulin, S.; Namvar, R.; Somsikov, V.; Drobzhev, V.; Chemeris, A. Effect of variations of the geomagnetic field and solar activity on human physiological indicators. Biofizika 1998, 43, 647–653. [Google Scholar] [PubMed]
  19. Halberg, F.; Cornélissen, G.; McCraty, R.; Czaplicki, J.; Al-Abdulgader, A.A. Time structures (chronomes) of the blood circulation, populations’ health, human affairs and space weather. World Heart J. 2011, 3, 73. [Google Scholar]
  20. Khorseva, N. Using psychophysiological indices to estimate the effect of cosmophysical factors. Izv. Atmos. Ocean. Phys. 2013, 49, 839–852. [Google Scholar] [CrossRef]
  21. Khabarova, O.; Dimitrova, S. On the nature of people’s reaction to space weather and meteorological weather changes. Sun Geosph. 2009, 4, 60–71. [Google Scholar]
  22. Cornelissen Guillaume, G.; Gubin, D.; Beaty, L.A.; Otsuka, K. Some Near-and Far-Environmental Effects on Human Health and Disease with a Focus on the Cardiovascular System. Int. J. Environ. Res. Public Health 2020, 17, 3083. [Google Scholar] [CrossRef] [PubMed]
  23. McCraty, R.; Atkinson, M.; Stolc, V.; Alabdulgader, A.A.; Vainoras, A.; Ragulskis, M. Synchronization of human autonomic nervous system rhythms with geomagnetic activity in human subjects. Int. J. Environ. Res. Public Health 2017, 14, 770. [Google Scholar] [CrossRef] [PubMed] [Green Version]
  24. Alabdulgader, A.; McCraty, R.; Atkinson, M.; Dobyns, Y.; Vainoras, A.; Ragulskis, M.; Stolc, V. Long-term study of heart rate variability responses to changes in the solar and geomagnetic environment. Sci. Rep. 2018, 8, 1–14. [Google Scholar] [CrossRef] [PubMed] [Green Version]
  25. Shaffer, F.; McCraty, R.; Zerr, C.L. A healthy heart is not a metronome: An integrative review of the heart’s anatomy and heart rate variability. Front. Psychol. 2014, 5, 1040. [Google Scholar] [CrossRef] [Green Version]
  26. McCraty, R.; Shaffer, F. Heart rate variability: New perspectives on physiological mechanisms, assessment of self-regulatory capacity, and health risk. Glob. Adv. Health Med. 2015, 4, 46–61. [Google Scholar] [CrossRef] [Green Version]
  27. Thayer, J.F.; Hansen, A.L.; Saus-Rose, E.; Johnsen, B.H. Heart rate variability, prefrontal neural function, and cognitive performance: The neurovisceral integration perspective on self-regulation, adaptation, and health. Ann. Behav. Med. 2009, 37, 141–153. [Google Scholar] [CrossRef]
  28. McCraty, R.; Deyhle, A. The global coherence initiative: Investigating the dynamic relationship between people and earth’s energetic systems. Bioelectromagn. Subtle Energy Med. 2015, 2, 411–425. [Google Scholar]
  29. Persinger, M.A.; Saroka, K.S. Human quantitative electroencephalographic and Schumann Resonance exhibit real-time coherence of spectral power densities: Implications for interactive information processing. J. Signal Inf. Process. 2015, 6, 153. [Google Scholar] [CrossRef] [Green Version]
  30. Southwood, D. Some features of field line resonances in the magnetosphere. Planet. Space Sci. 1974, 22, 483–491. [Google Scholar] [CrossRef]
  31. Alfvén, H. Cosmical Electrodynamics; Ripol Classic: Moscow, Russia, 1963. [Google Scholar]
  32. Heacock, R. Two subtypes of type Pi micropulsations. J. Geophys. Res. 1967, 72, 3905–3917. [Google Scholar] [CrossRef]
  33. McPherron, R.L. Magnetic pulsations: Their sources and relation to solar wind and geomagnetic activity. Surv. Geophys. 2005, 26, 545–592. [Google Scholar] [CrossRef]
  34. Zenchenko, T.; Medvedeva, A.; Khorseva, N.; Breus, T. Synchronization of human heart-rate indicators and geomagnetic field variations in the frequency range of 0.5–3.0 mHz. Izv. Atmos. Ocean. Phys. 2014, 50, 736–744. [Google Scholar] [CrossRef]
  35. McCraty, R. New frontiers in heart rate variability and social coherence research: Techniques, technologies, and implications for improving group dynamics and outcomes. Front. Public Health 2017, 5, 267. [Google Scholar] [CrossRef] [Green Version]
  36. Novak, V.; Saul, J.P.; Eckberg, D.L. Task Force report on heart rate variability. Circulation 1997, 96, 1056. [Google Scholar]
  37. McCraty, R.; Tomasino, D. Emotional Stress, Positive Emotions, and Psychophysiological Coherence. In Stress in Health and Disease; Wiley-VCH: Hoboken, NJ, USA, 2006. [Google Scholar]
  38. McCraty, R.; Moor, S.; Goelitz, J.; Lance, S.W. Transforming Stress for Teens: The Heartmath Solution for Staying Cool under Pressure; Instant Help Books, an Imprint of New Harbinger Publications, Inc.: Oakland, CA, USA, 2016. [Google Scholar]
  39. Pearson, R.K.; Neuvo, Y.; Astola, J.; Gabbouj, M. The class of generalized hampel filters. In Proceedings of the IEEE 2015 23rd European Signal Processing Conference (EUSIPCO), Nice, France, 31 August–4 September 2015; pp. 2501–2505. [Google Scholar]
  40. Liu, Y. Noise reduction by vector median filtering. Geophysics 2013, 78, V79–V87. [Google Scholar] [CrossRef] [Green Version]
  41. Nykänen, V.; Groves, D.; Ojala, V.; Gardoll, S. Combined conceptual/empirical prospectivity mapping for orogenic gold in the northern Fennoscandian Shield, Finland. Aust. J. Earth Sci. 2008, 55, 39–59. [Google Scholar] [CrossRef]
  42. Mauring, E.; Kihle, O. Leveling aerogeophysical data using a moving differential median filter. Geophysics 2006, 71, L5–L11. [Google Scholar] [CrossRef]
  43. Hampel, F.R. A general qualitative definition of robustness. Ann. Math. Stat. 1971, 42, 1887–1896. [Google Scholar] [CrossRef]
  44. Timofejeva, I.; Poskuviene, K.; Cao, M.; Ragulskis, M. Synchronization measure based on a geometric approach to attractor embedding using finite observation windows. Complexity 2018, 2018, 8259496. [Google Scholar] [CrossRef]
  45. McCraty, R.; Atkinson, M.; Tomasino, D.; Bradley, R.T. The coherent heart heart-brain interactions, psychophysiological coherence, and the emergence of system-wide order. Integral Rev. A Transdiscipl. Transcult. J. New Thought Res. Prax. 2009, 5, 10–115. [Google Scholar]
  46. McCraty, R.; Atkinson, M.; Tiller, W.A.; Rein, G.; Watkins, A.D. The effects of emotions on short-term power spectrum analysis of heart rate variability. Am. J. Cardiol. 1995, 76, 1089–1093. [Google Scholar] [CrossRef]
  47. Tiller, W.A.; McCraty, R.; Atkinson, M. Cardiac coherence: A new, noninvasive measure of autonomic nervous system order. Altern. Ther. Health Med. 1996, 2, 52–65. [Google Scholar]
  48. Leon, E.; Clarke, G.; Callaghan, V.; Doctor, F. Affect-aware behaviour modelling and control inside an intelligent environment. Pervasive Mob. Comput. 2010, 6, 559–574. [Google Scholar] [CrossRef]
  49. Alabdulgade, A.; Maccraty, R.; Atkinson, M.; Vainoras, A.; Berškienė, K.; Mauricienė, V.; Daunoravičienė, A.; Navickas, Z.; Šmidtaitė, R.; Landauskas, M. Human heart rhythm sensitivity to earth local magnetic field fluctuations. J. Vibroeng. 2015, 17, 3271–3278. [Google Scholar]
  50. Morris, S.M. Achieving collective coherence: Group effects on heart rate variability, coherence and heart rhythm synchronization. Altern Ther Health Med 2010, 16, 62–72. [Google Scholar]
  51. Ragulskis, M.; Lukoseviciute, K. Non-uniform attractor embedding for time series forecasting by fuzzy inference systems. Neurocomputing 2009, 72, 2618–2626. [Google Scholar] [CrossRef]
  52. Lukoseviciute, K.; Ragulskis, M. Evolutionary algorithms for the selection of time lags for time series forecasting by fuzzy inference systems. Neurocomputing 2010, 73, 2077–2088. [Google Scholar] [CrossRef]
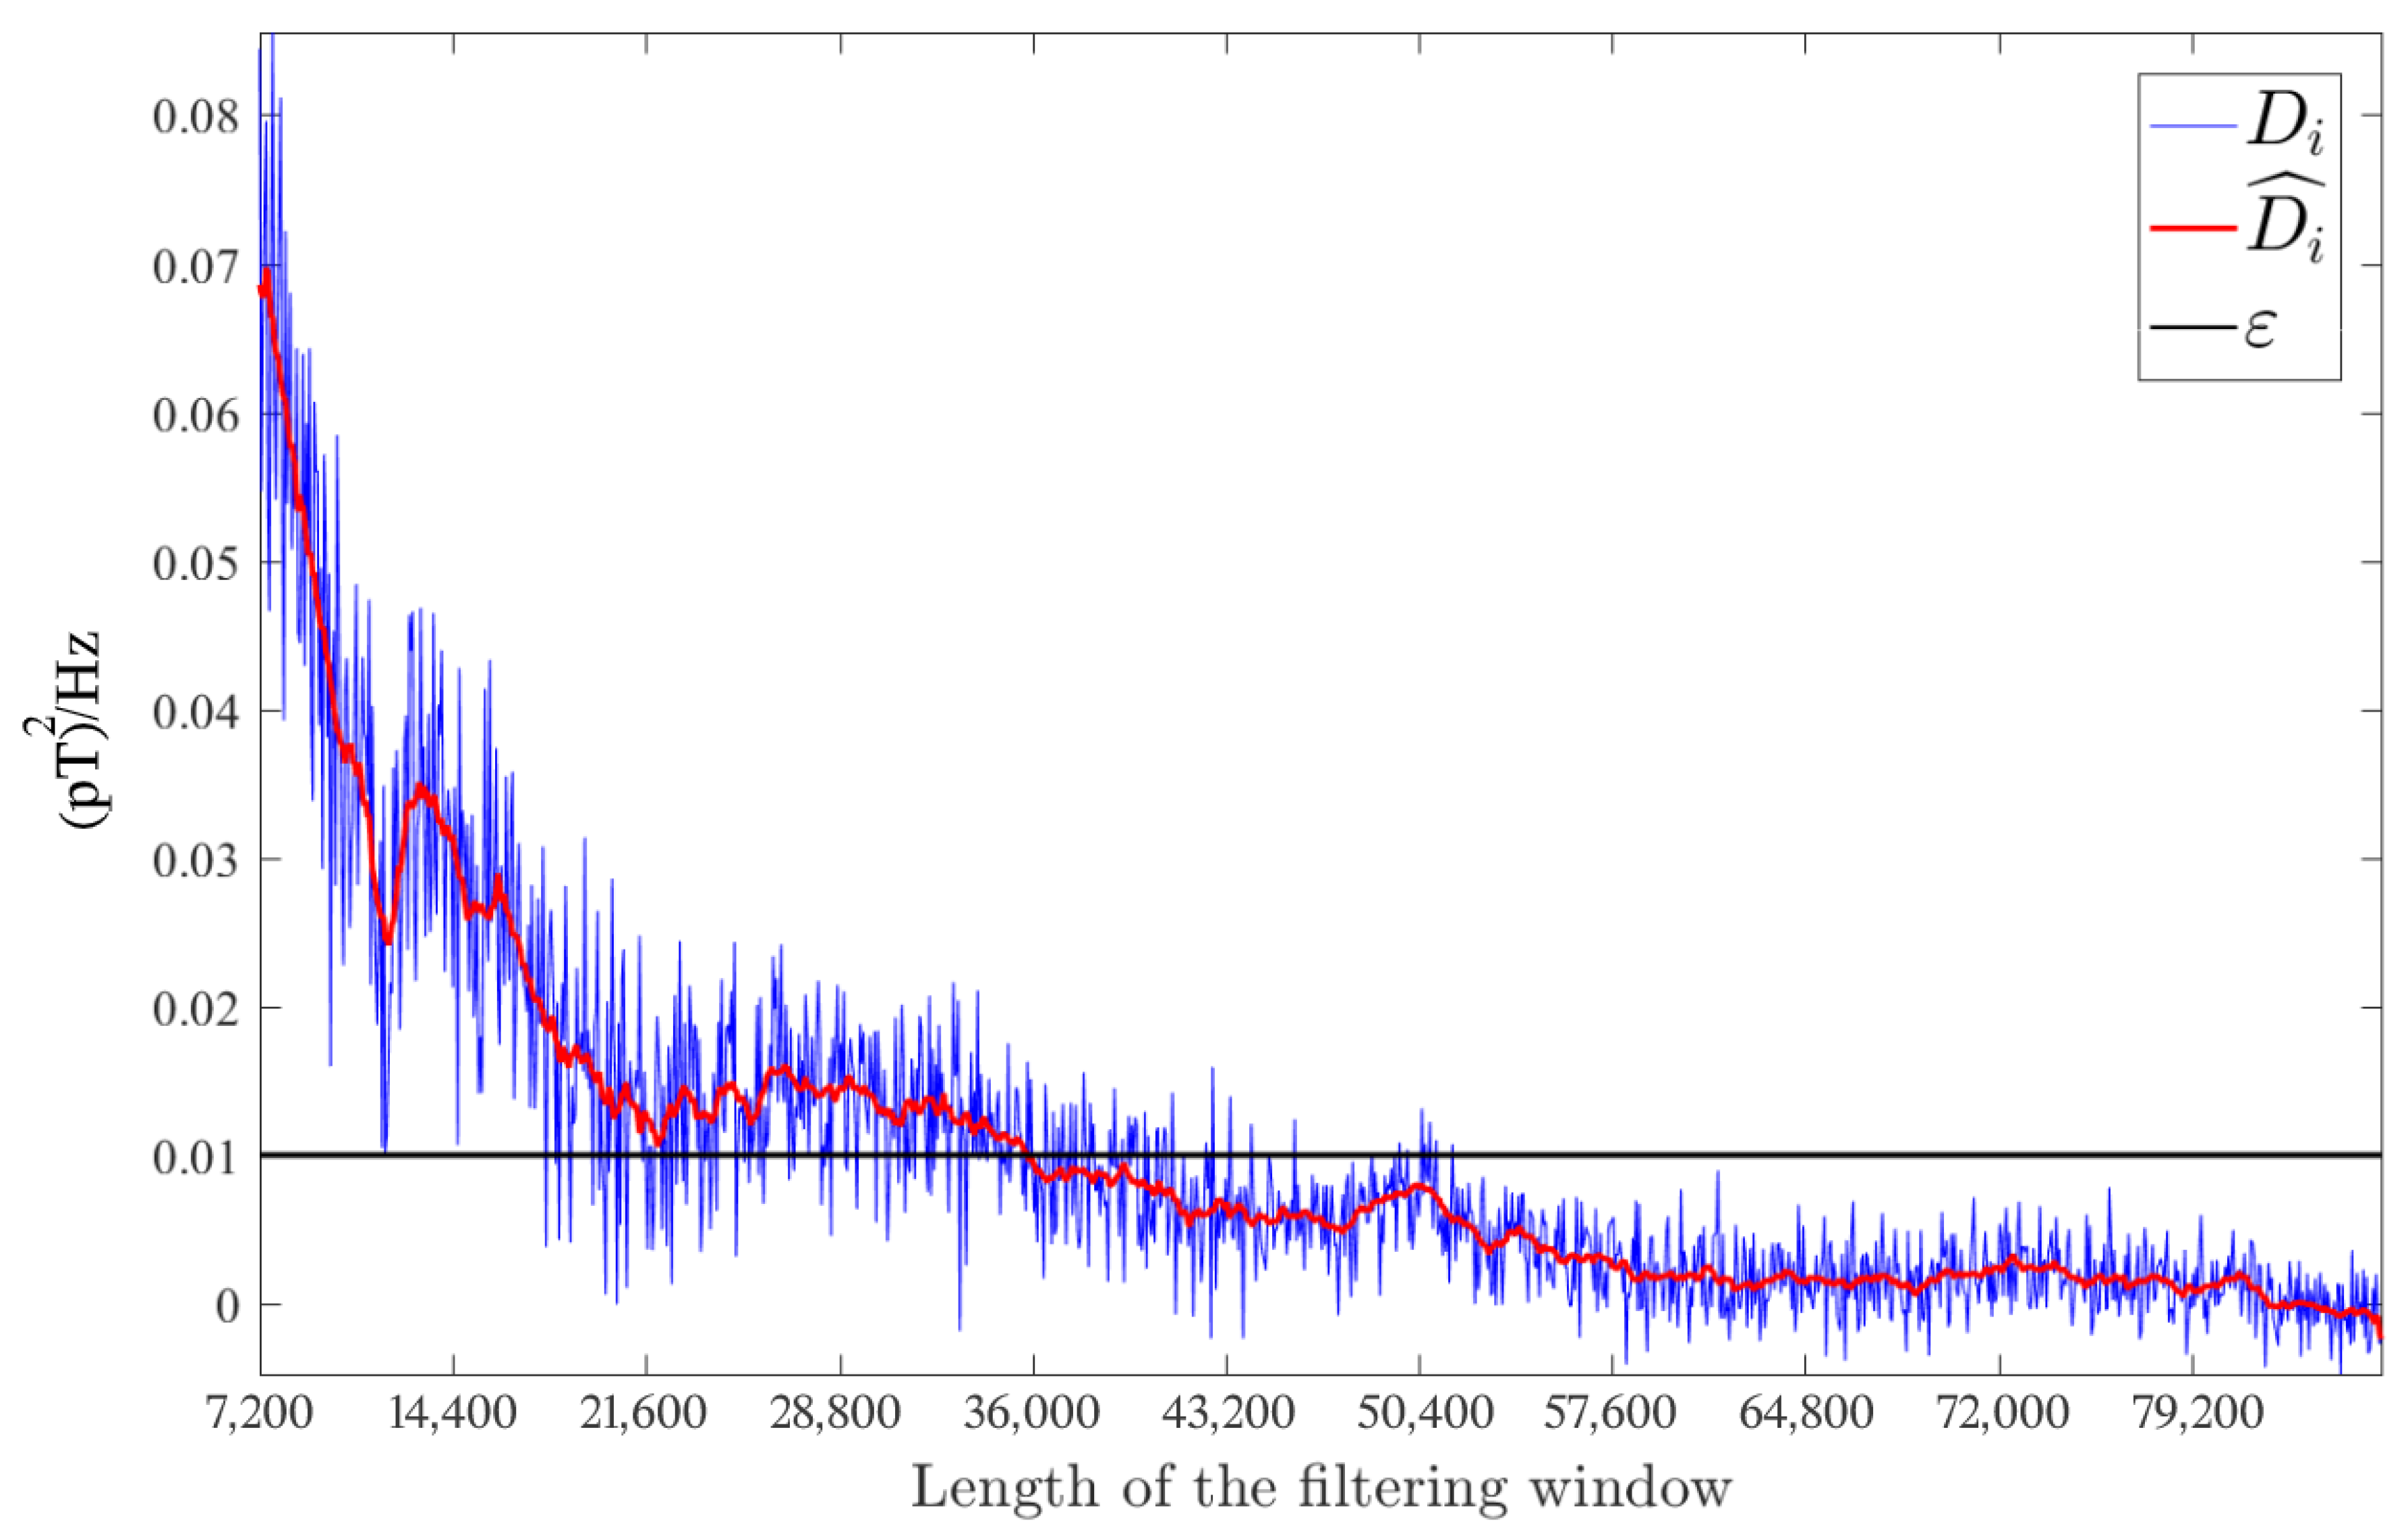
Figure 1. The original D i (blue line) and smoothed D i ^ (red line) discrete derivative of the difference between standard deviations of filtered and non-filtered data. The degree of tolerance used in this study was set to ε = 0.01 (black line). Thus, the optimal size of the filtering data window was selected as the maximal data window satisfying D i ^ > ε . It can be observed from this figure that the optimal length filtering data window corresponding to such criteria is 36,000 elements, i.e., 10 h of local magnetic field spectral power data.
Applsci 11 02935 g001
Figure 2. Mean LMF-HRV-correlations by Day and group (Abbreviations CA, LT, NZ, SA and UK correspond to California, Lithuania, New Zealand, Saudi Arabia and United Kingdom, respectively). Note that the only day of study period where all the groups’ HRV was positively correlated with the LMF was on the day 6, which was the day of the HLI and the correlations between the HRV and LMF for all the groups were substantially higher on that day.
Applsci 11 02935 g002
Figure 3. Mean LMF-HRV-correlation by Day and group.The day with the black color indicates day 6 which is the day all the groups did the 15-min Heart Lock-In at the same time. Pairwise significance is noted by Day# labels above each bar. It can be seen, for example, that in the Lithuanian group, day 6 (HLI day) was significantly different from all other days in the study period. Day 11 was different from three of the other days (2, 6 and 8), etc.
Applsci 11 02935 g003
Figure 4. The results of a repeated measures (within-subjects) ANOVA test assessing differences in the coherence score for all five groups during 15-min periods before (T1), during (T2) and after (T3) using the Heart lock-In technique (* corresponds to p < 0.05, ** corresponds to p < 0.001). Note that a coherence score below one is considered as low coherence, scores between one and two as medium, and scores above two as high levels of coherence. It can be seen, for example, that California’s and New Zealand’s group members’ HRV coherence was significantly higher during the HLI period than before and after the HLI period, etc.
Applsci 11 02935 g004
Figure 5. The results of a repeated measures (within-subjects) ANOVA test assessing differences in the pairwise heart rhythm synchronization for all five groups during 15-min periods before (1), during (2) and after (3) using the Heart lock-In technique (* corresponds to p < 0.05, ** corresponds to p < 0.001, *** corresponds to p < 0.0001). Note that in order to assess the pairwise heart rhythm synchronization between participants in one group, the Euclidean distance from the optimal time lag vectors of each participant to all other participants in the group was computed and mean Euclidean distance was calculated. The lower mean Euclidean distances correspond to the higher level of pairwise synchronization. It can be seen, for example, that the California’s group members’ heart rhythms were significantly more synchronized with each other during the HLI period than before and after the HLI period, etc.
Applsci 11 02935 g005
Table 1. The age and gender breakdown for all participants by country. Note that columns 2–5 display the number of participants, mean and standard deviation of their age (in years) as well as the percentage of female participants, respectively.
LocationNAge Mean, yAge SD, yGender, % Female
United Kingdom1439.212.357%
Lithuania2023.30.680%
New Zealand2242.710.150%
Saudi Arabia2020.72.650%
California2054.78.455%
All participants9636.015.158.33%
Table 2. Results of the repeated measures ANOVA test (assessing the differences in LMF-HRV-correlation) performed separately for each of the groups at each location. Note that this table shows significant differences in the mean LMF-HRV-correlation between days for each group.
NMean Sq.dfFp<Partial η 2
California170.50108.460.0010.35
Lithuania190.44109.260.0010.34
New Zealand210.40106.220.0010.24
Saudi Arabia190.18102.620.010.13
United Kingdom110.18102.880.010.22
Table 3. Results of the correlation coefficient statistical significance test (* p < 0.05, ** p < 0.01, *** p < 0.001). It can be noted that mean LMF-HRV-synchronization on day 6 (HLI day) was significantly different from zero for all five groups.
California
Day28-February1-March2-March3-March4-March5-March6-March7-March8-March9-March10-March
Correlation−0.297−0.056−0.0680.058−0.1390.3350.115−0.070−0.1270.0170.088
p value0.000 ***0.3420.2510.3290.019 *0.000 ***0.0530.2360.031 *0.7710.139
Lithuania
Day28-February1-March2-March3-March4-March5-March6-March7-March8-March9-March10-March
Correlation0.001−0.214−0.051−0.004−0.0960.320−0.074−0.201−0.146−0.1010.047
p value0.9830.000 ***0.3910.9520.1040.000 ***0.2120.001 ***0.013 *0.0880.430
New Zealand
Day28-February1-March2-March3-March4-March5-March6-March7-March8-March9-March10-March
Correlation0.094−0.056−0.092−0.0560.1280.3660.075−0.041−0.073−0.071−0.056
p value0.1140.3450.1200.3480.031 *0.000 ***0.2050.4950.2200.2320.344
Saudi Arabia
Day28-February1-March2-March3-March4-March5-March6-March7-March8-March9-March10-March
Correlation−0.114−0.0330.017−0.0440.0050.183−0.137−0.0830.0450.114−0.043
p value0.0540.5740.7690.4550.9280.002 **0.020 *0.1610.4460.0530.469
United Kingdom
Day28-February1-March2-March3-March4-March5-March6-March7-March8-March9-March10-March
Correlation0.042−0.096−0.1250.1280.0100.2540.090−0.184−0.1380.0540.086
p value0.4810.1060.034 *0.031 *0.8700.000 ***0.1300.002 **0.019 *0.3640.148
Table 4. Post hoc test for all pairwise comparisons of LMF-HRV-correlation mean between days for the California’s group (* p < 0.05, ** p < 0.01, *** p < 0.001).
Day28-February1-March2-March3-March4-March5-March6-March7-March8-March9-March10-March
28-February 0.260.240.360.160.66 ***0.43 *0.230.170.330.38 *
1-March−0.26 −0.030.1−0.110.40 *0.17−0.03−0.090.070.12
2-March−0.240.03 0.13−0.080.42 ***0.19−0.01−0.060.10.15
3-March−0.36−0.1−0.13 −0.210.30.07−0.13−0.19−0.030.02
4-March−0.160.110.080.21 0.50 ***0.270.070.020.180.23
5-March−0.66 ***−0.40 *−0.42 ***−0.3−0.50 *** −0.23−0.43 *−0.49 **−0.33−0.28
6-March−0.43 *−0.17−0.19−0.07−0.270.23 −0.2−0.26−0.1−0.05
7-March−0.230.030.010.13−0.070.43 *0.2 −0.060.10.15
8-March−0.170.090.060.19−0.020.49 **0.260.06 0.160.21
9-March−0.33−0.07−0.10.03−0.180.330.1−0.1−0.16 0.05
10-March−0.38 *−0.12−0.15−0.02−0.230.280.05−0.15−0.21−0.05
Table 5. Post hoc test for all pairwise comparisons of LMF-HRV-correlation mean between days for the Lithuania’s group (* p < 0.05, ** p < 0.01, *** p < 0.001).
Day28-February1-March2-March3-March4-March5-March6-March7-March8-March9-March10-March
28-February −0.21−0.030−0.10.34 **−0.07−0.2−0.17−0.090.06
1-March0.21 0.180.20.10.55 ***0.140.010.040.110.27 *
2-March0.03−0.18 0.02−0.080.37 ***−0.04−0.17−0.14−0.060.09
3-March0−0.2−0.02 −0.10.35 ***−0.06−0.19−0.16−0.090.07
4-March0.1−0.10.080.1 0.45 **0.04−0.09−0.060.010.17
5-March−0.34 **−0.55 ***−0.37 ***−0.35 ***−0.45 ** −0.41 **−0.54 ***−0.51 ***−0.43 ***−0.28 *
6-March0.07−0.140.040.06−0.040.41 ** −0.13−0.1−0.020.13
7-March0.2−0.010.170.190.090.54 ***0.13 0.030.10.26 *
8-March0.17−0.040.140.160.060.51 ***0.1−0.03 0.070.23
9-March0.09−0.110.060.09−0.010.43 ***0.02−0.1−0.07 0.16
10-March−0.06−0.27 *−0.09−0.07−0.170.28 *−0.13−0.26 *−0.23−0.16
Table 6. Post hoc test for all pairwise comparisons of LMF-HRV-correlation mean between days for the New Zealands’s group (* p < 0.05 , ** p < 0.01 ).
Day28-February1-March2-March3-March4-March5-March6-March7-March8-March9-March10-March
28-February −0.15−0.19−0.150.030.27−0.02−0.13−0.17−0.17−0.15
1-March0.15 −0.0400.180.420.130.02−0.02−0.020
2-March0.190.04 0.040.220.46 **0.170.050.020.020.04
3-March0.150−0.04 0.180.42 **0.130.02−0.02−0.020
4-March−0.03−0.18−0.22−0.18 0.24−0.05−0.17−0.2−0.2−0.18
5-March−0.27−0.42−0.46 **−0.42 **−0.24 −0.29−0.41 *−0.44 **−0.44 **−0.42 *
6-March0.02−0.13−0.17−0.130.050.29 −0.12−0.15−0.15−0.13
7-March0.13−0.02−0.05−0.020.170.41 *0.12 −0.03−0.03−0.02
8-March0.170.02−0.020.020.20.44 **0.150.03 00.02
9-March0.170.02−0.020.020.20.44 **0.150.030 0.02
10-March0.150−0.0400.180.42 *0.130.02−0.02−0.02
Table 7. Post hoc test for all pairwise comparisons of LMF-HRV-correlation mean between days for the Saudi Arabia’s group (* p < 0.05 ).
Day28-February1-March2-March3-March4-March5-March6-March7-March8-March9-March10-March
28-February 0.110.150.110.140.3100.060.170.260.11
1-March−0.11 0.0400.040.2−0.1−0.050.070.160
2-March−0.15−0.04 −0.04−0.010.16−0.15−0.090.030.11−0.04
3-March−0.1100.04 0.040.21−0.1−0.050.070.160.01
4-March−0.14−0.040.01−0.04 0.17−0.14−0.080.030.12−0.03
5-March−0.31−0.2−0.16−0.21−0.17 −0.31 *−0.25−0.14−0.05−0.2
6-March00.10.150.10.140.31 * 0.060.170.260.11
7-March−0.060.050.090.050.080.25−0.06 0.110.20.05
8-March−0.17−0.07−0.03−0.07−0.030.14−0.17−0.11 0.09−0.06
9-March−0.26−0.16−0.11−0.16−0.120.05−0.26−0.2−0.09 −0.15
10-March−0.1100.04−0.010.030.2−0.11−0.050.060.15
Table 8. Post hoc test for all pairwise comparisons of LMF-HRV-correlation mean between days for the United Kingdom’s group (* p < 0.05 ).
Day28-February1-March2-March3-March4-March5-March6-March7-March8-March9-March10-March
28-February −0.12−0.150.08−0.030.230.07−0.21−0.140.010.06
1-March0.12 −0.030.20.090.350.18−0.09−0.020.130.18
2-March0.150.03 0.230.120.380.22−0.060.010.160.21
3-March−0.08−0.2−0.23 −0.110.15−0.02−0.29−0.22−0.08−0.02
4-March0.03−0.09−0.120.11 0.260.1−0.18−0.10.040.09
5-March−0.23−0.35−0.38−0.15−0.26 −0.17−0.44 *−0.37−0.23−0.17
6-March−0.07−0.18−0.220.02−0.10.17 −0.27−0.2−0.060
7-March0.210.090.060.290.180.44 *0.27 0.070.220.27
8-March0.140.02−0.010.220.10.370.2−0.07 0.140.2
9-March−0.01−0.13−0.160.08−0.040.230.06−0.22−0.14 0.06
10-March−0.06−0.18−0.210.02−0.090.170−0.27−0.2−0.06
Table 9. The results of a repeated measures (within-subjects) ANOVA test assessing differences in the coherence score for all five groups during 15-min periods before (1), during (2) and after (3) using the Heart lock-In technique (a—Mauchly’s Test of Sphericity was violated, Greenhouse-Geisser df correction applied; b—Adjustment for multiple comparisons: Bonferroni). Note that a coherence score below one is considered as low coherence, scores between one and two as medium, and scores above two as high levels of coherence. It can be seen, for example, that California’s and New Zealand’s group members’ HRV coherence was significantly higher during the HLI period than before and after the HLI period, etc.
Pairwise Comparisons b
Group NMeanLower
95% CI
Upper
95% CI
dfMean
Square
Fp< η 2 p<
1 vs. 2
p<
1 vs. 3
p<
2 vs. 3
UK1 Before91.651.381.921.05 a7.494.34ns0.35 ---
2 During92.671.373.96
3 After91.431.261.60
LT1 Before191.301.171.421.196 a2.236.650.050.27 nsns0.05
2 During191.701.382.03
3 After191.211.101.32
NZ1 Before191.331.181.481.389 a4.2513.300.0010.43 0.01ns0.01
2 During192.051.652.45
3 After191.421.211.63
SA1 Before111.271.101.451.097 a3.024.32ns0.30 ---
2 During111.971.272.67
3 After111.321.121.53
CA1 Before111.401.051.761.086 a18.8521.520.0010.68 0.01ns0.01
2 During113.092.213.96
3 After111.431.211.65
Table 10. The results of a repeated measures (within-subjects) ANOVA test assessing differences in the pairwise heart rhythm synchronization for all five groups during 15-min periods before (1), during (2) and after (3) using the Heart lock-In technique (a—Mauchly’s Test of Sphericity was violated, Greenhouse-Geisser df correction applied; b—Adjustment for multiple comparisons: Bonferroni). Note that in order to assess the pairwise heart rhythm synchronization between participants in one group, the Euclidean distance from the optimal time lag vectors of each participant to all other participants in the group was computed and mean Euclidean distance was calculated. The lower mean Euclidean distances correspond to the higher level of pairwise synchronization. It can be seen, for example, that the California’s group members’ heart rhythms were significantly more synchronized with each other during the HLI period than before and after the HLI period, etc.
Pairwise Comparisons b
Group NMeanLower
95% CI
Upper
95% CI
dfMean
Square
Fp< η 2 p<
1 vs. 2
p<
1 vs. 3
p<
2 vs. 3
UK1 Before828.6424.3832.902390.0016.730.0010.71 0.01ns.0.001
2 During817.2814.5420.02
3 After829.9926.1733.81
LT1 Before1619.5118.1220.901.2 a2128.9652.900.0010.78 ns.0.0010.001
2 During1618.0516.3119.80
3 After1634.2130.3738.05
NZ1 Before1941.4938.7344.262777.3618.340.0010.51 0.0010.001ns
2 During1930.0926.3933.79
3 After1930.7828.4033.15
SA1 Before1131.5328.6334.422294.6316.480.0010.62 0.001ns0.01
2 During1122.6719.3625.98
3 After1131.7428.5534.93
CA1 Before1126.5223.2529.792233.9418.380.0010.65 0.05ns0.001
2 During1121.2117.9824.43
3 After1130.3927.8732.91
Publisher’s Note: MDPI stays neutral with regard to jurisdictional claims in published maps and institutional affiliations.