Article

Damage Detection of Carbon Nanotube Cementitious Composites Using Thermal and Electrical Resistance Properties

1
Department of Civil Engineering, Chosun University, Gwangju 61452, Korea
2
Department of Civil Engineering, Kyung Hee University, Yongin 17104, Korea
*
Author to whom correspondence should be addressed.
Appl. Sci. 2021, 11(7), 2955; https://doi.org/10.3390/app11072955
Submission received: 10 February 2021 / Revised: 9 March 2021 / Accepted: 22 March 2021 / Published: 25 March 2021
(This article belongs to the Special Issue Carbon-Nanomaterial-Enhanced Cementitious Composites)

Abstract

:
This study aimed to detect damage based on thermal and electrical resistance properties by fabricating composites in which multi-walled carbon nanotubes (MWCNTs) and cement-based materials are mixed. The experimental parameters used were the cement-based material type, MWCNT concentration, curing period, and presence of damage. The experimental results showed that damage in cement paste can be detected using the heat property at every MWCNT concentration, and damage in mortar can be detected at MWCNT concentrations of ≤0.25 wt%. However, damage to concrete is difficult to detect using the heat property. Damage to cement paste, mortar, and concrete can be detected at every concentration using the electrical resistance property. Furthermore, field emission scanning electron microscopy (FE-SEM) results revealed uniformly dispersed MWCNTs inside the composites without agglomeration or the formation of carbon nanotube (CNT) networks.

1. Introduction

Concrete structures are aging quickly owing to abnormal climate caused by global warming and other external factors, which reduce the strength of such structures and result in damage. The concrete damage detection method currently used poses a risk of different interpretations of the evaluation results depending on the concrete material, structure, external environment, and craftsmanship of the workers. To address this problem, a new concrete damage detection method based on the mixing of nanomaterials is investigated in this study.
Nanomaterials are widely used because of their extremely small size and diameter 0.1 (100 nm), which provide them with a large surface area per unit volume and various advantages [1,2]. Nanomaterials can be used in the construction field by introducing nanotechnology to existing construction materials [3,4,5,6,7]. The introduction of nanotechnology is expected to convert cement-based materials into new construction materials with various advantages such as mechanical, electrical, and thermal functions. Among the various nanomaterials, carbon nanotubes (CNTs), which are carbon-based materials, have a high electrical conductivity of 6000–10,000 S/cm, which is similar to that of copper, and a high thermal conductivity of 3000–6600 W/m·K, which is similar to that of diamond. The mixture of existing cement-based materials and CNTs has been extensively researched both domestically and internationally in the development of new construction composite materials with diverse performances [8,9,10,11,12,13,14].
Studies on cement composites mixed with CNTs with mechanical, electrical, and thermal properties have been conducted to enhance the strength, electrical conductivity, and heating ability and to measure the degree of damage.
Among the studies on electrical conductivity and heating properties, Nan et al. [15] formulated the relationship between the CNTs and the thermal conductivity of a cement composite mixed with such components. Li et al. [16] studied the electrical resistance and pressure sensitivity of a CNT–cement composite mixed with sulfuric acid and nitric acid. The dimensions of the cement composite were 40 × 160 × 40 mm, and the mixture ratio of sulfuric to nitric acid was set as a parameter. The field emission scanning electron microscopy (FE-SEM) analysis results showed that the CNTs were uniformly distributed in both the CNT composite mixed with sulfuric acid and nitric acid and an unmixed CNT composite, thus confirming the formation of a CNT network. The electrical resistance of the CNT–cement composite decreased significantly owing to the effect of the CNT network, and the pressure sensitivity was higher in the CNTs mixed with both sulfuric acid and nitric acid. Zhang et al. [17] studied a road de-icing system using the heating property of a cement composite mixed with multi-walled carbon nanotubes (MWCNTs) by conducting ice-melting experiments at subzero temperatures. When 3 wt% MWCNT is added, a road de-icing system can be achieved by generating a layer with a thermal conductivity of 2.83 W/mK. In addition, Saafi et al. [18] inspected the electrical properties according to the MWCNT concentration of a cement composite mixed with fly-ash-based geopolymers and MWCNTs. The MWCNT concentration was relative to the cement weight, and the electrical properties improved as the concentration increased, although the MWCNTs agglomerated at 1.0 wt%. Kim et al. [19] explored the compressive strength and resistance properties of a cement composite mixed with silica fume and CNTs. The composite was fabricated with dimensions of 25 × 26 × 150 mm, and the silica fume and CNT concentrations were set as parameters. The experimental results showed that the aggregated CNTs decomposed to small sizes owing to the effect of the silica fume in the cement composite mixed in small amounts along with the CNTs. Accordingly, their compressive strength and electrical resistance properties were improved. Kim et al. [20] analyzed the heating properties of cement composites with the CNT concentration as a parameter. The CNT concentrations applied were 0.3, 0.6, 1.0, and 2.0 wt% of the cement weight, and the composite dimensions were 50 × 50 × 50 mm. For the composite with 2.0 wt% CNT, the heating value increased by 67.8 °C when 10 V was applied, and the heating property improved as the CNT concentration increased. García et al. [21] evaluated the electrical conductivities of various cement composites mixed with MWCNTs. The types of cement composites included cement paste, mortar, and concrete, and the MWCNT concentration was within the range of 0.0–1.0 wt% with respect to the cement weight. The experimental results showed that when the same concentration was applied, the cement paste showed the highest electrical conductivity, followed by mortar and concrete. Lee et al. [22] investigated the thermal properties of cement composites using MWCNTs, with the MWCNT mixing method and the MWCNT concentration as parameters. The MWCNT mixing methods included sand coating and aqueous solution mixing. The MWCNT concentrations were 0.125 wt% and 0.25 wt% of the cement weight. The experimental results showed that the sand-coating method exhibited a heating characteristic that was twice as high as that of the aqueous-solution-mixing method, and it increased with increasing MWCNT concentration. Consequently, CNT networks were formed inside the composites, thereby improving their thermal properties. Lee et al. [23] studied the filling rate of grout in which different CNTs were mixed. The specimen dimensions were 40 × 40 × 160 mm, and the parameters were CNT type, CNT concentration, and grout filling rate. The experiments were conducted using CNT types of single-walled carbon nanotubes (SWCNTs) and MWCNTs, concentrations of 0.1 wt% and 0.2 wt% with respect to the cement weight, and filling rates of 50% and 100%. The results showed that the mixing of SWCNTs produced better heating properties than those obtained when MWCNTs were mixed at the same concentration. When MWCNTs were mixed, the heating property declined with the filling rate, and the positions of the pores were confirmed visually through thermal imaging analysis. However, when SWCNTs were mixed, it was difficult to confirm the position of the pores visually because the current tended to concentrate at the positive (+) pole.
Regarding damage detection research, Han et al. [24] fabricated MWCNT–cement composites with water content as a parameter and examined the piezoresistivity. The piezoresistivity increased with the water content but decreased when the water content exceeded 3.3%. Galao et al. [25] examined strain–sensing properties by mixing carbon nanofibers (CNFs) with cement. The specimen dimensions were 40 × 40 × 160 mm, and the parameters were the CNF concentration with respect to the cement weight and curing time. The test results showed that the strain–sensing properties increased with increasing CNF concentration. The strain–sensing properties were not observed after 7 d of curing; however, the strain–sensing properties could be verified after 28 d of curing. Konst and Aza et al. [26] fabricated composites in which MWCNTs and CNFs were mixed and examined their electrical properties and piezoresistive sensitivity. For the resistance property experiment, four electrodes were used with a water–cement ratio of 30%. The experimental parameters were the MWCNT and CNF concentrations with respect to the cement weight. According to the experimental results, the composite mixed with 0.1 wt% CNT and CNF showed the lowest resistance and the highest piezoresistive sensitivity, respectively. Dalla et al. [27] examined strain and damage detection by fabricating cement composites mixed with CNTs and CNFs with respect to the cement weight. They conducted three-point bending tests with the mixing concentration fixed at 0.6 wt%. As a result, the resistance property of the cement composite varied owing to the damage, thus confirming the damage detection property of cement composites mixed with CNTs and CNFs.
In this study, damage detection of cementitious composites mixed with MWCNTs was conducted based on thermal and electrical resistance properties. If these properties of undamaged composites are measured in advance and then compared with those after damage, the damage can be detected. The type of cement-based material, mixing concentration, curing period, and presence of damage were chosen as the parameters. The cement-based materials included cement paste made of water and cement, mortar made of water, cement, and sand with diameters of 1 mm or less, and concrete made of water, cement, and fine aggregates with diameters of 3 mm or more. The MWCNT concentrations were set to 0.125, 0.25, and 0.5 wt% with respect to the cement weight. Curing periods of 7 and 28 d were used. The damage was simulated by forming an empty space in the center of the composites. A direct current of 60 V was applied, and a thermal imaging camera was used to determine visually the heat property and heat distribution generated by the voltage. In addition, the damage to the cementitious composites was detected by the fluctuations in the heat and electrical resistance properties owing to the damage incurred. Furthermore, the internal microstructures of the cementitious composites were analyzed using field emission scanning electron microscopy (FE-SEM).

2. Experimental Program

The selected experimental parameters are listed in Table 1. The largest category is cement-based materials, and the three types of cement-based materials were cement paste made of water and cement; mortar made of water, cement, and sand; and concrete made of water, cement, and fine aggregates. The selected MWCNT concentrations were 0.125, 0.25, and 0.5 wt% with respect to the cement weight, respectively, and the curing periods were 7 and 28 d.
Figure 1 shows the nomenclature of the composites. The first part of the specimen name indicates the cement-based material type. “CP” represents cement paste made of water and cement, “M” represents mortar made of water, cement, and sand of 1 mm or smaller in diameter, and “Co” represents concrete made of water, cement, and fine aggregates of 3 mm or larger in diameter. The second part indicates the MWCNT concentration with respect to the cement weight, i.e., “0.125,” “0.25,” and “0.5.” The third part indicates the number of curing days, i.e., “7D” for 7 days and “28D” for 28 days. The last part indicates the presence of damage, for which “X” represents no damage and “O” indicates that damage has occurred.
There are no standards for assessing the heat and electrical resistance properties of the composites. Therefore, as shown in Figure 2a, the composites were fabricated with dimensions of 50 × 50 × 20 mm. The damage of the composites was embodied with an empty space at the center with dimensions of 10 × 10 × 20 mm, which corresponds to 4% of the total volume of the specimen. Figure 2b shows the fabricated composite. The sands used in the mortar and concrete had diameters of 1 mm or smaller, which satisfies the standard specifications of KSL ISO 679, a specific gravity of 2.6–2.67, and a uniformity coefficient of 1.0–1.93. Ordinary Portland cement of American Society for Testing Materials Type I was used for all the composites [28,29]. MWCNTs with a purity of 99%, a diameter of 0.5–1.0 nm, a length of 100 nm to 1 cm, and in a functionalized aqueous solution state were used [30,31,32]. The MWCNT solution was dispersed using 22 kHz ultrasonic waves in a polyacrylic acid copolymer for 2 h [13,33]. The properties of the MWCNTs used in this study are listed in Table 2. The sand–cement weight ratio of the composites was set to 1:2.5, and the water–cement ratio was set to 50%. The cement paste was fabricated with 140 g of a MWCNT solution and 280 g of sand. The mortar was fabricated with 40 g of a MWCNT solution, 80 g of cement, and 200 g of sand. Finally, the concrete was fabricated with 40 g of a MWCNT solution, 80 g of cement, and 200 g of sand mixed with fine aggregates.
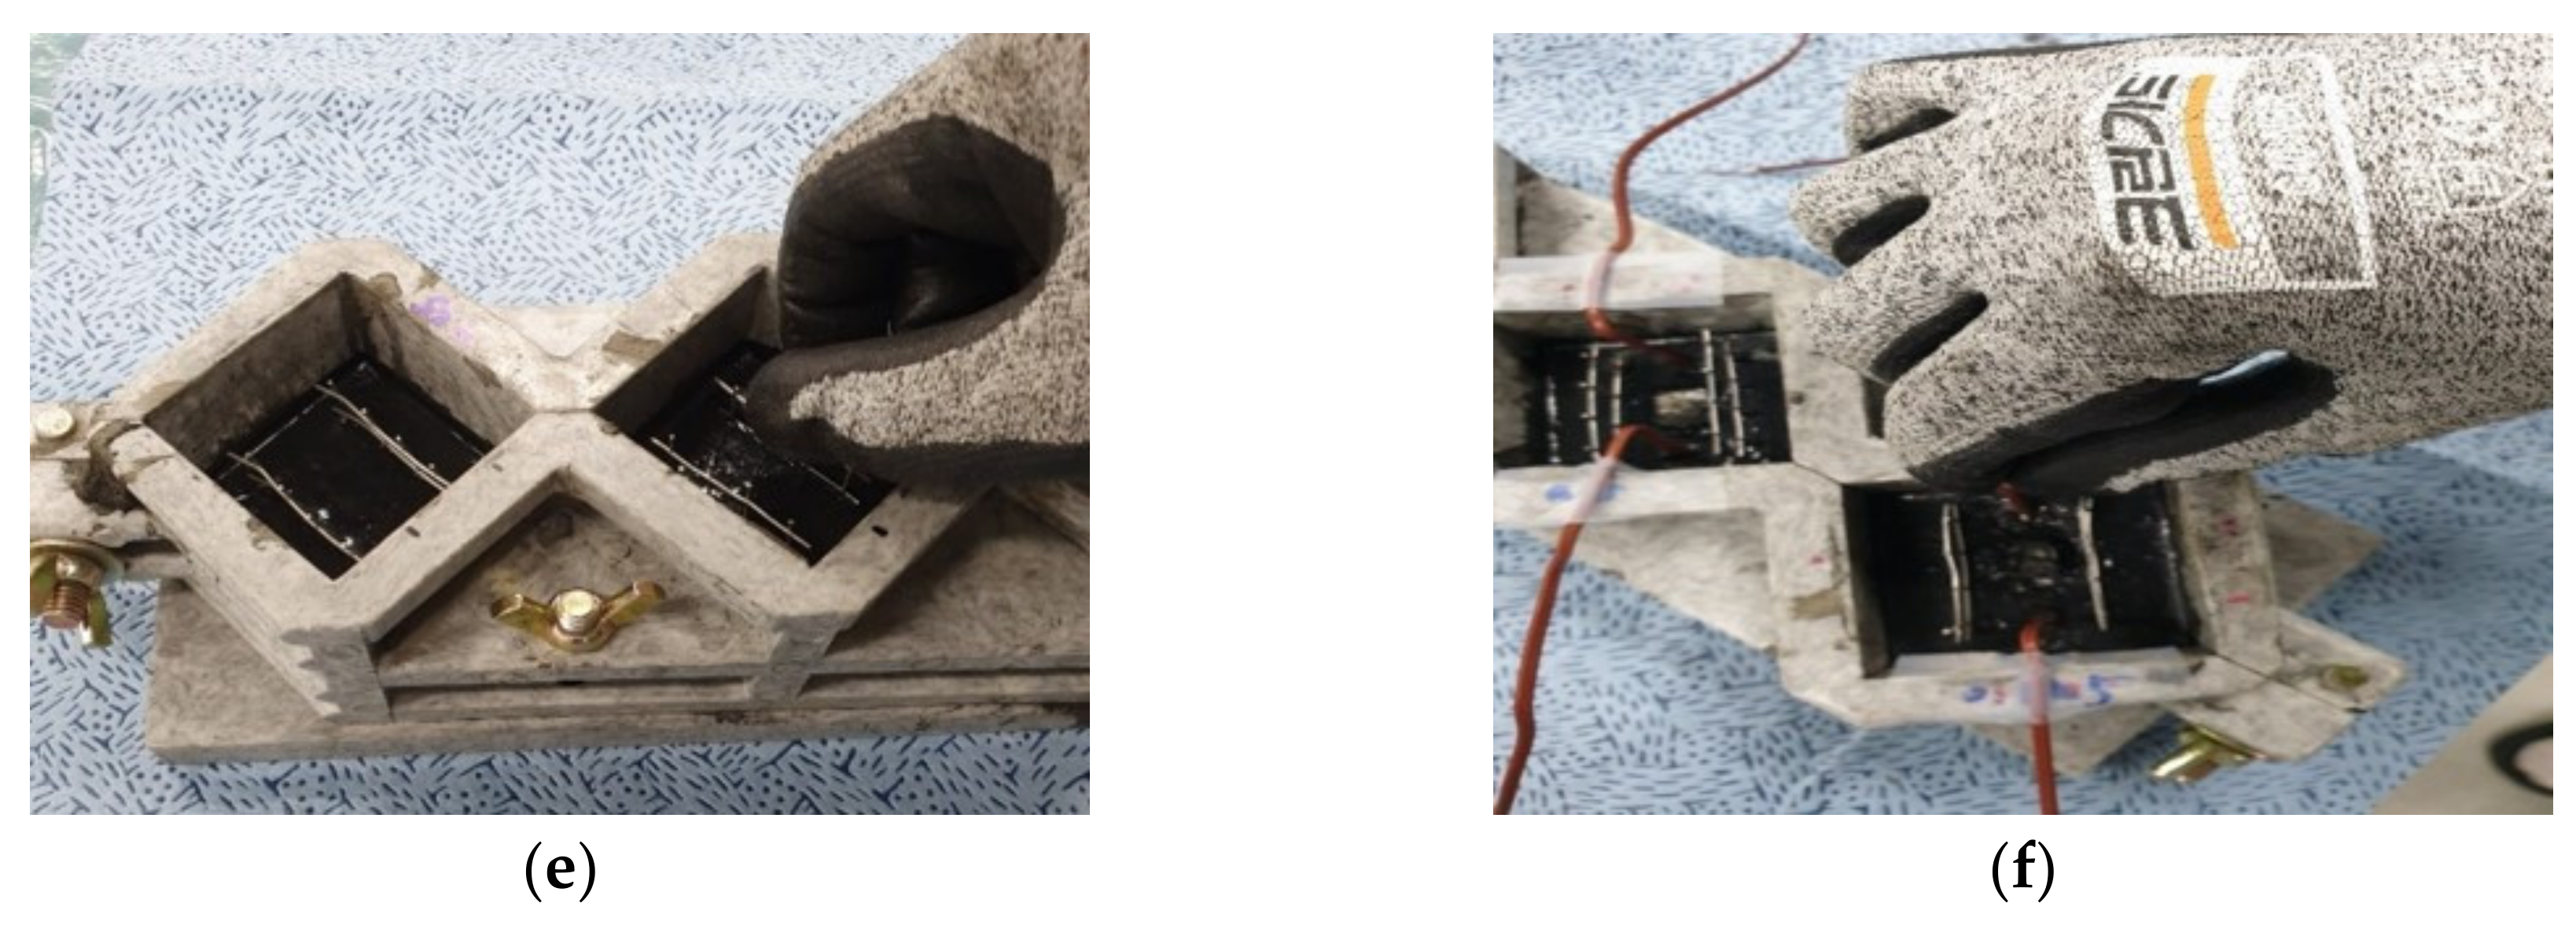
Figure 3 shows the fabrication process of the composites. The sand, cement, and MWCNT solutions used in the composites were weighed according to the mixing ratio (Figure 3a). The weighed sand and cement were dry mixed for 2 min to achieve a uniform material (Figure 3b). The MWCNTs dispersed in the solution were mixed with the dry-mixed sand and cement for 3 min (Figure 3c). The mixed paste was placed in two layers in the mold and compacted approximately 30 times for each layer (Figure 3d). For the composites with damage, a piece of Styrofoam (10 × 10 × 20 mm) was placed at the center before placing and compacting the paste. After compaction, stainless-steel meshes of 50 × 30 mm were placed at 2.5-cm intervals in the composites for applying the voltage (Figure 3e). In addition, a thermocouple was inserted at a depth of 1 cm to measure the temperature inside the composites (Figure 3f). After curing the composites for 1 d at room temperature, they were de-molded and dry cured in a dry oven at 45 °C [33]. For the specimens with damage, the Styrofoam was removed from the de-molded specimen before dry curing.
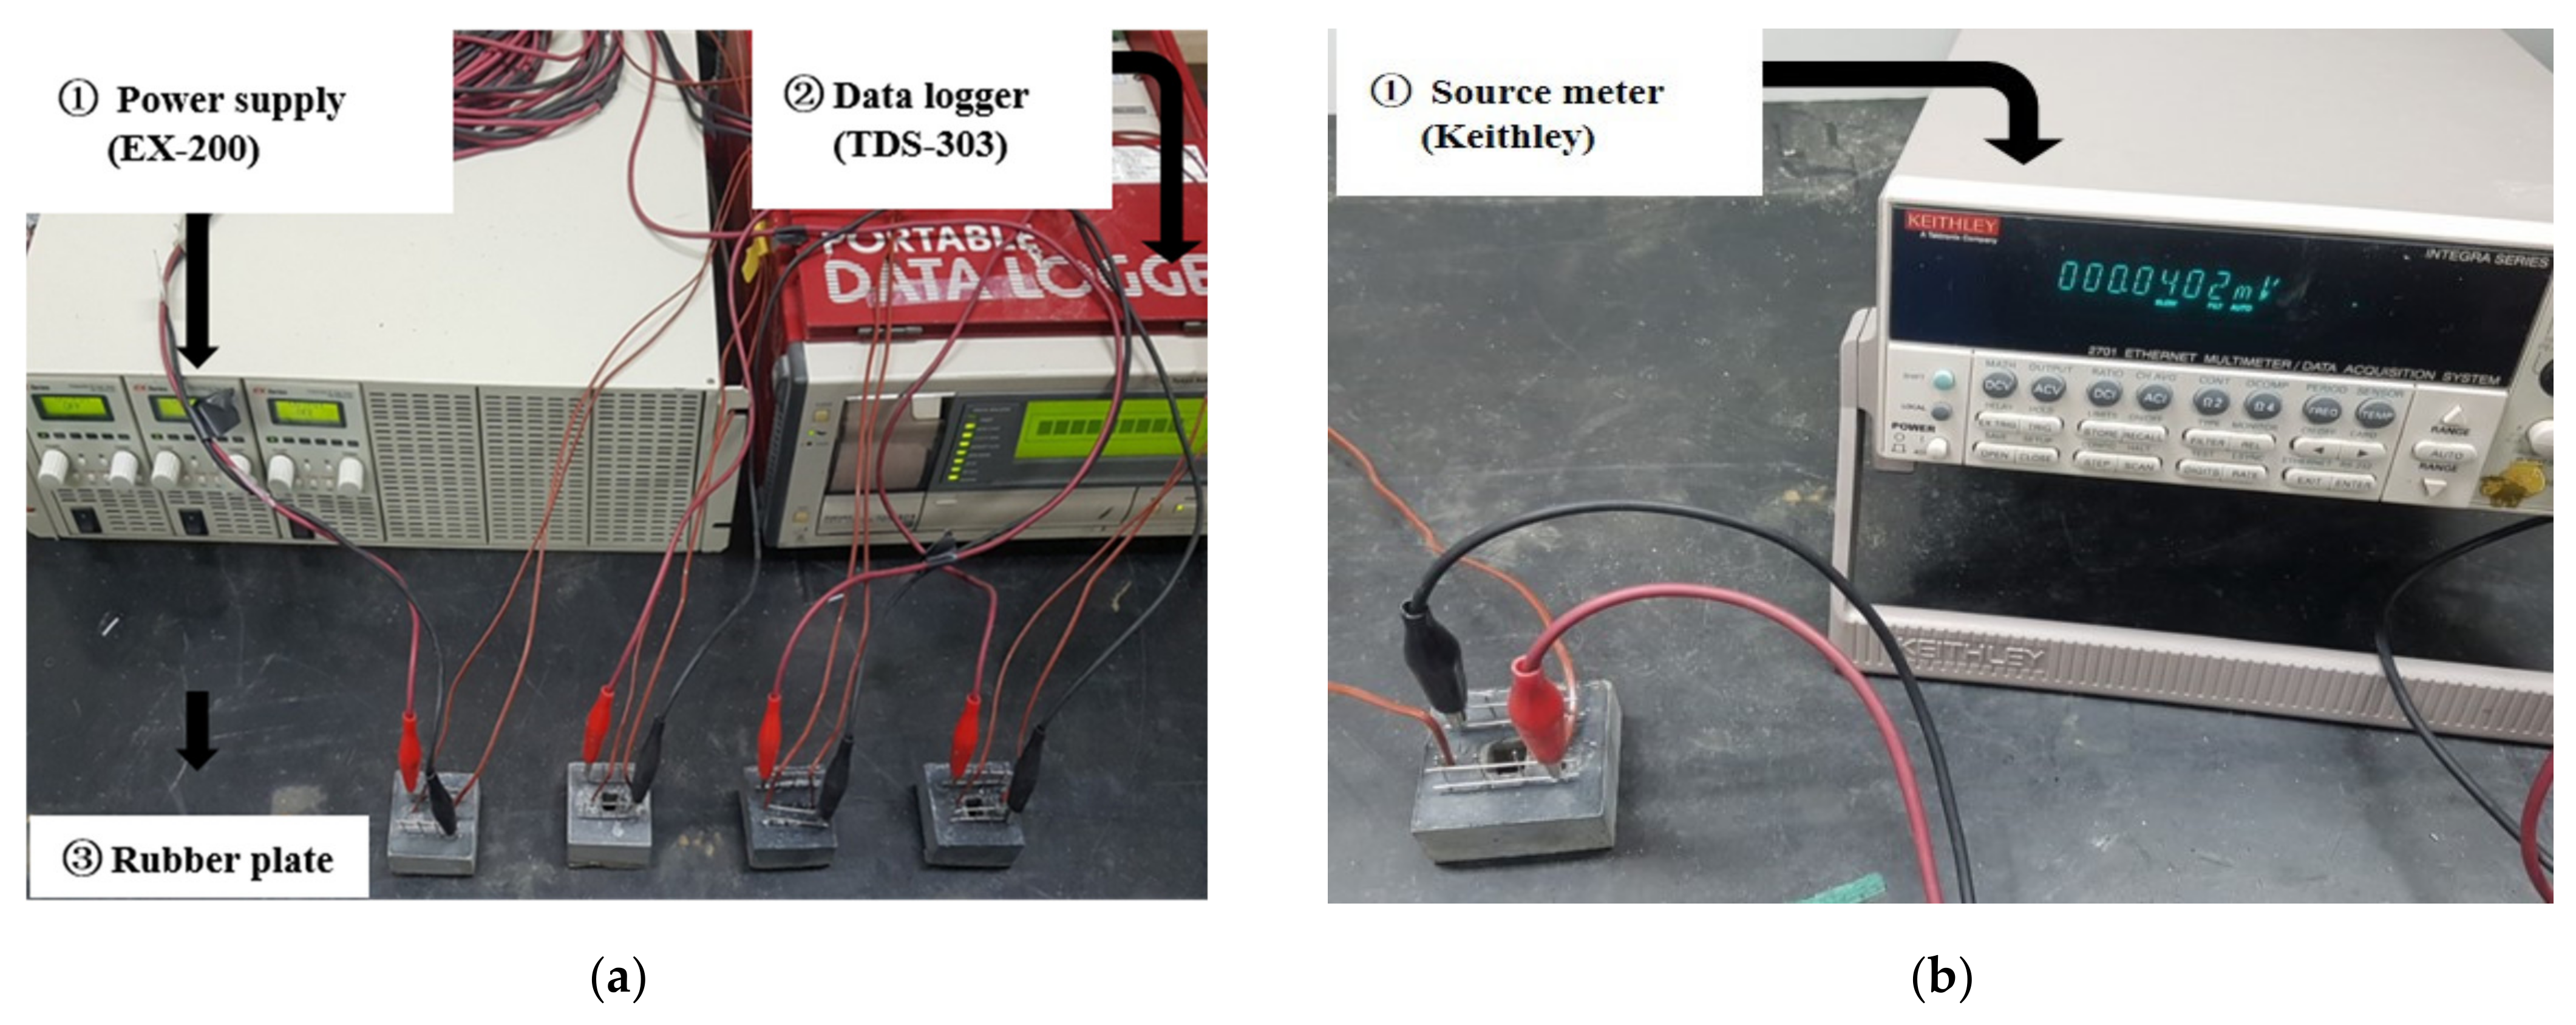
The experiment for studying the heat property was conducted by applying a voltage to the composites. As shown in Figure 4a, this was achieved by connecting the positive and negative poles of a DC power supply (EX-200) to the stainless-steel meshes inserted in the composites. A voltage of 60 V was supplied to each specimen for 60 min, which was selected because the highest temperature variation occurred at 60 V in the composites mixed with MWCNTs [34]. The temperatures of the composites generated by the applied voltage were measured by connecting the thermocouple to a static data logger (TDS-303). The experiment was conducted on an insulated rubber plate to prevent the applied current from flowing outside. A thermal image analysis of the composites was conducted when the surface reached the maximum temperature owing to the applied voltage. A digital multimeter (Keithley 2701) was used to investigate the resistance properties of the composites, as shown in Figure 4b. The electrical resistance according to the voltage was measured for 60 min by connecting the stainless-steel meshes installed in the composites with the positive and negative poles of the power supply.

3. Experimental Results

3.1. Heat Test and Thermal Imaging Analysis Results

The experiment on the heating properties was conducted using the cement-based material type, mixing concentration, curing days, and presence of damage as the parameters. Figure 5 shows the temperature variation at the center of the composites after curing for 7 d according to the type of cement-based material, mixing concentration, and presence of damage. The voltage applied to the composites was 60 V. The temperatures of the composites without damage were measured as 31.5 °C for CP-0.125-7D-X, 3.8 °C for M-0.125-7D-X, and 2.9 °C for Co-0.125-7D-X. However, the temperatures for composites with damage were 25.7 °C for CP-0.125-7D-O, 1.4 °C for M-0.125-7D-O, and 0.8 °C for Co-0.125-7D-O. Thus, the temperature gradients of the composites with damage were lower than those of the composites without damage (Figure 5a). The heat properties of the cement paste were 8.3-times better than those of mortar and 10.9-times better than those of concrete. The temperature decrease owing to the presence of damage was 5.8 °C for cement paste, 2.4 °C for mortar, and 2.1 °C for concrete. The temperature differences owing to the occurrence of damage to the mortar and concrete with 0.125 wt% MWCNT were less than 3 °C and, therefore, insignificant. Thus, damage detection based on the heat property is difficult for mortar and concrete with 0.125 wt% MWCNT. This result suggests that the cement paste with a MWCNT concentration of 0.125 wt% has excellent heating properties. Because this cement paste has no aggregates, the current increases and the heat generation is excellent.
Figure 5b shows a heating value plot according to the parameters of the composites with 0.25 wt% MWCNT. The temperatures of the cement paste generated by the applied voltage were 47.4 °C for CP-0.25-7D-X and 40.6 °C for CP-0.25-7D-O. Thus, the temperature gradients decreased by 6.8 °C owing to the occurrence of damage. The temperatures of the mortar were 12.9 °C for M-0.25-7D-X and 7.4 °C for M-0.25-7D-O. Thus, the temperature decreased by 5.5 °C owing to the damage that occurred. The maximum temperature differences of the concrete were 8.9 °C for Co-0.25-7D-X and 6.1 °C for Co-0.25-7D-O. Thus, although the temperature gradients decreased by 2.8 °C, the temperature difference of concrete was lower than that of the cement paste and mortar. It can be inferred that the mixed aggregates of cement paste and mortar are relatively smaller in size than those of concrete at 0.25 wt% MWCNT, thus increasing the number of CNT networks formed. Therefore, it was more challenging to detect damage in concrete with 0.25 wt% MWCNT than in that of cement paste and mortar.
Figure 5c shows the temperature variation of composites with 0.5 wt% MWCNT according to the parameters. The temperatures of the cement paste were 67.8 °C for CP-0.5-7D-X and 51.2 °C for CP-0.5-7D-O, and thus are up to 2.2-times higher than that of 0.125 wt% and 1.4-times higher than that of the 0.25 wt% cement paste. The temperatures of the mortar were 23.5 °C for M-0.5-7D-X and 10.1 °C for M-0.5-7D-O, and thus 1.8-times higher than that of 0.25 wt%. The temperatures of the concrete were 10.4 °C for Co-0.5-7D-X and 8.0 °C for Co-0.5-7D-O and were thus up to 2.1 °C higher than that of 0.25 wt%. The temperature differences of the composites owing to damage were 16.6 °C for cement paste, 13.4 °C for mortar, and 2.4 °C for concrete. The heating properties of each composite improved with increasing MWCNT concentration. Damage detection was feasible for cement paste and mortar, which exhibited high temperature differences exceeding 10 °C under damage conditions. However, in the case of concrete, damage detection was challenging because the temperature difference owing to such damage was less than 3 °C.
Figure 6 shows the temperature variation of the composites after 28 curing days according to the parameters. When the MWCNT concentration was 0.125 wt%, the temperatures of the cement paste were 19.6 °C for CP-0.125-28D-X and 8.2 °C for CP-0.125-28D-O. The temperatures of the mortar were 3.7 °C for M-0.125-28D-X and 1.3 °C for M-0.125-28D-O. The temperatures of the concrete were 0.8 °C for Co-0.125-28D-X and 0.4 °C for Co-0.125-28D-O (Figure 6a). Compared to the temperature variation after 7 curing days, the temperatures decreased by up to 17.5 °C for cement paste, 0.1 °C for mortar, and 2.1 °C for concrete. Damage detection was possible for cement paste because the temperature gradients decreased by 11.4 °C owing to the damage, but it was impossible for mortar and concrete because the temperature gradients decreased by only 2.4 °C and 0.4 °C, respectively, owing to the effect of moisture. These results are identical to those obtained for 7 curing days. Figure 6b shows the temperature variation of the composites with 0.25 wt% MWCNT. The temperatures of the composites without damage were 30.6 °C for CP-0.25-28D-X, 9.0 °C for M-0.25-28D-X, and 3.1 °C for Co-0.25-28D-X. The temperatures of the composites with damage were 21.8 °C for CP-0.25-28D-O, 2.5 °C for M-0.25-28D-O, and 0.8 °C for Co-0.25-28D-O. The temperature decrease owing to the damage was the largest, with 8.8 °C for cement paste, 6.5 °C for mortar, and 2.3 °C for concrete. In the case of concrete, damage could not be easily detected using the heat property because the temperature difference was lower than that obtained for cement paste and mortar. Figure 6c shows the temperature variation of the composites with 0.5 wt% MWCNT, with an applied voltage of 60 V. The temperatures of the cement paste were 42.5 °C for CP-0.5-28D-X and 31.2 °C for CP-0.5-28D-O. When compared with 7 curing days, the temperature decreased by up to 25.3 °C. The cement paste was significantly affected by moisture because 100 g of water was used during the fabrication as compared to that in mortar and concrete. The temperatures of the mortar were 16.8 °C for M-0.5-28D-X and 6.7 °C for M-0.5-28D-O and were thus 2.5-times lower than that of the cement paste. The temperature difference of the mortar owing to the damage was 10.1 °C, whereas the temperature difference was 3.3 °C lower than that for 7 curing days. The temperature of the concrete was 6.5 °C for Co-0.5-28D-X and 5.8 °C for Co-0.5-28D-O. The temperature difference owing to the occurrence of damage was 0.7 °C, which was the lowest among the 0.5 wt% composites. This is because the concrete contained aggregates that had a larger diameter than those of the cement paste and mortar, which caused the resistance to increase.
The temperature gradients of the composites according to these parameters are summarized in Table 3. Among the composites cured after 7 d, the highest temperature obtained was 67.8 °C for CP-0.5-7D-X. Likewise, among the composites cured after 28 d, CP-0.5-28D-X exhibited the highest temperature of 42.5 °C. The cement paste showed the best heat properties among the cement-based materials, followed by mortar and concrete. The cement paste exhibited the best heating property because sand or fine aggregates did not interfere with the current flow in the composite and the environment was favorable for forming a CNT network. The temperature difference owing to the presence of damage was as high as 16.6 °C for cement paste, 13.4 °C for mortar, and 2.8 °C for concrete. Damage to cement paste and mortar can be detected based on heat properties. However, damage detection is challenging for concrete because the heat characteristic is the lowest, and the difference in the heating value owing to the damage occurrence is insignificant. The heat properties of each composite improved with increasing MWCNT concentration. Furthermore, as the curing period increased, the heat properties deteriorated because the effect of moisture inside the composites was reduced.
Figure 7 shows the thermal images of the composites with 0.5 wt% MWCNT after 7 d of curing. The thermal images are images of the composite surface temperatures captured with a thermal imaging camera, based on which the heat property can be examined visually. The surface temperature was measured by adding the heating value generated by the applied voltage to the temperature of the composite before the voltage was applied. The temperature of the composites before the voltage was applied was approximately 22 °C to 25 °C. When a 60 V voltage was applied, among the composites with damage (Figure 7a), the surface temperature of CP-0.5-7D-X was the highest at 90.3 °C, whereas that of CP-0.5-7D-O was the highest at 74.2 °C. The temperature variation of the composites without damage occurred at the midpoint between the electrodes because electric currents flow along the shortest distance. In contrast, the temperature variation of the composites with damage occurred around the position where the electrode was inserted, instead of the midpoint, because an empty space was present at the center. Damage detection using thermal image analysis is feasible for cement paste because it shows a distinct difference in the thermal image according to the presence of damage. A thermal image of mortar with damage is shown in Figure 7b. When a voltage of 60 V was applied, the highest surface temperature of the mortar was 46.5 °C for M-0.5-7D-X without damage and 34.1 °C for M-0.5-7D-O with damage. The surface temperature of the mortar was 43.8 °C lower than that of the cement paste with the same MWCNT concentration, and the temperature difference owing to the presence of damage was verified through the thermal images. Figure 7c shows the results of analyzing the concrete surface temperature according to the presence of damage using a thermal imaging camera. The surface temperature of the concrete was 34.4 °C for Co-0.5-7D-X and 31.5 °C for Co-0.5-7D-O The change in the thermal image of the concrete owing to the presence of the damage was not noticeable, compared to that of cement paste and mortar.
Figure 8 shows the thermal images of composites with 0.5 wt% MWCNT after 28 d of curing. Figure 8a shows the thermal image corresponding to the highest surface temperature of the cement paste, generated by an applied voltage of 60 V. The surface temperature of the cement paste without damage was the highest at 65.5 °C for CP-0.5-28D-X, which is similar to that with 7 d of curing. The surface temperature of the cement paste with damage was 54.3 °C for CP-0.5-28D-O, which was 19.9 °C lower than that after 7 d of curing. Damage to the cement paste could be detected visually using thermal images. The difference in the thermal images of the mortar owing to the presence of damage is illustrated in Figure 8b. The surface temperature of the mortar was 40.3 °C for M-0.5-28D-X and 28.7 °C for M-0.5-28D-O, which was up to 6.2 °C lower than that obtained after 7 d of curing, and the difference in surface temperature owing to the occurrence of damage was 11.6 °C. As with the 7 d of curing, the deteriorated heat property of mortar cured for 28 d was verified visually using thermal images. Thus, damage to the mortar could be detected visually using such images. The difference in the thermal images of concrete owing to the presence of damage is illustrated in Figure 8c. The surface temperature of the concrete was 30.5 °C for Co-0.5-28D-X, which was 3.9 °C lower than that with 7 d of curing, and 29.8 °C for Co-0.5-28D-O, which was 1.7 °C lower than that with 7 curing days. Because the difference in surface temperature owing to the presence of damage was only 0.7 °C, it was difficult to verify the change in the thermal images. The damage to the concrete with MWCNTs could not be identified through a visual inspection based on thermal imaging analysis.
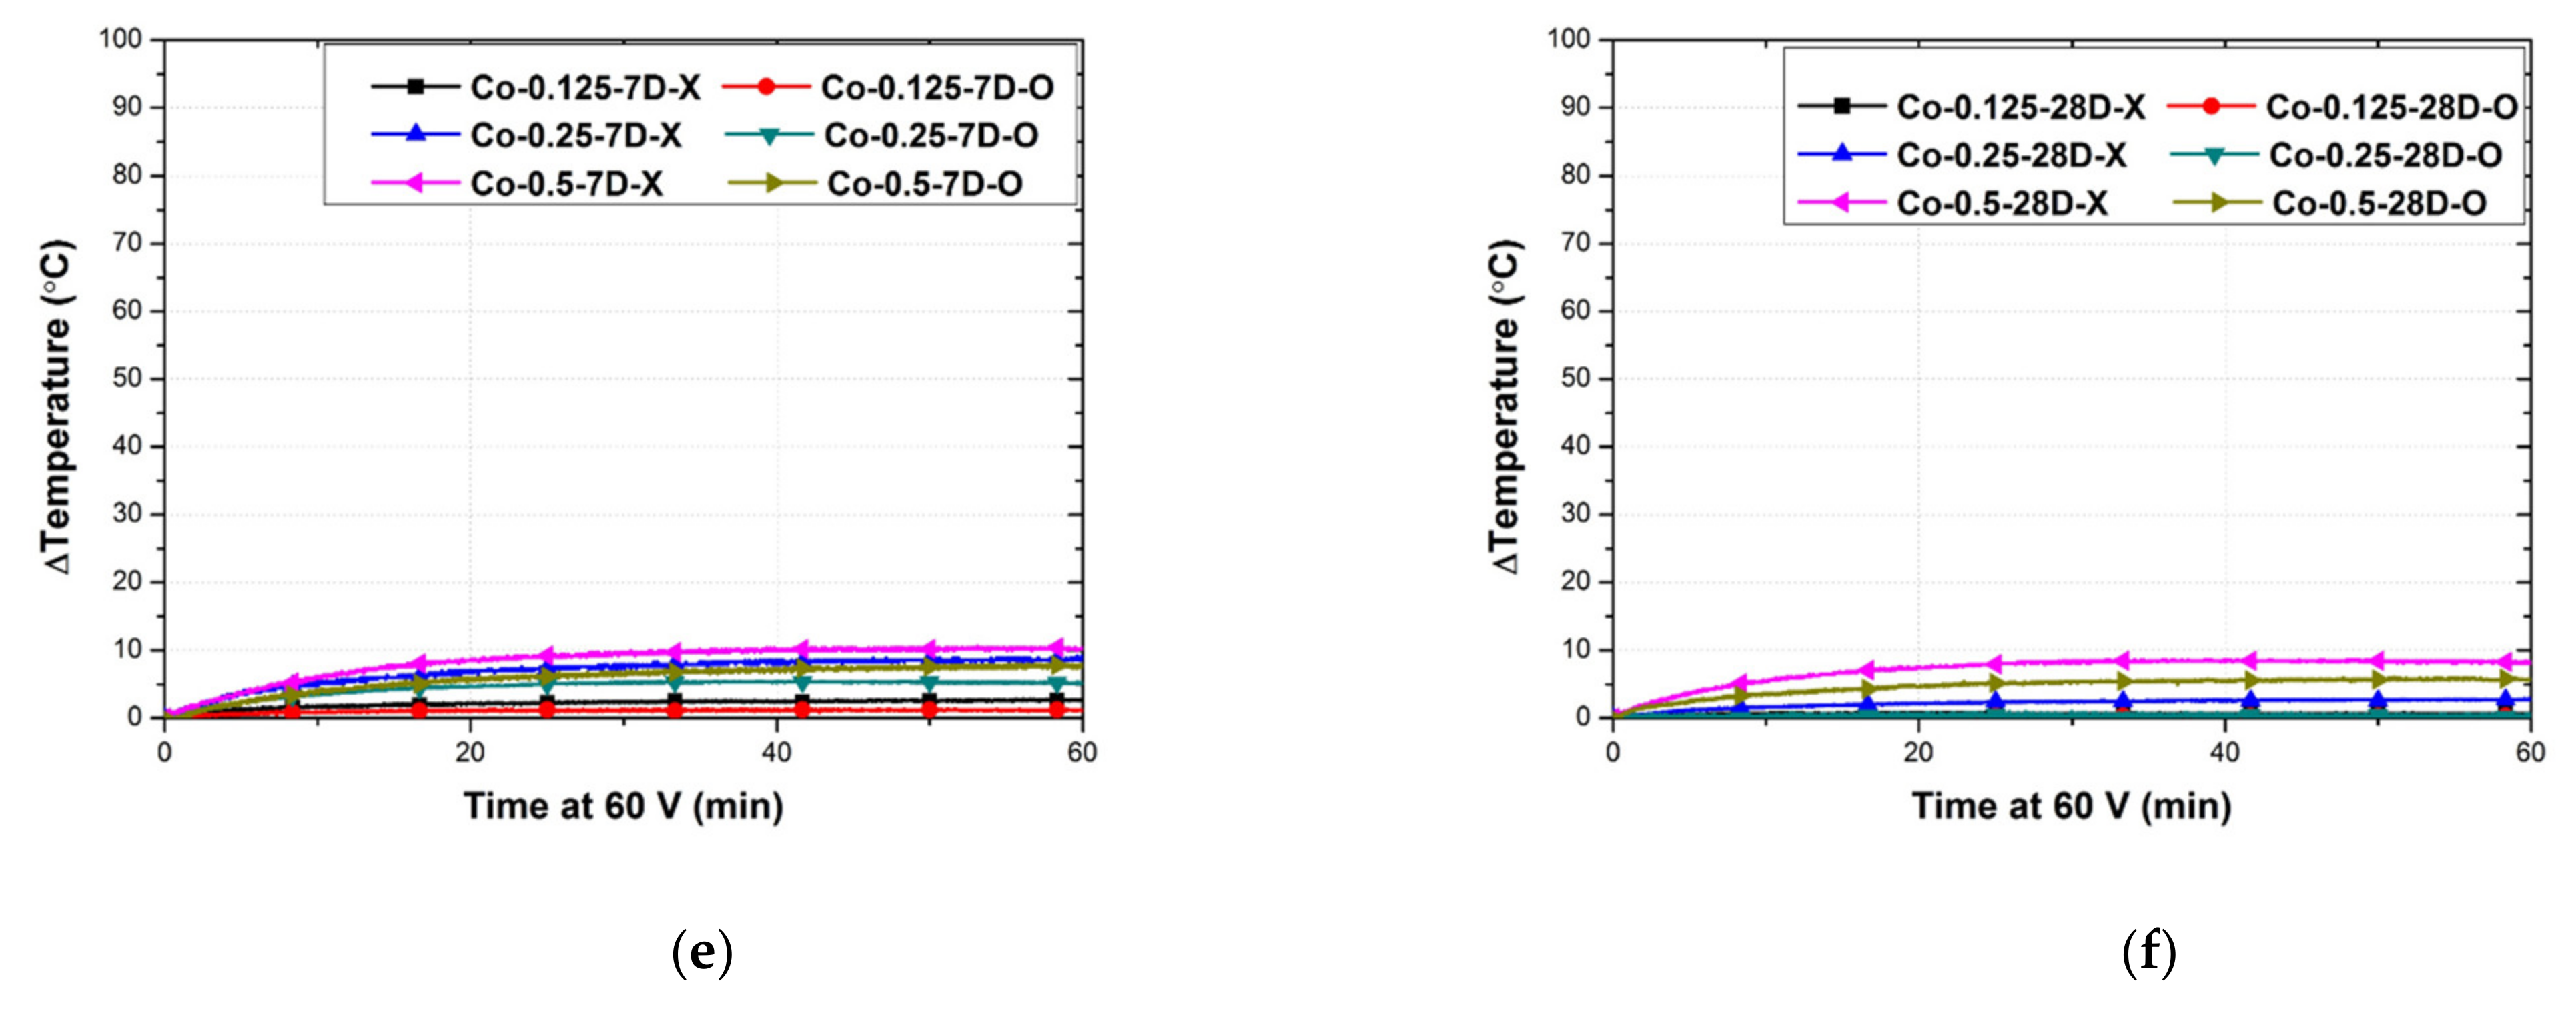
Figure 9 shows the temperature variation of the composites over time. The heat properties of each specimen were measured for 60 min, and a voltage of 60 V was applied. The plots of cement paste according to the parameters are shown in Figure 9a,b. The temperature gradient of the cement paste with 0.125 wt% MWCNT remained constant after the highest temperature. In contrast, the temperature gradients of the cement pastes with 0.25 wt% and 0.5 wt% MWCNT increased over time and decreased after the highest temperature. As shown in Figure 10, the temperature decreased because cracks were generated in the composite and the mesh became corrupt owing to the high temperature. The highest temperature and temperature gradient of the cement paste with damage decreased compared to those of the cement paste without damage. The heat property deteriorated because the length of the shortest distance path of the current increased owing to the occurrence of damage and the cross-sectional area decreased, which led to an improvement in the electrical resistance property. Furthermore, the initial temperature gradient over time and the highest temperature both increased with increasing MWCNT concentration, but both decreased as the curing period increased. After 7 d of curing, the temperature gradient of the MWCNT cementitious composites increased because the current inside the MWCNT cementitious composite could flow efficiently owing to the moisture in the composite. The temperature variations over time of the mortar with MWCNTs are shown in Figure 9c,d. The temperature gradient of the mortar decreased compared to that of the cement paste at the same concentration. However, the temperature variation of mortar over time remained constant after the highest temperature at every concentration, unlike the cement paste. The temperature reduction owing to the occurrence of damage was the greatest in M-0.5-7D-X and M-0.5-7D-O, and the temperature gradient over time also decreased. Figure 9e,f shows the temperature plot of the concrete over time, which did not decrease after the highest temperature, and the temperature gradient after 7 d of curing was higher than that after 28 curing days.

3.2. Electrical Resistance Testing

An experiment on the electrical resistance property was conducted with the type of cement-based material, mixing concentration, number of curing days, and the presence of damage as parameters. The electrical resistances of the composites according to these parameters are listed in Table 4. Figure 11 shows an electrical resistance property graph of the composites after 7 d of curing. The graph of the electrical resistance of the composites with 0.125 wt% MWCNT according to the parameters is shown in Figure 11a. The electrical resistance of the cement paste was 3.4 kΩ for CP-0.125-7D-X and 10.2 kΩ for CP-0.125-7D-O. Thus, the difference in the electrical resistance caused by damage was 6.8 kΩ. The electrical resistance of the mortar was 62.0 kΩ for M-0.125-7D-X, which is 18.2-times higher than that of cement paste, and 90.2 kΩ for M-0.125-7D-O. The difference in resistance of the mortar owing to the occurrence of damage was 28.2 kΩ, which is 4.1-times higher than that of the cement paste. The electrical resistance of the concrete was 81.0 kΩ for Co-0.125-7D-X and 118.0 kΩ for Co-0.125-7D-O. Thus, the difference in the electrical resistance owing to the presence of damage was 37.0 kΩ. The electrical resistance of concrete with 0.125 wt% MWCNT was up to 23.8-times higher than that of the cement and up to 1.3-times higher than that of the mortar. This result indicates that cement paste and mortar have higher electrical conductivities than concrete. Figure 11b shows a graph of the electrical resistance of the composites with 0.25 wt% MWCNT. The electrical resistances of the composites without damage were 1.6 kΩ for cement paste, 21.4 kΩ for mortar, and 46.0 kΩ for concrete, respectively. The resistance of the cement paste was 19.8 kΩ lower than that of mortar and 44.4 kΩ lower than that of concrete. The resistance of the composites with damage was 2.5 kΩ for cement paste, 39.2 kΩ for mortar, and 71.1 kΩ for concrete. The electrical resistance after the occurrence of damage increased by 0.9 kΩ for cement paste, 17.8 kΩ for mortar, and 25.1 kΩ for concrete. Concrete had an increased resistance owing to the large size of the aggregates in the concrete. Figure 11c shows the graphs of the electrical resistance of the cement paste, mortar, and concrete with 0.5 wt% MWCNT. The electrical resistance of the cement paste was 0.4 kΩ for CP-0.5-7D-X and 1.1 kΩ for CP-0.5-7D-O. Thus, the 0.5 wt% MWCNT–cement-paste composites exhibited up to 9.3-times higher electrical resistance than 0.125 wt% MWCNT composites and up to 4.0-times higher electrical resistances than those of 0.25 wt% MWCNT composites. The electrical resistance of mortar was 7.6 kΩ for M-0.5-7D-X and 20.5 kΩ for M-0.5-7D-O. Thus, the electrical resistance of 0.5 wt% MWCNT–cement-paste composites was up to 8.2-times lower than that of the 0.125 wt% composite and up to 2.8-times lower than that of the 0.25 wt% composite. The electrical resistance of the concrete was 35.8 kΩ for Co-0.5-7D-X and 50.5 kΩ Co-0.5-7D-O. Thus, the electrical resistance was up to 2.3-times lower than that of the 0.125 wt% composites and up to 1.4-times lower than that of the 0.25 wt% composites. The difference in electrical resistance owing to the occurrence of damage was 0.7 kΩ for cement paste, 12.9 kΩ for mortar, and 14.7 kΩ for concrete. The electrical resistance of the composites cured for 7 d decreased because of the damage that occurred as the MWCNT concentration increased. This is because the change in the resistance owing to such damage decreased as the MWCNTs with high electrical conductivities became detached, thus lowering the resistance of the composite itself.
Figure 12 shows the variation in the electrical resistance of the composites after 28 d of curing according to the parameters. Figure 12a shows the electrical resistance of the composites with 0.125 wt% MWCNT. The electrical resistances of cement paste were 7.8 kΩ for CP-0.125-28D-X and 15.2 kΩ for CP-0.5-28D-O, and the difference owing to the occurrence of damage was 7.4 kΩ. The electrical resistances of the mortar were 75.7 kΩ for M-0.125-28D-X and 110.8 kΩ for M-0.125-28D-O, which suggests a difference owing to the damage of 35.1 kΩ. The electrical resistance of concrete was 100.5 kΩ for Co-0.125-28D-X and 140.8 kΩ for Co-0.125-28D-O, which suggests that the difference owing to such damage was 40.3 kΩ, which was 3.3-kΩ higher than that for 7 d of curing. The electrical resistances of the cement paste, mortar, and concrete with 0.25 wt% MWCNT are shown in Figure 12b. The electrical resistance of the composites without damage was 3.5 kΩ for the cement paste, which was 2.2-times higher than that of the composites after 7 curing days, and 41.5 kΩ for mortar, which was 1.9-times higher than that of the composite cured for 7 d. The electrical resistance of the concrete was 51.6 kΩ, which was the highest among the composites with 0.25 wt% MWCNT and was 1.1-times higher than that of 7 curing days. The electrical resistance of composites with damage was 5.1 kΩ for cement paste, which was 1.6-kΩ higher than that for the composite without damage, and 62.8 kΩ for mortar, which was 21.3-kΩ higher than that for the composite without damage. The electrical resistance of concrete was 79.0 kΩ, and the difference in electrical resistance owing to the presence of damage was 27.4 kΩ. The electrical resistances of the composites with 0.5 wt% MWCNT were 1.8 kΩ for CP-0.5-28D-X and 3.0 kΩ for CP-0.5-28D-O. For mortar, they were 18.6 kΩ for M-0.5-28D-X and 36.2 kΩ for M-0.5-28D-O. For concrete, they were 41.2 KΩ for Co-0.5-28D-X and 58.4 kΩ for Co-0.5-28D-O (Figure 12c). When compared with the 7 d of curing, the electrical resistance increased by up to 4.5 times for cement paste, by up to 2.4 times for mortar, and by up to 1.2 times for concrete. The difference in electrical resistance owing to the presence of damage was 1.2 kΩ for cement paste, 17.6 kΩ for mortar, and 17.2 kΩ for concrete. Accordingly, the difference in electrical resistance owing to such damage decreased as the MWCNT concentration increased.
The cement paste made of cement and a MWCNT solution exhibited the lowest electrical resistance in CP-0.5-7D-X at 0.4 kΩ, which is the lowest among all the composites studied. The electrical resistance of the composite decreased as a CNT network was formed when the concentration of the electrically conductive MWCNTs increased. The increase in electrical resistance with curing time was the highest in Co-0.125-28D-O, at 24.8 kΩ, owing to the effect of the decreased moisture. The difference in electrical resistance owing to the presence of damage was 7.4 kΩ for cement paste, 35.1 kΩ for mortar, and 40.3 kΩ for concrete. The damage could be detected for cement paste and mortar using not only the heat property and thermal images but also the electrical resistance property. In contrast, damage detection for concrete was not possible using the heat property and thermal images, but it was still possible using the electrical resistance property.

3.3. Microstructure and Discussion

The internal microstructures of the cement composites were analyzed using FE-SEM, which uses a field-emission-type electron gun instead of a heat-radiation-type electron gun. Electrons were transmitted through a thin specimen, and micro images projected on a fluorescent plate were observed. Figure 13 shows the internal microstructure images of the composites with 0.5 wt% MWCNT. The red crosses in the images represent MWCNTs dispersed inside the composites. Figure 13a shows the microstructure image of the cement paste, which shows that MWCNTs were evenly distributed inside the cement paste, and multiple CNT networks were formed owing to the interconnection between the MWCNTs and cement hydrates. In addition, more CNT networks were formed because particles such as aggregates were absent inside the cement paste, unlike in the mortar and concrete. As a result, the heat and electrical resistance properties of the cement paste improved. Figure 13b,c shows the FE-SEM images of the mortar and concrete with 0.5 wt% MWCNT. These images show that cement hydrates and CNT networks were observed in the mortar and concrete, which were also observed in the cement paste. However, MWCNTs were attached to the surface of fine aggregates, and some CNT networks were not formed in the concrete, thus resulting in deteriorated heat and electrical resistance properties compared to those of the cement paste and mortar.

4. Conclusions

In this study, damage detection using heat and electrical resistance properties was conducted according to various parameters through the fabrication of different composites. The changes in the properties owing to the occurrence of damage were analyzed through heating and resistance experiments. The following conclusions were drawn.
Regarding the differences in the properties of the cement paste owing to the presence of damage, the heat property decreased by up to 2.4 times, and the electrical resistance property improved by up to a factor of 3.0. Because the unit area of the composite was reduced by the damage, the electrical resistance increased, whereas the heat property deteriorated. Furthermore, unlike the mortar and concrete, the cement paste with 0.125 wt% MWCNT clearly exhibited differences in the heat and electrical resistance properties owing to such damage. This trend demonstrates that cement paste can be used for damage detection based on the heat and electrical resistance properties, even if it contains a low concentration of MWCNTs.
The heat property of mortar deteriorated by up to 2.8 times, and the electrical resistance property improved by up to 2.7 times owing to the damage occurrence. The decrease in the mortar temperature owing to such damage was insignificant at 2.4 °C for the concentration of 0.125 wt%, although the temperature difference was high when the concentration exceeded 0.25 wt%. Therefore, it is estimated that damage to mortar can be detected based on the heat property at 0.25 wt% or higher concentrations of MWCNTs. The largest difference in the electrical resistance of mortar owing to the presence of damage was 37.0 kΩ, and this difference was high at every MWCNT concentration. Therefore, damage to mortar can be detected based on the electrical resistance property at a MWCNT concentration of 0.125 wt%.
The heat property of concrete decreased by up to 2.8 °C, and the electrical resistance property improved by up to 40.3 kΩ owing to the occurrence of damage. Because a temperature variation of below 3 °C was obtained at every MWCNT concentration in the concrete, the detection of damage in concrete using the heat property remains a challenging task. However, damage can be detected using the electrical resistance property, because, in this study, the electrical resistance of concrete increased by up to 40.3 kΩ.
As the MWCNT concentration increased, the heat properties of the composites also improved, whereas the electrical resistance decreased. This is because many CNT networks were formed inside the composite as the conductive MWCNTs increased, which improved the heat property and deteriorated the electrical resistance. As the curing period of the composites increased, the heat properties deteriorated, whereas the electrical resistance property was enhanced. The largest deterioration in the heat property was 25.3 °C for the cement paste, and the improvement in the electrical resistance property was 24.8 kΩ for concrete.
In terms of the heat and electrical resistance properties of the composites according to the type of cement-based material, the cement paste exhibited the best properties, followed by mortar and concrete. Because the cement paste did not contain sand or fine aggregates that could interfere with the current flow, it formed a favorable environment for the formation of CNT networks. Subsequently, the heat and electrical resistance properties of the composites were enhanced.
The internal microstructures of the composites were analyzed using FE-SEM. The results confirmed that MWCNTs were evenly distributed in all the composites of cement paste, mortar, and concrete mixed with MWCNTs. Furthermore, MWCNTs inside the composites formed CNT networks, which had a bridging effect and improved the heat and electrical resistance properties.

Author Contributions

Formal analysis and writing, H.L.; investigation and experiment, W.Y.; supervision and validation, W.C. All authors have read and agreed to the published version of the manuscript.

Funding

This work was supported by the Korea Agency for Infrastructure Technology Advancement (KAIA) grant funded by the Ministry of Land, Infrastructure, and Transport (Grant 20NANO-B156177-01).

Conflicts of Interest

The authors declare no conflict of interest.

References

  1. Presting, H.; König, U. Future nanotechnology developments for automotive applications. Mater. Sci. Eng. C 2003, 23, 737–741. [Google Scholar] [CrossRef]
  2. Wang, G.-F.; Tao, X.-M.; Wang, R.-X. Flexible organic light-emitting diodes with a polymeric nanocomposite anode. Nanotechnology 2008, 19, 145201. [Google Scholar] [CrossRef] [PubMed]
  3. Sanchez, F.; Sobolev, K. Nanotechnology in concrete–A review. Constr. Build. Mater. 2010, 24, 2060–2071. [Google Scholar] [CrossRef]
  4. Raki, L.; Beaudoin, J.; Alizadeh, R.; Makar, J.M.; Sato, T. Cement and Concrete Nanoscience and Nanotechnology. Materials 2010, 3, 918–942. [Google Scholar] [CrossRef] [Green Version]
  5. Pacheco-Torgal, F.; Jalali, S. Nanotechnology: Advantages and drawbacks in the field of construction and building materials. Constr. Build. Mater. 2011, 25, 582–590. [Google Scholar] [CrossRef] [Green Version]
  6. Nima, F.; Ali, A.A.A.; Demirboğa, R. Development of Nanotechnology in High Performance Concrete. Adv. Mater. Res. 2011, 364, 115–118. [Google Scholar] [CrossRef]
  7. Norhasri, M.M.; Hamidah, M.; Fadzil, A.M. Applications of using nano material in concrete: A review. Constr. Build. Mater. 2017, 133, 91–97. [Google Scholar] [CrossRef]
  8. Yu, X.; Kwon, E. A carbon nanotube/cement composite with piezoresistive properties. Smart Mater. Struct. 2009, 18, 055010. [Google Scholar] [CrossRef]
  9. Azhari, F.; Banthia, N. Cement-based sensors with carbon fibers and carbon nanotubes for piezoresistive sensing. Cem. Concr. Compos. 2012, 34, 866–873. [Google Scholar] [CrossRef]
  10. Wang, B.; Guo, Z.; Han, Y.; Zhang, T. Electromagnetic wave absorbing properties of multi-walled carbon nanotube/cement composites. Constr. Build. Mater. 2013, 46, 98–103. [Google Scholar] [CrossRef]
  11. Cerro-Prada, E.; Pacheco-Torres, R.; Varela, F. Effect of Multi-Walled Carbon Nanotubes on Strength and Electrical Properties of Cement Mortar. Materials 2020, 14, 79. [Google Scholar] [CrossRef] [PubMed]
  12. Siddique, R.; Mehta, A. Effect of carbon nanotubes on properties of cement mortars. Constr. Build. Mater. 2014, 50, 116–129. [Google Scholar] [CrossRef]
  13. Lee, H.; Jeong, S.; Park, S.; Chung, W. Enhanced mechanical and heating performance of multi-walled carbon nanotube-cement composites fabricated using different mixing methods. Compos. Struct. 2019, 225, 111072. [Google Scholar] [CrossRef]
  14. Lee, H.; Jeong, S.; Cho, S.; Chung, W. Enhanced bonding behavior of multi-walled carbon nanotube cement composites and reinforcing bars. Compos. Struct. 2020, 243, 112201. [Google Scholar] [CrossRef]
  15. Nan, C.-W.; Liu, G.; Lin, Y.; Li, M. Interface effect on thermal conductivity of carbon nanotube composites. Appl. Phys. Lett. 2004, 85, 3549–3551. [Google Scholar] [CrossRef]
  16. Li, G.Y.; Wang, P.M.; Zhao, X. Pressure-sensitive properties and microstructure of carbon nanotube reinforced cement com-posites. Cem. Concr. Compos. 2007, 29, 377–382. [Google Scholar] [CrossRef]
  17. Zhang, Q.; Li, H. Experimental investigation on the ice/snow melting performance of CNFP & MWCNT/cement-based deicing system. In Proceedings of the 6th International Workshop on Advanced Smart Materials and Smart Structures Technology, Dalian, China, 25–26 July 2011. [Google Scholar]
  18. Saafi, M.; Andrew, K.; Tang, P.L.; McGhon, D.; Taylor, S.; Rahman, M.; Yang, S.; Zhou, X. Multifunctional properties of carbon nanotube/fly ash geopolymeric nanocomposites. Constr. Build. Mater. 2013, 49, 46–55. [Google Scholar] [CrossRef]
  19. Kim, H.; Nam, I.; Lee, H. Enhanced effect of carbon nanotube on mechanical and electrical properties of cement composites by incorporation of silica fume. Compos. Struct. 2014, 107, 60–69. [Google Scholar] [CrossRef]
  20. Kim, G.M.; Naeem, F.; Kim, H.K.; Lee, H.K. Heating and heat-dependent mechanical characteristics of CNT-embedded ce-mentitious composites. Compos. Struct. 2016, 136, 162–170. [Google Scholar] [CrossRef]
  21. García-Macías, E.; d’Alessandro, A.; Castro-Triguero, R.; Pérez-Mira, D.; Ubertini, F. Micromechanics modeling of the electrical conductivity of carbon nanotube cement-matrix composites. Compos. Part B Eng. 2017, 108, 451–469. [Google Scholar] [CrossRef]
  22. Lee, H.; Song, Y.M.; Loh, K.J.; Chung, W. Thermal response characterization and comparison of carbon nanotube-enhanced cementitious composites. Compos. Struct. 2018, 202, 1042–1050. [Google Scholar] [CrossRef] [Green Version]
  23. Lee, H.; Kang, D.; Kim, J.; Choi, K.; Chung, W. Void detection of cementitious grout composite using single-walled and multi-walled carbon nanotubes. Cem. Concr. Compos. 2019, 95, 237–246. [Google Scholar] [CrossRef]
  24. Hanxun, B.; Yu, X.; Ou, J. Effect of water content on the piezoresistivity of MWNT/cement composites. J. Mater. Sci. 2010, 45, 3714–3719. [Google Scholar] [CrossRef]
  25. Galao, O.; Baeza, F.; Zornoza, E.; Garcés, P. Strain and damage sensing properties on multifunctional cement composites with CNF admixture. Cem. Concr. Compos. 2014, 46, 90–98. [Google Scholar] [CrossRef] [Green Version]
  26. Konsta-Gdoutos, M.S.; Aza, C.A. Self sensing carbon nanotube (CNT) and nanofiber (CNF) cementitious composites for real time damage assessment in smart structures. Cem. Concr. Compos. 2014, 53, 162–169. [Google Scholar] [CrossRef]
  27. Dalla, P.T.; Dassios, K.G.; Tragazikis, I.K.; Exarchos, D.A.; Matikas, T.E. Carbon nanotubes and nanofibers as strain and damage sensors for smart cement. Mater. Today Commun. 2016, 8, 196–204. [Google Scholar] [CrossRef]
  28. Korean Standards Association. KSL ISO 679, Methods of Testing Cements-Determination of Strength; Korean Standards Association: Seoul, Korea, 2011. [Google Scholar]
  29. Korean Standards Association. KSL 5201, Portland Cement; Korean Standards Association: Seoul, Korea, 2016. [Google Scholar]
  30. Sobolkina, A.; Mechtcherine, V.; Khavrus, V.; Maier, D.; Mende, M.; Ritschel, M.; Leonhardt, A. Dispersion of carbon nanotubes and its influence on the mechanical properties of the cement matrix. Cem. Concr. Compos. 2012, 34, 1104–1113. [Google Scholar] [CrossRef]
  31. Lee, H.; Park, S.; Park, S.; Chung, W. Enhanced detection systems of filling rates using carbon nanotube cement grout. Nanomaterials 2020, 10, 10. [Google Scholar] [CrossRef] [Green Version]
  32. Al-Dahawi, A.; Öztürk, O.; Emami, F.; Yıldırım, G.; Şahmaran, M. Effect of mixing methods on the electrical properties of cementitious composites incorporating different carbon-based materials. Constr. Build. Mater. 2016, 104, 160–168. [Google Scholar] [CrossRef]
  33. Lee, H.; Park, S.; Cho, S.; Chung, W. Correlation analysis of heating performance and electrical energy of multi-walled carbon nanotubes cementitious composites at sub-zero temperatures. Compos. Struct. 2020, 238, 111977. [Google Scholar] [CrossRef]
  34. Lee, H.; Yu, W.; Loh, K.J.; Chung, W. Self-heating and electrical performance of carbon nanotube-enhanced cement composites. Constr. Build. Mater. 2020, 250, 118838. [Google Scholar] [CrossRef]
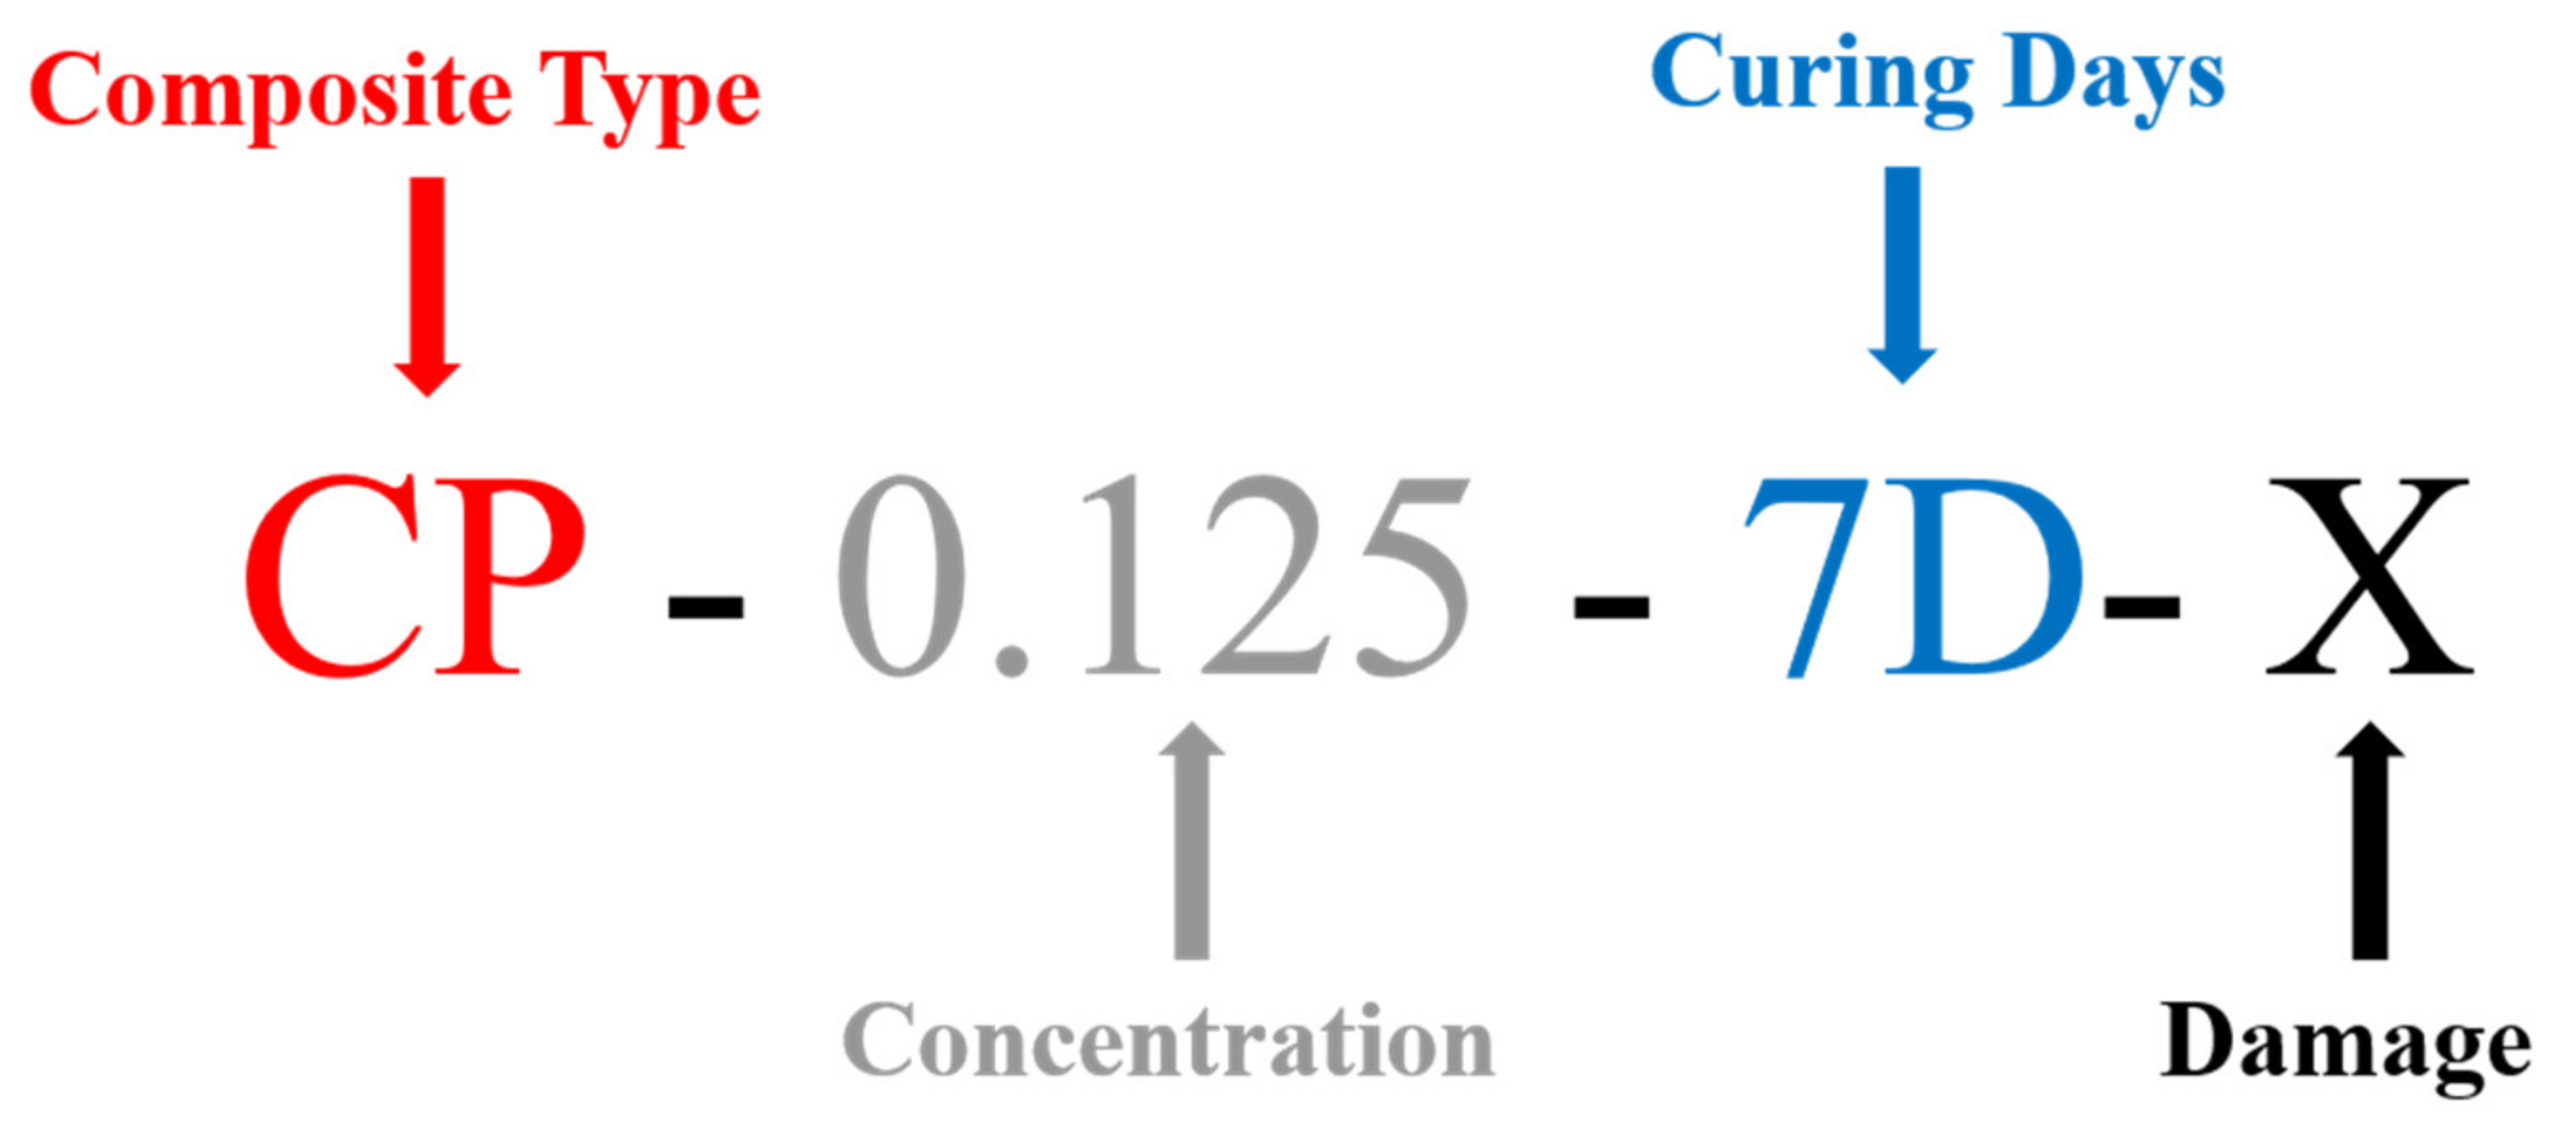
Figure 1. Specimen name.
Applsci 11 02955 g001
Figure 2. Test diagram: (a) mimetic specimen and (b) real specimen.
Applsci 11 02955 g002
Figure 3. Fabrication process: (a) measuring materials, (b) dry mixing of cement and sand, (c) carbon nanotube (CNT)-solution mixing (3 min), (d) compaction, (e) insertion of stainless-steel mesh, and (f) insertion of thermocouple.
Applsci 11 02955 g003aApplsci 11 02955 g003b
Figure 4. Experiment setup: measurements of (a) the temperature using a voltage supply and (b) the electrical resistance.
Applsci 11 02955 g004
Figure 5. Temperature variations by voltage supply for 7 curing days: (a) 0.125 wt%, (b) 0.25 wt%, and (c) 0.5 wt%.
Applsci 11 02955 g005
Figure 6. Temperature variations by voltage supply at 28 curing days: (a) 0.125 wt%, (b) 0.25 wt%, and (c) 0.5 wt%.
Applsci 11 02955 g006
Figure 7. Thermal images at 7 curing days: (a) cement paste, (b) mortar, and (c) concrete (all at 60 V).
Applsci 11 02955 g007
Figure 8. Thermal images at 28 curing days: (a) cement paste, (b) mortar, and (c) concrete (all at 60 V).
Applsci 11 02955 g008
Figure 9. Temperature–time history: (a) cement paste (curing for 7 d), (b) cement paste (curing for 28 d), (c) mortar (curing for 7 d), (d) mortar (curing for 28 d), (e) concrete (curing for 7 d), and (f) concrete (curing for 28 d).
Applsci 11 02955 g009aApplsci 11 02955 g009b
Figure 10. Crack by voltage supply.
Applsci 11 02955 g010
Figure 11. Electrical resistance at 7 d of curing: (a) 0.125 wt%, (b) 0.25 wt%, and (c) 0.5 wt%.
Applsci 11 02955 g011
Figure 12. Electrical resistance at 28 curing days: (a) 0.125 wt%, (b) 0.25 wt%, and (c) 0.5 wt%.
Applsci 11 02955 g012
Figure 13. Field emission scanning electron microscopy (FE-SEM) images: (a) 0.5 wt% cement paste, (b) 0.5 wt% mortar, and (c) 0.5 wt% concrete.
Applsci 11 02955 g013
Table 1. Parameters of cement composite temperature tests.
Specimen NameComposite TypeCuring DaysConcentration (wt%)
CP-0.125-7D-XCement paste70.125
CP-0.125-7D-O
CP-0.25-7D-X0.25
CP-0.25-7D-O
CP-0.5-7D-X0.5
CP-0.5-7D-O
CP-0.125-28D-X280.125
CP-0.125-28D-O
CP-0.25-28D-X0.25
CP-0.25-28D-O
CP-0.5-28D-X0.5
CP-0.5-28D-O
M-0.125-7D-XMortar70.125
M-0.125-7D-O
M-0.25-7D-X0.25
M-0.25-7D-O
M-0.5-7D-X0.5
M-0.5-7D-O
M-0.125-28D-X280.125
M-0.125-28D-O
M-0.25-28D-X0.25
M-0.25-28D-O
M-0.5-28D-X0.5
M-0.5-28D-O
Co-0.125-7D-XConcrete70.125
Co-0.125-7D-O
Co-0.25-7D-X0.25
Co-0.25-7D-O
Co-0.5-7D-X0.5
Co-0.5-7D-O
Co-0.125-28D-X280.125
Co-0.125-28D-O
Co-0.25-28D-X0.25
Co-0.25-28D-O
Co-0.5-28D-X0.5
Co-0.5-28D-O
Table 2. Properties of multi-walled carbon nanotubes (MWCNTs).
PropertiesCarbon NanotubeRemarks
StructureDiameter: 1~10 nm
Length: 100 nm~1 cm
-
Modulus of elasticity0.27~0.95 TPa0.1~0.14 TPa (Cement mortar)
0.2 TPa (Steel)
Tensile strength11~63 GPa0.002~0.01 GPa (Cement mortar)
1~2 GPa (Steel)
Electrical conductivity 0.17 ~ 2 × 10 5 S/cm-
Thermal conductivity3000 W/mK385 W/mK (Cu)
Purity99%-
Density 1.33   g / cm 3 7.75 ~ 8.05   g / cm 3 (Fe)
Table 3. Heating test results based on voltage supply.
Specimen NameComposite TypeCuring DaysConcentration (wt%)Temperature (°C)
CP-0.125-7D-XCement paste70.12531.5
CP-0.125-7D-O25.7
CP-0.25-7D-X0.2547.4
CP-0.25-7D-O40.6
CP-0.5-7D-X0.567.8
CP-0.5-7D-O51.2
CP-0.125-28D-X280.12519.6
CP-0.125-28D-O8.2
CP-0.25-28D-X0.2530.6
CP-0.25-28D-O21.8
CP-0.5-28D-X0.542.5
CP-0.5-28D-O31.2
M-0.125-7D-XMortar70.1253.8
M-0.125-7D-O1.4
M-0.25-7D-X0.2512.9
M-0.25-7D-O7.4
M-0.5-7D-X0.523.5
M-0.5-7D-O10.1
M-0.125-28D-X280.1253.7
M-0.125-28D-O1.3
M-0.25-28D-X0.259.0
M-0.25-28D-O2.5
M-0.5-28D-X0.516.8
M-0.5-28D-O6.7
Co-0.125-7D-XConcrete70.1252.9
Co-0.125-7D-O0.8
Co-0.25-7D-X0.258.9
Co-0.25-7D-O6.1
Co-0.5-7D-X0.510.4
Co-0.5-7D-O8.0
Co-0.125-28D-X280.1250.8
Co-0.125-28D-O0.4
Co-0.25-28D-X0.253.1
Co-0.25-28D-O0.8
Co-0.5-28D-X0.56.5
Co-0.5-28D-O5.8
Table 4. Electrical resistance results for the specimens.
Specimen NameComposite TypeCuring DaysConcentration (wt%)Resistance (KΩ)
CP-0.125-7D-XCement paste70.1253.4
CP-0.125-7D-O10.2
CP-0.25-7D-X0.251.6
CP-0.25-7D-O2.5
CP-0.5-7D-X0.50.4
CP-0.5-7D-O1.1
CP-0.125-28D-X280.1257.8
CP-0.125-28D-O15.2
CP-0.25-28D-X0.253.5
CP-0.25-28D-O5.1
CP-0.5-28D-X0.51.8
CP-0.5-28D-O3.0
M-0.125-7D-XMortar70.12562.0
M-0.125-7D-O90.2
M-0.25-7D-X0.2521.4
M-0.25-7D-O39.2
M-0.5-7D-X0.57.6
M-0.5-7D-O20.5
M-0.125-28D-X280.12575.7
M-0.125-28D-O110.8
M-0.25-28D-X0.2541.5
M-0.25-28D-O62.8
M-0.5-28D-X0.518.6
M-0.5-28D-O36.2
Co-0.125-7D-XConcrete70.12581.0
Co-0.125-7D-O118.0
Co-0.25-7D-X0.2546.0
Co-0.25-7D-O71.1
Co-0.5-7D-X0.535.8
Co-0.5-7D-O50.5
Co-0.125-28D-X280.125100.5
Co-0.125-28D-O142.8
Co-0.25-28D-X0.2551.6
Co-0.25-28D-O79.0
Co-0.5-28D-X0.541.2
Co-0.5-28D-O58.4
Publisher’s Note: MDPI stays neutral with regard to jurisdictional claims in published maps and institutional affiliations.