Effect of Hydrogen Ion Presence in Adsorbent and Solution to Enhance Phosphate Adsorption


Abstract
1. Introduction
2. Material and Methods
2.1. Chemicals
2.2. Preparation of the GAC and GACA
2.3. Physical Properties
2.4. Batch Adsorption Tests
2.5. Fixed Column Tests
2.6. Chemical Analyses
3. Results and Discussion
3.1. Characteristics of the GAC and GACA
3.2. Zeta Potential (ξ)
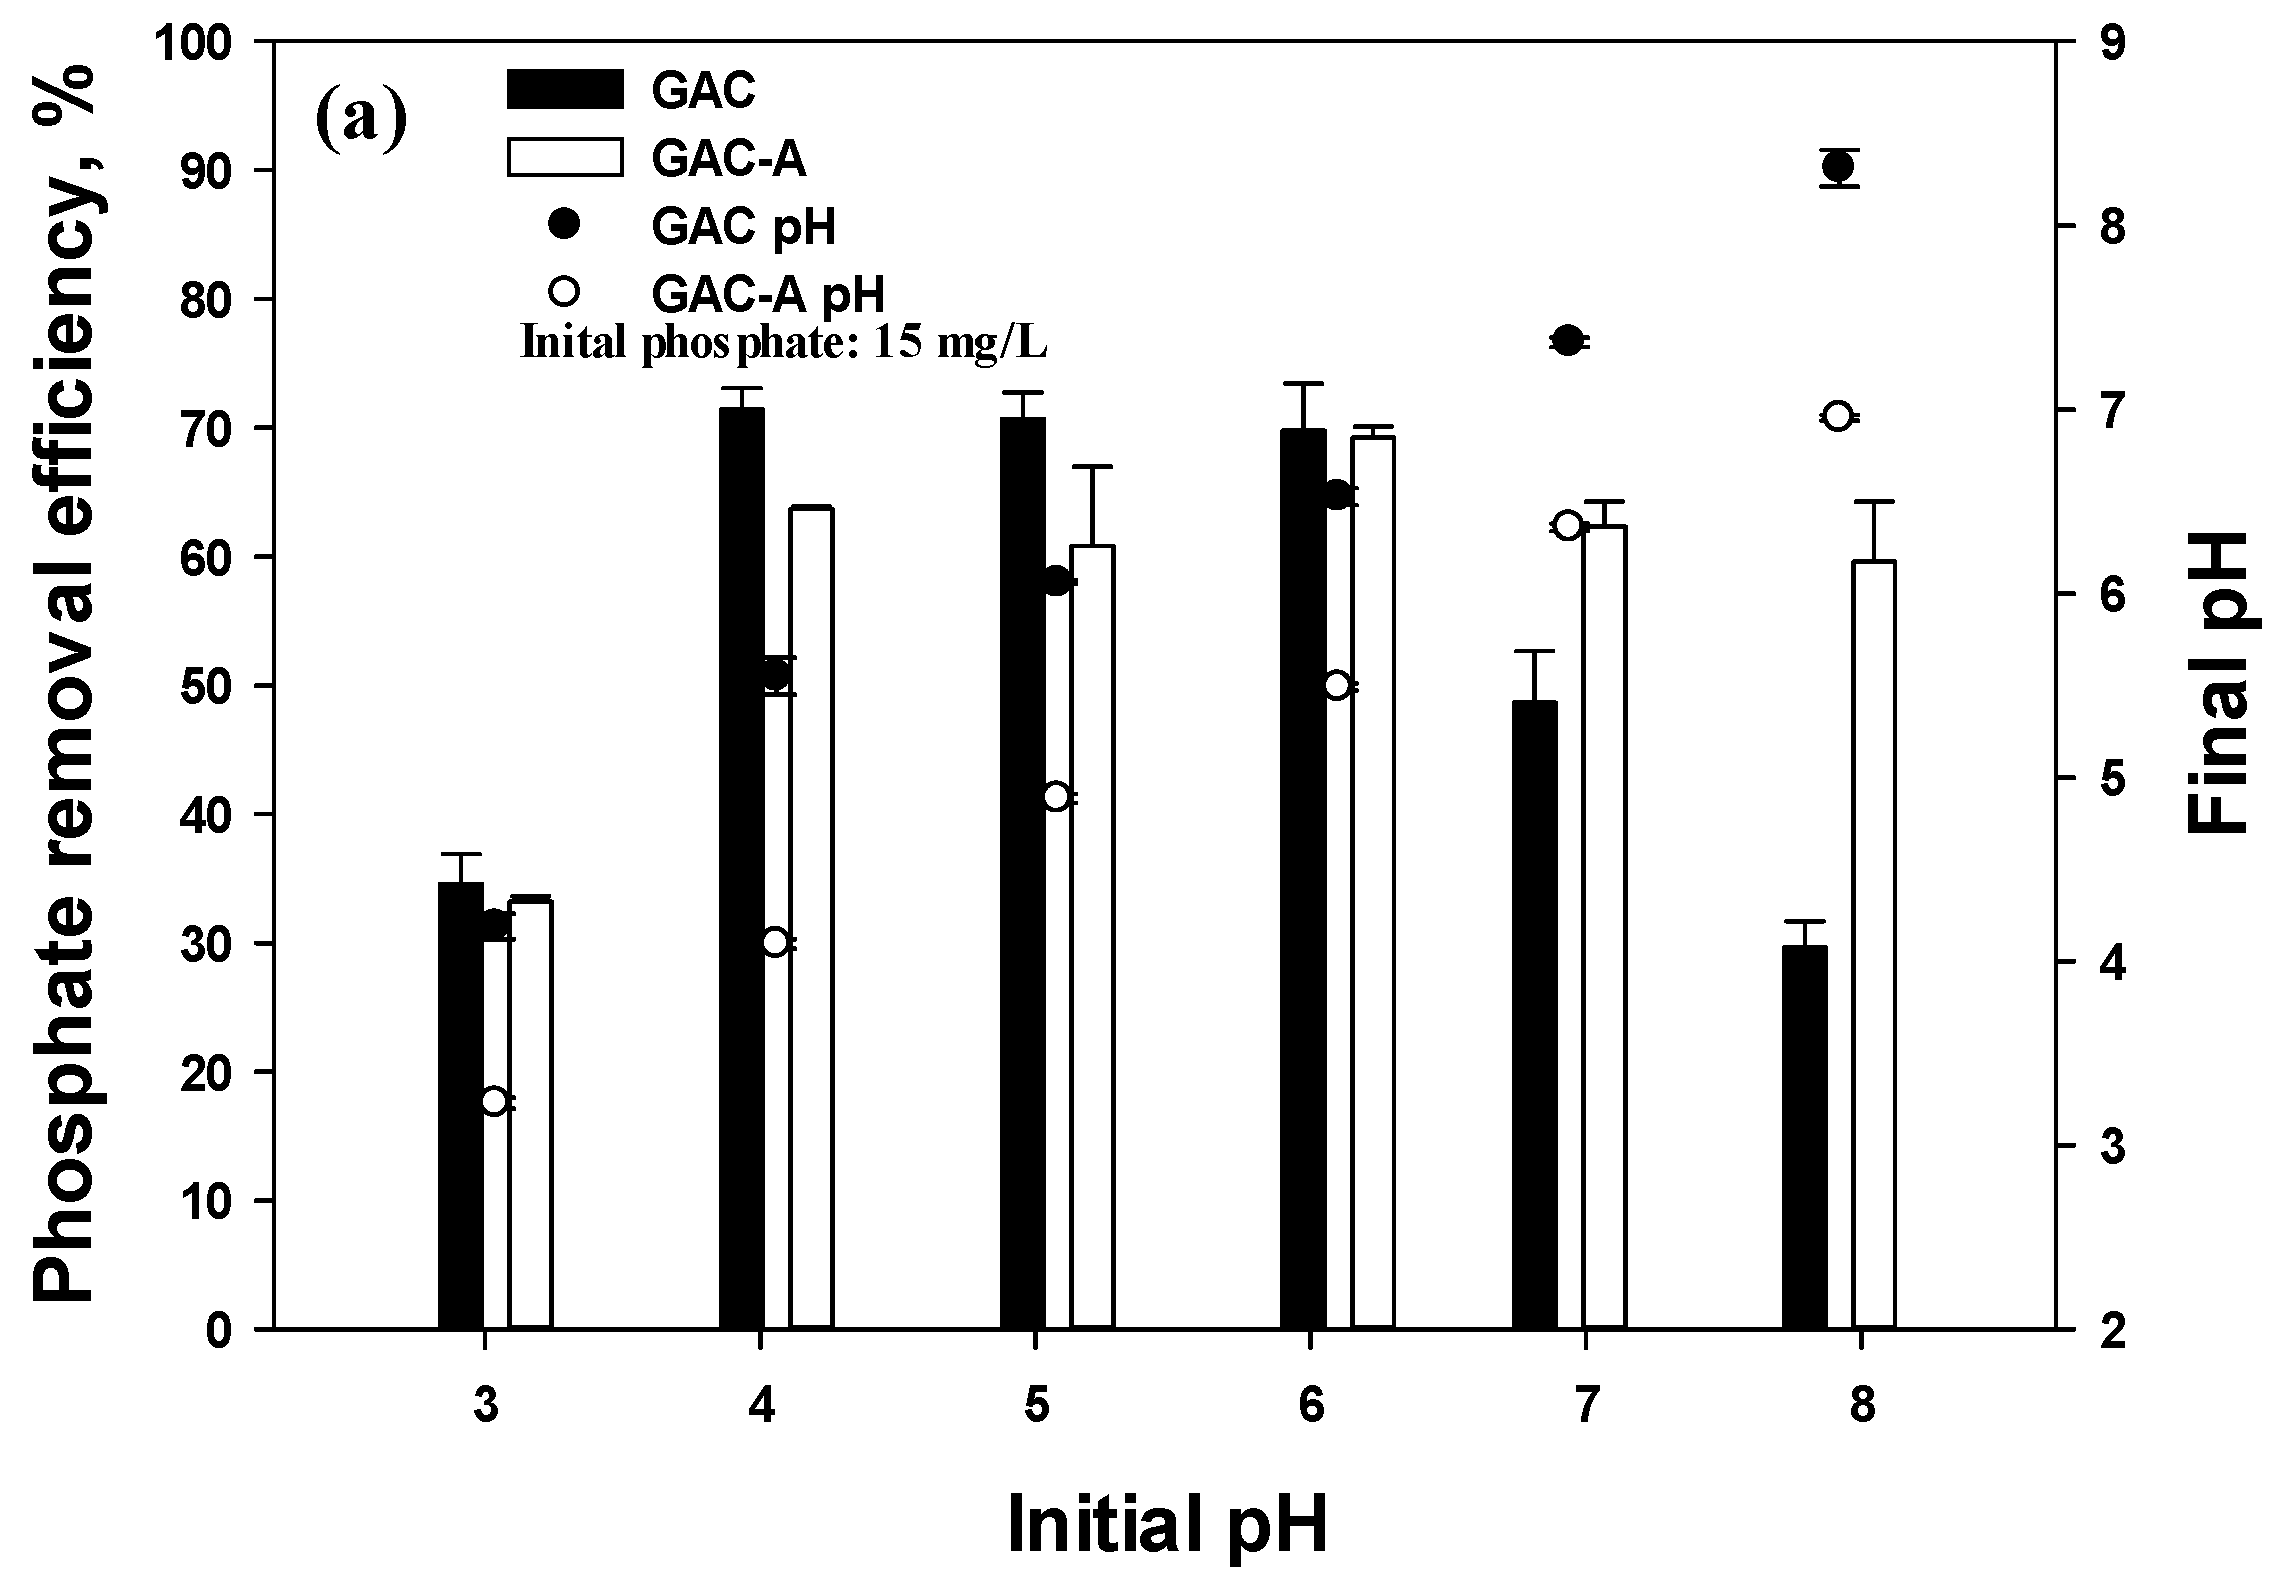
3.3. Solution pH Effect
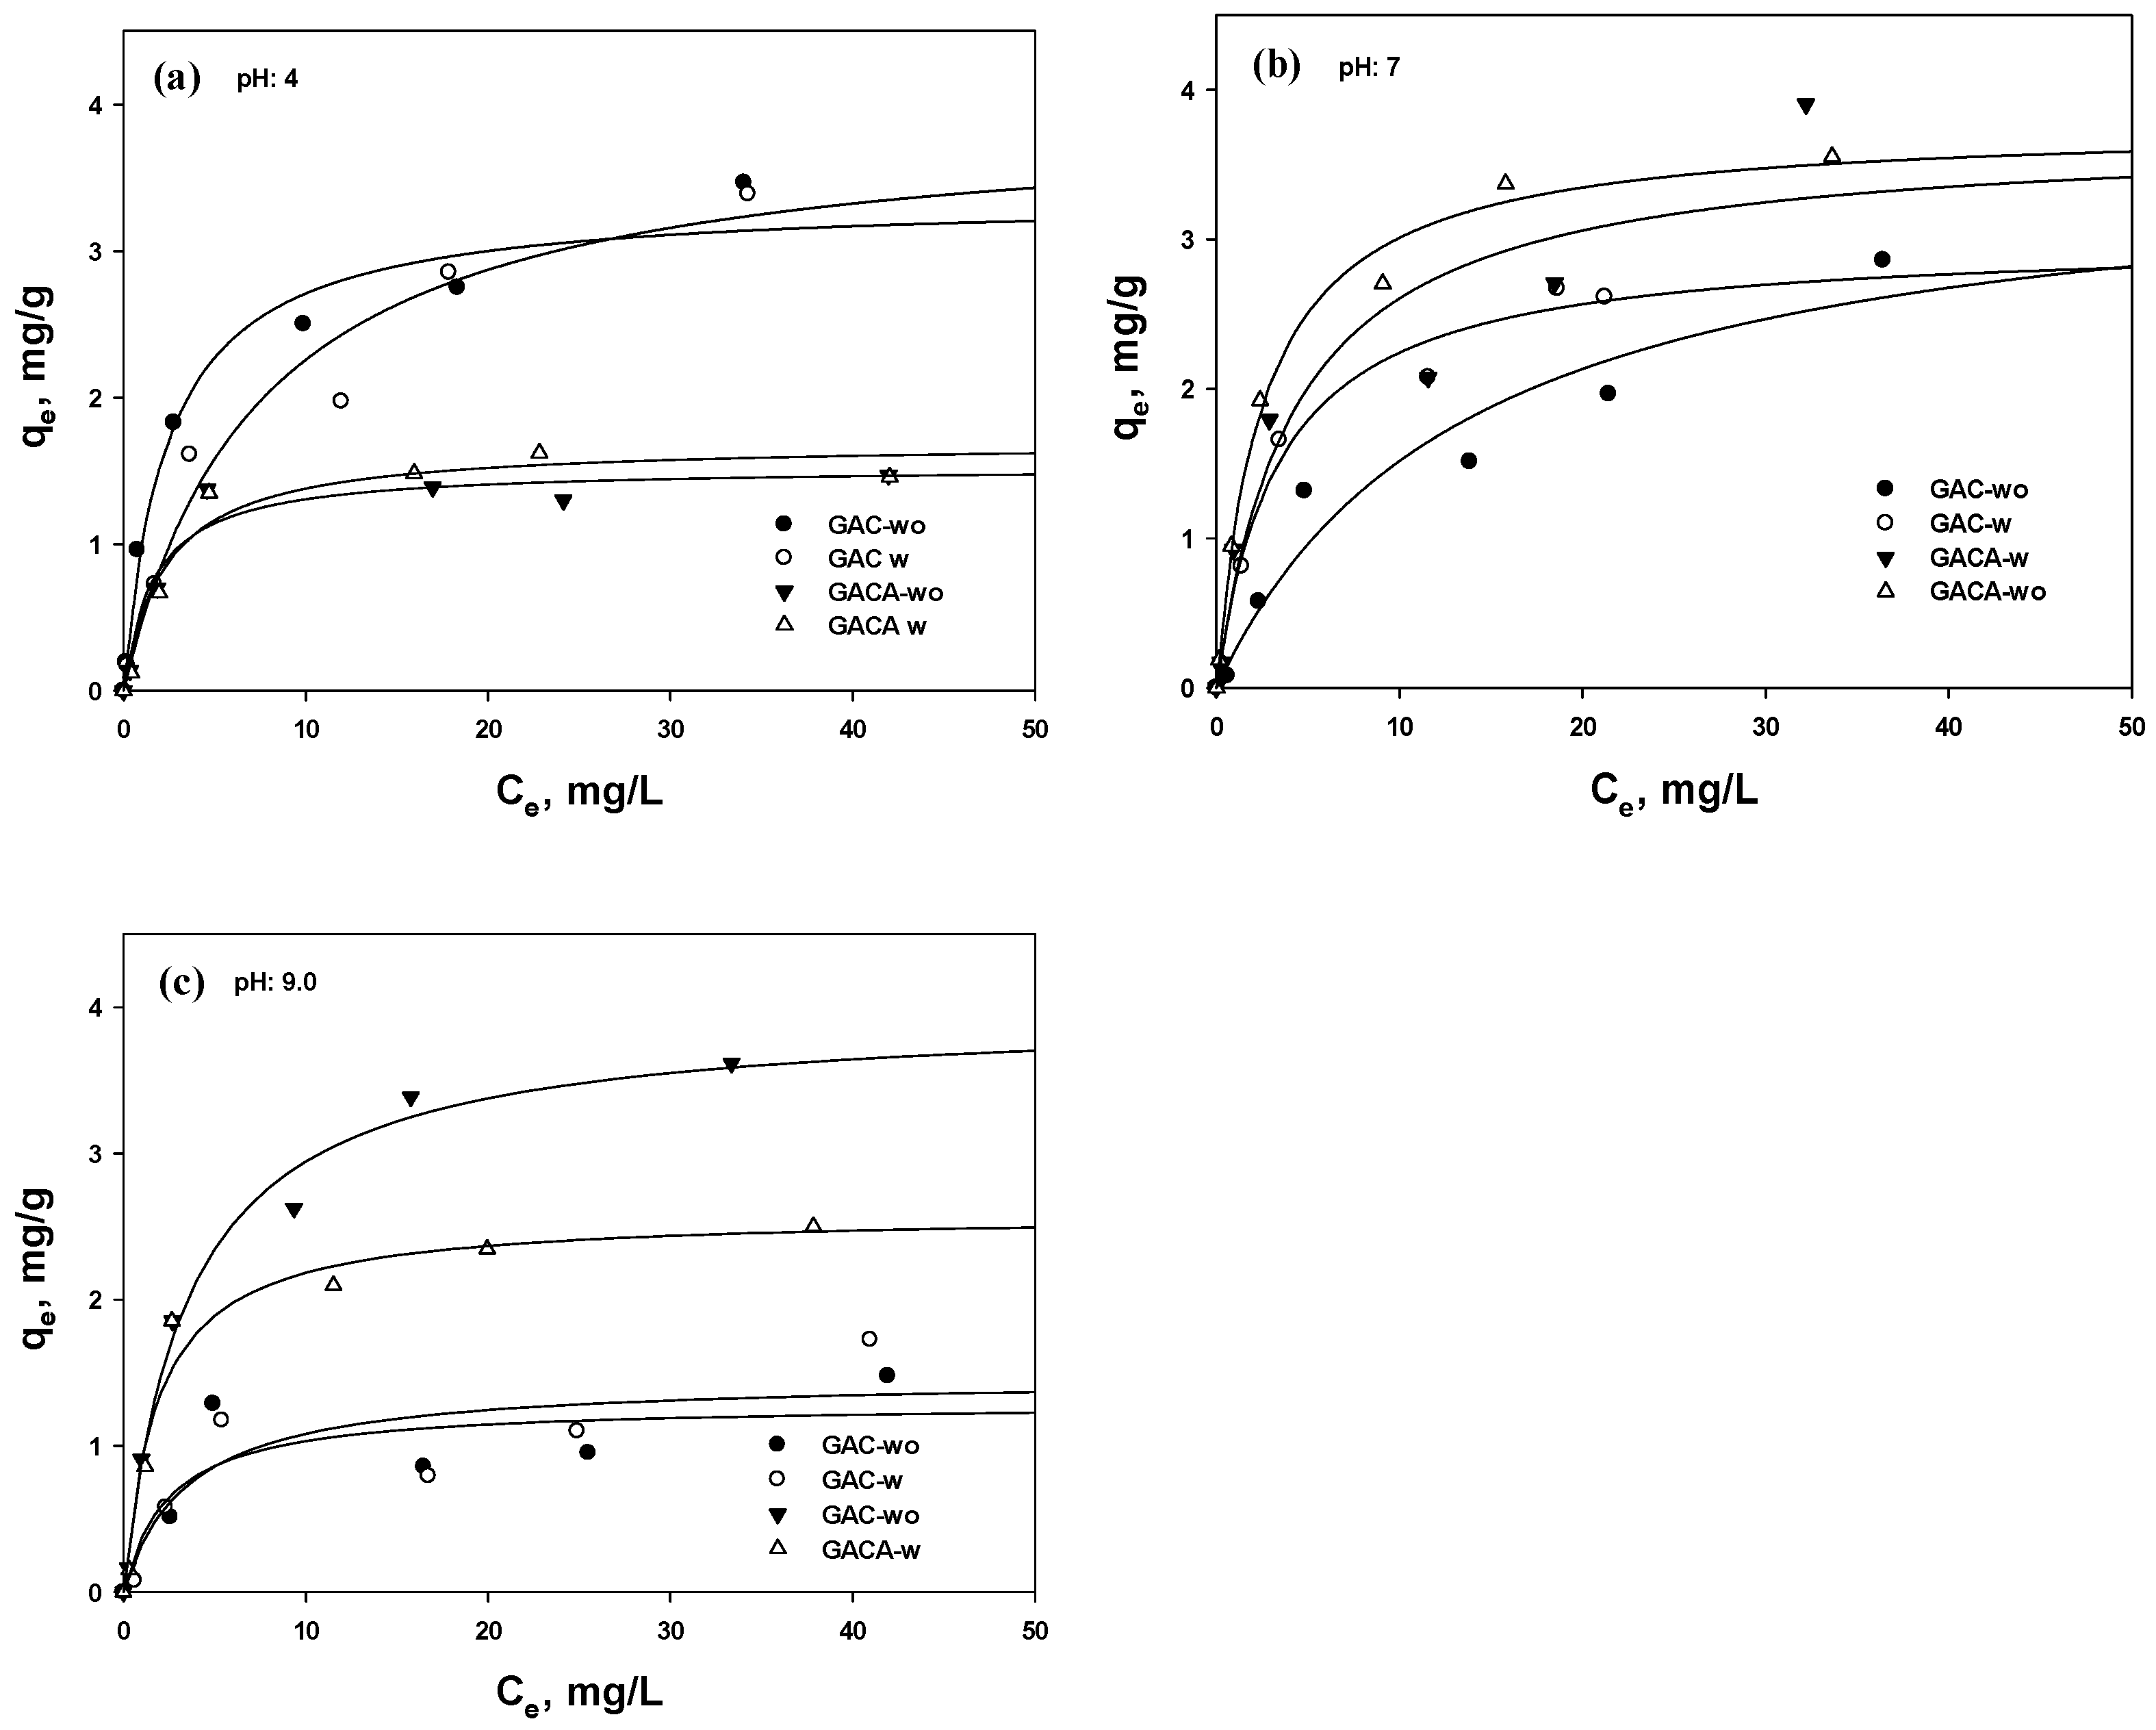
3.4. Isotherm Tests
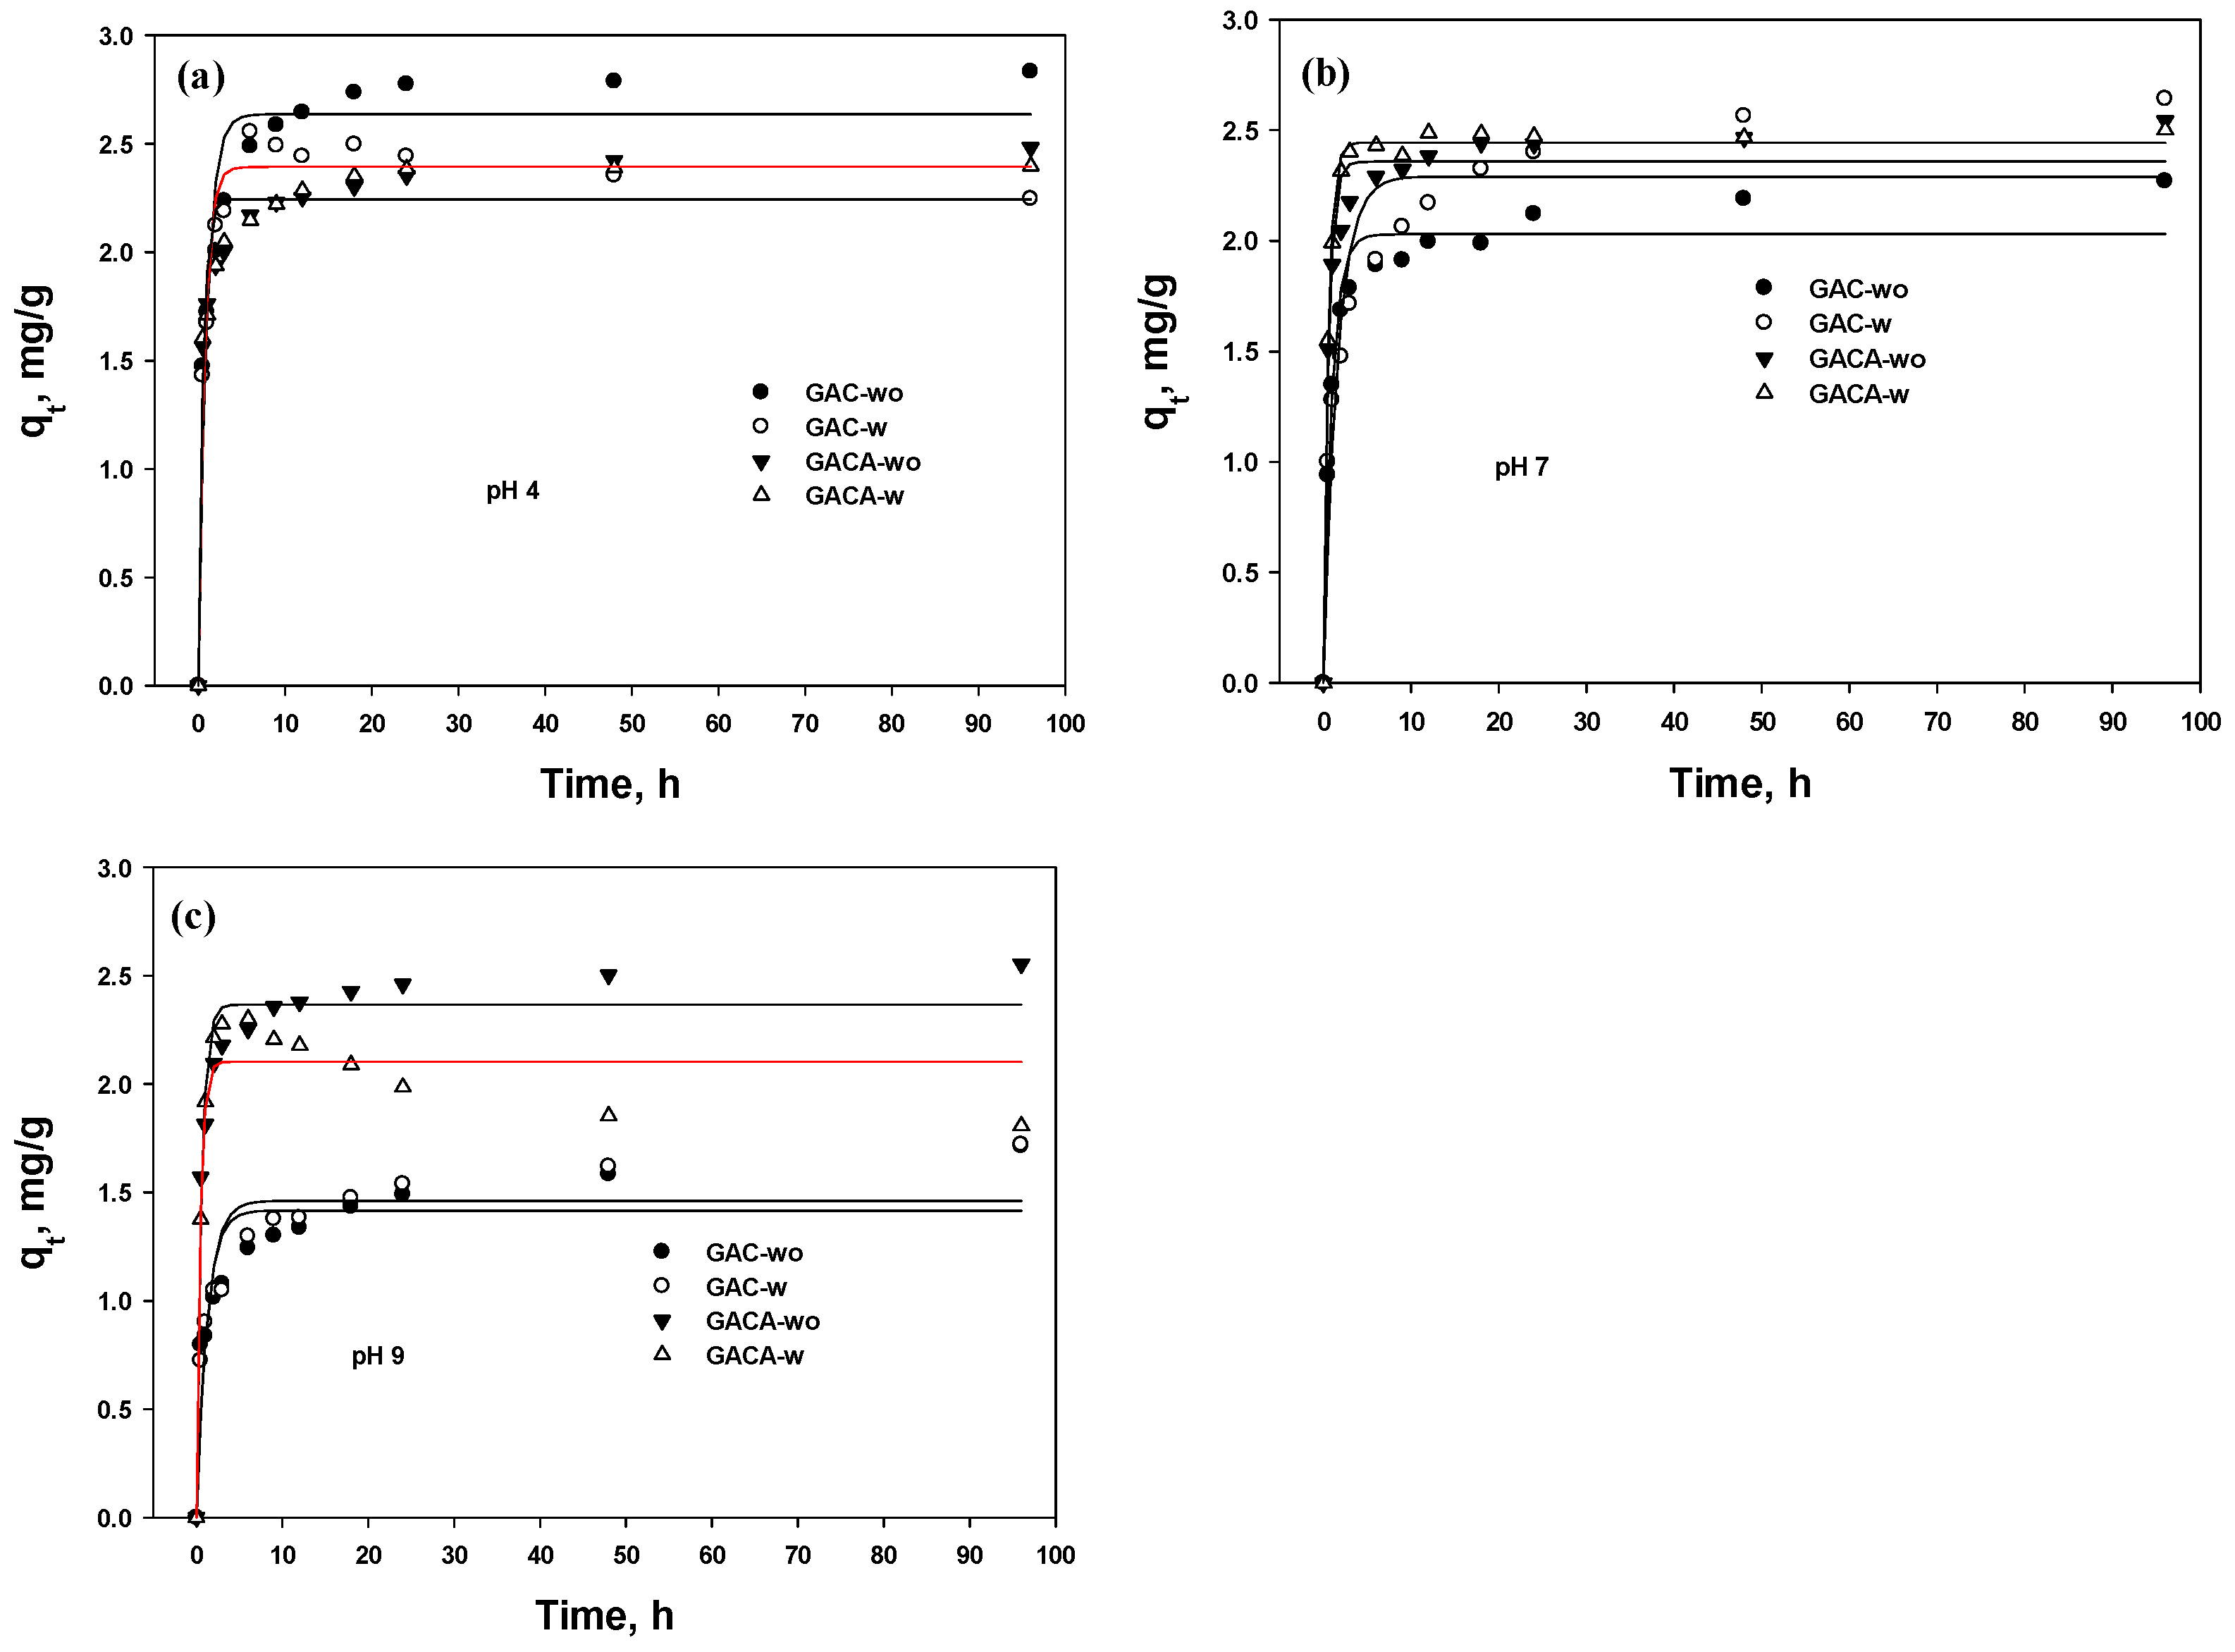
3.5. Kinetic
3.5.1. Removal Efficiency
3.5.2. PFO and PSO
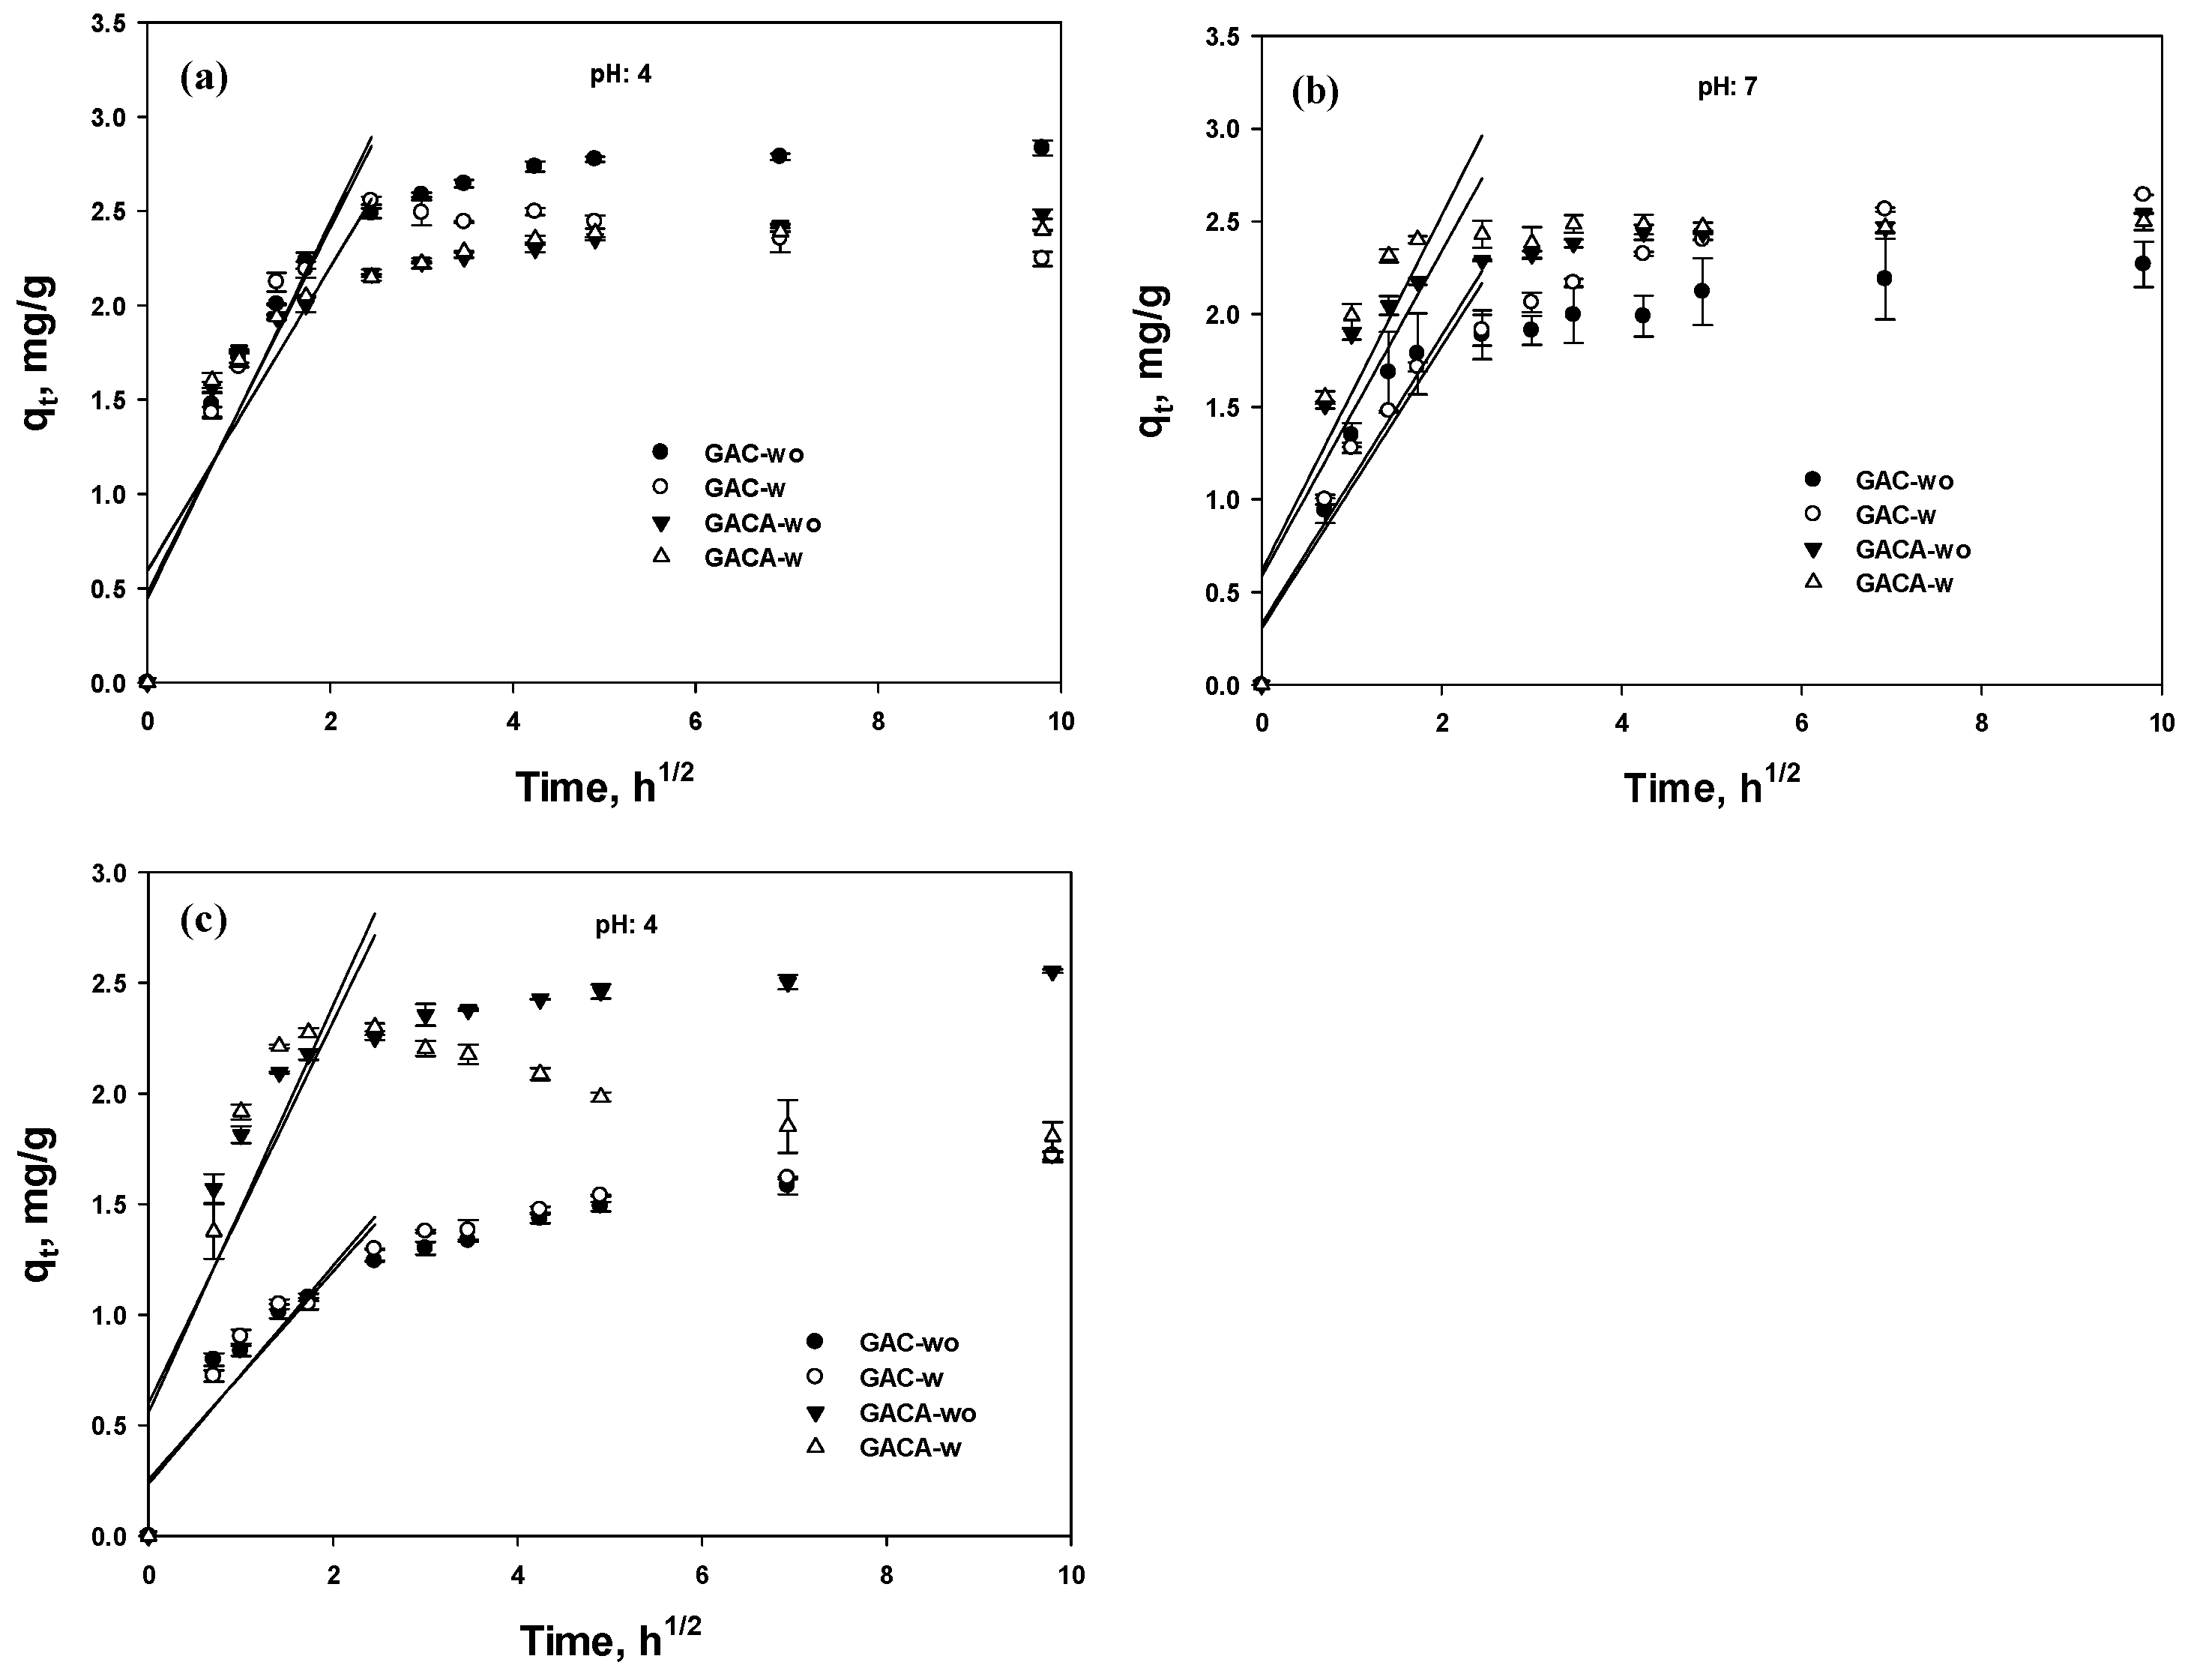
3.5.3. Intraparticle Diffusion
3.6. Fixed Column Tests
4. Conclusions
- The HCl condition for the GAC shifted the pHpzc from 4.5 to 6, but the modification of other physical properties, such as total surface area, pore volume, and pore size distribution, was negligible;
- The optimized solution pH of the phosphate removal using GAC was determined at the weak acid condition by electrostatic interaction and an increase of the pHpzc from 4.5 to 6 for the GAC, extending the segment to a neutral pH;
- At the base condition, the positive surface charge of the GAC, in spite of the species of HPO42− and PO43−, led to a rapid decrease in phosphate removal, and the hydrogen ions, excluded from the GAC in solution, deferred the reduction rate. Additionally, desorption of phosphate occurred with the increase of the solution pH;
- The PSO kinetic rate was more suitable than that of the PFO to describe the chemisorption of phosphate, and the rate constant (K2) was relatively faster at the acid condition than at other solution pH values;
- The fixed column tests confirmed that the phosphate was removed by adsorption because the hydrogen ion release onto the surface of the GAC was not due to an ion exchange process.
Supplementary Materials
Author Contributions
Funding
Institutional Review Board Statement
Informed Consent Statement
Data Availability Statement
Conflicts of Interest
References
- An, B. Removal of both cation and anion pollutant from solution using hydrogel chitosan bead. J. Korean Soc. Water Wastewater 2018, 32, 253–259. [Google Scholar] [CrossRef]
- USEPA. Available online: https://archive.epa.gov/water/archive/web/html/vms56.html (accessed on 22 February 2021).
- Zhao, D.; Sengupta, A.K. Ultimate removal of phosphate from wastewater using a new class of polymeric ion exchangers. Water Res. 1998, 32, 1613–1625. [Google Scholar] [CrossRef]
- Deng, W.; Zhang, D.; Zheng, X.; Ye, X.; Niu, X.; Lin, Z.; Fu, M.; Zhou, S. Adsorption recovery of phosphate from waste streams by Ca/Mg-biochar synthesis from marble waste, calcium-rich sepiolite and bagasse. J. Clean. Prod. 2021, 288, 125638. [Google Scholar] [CrossRef]
- Yang, K.; Li, Z.; Zhang, H.; Qian, J.; Chen, G. Municipal wastewater phosphorus removal by coagulation. Environ. Technol. 2010, 31, 601–609. [Google Scholar] [CrossRef]
- Mulkerrins, D.; Dobson, A.D.W.; Colleran, E. Parameters affecting biological phosphate removal from wastewaters. Environ. Int. 2004, 30, 249–259. [Google Scholar] [CrossRef]
- Nam, J.-H.; Lee, S.-H.; Choi, J.-W.; Hong, S.-W.; An, B. Enhanced removal of phosphate on modified ion exchanger with competing ion. J. Korean Soc. Water Wastewater 2013, 27, 121–128. [Google Scholar] [CrossRef]
- Chen, M.; Huo, C.; Li, Y.; Wang, J. Selective adsorption and efficient removal of phosphate from aqueous medium with graphene–lanthanum composite. ACS Sustain. Chem. Eng. 2016, 4, 1296–1302. [Google Scholar] [CrossRef]
- Hu, Z.; Srinivasan, M.P. Preparation of high-surface-area activated carbons from coconut shell. Micropor. Mesopor. Mater. 1999, 27, 11–18. [Google Scholar] [CrossRef]
- Pittman, C.U.; He, G.R.; Wu, B.; Gardner, S.D. Chemical modification of carbon fiber surfaces by nitric acid oxidation followed by reaction with tetraethylenepentamine. Carbon 1997, 35, 317–331. [Google Scholar] [CrossRef]
- Kalaruban, M.; Loganathan, P.; Nguyen, T.V.; Nur, T.; Johir, M.A.H.; Nguyen, T.H.; Vigneswaran, S. Iron-impregnated granular activated carbon for arsenic removal: Application to practical column filters. J. Environ. Manag. 2019, 239, 235–243. [Google Scholar] [CrossRef] [PubMed]
- Chitrakar, R.; Tezuka, S.; Sonoda, A.; Sakane, K. Phosphate adsorption on synthetic goethite and akageneite. J. Colloid Interface Sci. 2006, 298, 602–608. [Google Scholar] [CrossRef] [PubMed]
- Langmuir, I. The adsorption of gases on plane surfaces of glass, mica and platinum. J. Am. Chem. Soc. 1918, 40, 1361–1403. [Google Scholar] [CrossRef]
- Freundlich, H.M.F. Over the adsorption in solution. J. Phys. Chem. 1906, 57, 385–471. [Google Scholar]
- Wang, J.; Guo, X. Adsorption kinetic models: Physical meanings, applications, and solving methods. J. Hazard. Mater. 2020, 390, 122156. [Google Scholar] [CrossRef] [PubMed]
- An, B. Cu (II) and As (V) Adsorption kinetic characteristic of the multifunctional amino groups in chitosan. Processes 2020, 8, 1194. [Google Scholar] [CrossRef]
- Lagergren, S.K. About the theory of so-called adsorption of soluble substances. Sven. Vetenskapsakad. Handingarl 1898, 24, 1–39. [Google Scholar]
- Ho, Y.S.; Wase, D.A.J.; Forster, C.F. Removal of lead ions from aqueous solution using sphagnum moss peat as adsorbent. Water SA 1996, 22, 219–224. [Google Scholar]
- Weber, T.W.; Chakravorti, R.K. Pore and solid diffusion models for fixed-bed adsorbers. AIChE J. 1974, 20, 228–238. [Google Scholar] [CrossRef]
- Jastrzębska, A.M.; Karwowska, E.; Olszyna, A.R.; Kunicki, A. Influence of bacteria adsorption on zeta potential of Al2O3 and Al2O3/Ag nanoparticles in electrolyte and drinking water environment studied by means of zeta potential. Surf. Coat. Technol. 2015, 271, 225–233. [Google Scholar] [CrossRef]
- Eeshwarasinghe, D.; Loganathan, P.; Vigneswaran, S. Simultaneous removal of polycyclic aromatic hydrocarbons and heavy metals from water using granular activated carbon. Chemosphere 2019, 223, 616–627. [Google Scholar] [CrossRef] [PubMed]
- Nur, T.; Loganathan, P.; Ahmed, M.B.; Johir, M.A.H.; Nguyen, T.V.; Vigneswaran, S. Removing arsenic from water by coprecipitation with iron: Effect of arsenic and iron concentrations and adsorbent incorporation. Chemosphere 2019, 226, 431–438. [Google Scholar] [CrossRef] [PubMed]
- Park, K.H.; Lee, C.H.; Ryu, S.K.; Yang, X. Zeta-potentials of oxygen and nitrogen enriched activated carbons for removal of copper ion. Carbon Lett. 2007, 8, 321–325. [Google Scholar] [CrossRef]
- Elovich, S.Y.; Larionov, O.G. Theory of adsorption from nonelectrolyte solutions on solid adsorbents. Bull. Acad. Sci. USSR Div. Chem. Sci. 1962, 11, 191–197. [Google Scholar] [CrossRef]
- Temkin, M.I. Adsorption equilibrium and the kinetics of processes on nonhomogeneous surfaces and in the interaction between adsorbed molecules. Zh. Fiz. Chim. 1941, 15, 296–332. [Google Scholar]
- Giles, C.H.; MacEwan, T.H.; Makhwa, S.N.; Smith, D. Studies in adsorption. Part XI. A system of classification of solution adsorption isotherms and its use in diagnosis of adsorption mechanisms and in measurement of specific surface areas of solids. J. Chem. Soc. 1960, 56, 3973–3993. [Google Scholar] [CrossRef]
- Hamdaoui, O.; Naffrechoux, E. Modeling of adsorption isotherms of phenol and chlorophenols onto granular activated carbon: Part I. Two-parameter models and equations allowing determination of thermodynamic parameters. J. Hazard. Mater. 2007, 147, 381–394. [Google Scholar] [CrossRef] [PubMed]
- Ho, Y.S.; Porter, J.F.; McKay, G. Equilibrium isotherm studies for the sorption of divalent metal ions onto peat: Copper, nickel and lead single component systems. Water Air Soil Pollut. 2002, 141, 1–33. [Google Scholar] [CrossRef]
- Bauman, W.C.; Eichhorn, J. Fundamental properties of a synthetic cation exchange resin. J. Am. Chem. Soc. 1947, 69, 2830–2836. [Google Scholar] [CrossRef] [PubMed]
- Ajenifuja, E.; Ajao, J.A.; Ajayi, E.O.B. Adsorption isotherm studies of Cu (II) and Co (II) in high concentration aqueous solutions on photocatalytically modified diatomaceous ceramic adsorbents. Appl. Water Sci. 2017, 7, 3793–3801. [Google Scholar] [CrossRef]
- Özer, A.; Pirincci, H.B. The adsorption of Cd (II) ions on sulphuric acid-treated wheat bran. J. Hazard. Mater. 2006, 137, 849–855. [Google Scholar] [CrossRef] [PubMed]
- Ho, Y.S. Selection of optimum sorption isotherm. Carbon 2004, 42, 2115–2116. [Google Scholar] [CrossRef]
- Lima, E.C.; Hosseini-Bandegharaei, A.; Moreno-Piraján, J.C.; Anastopoulos, I. A critical review of the estimation of the thermodynamic parameters on adsorption equilibria. Wrong use of equilibrium constant in the Van’t Hoof equation for calculation tof thermodynamic parameters of adsorption. J. Mol. Liq. 2019, 273, 425–434. [Google Scholar] [CrossRef]
- Kegl, T.; Ban, I.; Lobnik, A.; Košak, A. Synthesis and characterization of novel γ-Fe2O3-NH4OH@SiO2(APTMS) nanoparticles for dysprosium adsorption. J. Hazard. Mater. 2019, 378, 120764. [Google Scholar] [CrossRef] [PubMed]
- Choi, J.W.; Choi, N.C.; Lee, S.J.; Kim, D.J. Novel three-stage kinetic model for aqueous benzene adsorption on activated carbon. J. Colloid Interface Sci. 2007, 314, 367–372. [Google Scholar] [CrossRef] [PubMed]
- Magdy, Y.H.; Altaher, H. Kinetic analysis of the adsorption of dyes from high strength wastewater on cement kiln dust. J. Environ. Chem. Eng. 2018, 6, 834–841. [Google Scholar] [CrossRef]
- Hameed, B.H.; El-Khaiary, M.I. Kinetics and equilibrium studies of malachite green adsorption on rice straw-derived char. J. Hazard. Mater. 2008, 153, 701–708. [Google Scholar] [CrossRef]
- Weber, W.J., Jr.; Morris, J.C. Kinetics of adsorption on carbon from solution. J. Sanit. Eng. ASCE 1963, 89, 31–59. [Google Scholar] [CrossRef]
- Ghasemi, M.; Ghasemi, N.; Zahedi, G.; Alwi, S.R.W.; Goodarzi, M.; Javadian, H. Kinetic and equilibrium study of Ni (II) sorption from aqueous solutions onto Peganum harmala-L. Int. J. Environ. Sci. Technol. 2014, 11, 1835–1844. [Google Scholar] [CrossRef]
- Vadivelan, V.; Kumar, K.V. Equilibrium, kinetics, mechanism, and process design for the sorption of methylene blue onto rice husk. J. Colloid Interface Sci. 2005, 286, 90–100. [Google Scholar] [CrossRef] [PubMed]
- Hamdaoui, O. Batch study of liquid-phase adsorption of methylene blue using cedar sawdust and crushed brick. J. Hazard. Mater. 2006, 135, 264–273. [Google Scholar] [CrossRef] [PubMed]
- Albadarin, A.B.; Mangwandi, C.; Ala’a, H.; Walker, G.M.; Allen, S.J.; Ahmad, M.N. Kinetic and thermodynamics of chromium ions adsorption onto low-cost dolomite adsorbent. Chem. Eng. J. 2012, 179, 193–202. [Google Scholar] [CrossRef]
- Su, Y.; Cui, H.; Li, Q.; Gao, S.; Shang, J.K. Strong adsorption of phosphate by amorphous zirconium oxide nanoparticles. Water Res. 2013, 47, 5018–5026. [Google Scholar] [CrossRef] [PubMed]


| Element | GAC | GAC-A | ||
|---|---|---|---|---|
| Apparent Concentration | wt.% | Apparent Concentration | wt.% | |
| C | 11.87 | 78.35 | 12.99 | 83.58 |
| N | 0.00 | 0.00 | 0.00 | 0.00 |
| O | 4.77 | 11.88 | 4.00 | 10.18 |
| Al | 0.95 | 2.83 | - | - |
| Si | 1.00 | 3.13 | - | - |
| S | 1.03 | 3.81 | 1.68 | 6.24 |
| Adsorbent | BET Surface Area (m2/g) | Total Pore Volume (cm3/g) | Micropore Volume (cm3/g) | Average Pore Diameter (nm) |
|---|---|---|---|---|
| GAC | 1038 | 0.54 | 0.47 | 2.09 |
| GACA | 991 | 0.52 | 0.45 | 2.10 |
| ∆(%) | −4.51 | −3.7 | −4.2 |
| pH | Condition | Langmuir | Freundlich | ||||||
|---|---|---|---|---|---|---|---|---|---|
| Qmax (mg/g) | b (L/mg) | ∆G° (kJ/mol) | R2 | kf | 1/n | n | R2 | ||
| 4 | GAC-wo | 3.36 (0.196) * | 0.419 (0.107) | −25.8 | 0.979 | 1.10 (0.130) | 0.329 (0.0401) | 3.04 | 0.976 |
| GAC-w | 3.94 (0.457) | 0.134 (0.0461) | −23.0 | 0.967 | 0.722 (0.127) | 0.446 (0.0583) | 2.24 | 0.972 | |
| GACA-wo | 1.53 (0.109) | 0.598 (0.217) | −26.7 | 0.955 | 0.643 (0.164) | 0.244 (0.0843) | 4.10 | 0.848 | |
| GACA-w | 1.7 (0.118) | 0.438 (0.141) | −25.9 | 0.963 | 0.640 (0.173) | 0.268 (0.0893) | 3.73 | 0.853 | |
| 7 | GAC-wo | 3.59 (0.715) | 0.0732 (0.0353) | −21.6 | 0.946 | 0.401 (0.0994) | 0.539 (0.0783) | 1.86 | 0.964 |
| GAC-w | 3.00 (0.172) | 0.296 (0.0367) | −25.0 | 0.986 | 0.790 (0.130) | 0.407 (0.0606) | 2.46 | 0.969 | |
| GACA-wo | 3.71 (0.566) | 0.237 (0.136) | −24.4 | 0.911 | 0.857 (0.172) | 0.420 (0.0671) | 2.38 | 0.959 | |
| GACA-w | 3.77 (0.129) | 0.398 (0.0564) | −25.7 | 0.993 | 1.23 (0.192) | 0.328 (0.0543) | 3.04 | 0.955 | |
| 9 | GAC-wo | 1.29 (0.240) | 0.406 (0.341) | −25.8 | 0.783 | 0.441 (0.190) | 0.301 (0.139) | 3.33 | 0.736 |
| GAC-w | 1.46 (0.284) | 0.284 (0.227) | −24.9 | 0.804 | 0.385 (0.163) | 0.373 (0.134) | 2.68 | 0.815 | |
| GACA-wo | 3.96 (0.173) | 0.291 (0.0476) | −24.9 | 0.991 | 1.11 (0.192) | 0.363 (0.0597) | 2.75 | 0.954 | |
| GACA-w | 2.59 (0.159) | 0.543 (0.148) | −26.5 | 0.970 | 0.972 (0.214) | 0.284 (0.0749) | 3.52 | 0.891 | |
| Model | Parameter | pH 4 | pH 7 | pH 9 | |||||||||
|---|---|---|---|---|---|---|---|---|---|---|---|---|---|
| GAC-wo | GAC-w | GACA-wo | GACA-w | GAC-wo | GAC-w | GACA-wo | GACA-w | GAC-wo | GAC-w | GACA-wo | GACA-w | ||
| P F O | K1 | 1.06 (0.169) * | 1.41 (0.168) | 1.91 (0.329) | 1.91 (0.326) | 1.05 (0.133) | 0.63 (0.127) | 1.76 (0.218) | 1.85 (0.091) | 0.851 (0.209) | 0.796 (0.173) | 1.75 (0.237) | 2.25 (0.433) |
| qe | 2.64 (0.077) | 2.39 (0.048) | 2.25 (0.058) | 2.24 (0.057) | 2.03 (0.048) | 2.29 (0.098) | 2.36 (0.045) | 2.44 (0.018) | 1.42 (0.068) | 1.46 (0.065) | 2.37 (0.049) | 2.1 (0.055) | |
| R2 | 0.942 | 0.969 | 0.943 | 0.944 | 0.963 | 0.907 | 0.969 | 0.995 | 0.863 | 0.889 | 0.963 | 0.939 | |
| P S O | K2 | 0.616 (0.066) | 1.07 (0.189) | 1.36 (0.195) | 1.4 (0.193) | 0.738 (0.078) | 0.358 (0.090) | 1.23 (0.064) | 1.43 (0.129) | 0.811 (0.201) | 0.727 (0.108) | 1.23 (0.149) | 2.94 (1.569) |
| qe | 2.78 (0.040) | 2.48 (0.050) | 2.35 (0.035) | 2.34 (0.033) | 2.15 (0.031) | 2.48 (0.019) | 2.46 (0.071) | 2.53 (0.022) | 1.52 (0.055) | 1.57 (0.023) | 2.47 (0.048) | 2.13 (0.082) | |
| R2 | 0.989 | 0.974 | 0.985 | 0.987 | 0.989 | 0.969 | 0.996 | 0.995 | 0.94 | 0.958 | 0.994 | 0.9 | |
| Parameter | pH 4 | pH 7 | pH 9 | |||||||||
|---|---|---|---|---|---|---|---|---|---|---|---|---|
| GAC-wo | GAC-w | GACA-wo | GACA-w | GAC-wo | GAC-w | GACA-wo | GACA-w | GAC-wo | GAC-w | GACA-wo | GACA-w | |
| Ki | 0.966 | 0.997 | 0.805 | 0.801 | 0.778 | 0.760 | 0.877 | 0.960 | 0.470 | 0.493 | 0.863 | 0.920 |
| C | 0.480 | 0.448 | 0.594 | 0.599 | 0.328 | 0.306 | 0.586 | 0.614 | 0.256 | 0.237 | 0.602 | 0.560 |
| R2 | 0.856 | 0.875 | 0.735 | 0.729 | 0.856 | 0.895 | 0.761 | 0.762 | 0.835 | 0.862 | 0.748 | 0.766 |
Publisher’s Note: MDPI stays neutral with regard to jurisdictional claims in published maps and institutional affiliations. |
© 2021 by the authors. Licensee MDPI, Basel, Switzerland. This article is an open access article distributed under the terms and conditions of the Creative Commons Attribution (CC BY) license (http://creativecommons.org/licenses/by/4.0/).
Share and Cite
Kim, T.; An, B. Effect of Hydrogen Ion Presence in Adsorbent and Solution to Enhance Phosphate Adsorption. Appl. Sci. 2021, 11, 2777. https://doi.org/10.3390/app11062777
Kim T, An B. Effect of Hydrogen Ion Presence in Adsorbent and Solution to Enhance Phosphate Adsorption. Applied Sciences. 2021; 11(6):2777. https://doi.org/10.3390/app11062777
Chicago/Turabian StyleKim, Taehoon, and Byungryul An. 2021. "Effect of Hydrogen Ion Presence in Adsorbent and Solution to Enhance Phosphate Adsorption" Applied Sciences 11, no. 6: 2777. https://doi.org/10.3390/app11062777
APA StyleKim, T., & An, B. (2021). Effect of Hydrogen Ion Presence in Adsorbent and Solution to Enhance Phosphate Adsorption. Applied Sciences, 11(6), 2777. https://doi.org/10.3390/app11062777