Article

Measurements and Analysis of AC Losses in HTS Windings of Electrical Machine for Different Operation Modes

Department of Electrical Machines and Power Electronics, Moscow Aviation Institute (National Research University), 125993 Moscow, Russia
*
Author to whom correspondence should be addressed.
Appl. Sci. 2021, 11(6), 2741; https://doi.org/10.3390/app11062741
Submission received: 25 February 2021 / Revised: 15 March 2021 / Accepted: 16 March 2021 / Published: 18 March 2021
(This article belongs to the Special Issue Superconductor Technologies and Their Applications)

Abstract

:
The article is devoted to the study of losses in devices based on high-temperature superconductors of the 2nd generation. The complexity of the devices under study increases from a single rack coil to a winding assembled from several coils, and finally to an electric machine operating in generator mode. This is the way to experimentally study the behavior of 2nd generation high temperature superconductor (2G HTS) carrying a transport current in various conditions: self-field, external DC, and AC magnetic field. Attention is also paid to the losses in the winding during its operation from the inverter, which simulates the operating conditions in the motor mode of a propulsion system.

1. Introduction

Power consumption in transport and power systems has been growing rapidly during recent years. In this case, electrical machines, which are one of the main parts of such systems, should provide high output and specific power. Electrical machines with both an HTS field and armature windings are the most promising [1,2,3,4]. The application of coils and cables based on high-temperature superconductors (HTS) possess the advantage of carrying high electrical current density [5] and increased electromagnetic loads. Superconducting electrical machines are complex technical devices, the creation of which requires the solution of a whole series of scientific and engineering problems related to many fields of science and technology. Along with the solution of traditional problems of the usual “warm” electrical engineering, one has to solve the problems associated with cooling of superconducting windings and the stability of their superconducting state under the action of external heat leakage, centrifugal, and ponderomotive forces, as well as vibrations [6]. Besides, when HTS coils are operating with alternating current (AC), or in the presence of a time-varying magnetic field, they still sustain AC losses. Taking into account this type of loss, it is necessary for the correct determination of the thermal state of the windings. Several groups of authors provide different modeling approaches for AC loss determination. For example, in papers [7,8], theoretical aspects of AC losses calculation and modeling are provided. Works [9,10,11] expand such approaches to electrical machines levels. Besides, a great experimental work also was done during the last few years in this area [12,13,14,15,16]. Even if a lot of work has been done on the characterization of superconducting elements (bulks and tapes), the transition from the element to the system is not obvious, because the behavior of an isolated HTS element is very different when it is integrated into a system [14]. In this context, in this work, experimental research of individual coils, windings, and devices is provided. AC loss values are obtained for different frequencies, transport current values, and waveforms. In recent works such as [17,18], studies are conducted for a sinusoidal current and an external field, which is a fundamental harmonic distorted by one or more harmonics from the 2nd to the 5th order. In our case, the experiment is carried out both on the pure sine and on the current form obtained by high-frequency modulation with a frequency not less than 30 times higher than the fundamental harmonic. This mode is typical for semiconductor power devices (inverters, converters). Experimental research will provide useful information for a deeper understanding of the AC loss dynamics in power applications. Finally, it will provide an opportunity to develop a new methodic of calculating AC losses in AC windings of different devices.
In the first part of this paper, a description of measurement methods and test benches (static and rotating) is provided. Then research objects, which are coils, windings, and rotating devices, are described. Finally, the results of the tests and their discussion is provided.

2. Methods

The main methods for measuring losses in devices based on superconductors are calorimetric and electrical methods [19]. In this work, we study first the coil, then the stator, and finally the assembled electric machine. In this regard, the use of the calorimetric method would be difficult during the last experiment, since this requires a high-tech cryostat with a rotating shaft input [20]. The lock-in amplifier is often used when measuring losses by the electrical method [21]. However, the main feature of this method comes from the principle of the operation of a synchronous amplifier: it selects from the signal at its input only the part of the signal that corresponds to the reference frequency. Hence, the difficulty with using this technique for measuring arbitrary non-sinusoidal alternating current, which based on the Fourier series expansion principle, is that is has more than one frequency [22]. In view of the above, the method of direct electrical loss measurement was chosen for this work. It is based on the calculation of the losses by numerical integration of the instantaneous power produced by the voltage u and current i:
P = 1 t m 0 t m u i d t ,
where u, i—recorded instantaneous values of current and voltage, and tm—measurement time (period of signal).
In this method, several parameters are important:
-
Amplifying and filtering the signals to avoid creating an additional phase shift between the current and the voltage;
-
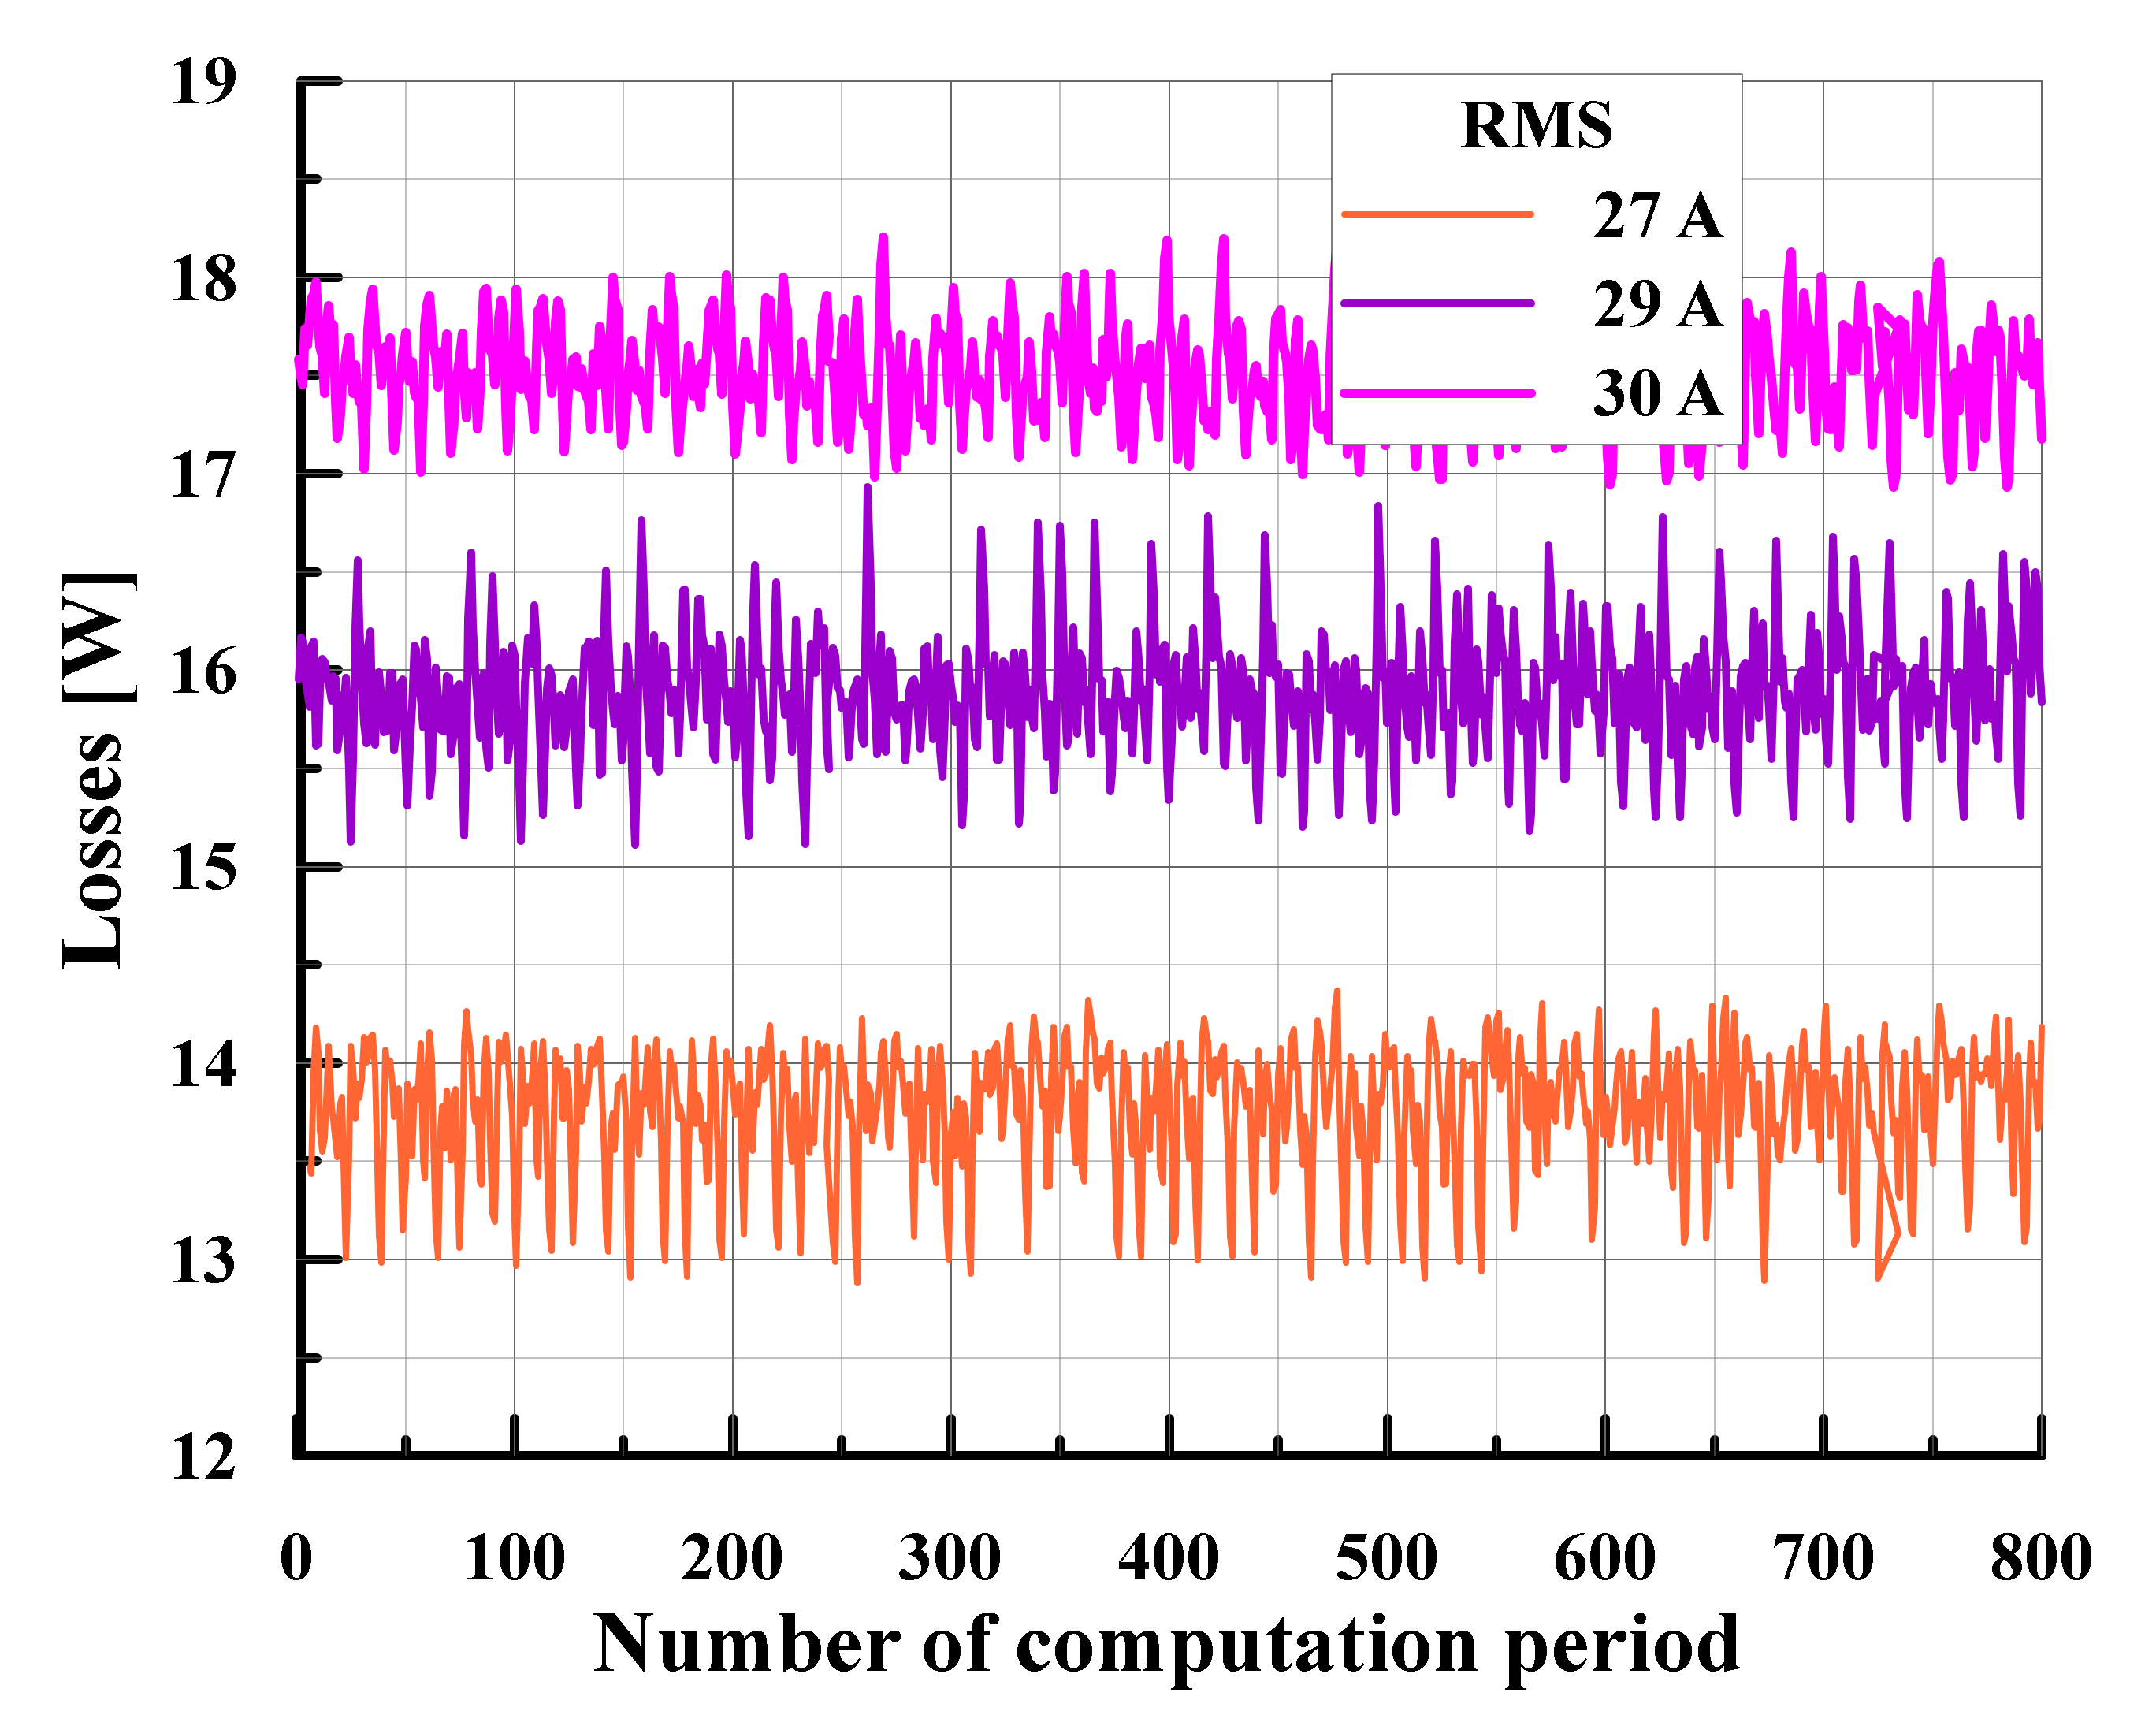
Calculation of the losses many times, then the calculation of the statistical mean of the losses to increase the signal/noise ratio.

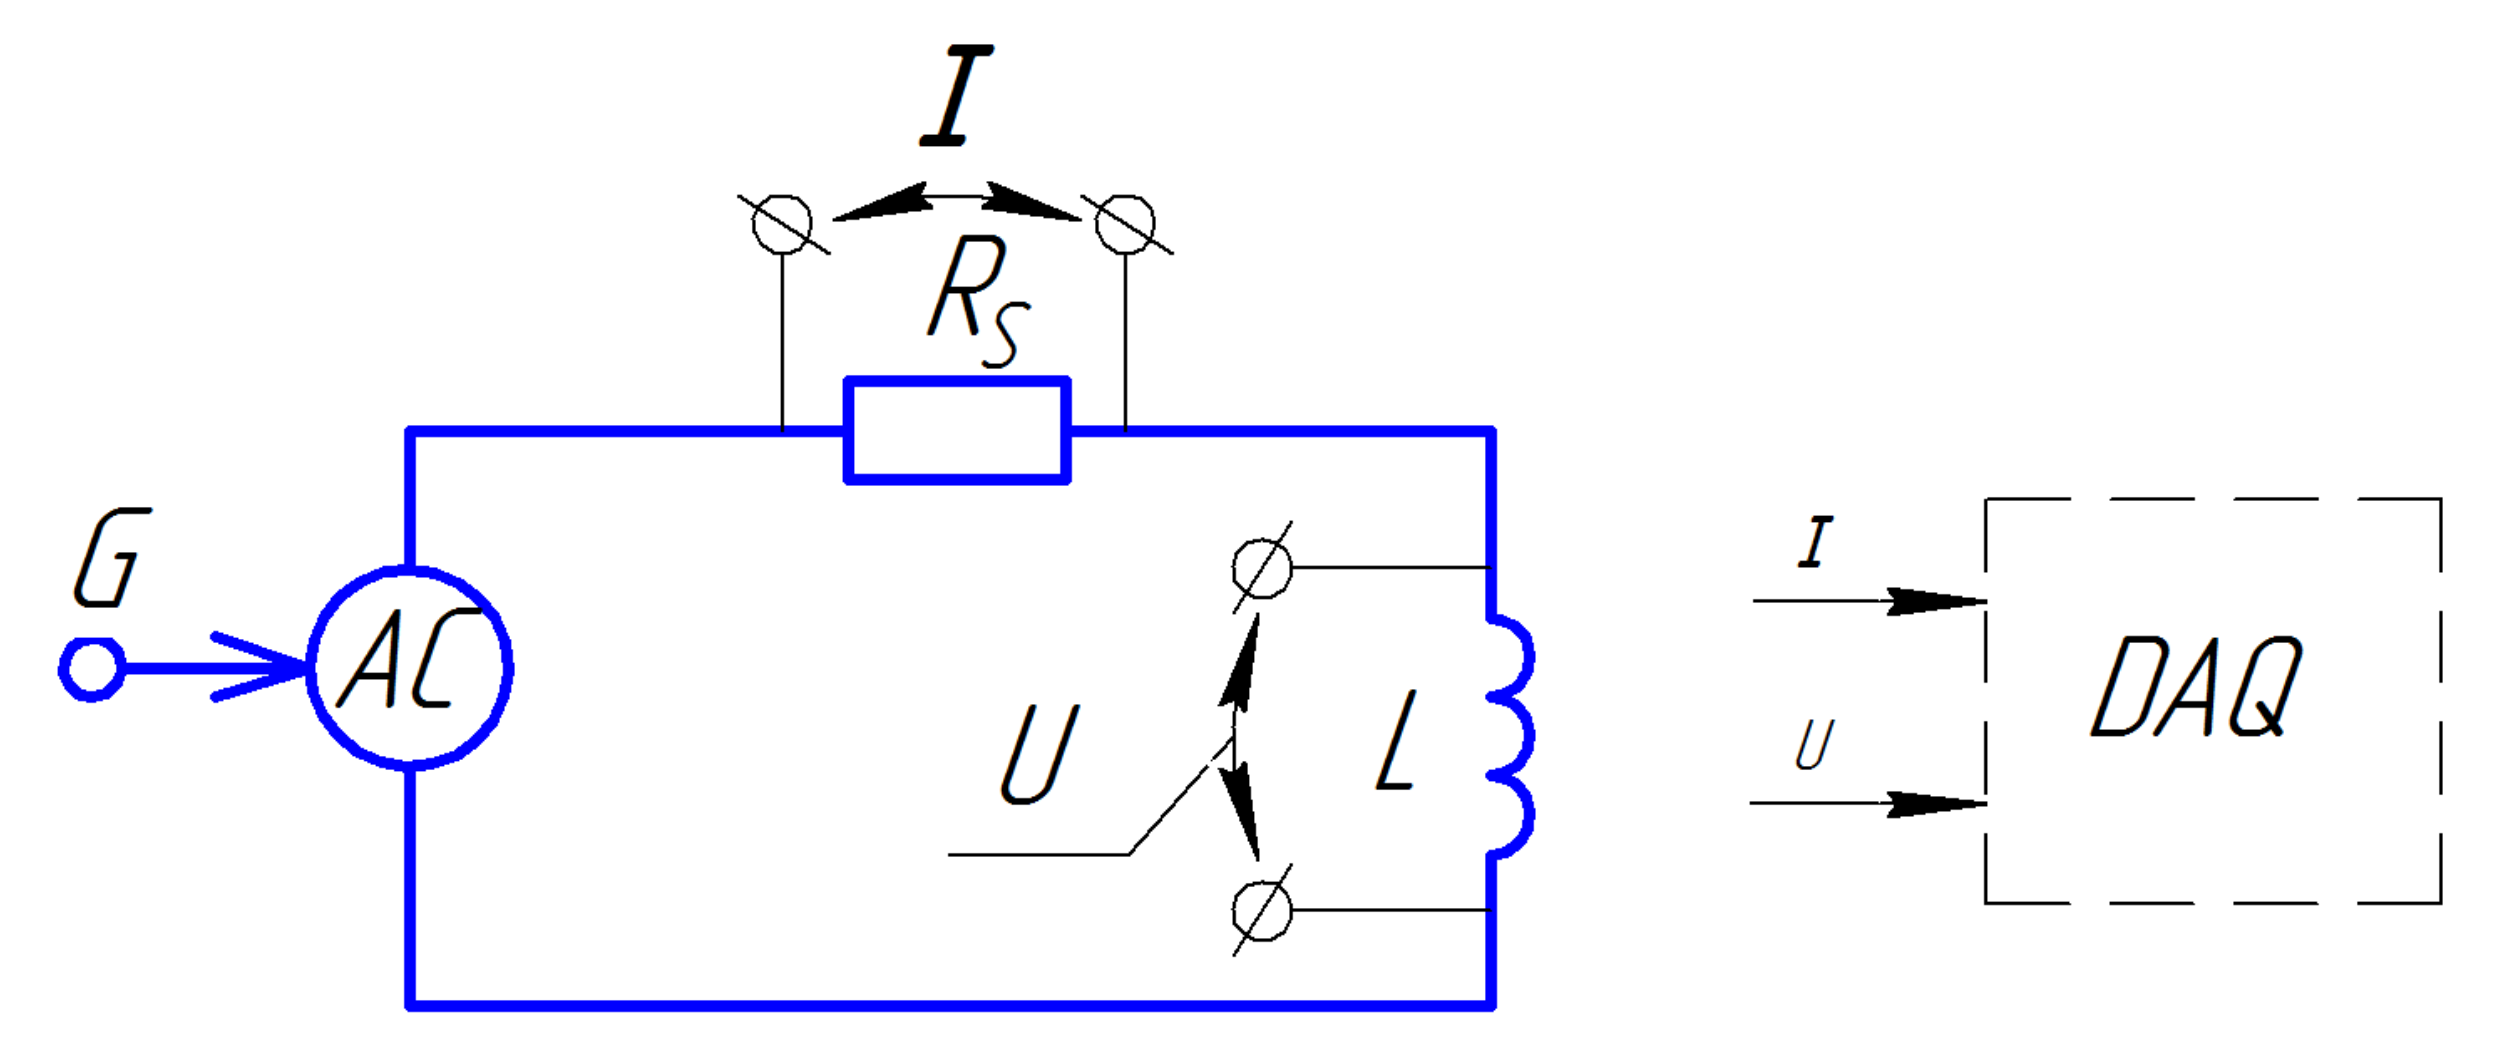
2.1. Test Bench for Study of Solitary Coils on Sinusoidal Current

A simple measuring circuit (Figure 1) consisting of a laboratory AC source (AC) controlled from an external analog generator (G), which sets the shape, amplitude, and frequency of the current, a research object (L); a precision specially developed non-inductance shunt (RS); and a data acquisition system (DAQ) is used to study the losses by the direct electric method.
The current (I) and voltage (U) signals recorded using DAQ are then processed on a PC by dividing the signal into periods and calculating the power loss at each of the periods by use of Formula (1). The DAQ in this and every other setup in this paper is Yokogawa DL850 with a sample rate not less than 500 k samples/s to ensure the signal phase precision.

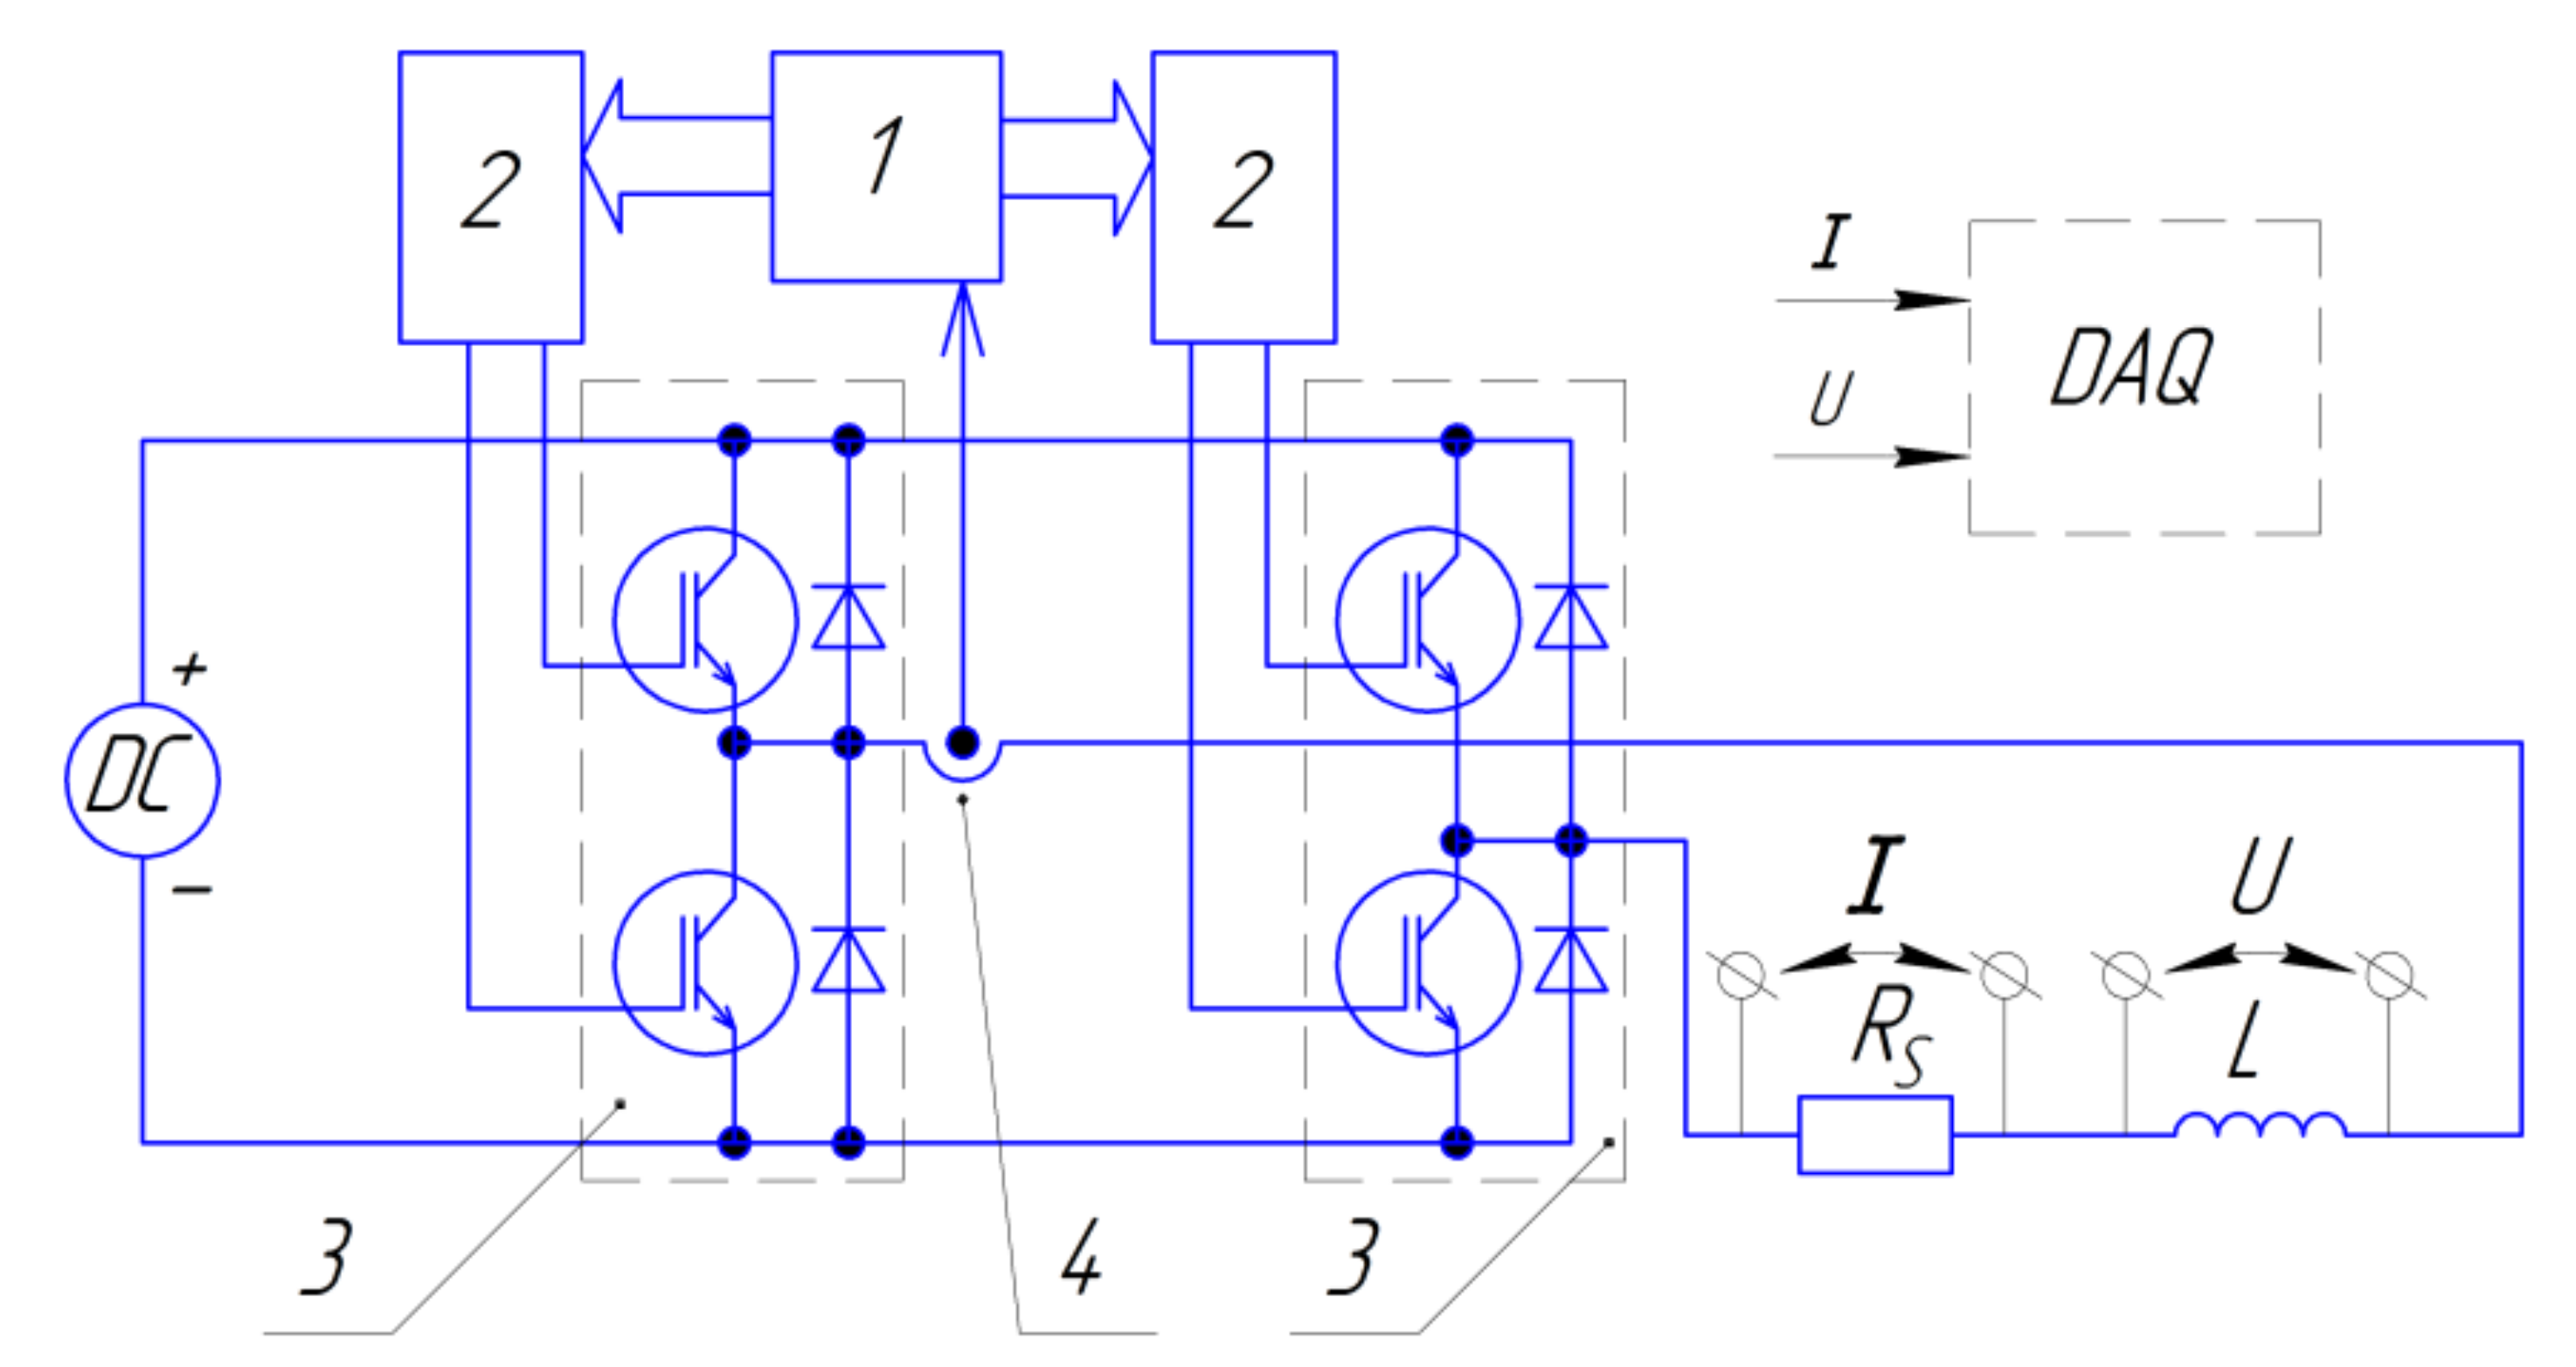
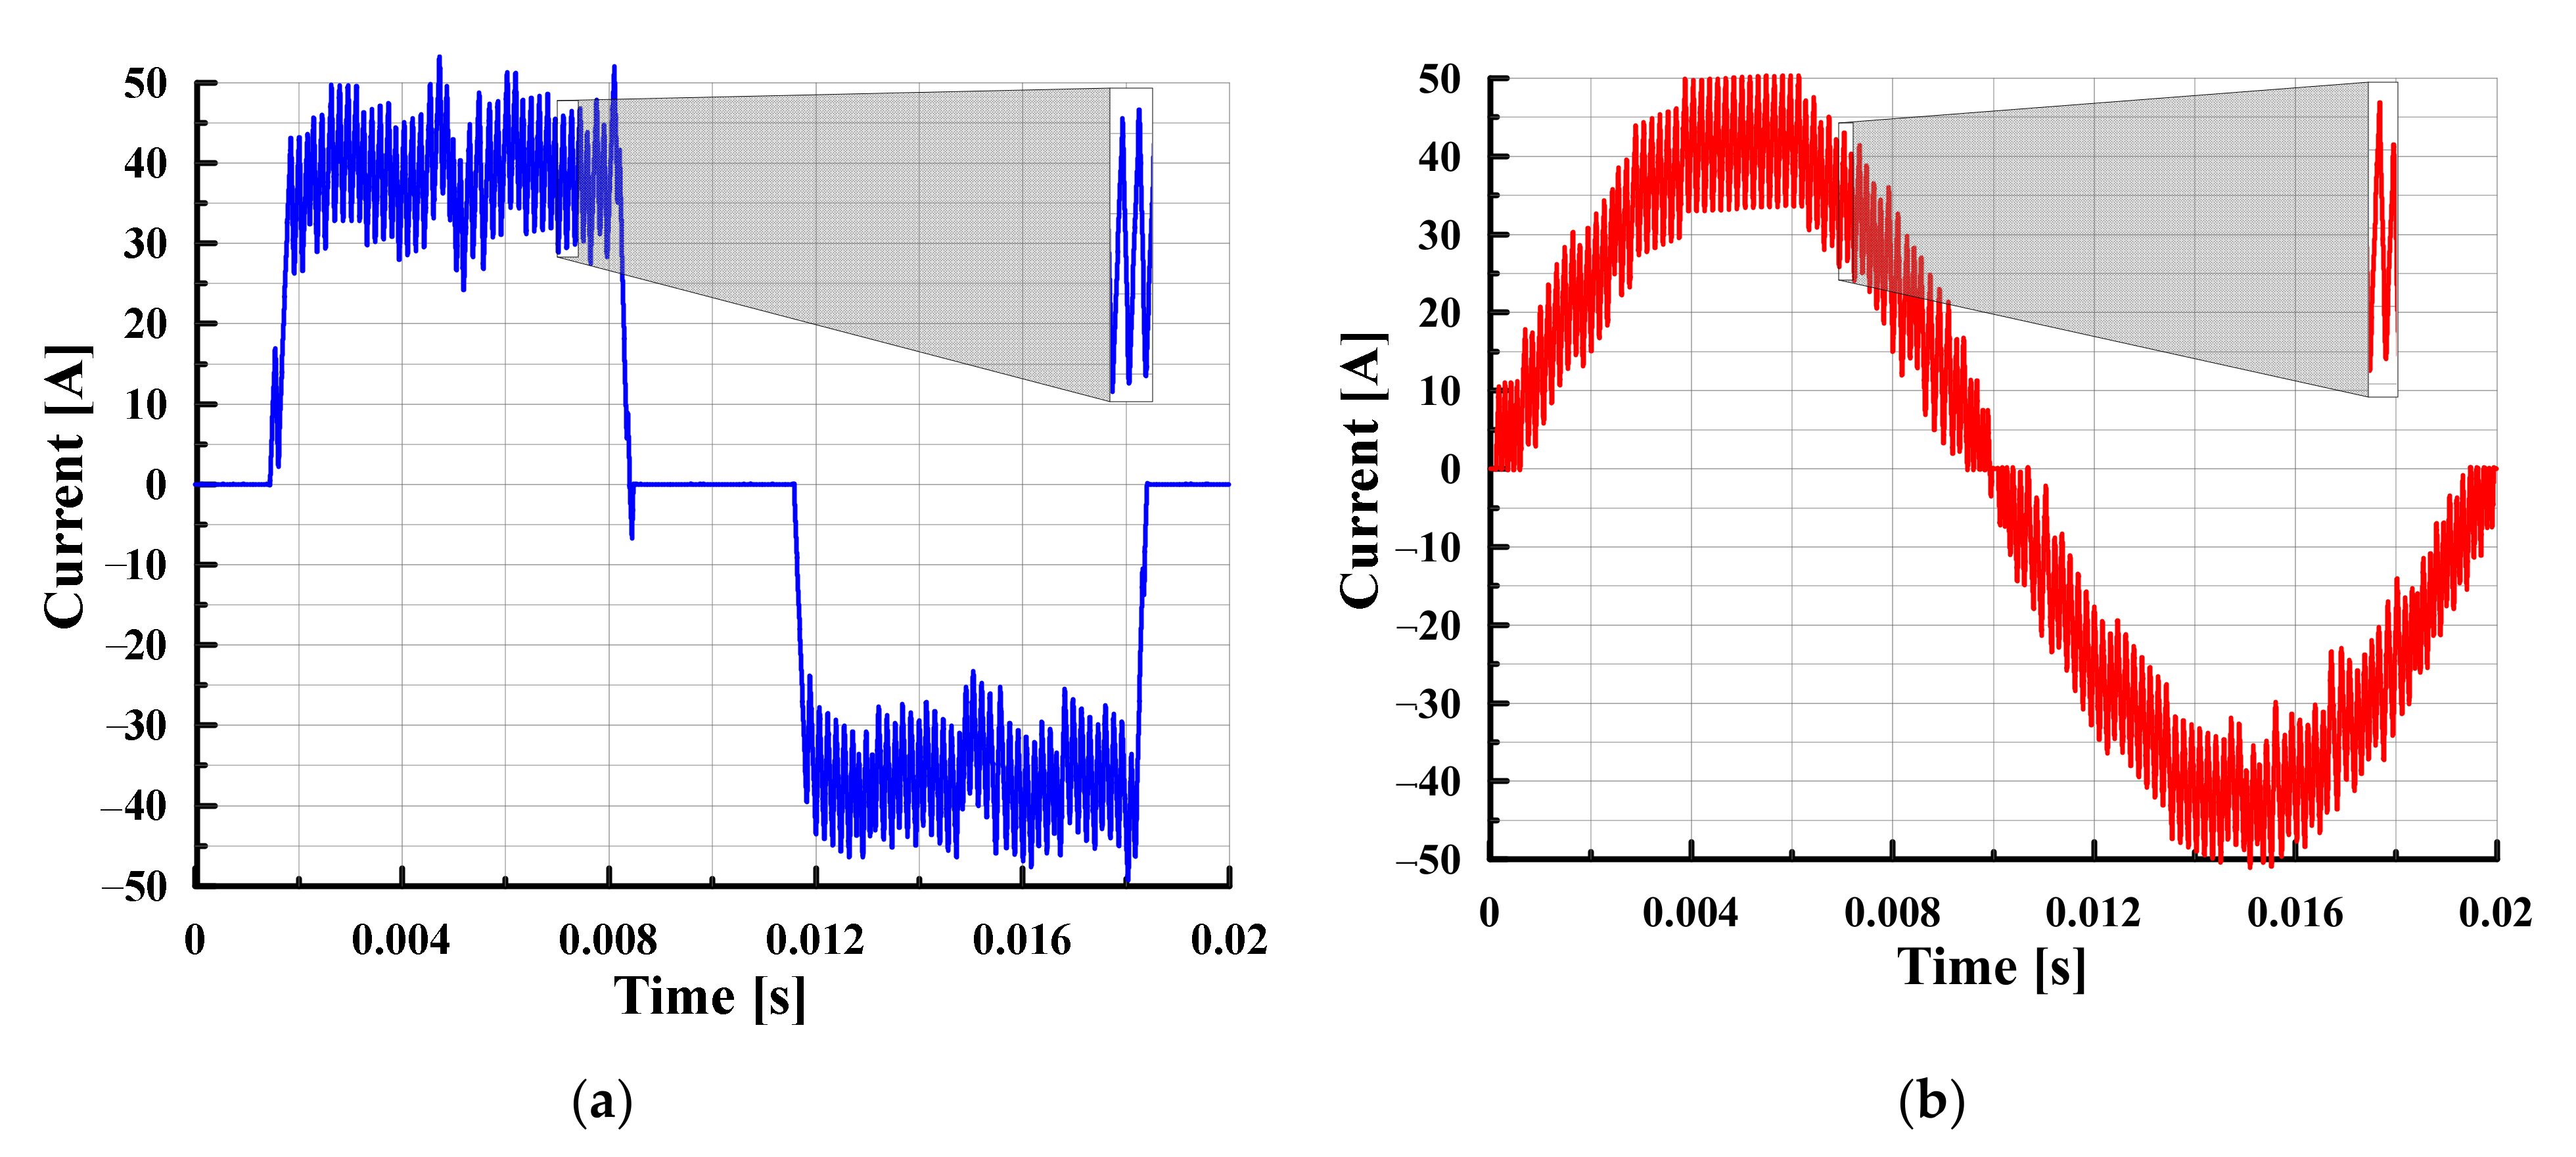
2.2. Test Bench for Loss Studies on High-Frequency Modulated Currents

In modern electronic converters that supply electric motors, voltage modulation is used to regulate the alternating voltage on the windings. As a result, the winding voltage is switched with the kHz-level frequency. In this case, the current in the winding, in addition to the main carrying frequency, will also contain harmonics associated with the switching frequency. The available laboratory source KEPCO BOP 10–100 has an upper limit frequency of times (or even dozens of times) below this level. Therefore, to research HTS coils operating with the signal equal to a power inverter output, the special simulator was developed (Figure 2).
The device is an H-bridge of power transistors controlled by drivers from a microcontroller. Due to the feedback through the current sensor, in the load (L), it is possible to reproduce any arbitrary waveform preprogrammed to the microcontroller. The principle of operation is described in more detail in the previous work [23]. Two current forms typical for brushless AC (BLAC) and brushless DC (BLDC) machines were selected for the experiments. The first is a sine obtained by modulation; the second is trapezoidal with characteristic intervals at which the current is zero. In real machines, the current configuration is determined by the design of the magnetic circuit and windings; in our stand, it is provided by the feedback loop of the microcontroller.

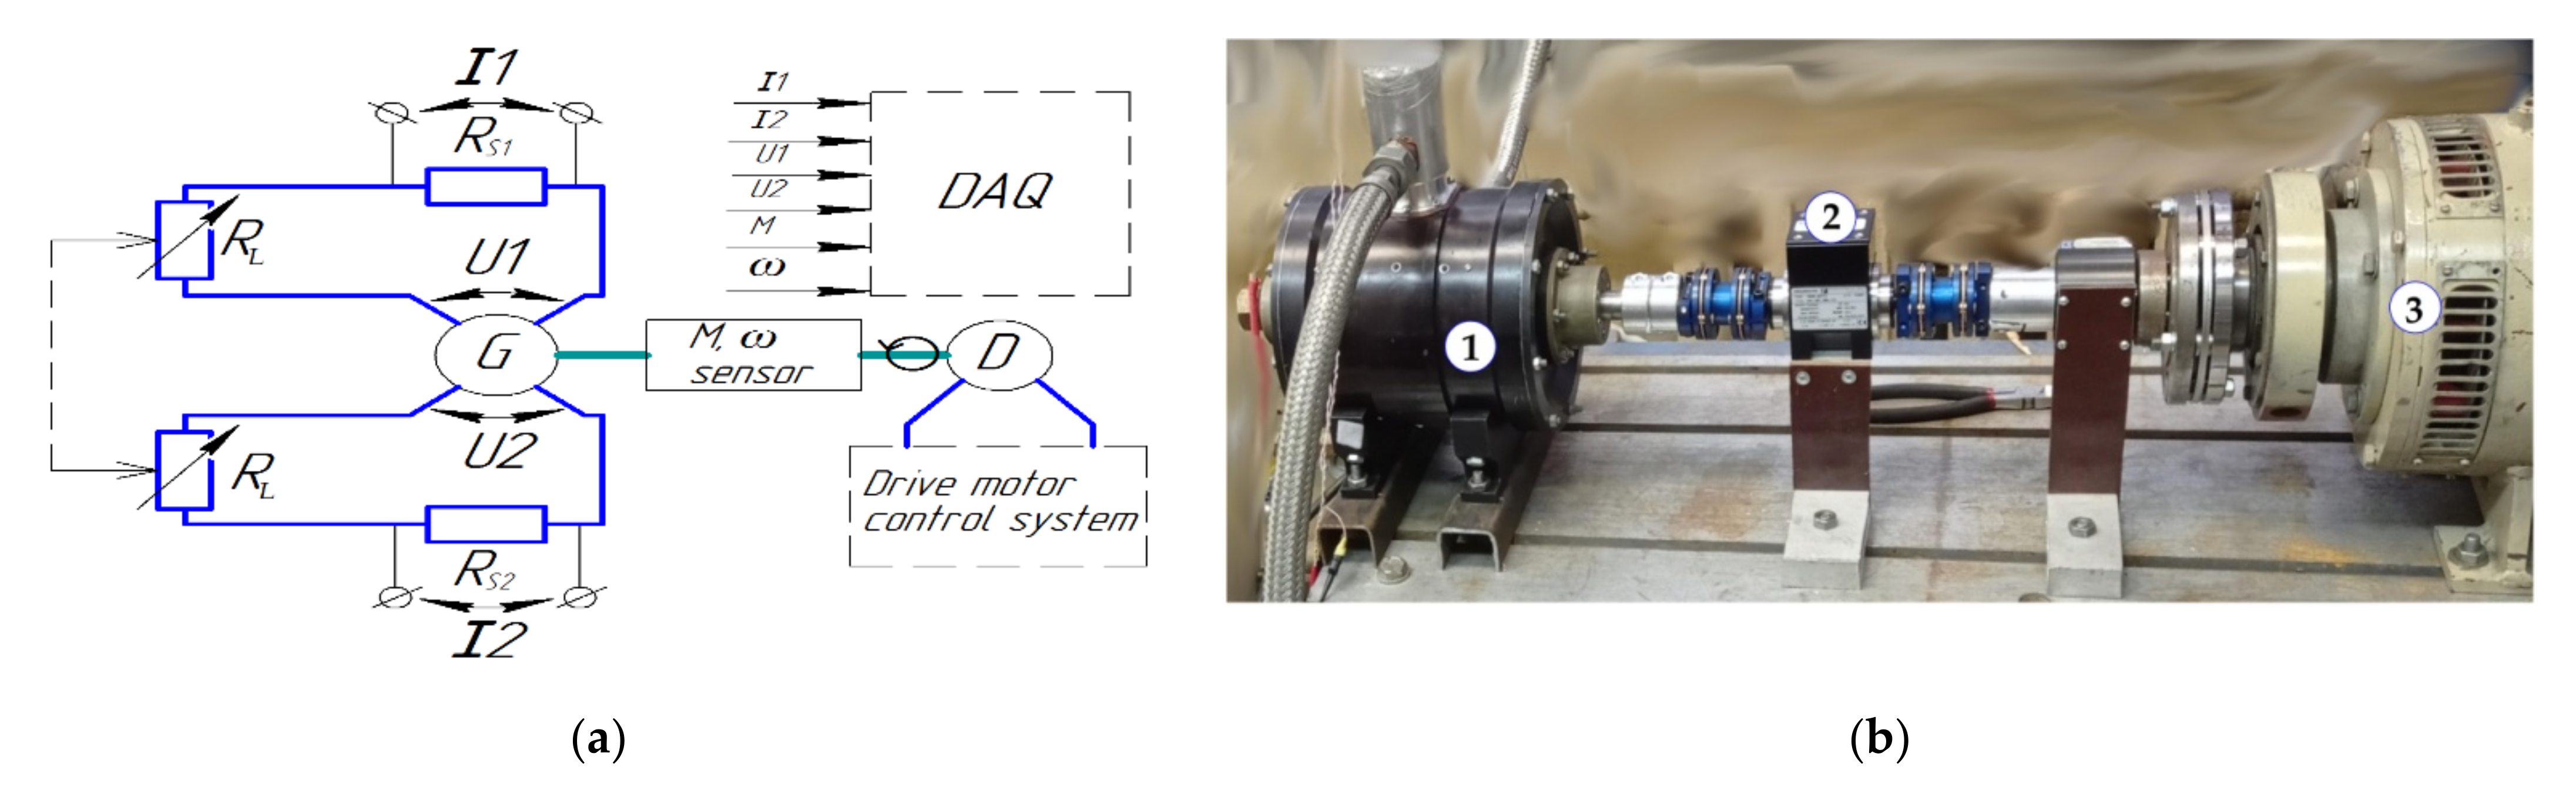
2.3. Test Bench for Loss Studies in HTS Winding

The special test bench was developed to test HTS winding in a magnetic circuit equivalent to an electric machine. It consists of the generator with HTS annular winding, motor drive, and a set of sensors. The rotor of the generator was driven by an external electric motor (Figure 3a,b).
In general, the experimental setup can be considered as a synchronous electric machine with excitation from permanent magnets. Its peculiarity is that it has two phases with the number of slots per pole and phase equal to 2. The HTS coils are cooled to a superconducting state by using liquid nitrogen (LN2) (77 K), which is poured into the body of the electric machine. This is the simplest, most reliable, cheapest, and fastest cooling method suitable for laboratory testing. The enclosure of the machine is a single volume with an LN2 inlet on the side and with output at the highest point of the structure to ensure that the volume is completely filled with coolant. The inlet is connected to the LN2 tank with excessive pressure and the flow is controlled by a manual valve installed on the tank. The coolant from the output port is collected in an open dewar. This method does not require any additional cryogenic recuperation systems or pumps. As follows from the description, the rotor is also located in the nitrogen. The rotating sealing of the machine uses a technical solution similar to the pumps for liquefied natural gas: a spring loaded PTFE seal. The mechanical part of the stand consists of a drive (D) with a control system, the device under test (G), and a sensor Magtrol TMHS 307 (Magtrol SA, Rossens / Fribourg, Switzerland) that registers the torque (M) and speed ( ω ) of rotation of the shaft. In the electrical part, the data acquisition system receives the electrical parameters of both phases (current and voltage), as well as the voltages proportional to the rotor speed and torque. All data are written to a file for further analysis on the PC.
Thus, the assembled system can be tested as an electrical two-phase generator. Winding losses ( P H T S ), in that case, can be determined via power balance:
P i n p u t = P n o   l o a d + P l o a d + P H T S .
The input power is equal to mechanical power:
P i n p u t = M · ω ,
where M and ω are the torque and the speed of the shaft, respectively, recorded by the sensor. For a two-phase electric machine, the active output power ( P l o a d ) can be calculated as
P l o a d = 1 t m 0 t m u 1 i 1 dt + 1 t m 0 t m u 2 i 2 dt ,
where u 1 i 1 and u 2 i 2 are the instantaneous values of the voltages and currents in the phases, and t m —integration period equal to the phase voltage period. No-load losses are equal to the sum of mechanical and magnetic losses P n o   l o a d = P m e c h + P m a g for each rotation speed.
Initially, no-load tests were carried out at various frequencies, which made it possible to determine the mechanical and magnetic losses in the system from the readings of the speed and torque sensor ( P i n p u t = P n o   l o a d in that case). After that, an identical, discrete variable load was connected to the phases, and the voltage and the current of each phase were recorded by the data acquisition system.

3. Research Objects

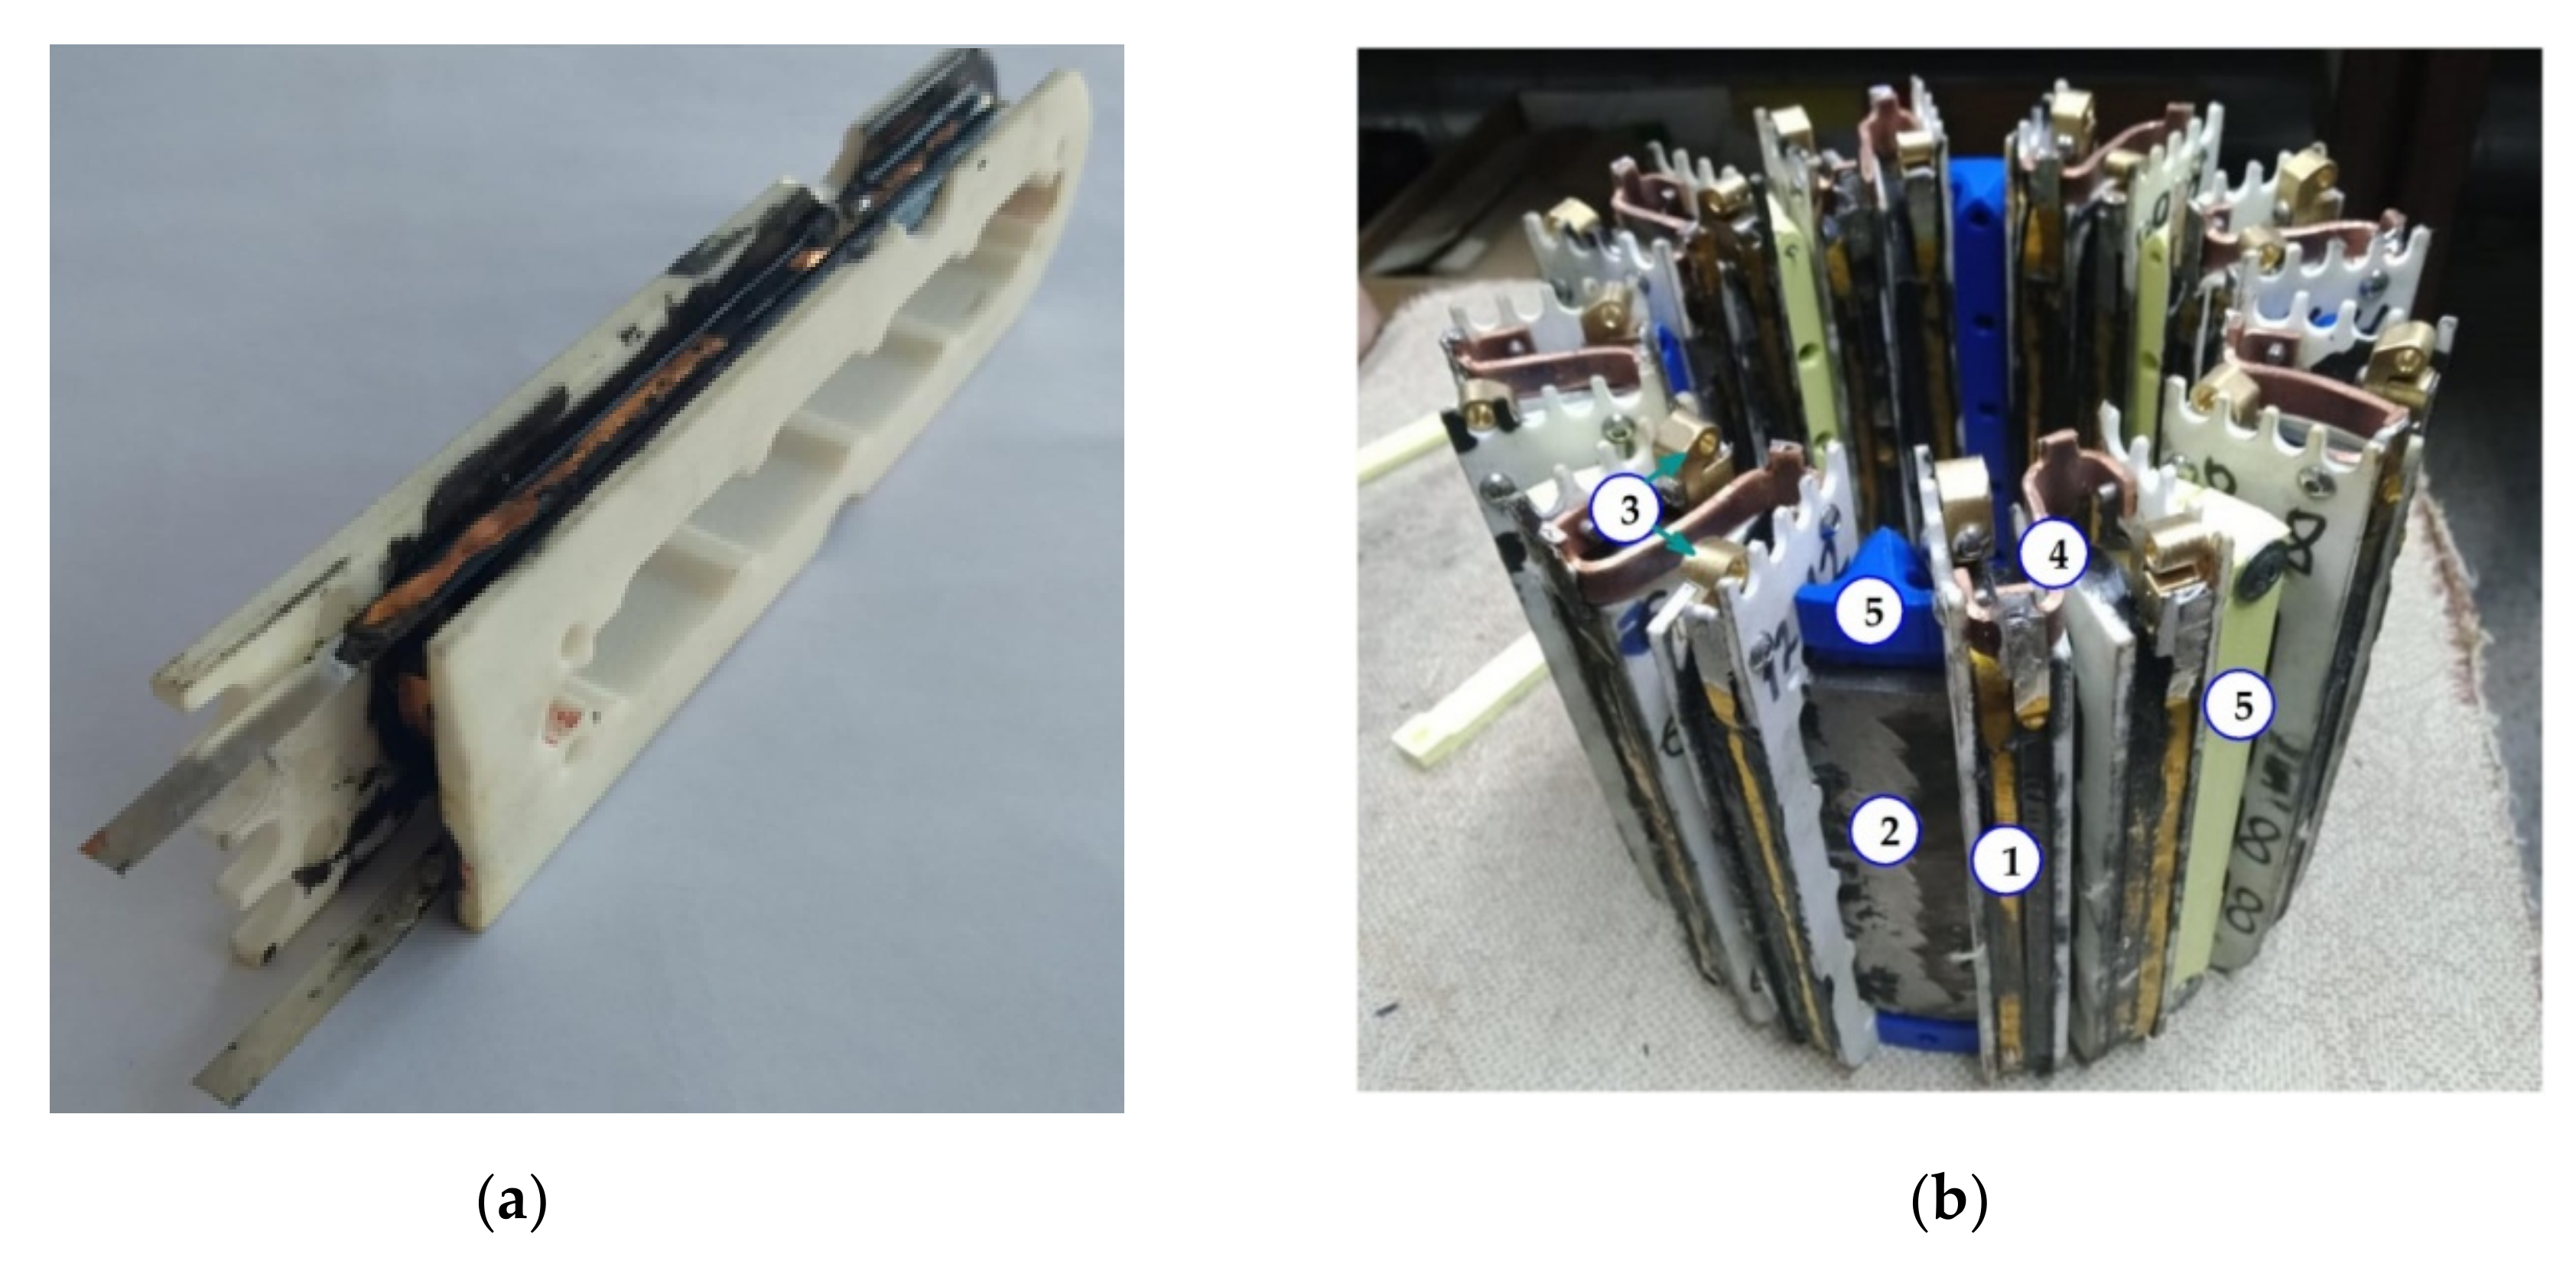
3.1. HTS Racetrack Coil

The tested coil is one of 16 coils that were made for the production of an experimental electric machine with an annular winding design. The coil has a double pancake structure with a racetrack form made of American Superconductor (AMSC) HTS tape with the magnetic substrate. The parameters of the coil are shown in the following Table 1.
The coil is impregnated with LOCTITE® STYCAST 2850FT [24] resin to eliminate electromagnetically induced noise and vibrations and strengthen the structure. This resin has proven itself well in the manufacturing of the current leads [25] and transformer winding [26]. According to the article [27], the use of the compound may cause a decrease in the critical current, but in our case [28], the decrease in the critical current is acceptable and is mainly due to the mechanical bending of the tape when laying on a small radius, as well as the changed configuration of the magnetic field in comparison with a short sample. Nevertheless, we are working on the search for new compounds for impregnation, including the development of our own mixture of binder polymer and filler; the results will be published later. The potential (voltage) taps are located approximately in the middle of the straight part of the outmost turn (Figure 4a).

3.2. HTS Winding (A Part of the Winding of an Experimental Electric Machine)

At the first stage of this section of research, the stator of an electric machine with an annular winding was manufactured (Figure 4b) [29]. Such type of winding allows for researching the worst case when HTS tape is oriented perpendicularly to the inductor magnetic field. The winding is made in a two-phase design to simplify manufacturing and assembly, with each of the phases consisting of eight coils. The coils are grouped into pairs that are evenly distributed along the length of the yoke circumference. The other phase has a similar design and is rotated 45 degrees relative to the first one.
During manufacturing, all coils were selected and sorted by critical current: each phase contains six coils with an average critical current (1μV/cm criterion) of 88 A and two coils with an average critical current of 73 A. The coils are connected to each other by a copper wire. The electrical parameters of the assembled phases are Ic1 = 89.4 A, Ic2 = 89.9 A, and the inductance is 2.35 mH and 2.25 mH, respectively, which indicates good symmetry. This factor allowed all subsequent measurements to be carried out only on one selected phase.
The process of testing the assembled winding is similar to the tests of a single coil (Section 2.1 and Section 2.2), and the only difference is the need to raise the supply voltage, according to the increased inductance. The installation of a rotor with permanent magnets (Figure 5a) (static, without rotation) inside the winding allowed us to evaluate the influence of the external magnetic field for the coils on their characteristics (critical current and losses). The rotor in this experiment was statically fixed at 15 points with a step of 6 degrees (90 degrees total) using a special positioning device, which is enough to obtain a complete angular dependence of the characteristics on the angle of rotation since the rotor has two pairs of poles. The assembled machine is shown in Figure 5b.

4. Test Results

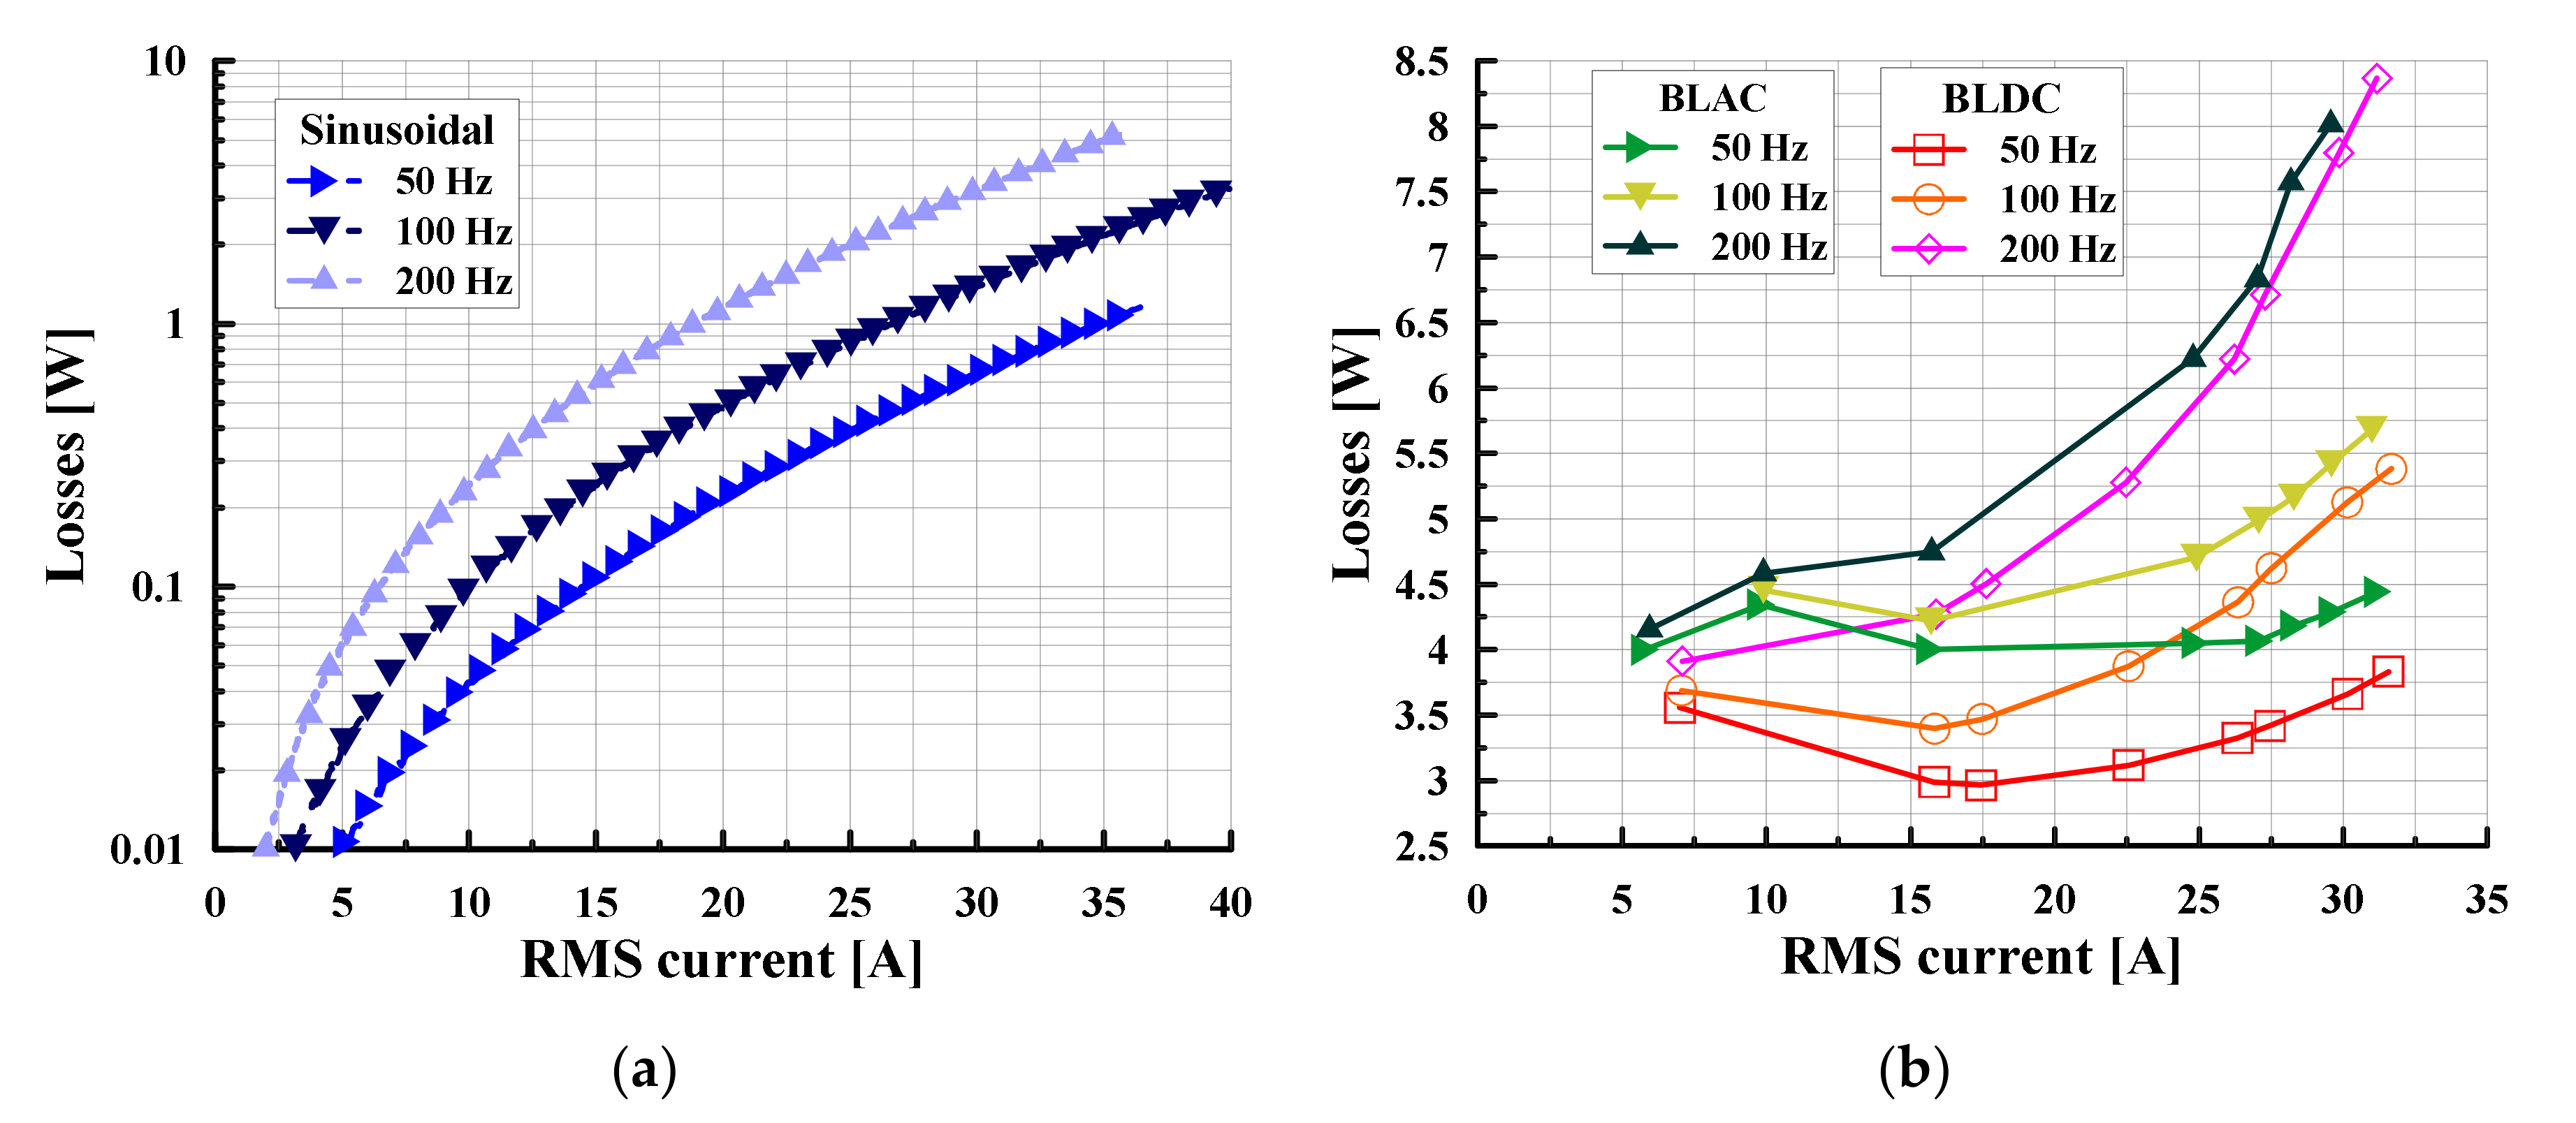
4.1. AC Losses Tests of an Assembled Phase

The solitary coil was tested on a sinusoidal current (according to the method from p. 2.1) and at modulated currents (according to the method of p. 2.2). The frequency of the main harmonic was 50, 100, and 200 Hz. The results are shown in Figure 6a,b. On these charts (and beyond) losses are presented in watts, as this makes it easier to understand what the increase in the load on a potential cryogenic system is from experiment to experiment. One can see that loss values for BLDC and BLAC modes are significantly higher even for low currents, and remain several times higher at maximum current amplitudes.
For more clarity, on the Figure 7a,b, two periods of current are shown: BLDC and BLAC. Due to the concept of obtaining currents of this form, which is associated with chopping relatively high voltage using transistors [30,31], a large amount of electromagnetic interference occurs, which significantly complicates the computer processing of experimental data. For a pure sine, 3 to 5 signal periods are sufficient to accurately determine the losses at a given current amplitude. However, for the currents shown in Figure 7a,b, the situation changes significantly.
Figure 8 shows the dependence of the losses calculated on the period for three current levels. Moreover, the representation of the dependence of losses on the amplitude value of the current, in contrast to the pure sine, is difficult and ambiguous. In this regard, all the graphs in this paper, where the current form BLDC and BLAC appears, use the effective (RMS) current value.
On the graphs, there is a certain average value, with noise superimposed on it. If the calculation of losses was carried out for a small number of periods, this will lead to a large error. The high-frequency component (Figure 7) makes a significant contribution to the loss value since its amplitude is significant (about 10 A) and invariant to the amplitude of the main harmonic. The current in armature produces a magnetic field, which opposes the main field of machine and thus, will distort the main field of machine [32]. The frequency of the current ripple is not constant and floats between approximately 7 and 12 kHz, due to the transistor switching control algorithm. If we consider the form of the BLAC current (Figure 7b), the situation is similar to the case described in [33], where losses on a sinusoidal current were modeled with the addition of higher harmonics up to the 20th. In our case, on the one hand, the ripple current has a frequency of at least 140th harmonic (for 50 Hz fundamental), and, on the other hand, is not sinusoidal, but rather sawtooth. Thus, this signal also has its own higher-order harmonics. In comparison, for a constant frequency modulation mode, the current ripple can be reduced by adding a filter in the converter circuit, while the filter itself will have high weight and size characteristics. In our case, due to the floating frequency, the creation of such a filter is difficult; therefore, considering the above, we place the HTS coils in the most difficult operating conditions in terms of modulation.

4.2. AC Losses Tests of an Assembled Phase

The next step was to test the assembled winding. Now the single coils are combined into a system, while they are located on a common charged magnetic core made of 2412 steel. Figure 9a shows the direction of the current in the phase coils. The measurement scheme for sine current is similar to Figure 1, where (L) now represents the assembled phase rather than a separate coil.
Before measurements, the level of hysteresis losses in the yoke with taking into account the steel real magnetization curve using the ANSYS software [34] was calculated. For electromagnetic analysis, ANSYS implements the magnetic vector potential formulation.
As a result, the hysteresis losses per cycle at a current amplitude of 60 A are less than 2·10−3 J/cycle, which is much less than the losses in the winding. The magnetic field distribution at 60 A amplitude of the current in the steel core was shown in Figure 9b.
The phase was tested on a sinusoidal current, and the frequency of the main harmonic was 50, 100, and 200 Hz (Figure 10a). Figure 10a shows that the losses increased more than the sum of the losses in the eight single coils (compare with Figure 6a). One of the reasons for this effect is the changed configuration of the magnetic field on the HTS coils. It is also possible that additional electromagnetic vibrations occur due to complexity of the assembly. Thus, for the phase, in terms of one coil, the losses increase by approximately 1.2 times compared to a solitary coil.
Just as in the case of a single coil, the winding was tested on the same bench with modulated currents (Figure 10b). An important feature was a significant reduction in the amplitude of high-frequency fluctuations on the winding (Figure 11) in comparison with a single coil. To achieve the same current amplitudes, the supply voltage was raised to 100 V (from previously 15 V) due to the increased inductance.
However, despite the improved operating conditions of HTS coils with respect to the high-frequency component, the losses in the winding increased significantly in comparison with the sinusoidal current (compare Figure 6b and Figure 10b). This is due to both increased losses in HTS coils operating at such a current and being exposed to an external magnetic field produced by the coils [35] and losses in the steel of the magnetic circuit.

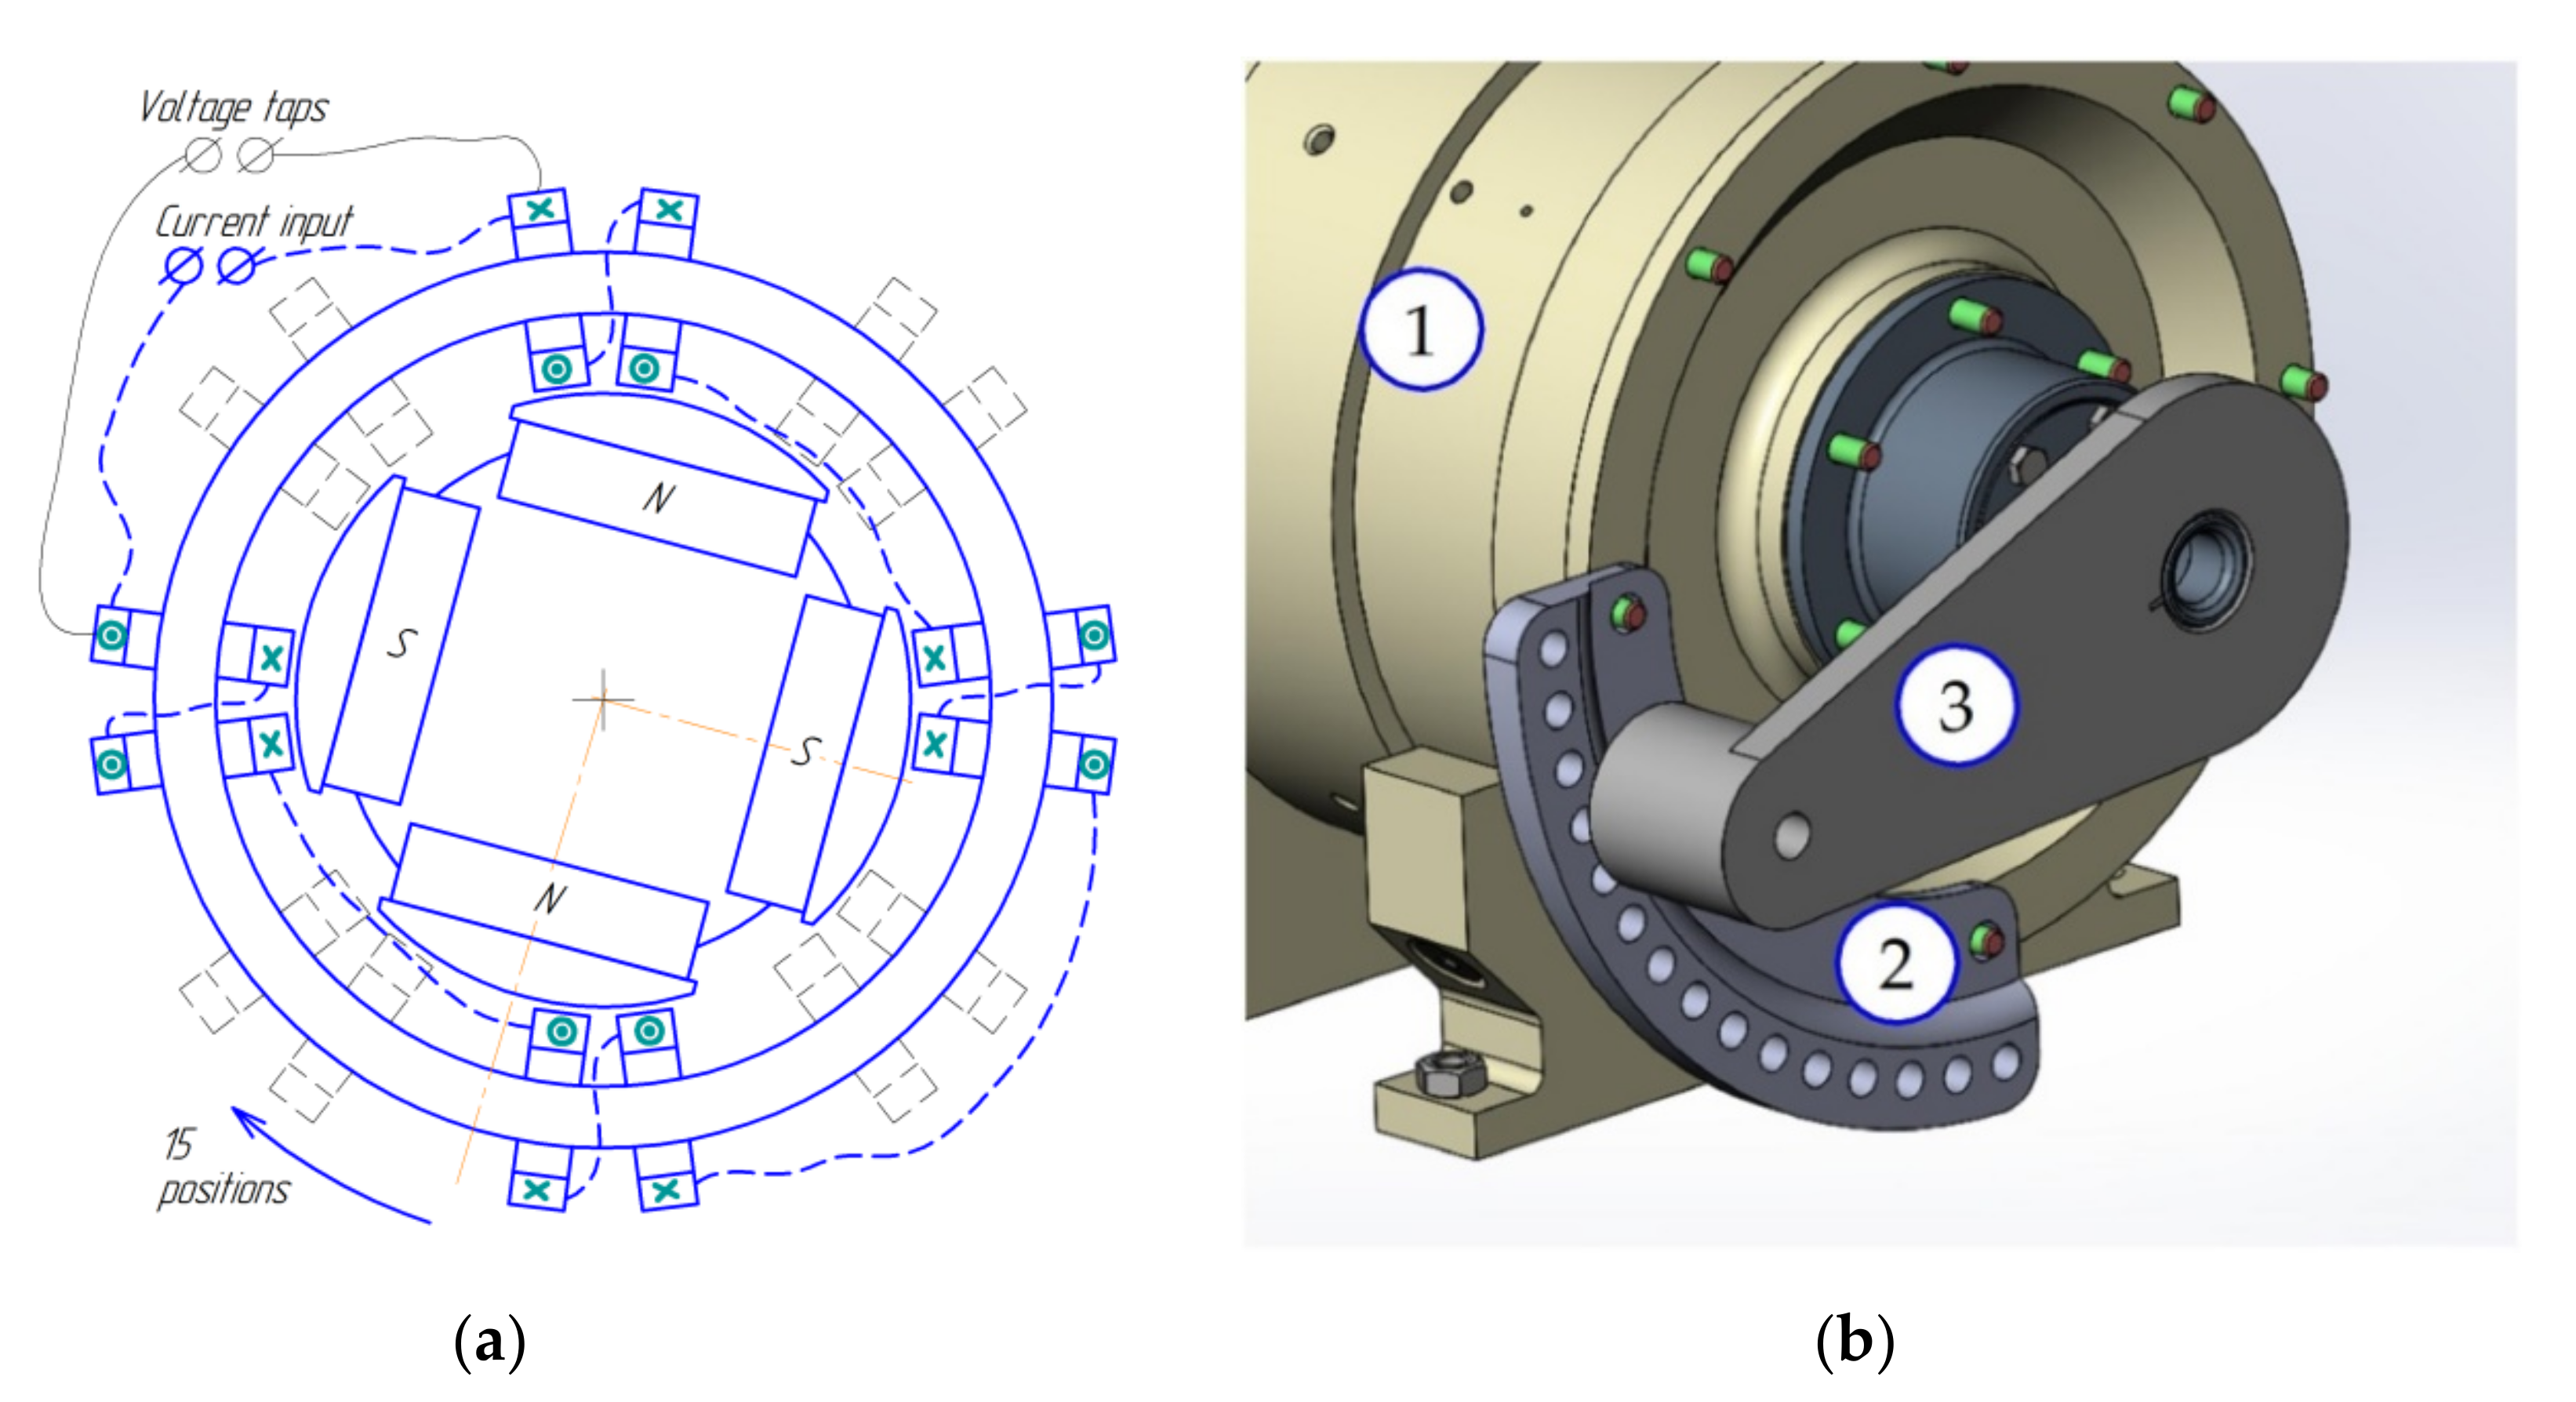
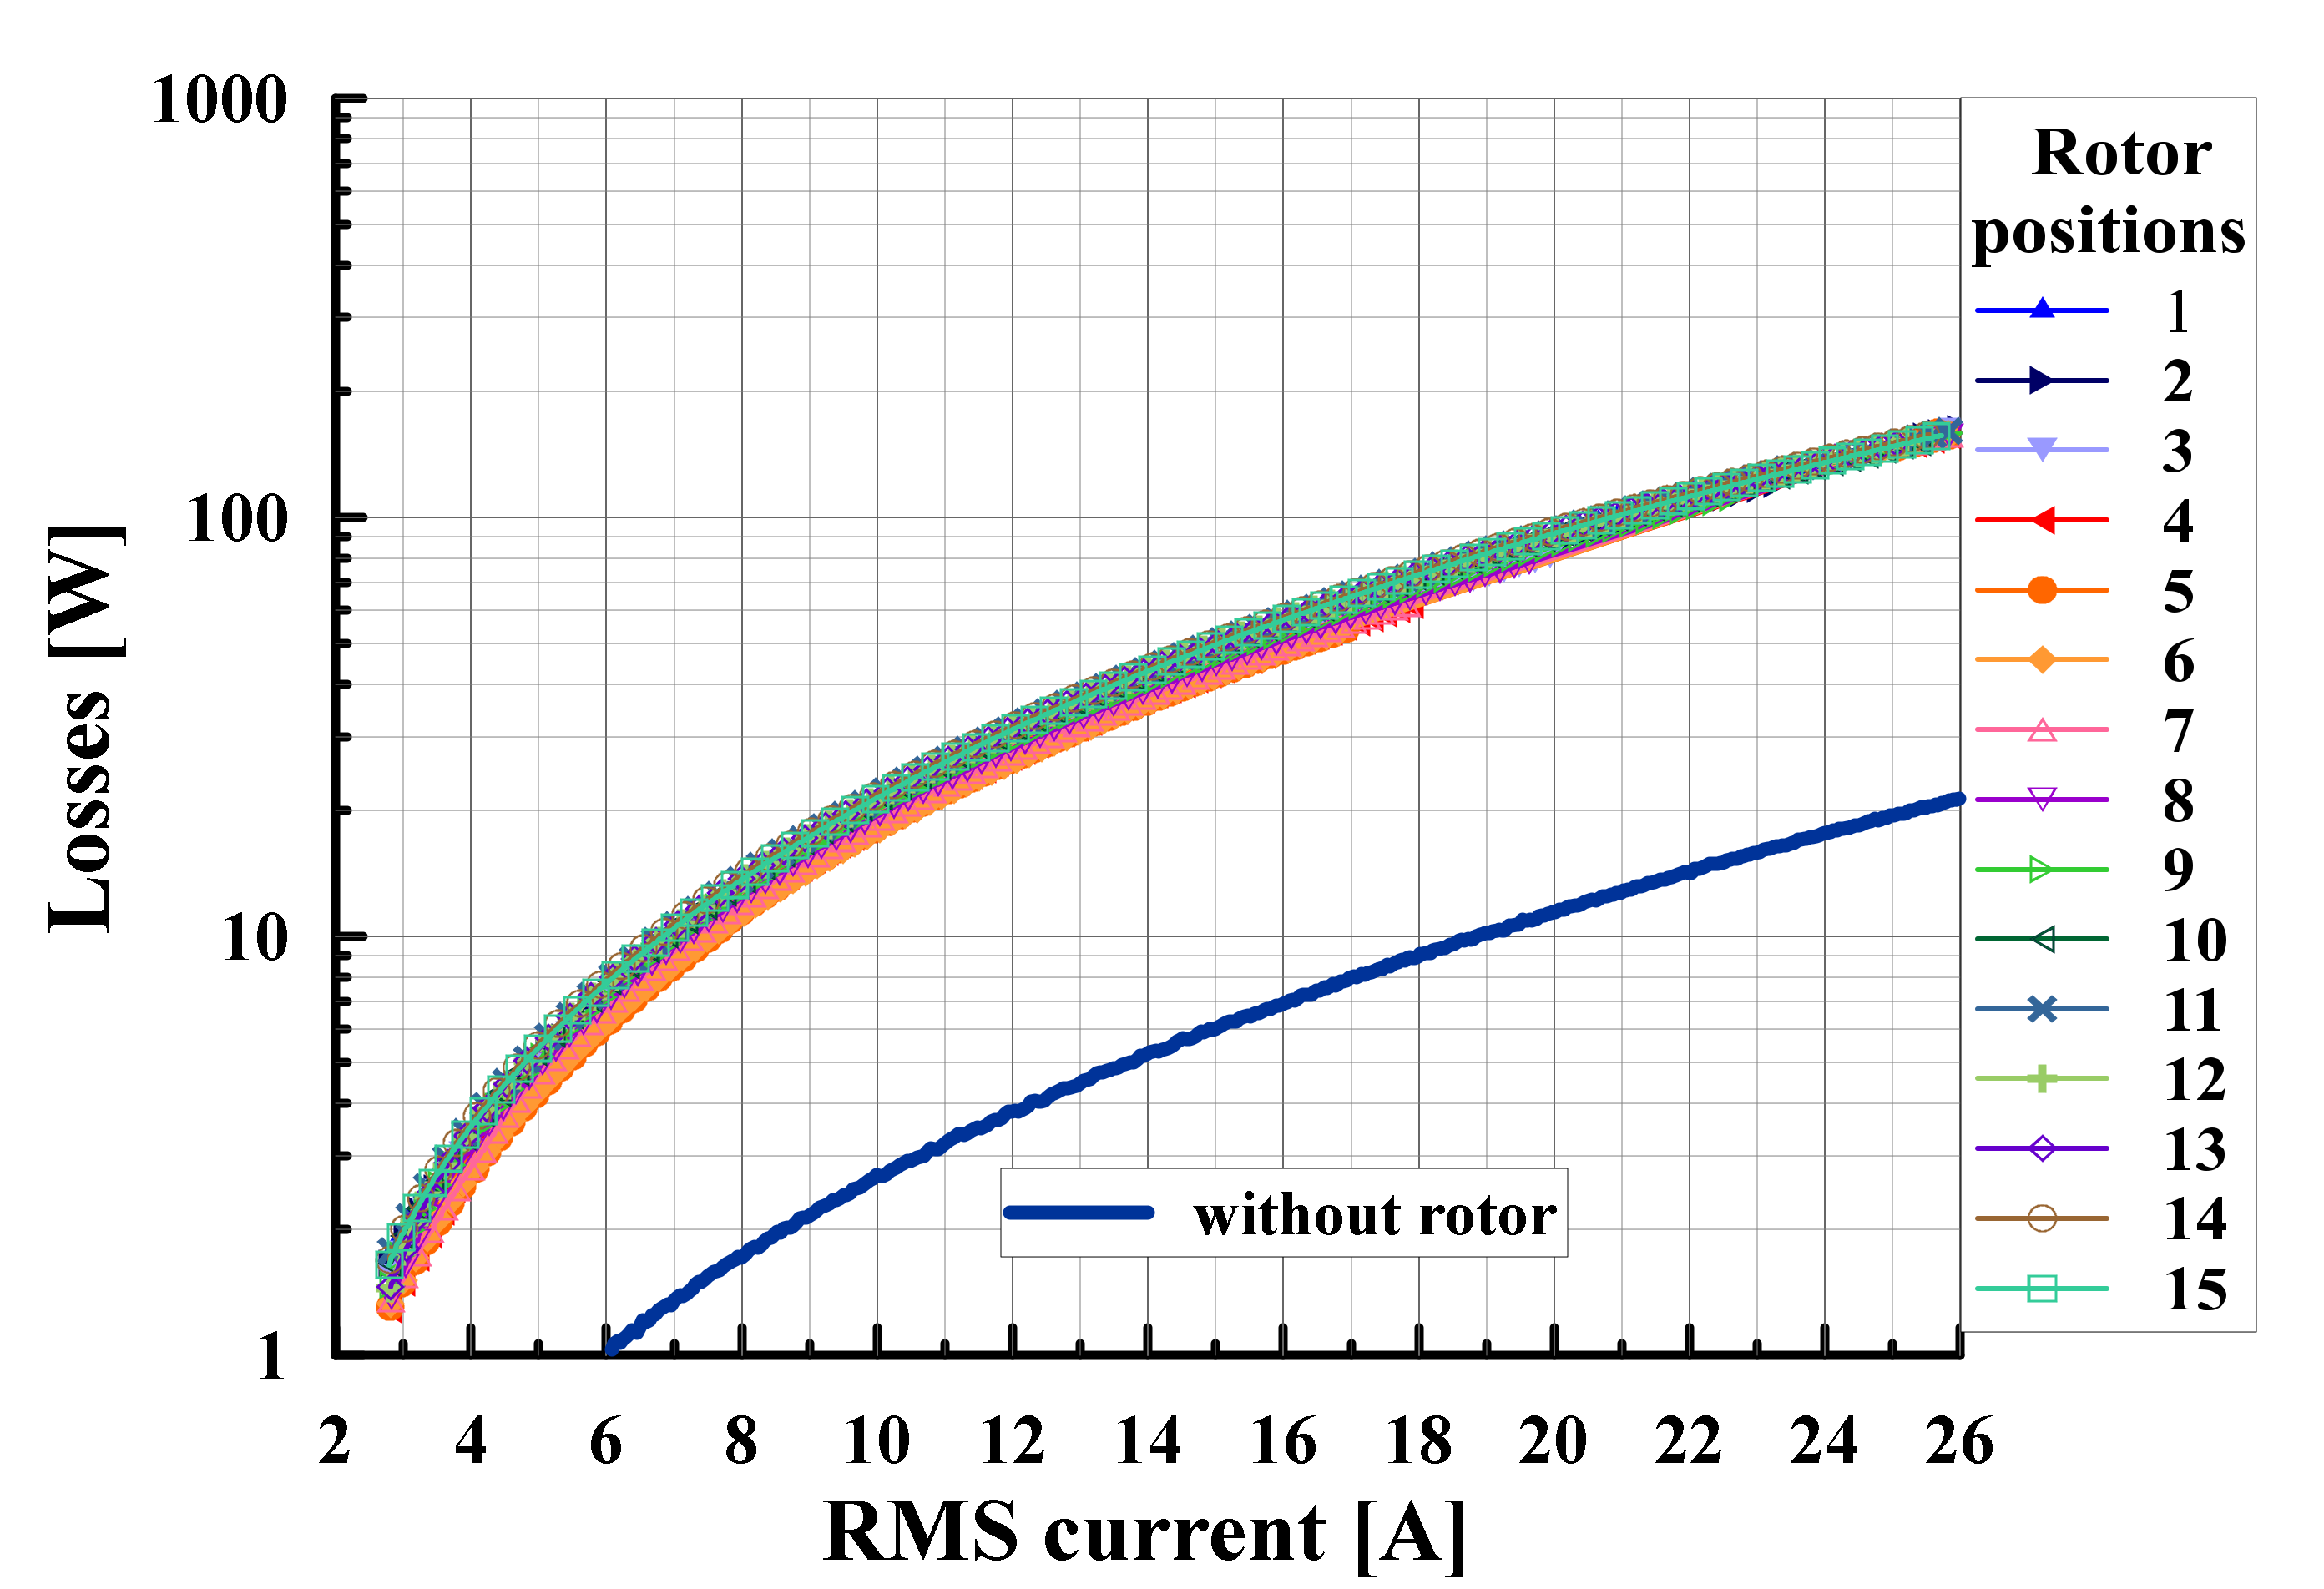
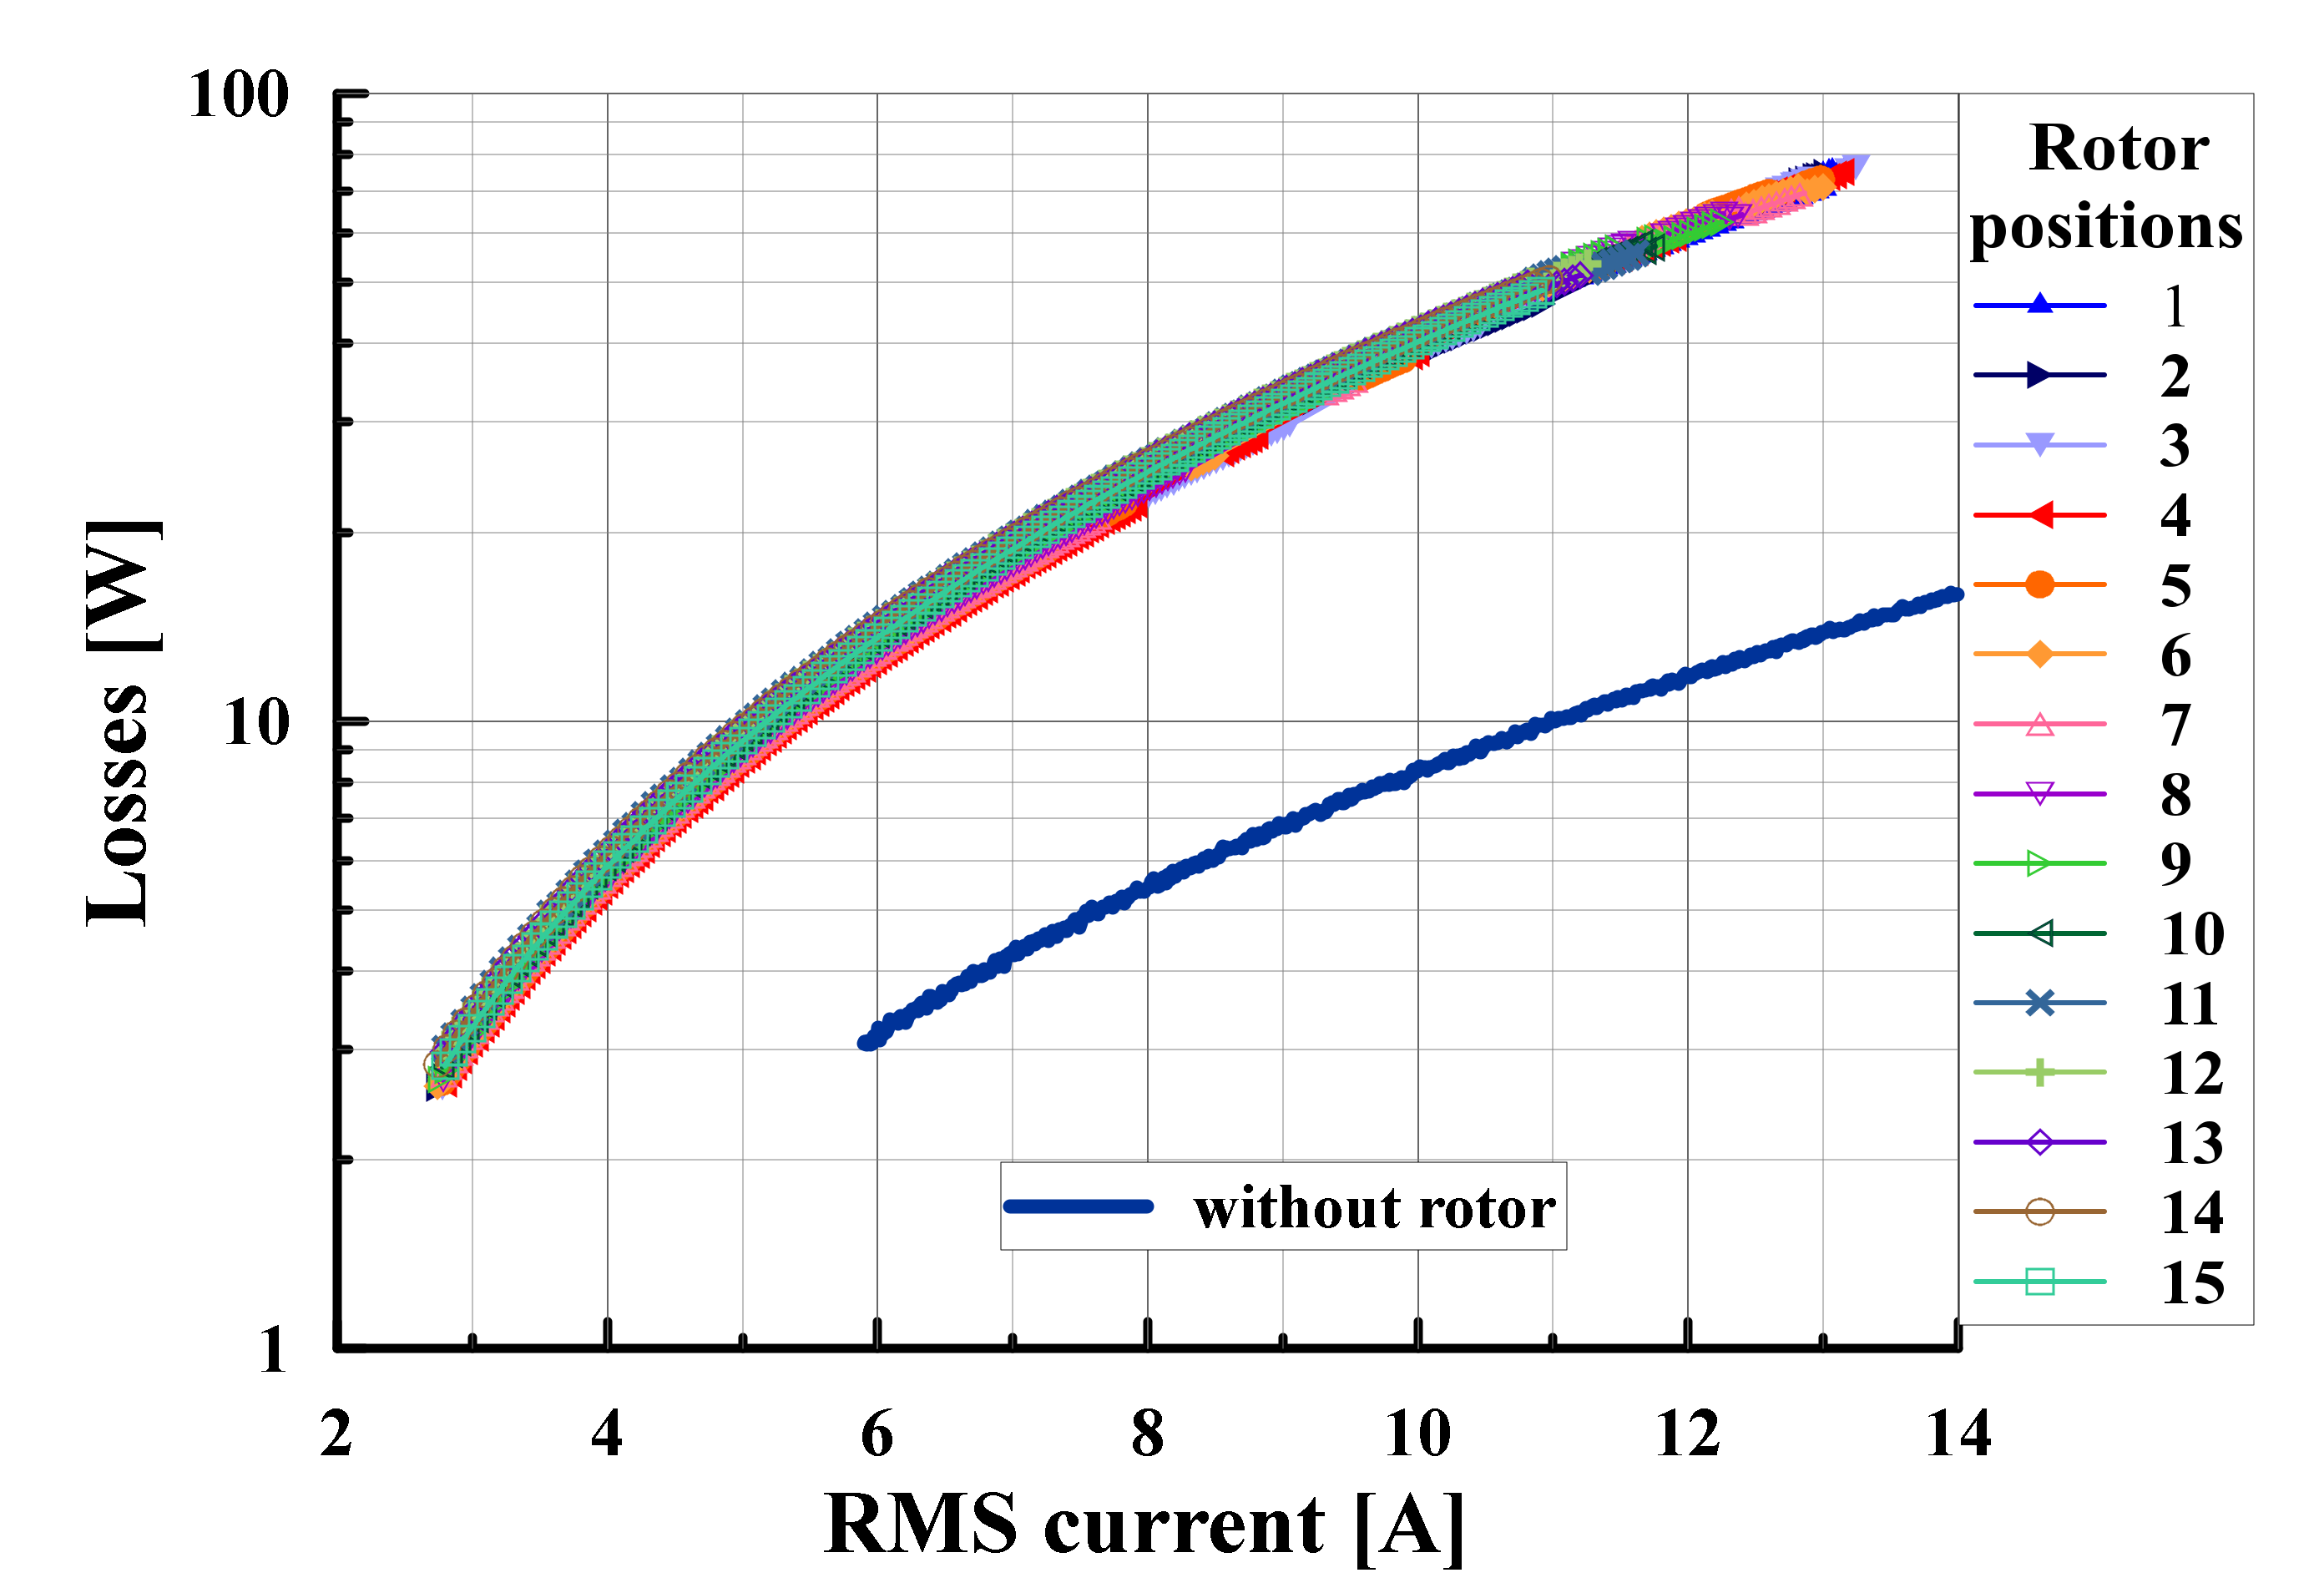
4.3. Experimental Results with Static Rotor

After installing the rotor, linear parts of coils that face inwards to the center axis of the assembly are now exposed to the magnetic field with a significant component perpendicular to the tape surface. Thus, this condition should affect the characteristics of the tape, and first of all, the critical current. To confirm this fact, the critical current of one of the phases was measured in five positions (Figure 5a,b) of the rotor: holes number “0,” “4,” “8,” “12,” and “15,” which corresponds to the rotor positions of 0, 25.6, 45, 76.8, and 90 degrees. A comparison with the critical current of the phase without the installed rotor (89.4 A) is given in Table 2.
As follows from the table, the influence of the rotor position does not have a very large effect on the critical current (the difference between the maximum and minimum values is only 12%). However, after installing the rotor, the critical current decreased by half (the average value in column No. 3 of Table 2), which indicates the significant influence of the external magnetic field on the critical current of the used HTS tape.
Further studies on alternating current were carried out. In contrast to the critical current measurement, the AC experiment involved all 15 angular positions of the rotor. Losses were measured at frequencies of 50, 100, and 200 Hz. For 50 Hz, the obtained curves differ in the level of losses depending on the angle of the rotor position (Figure 12).
In addition, in the range from 5 to 15 A for several positions of the rotor, a certain break in the dependence of losses on current is noticeable. One of the explanations for this behavior is the effect that appeared during the experiment, associated with the vibration of the rotor. The alternating of, but not rotating of, the magnetic field generated by the test phase interacts with the rotor. At the same time, the equipment fixing the rotor (Figure 5) has a finite rigidity, which leads to an oscillation of the rotor relative to a given position with a visually noticeable angular amplitude, and, consequently, the occurrence of some mechanical power losses.
At a frequency of 100 Hz, the pattern of loss dependence on the angle changes, becoming less noticeable (Figure 13). During the tests, the observed visual vibrations of the rotor relative to the fixing points were significantly reduced.
A further increase in the frequency showed an even weaker dependence of the losses on the angle of installation of the rotor, while its visual vibration was absent. Figure 14 shows the losses in the stator as a function of the current at different rotor mounting angles at a frequency of 200 Hz.
Due to the parameters of the test bench at a frequency of 200 Hz, it was impossible to supply the phase with the RMS current value higher than 14 A; however, even at this amplitude, the losses reached a value of 80 W.
At the end of the sequence of the experiment with the braked rotor, the phase was tested by modulated currents in different positions of the installed rotor. Similar to the case with a sinusoidal current, the loss levels showed a weak dependence on the angle of installation of the rotor, so, in this regard, the graph (Figure 15) shows the average values for each frequency.
As before, for the case of a single coil and an assembled stator (without a rotor), the modulated current mode is the heaviest in terms of losses. It was decided to limit the power loss in the winding to approximately 200 W level in order to avoid possible damage until the final stage of the experiment with the rotating machine was completed. To ensure this, the input current at 100 Hz was limited to about 25 A RMS, and at 200 Hz, it was limited to about 16 A RMS. The difference in losses on different forms of current was minimal at each of the frequencies.

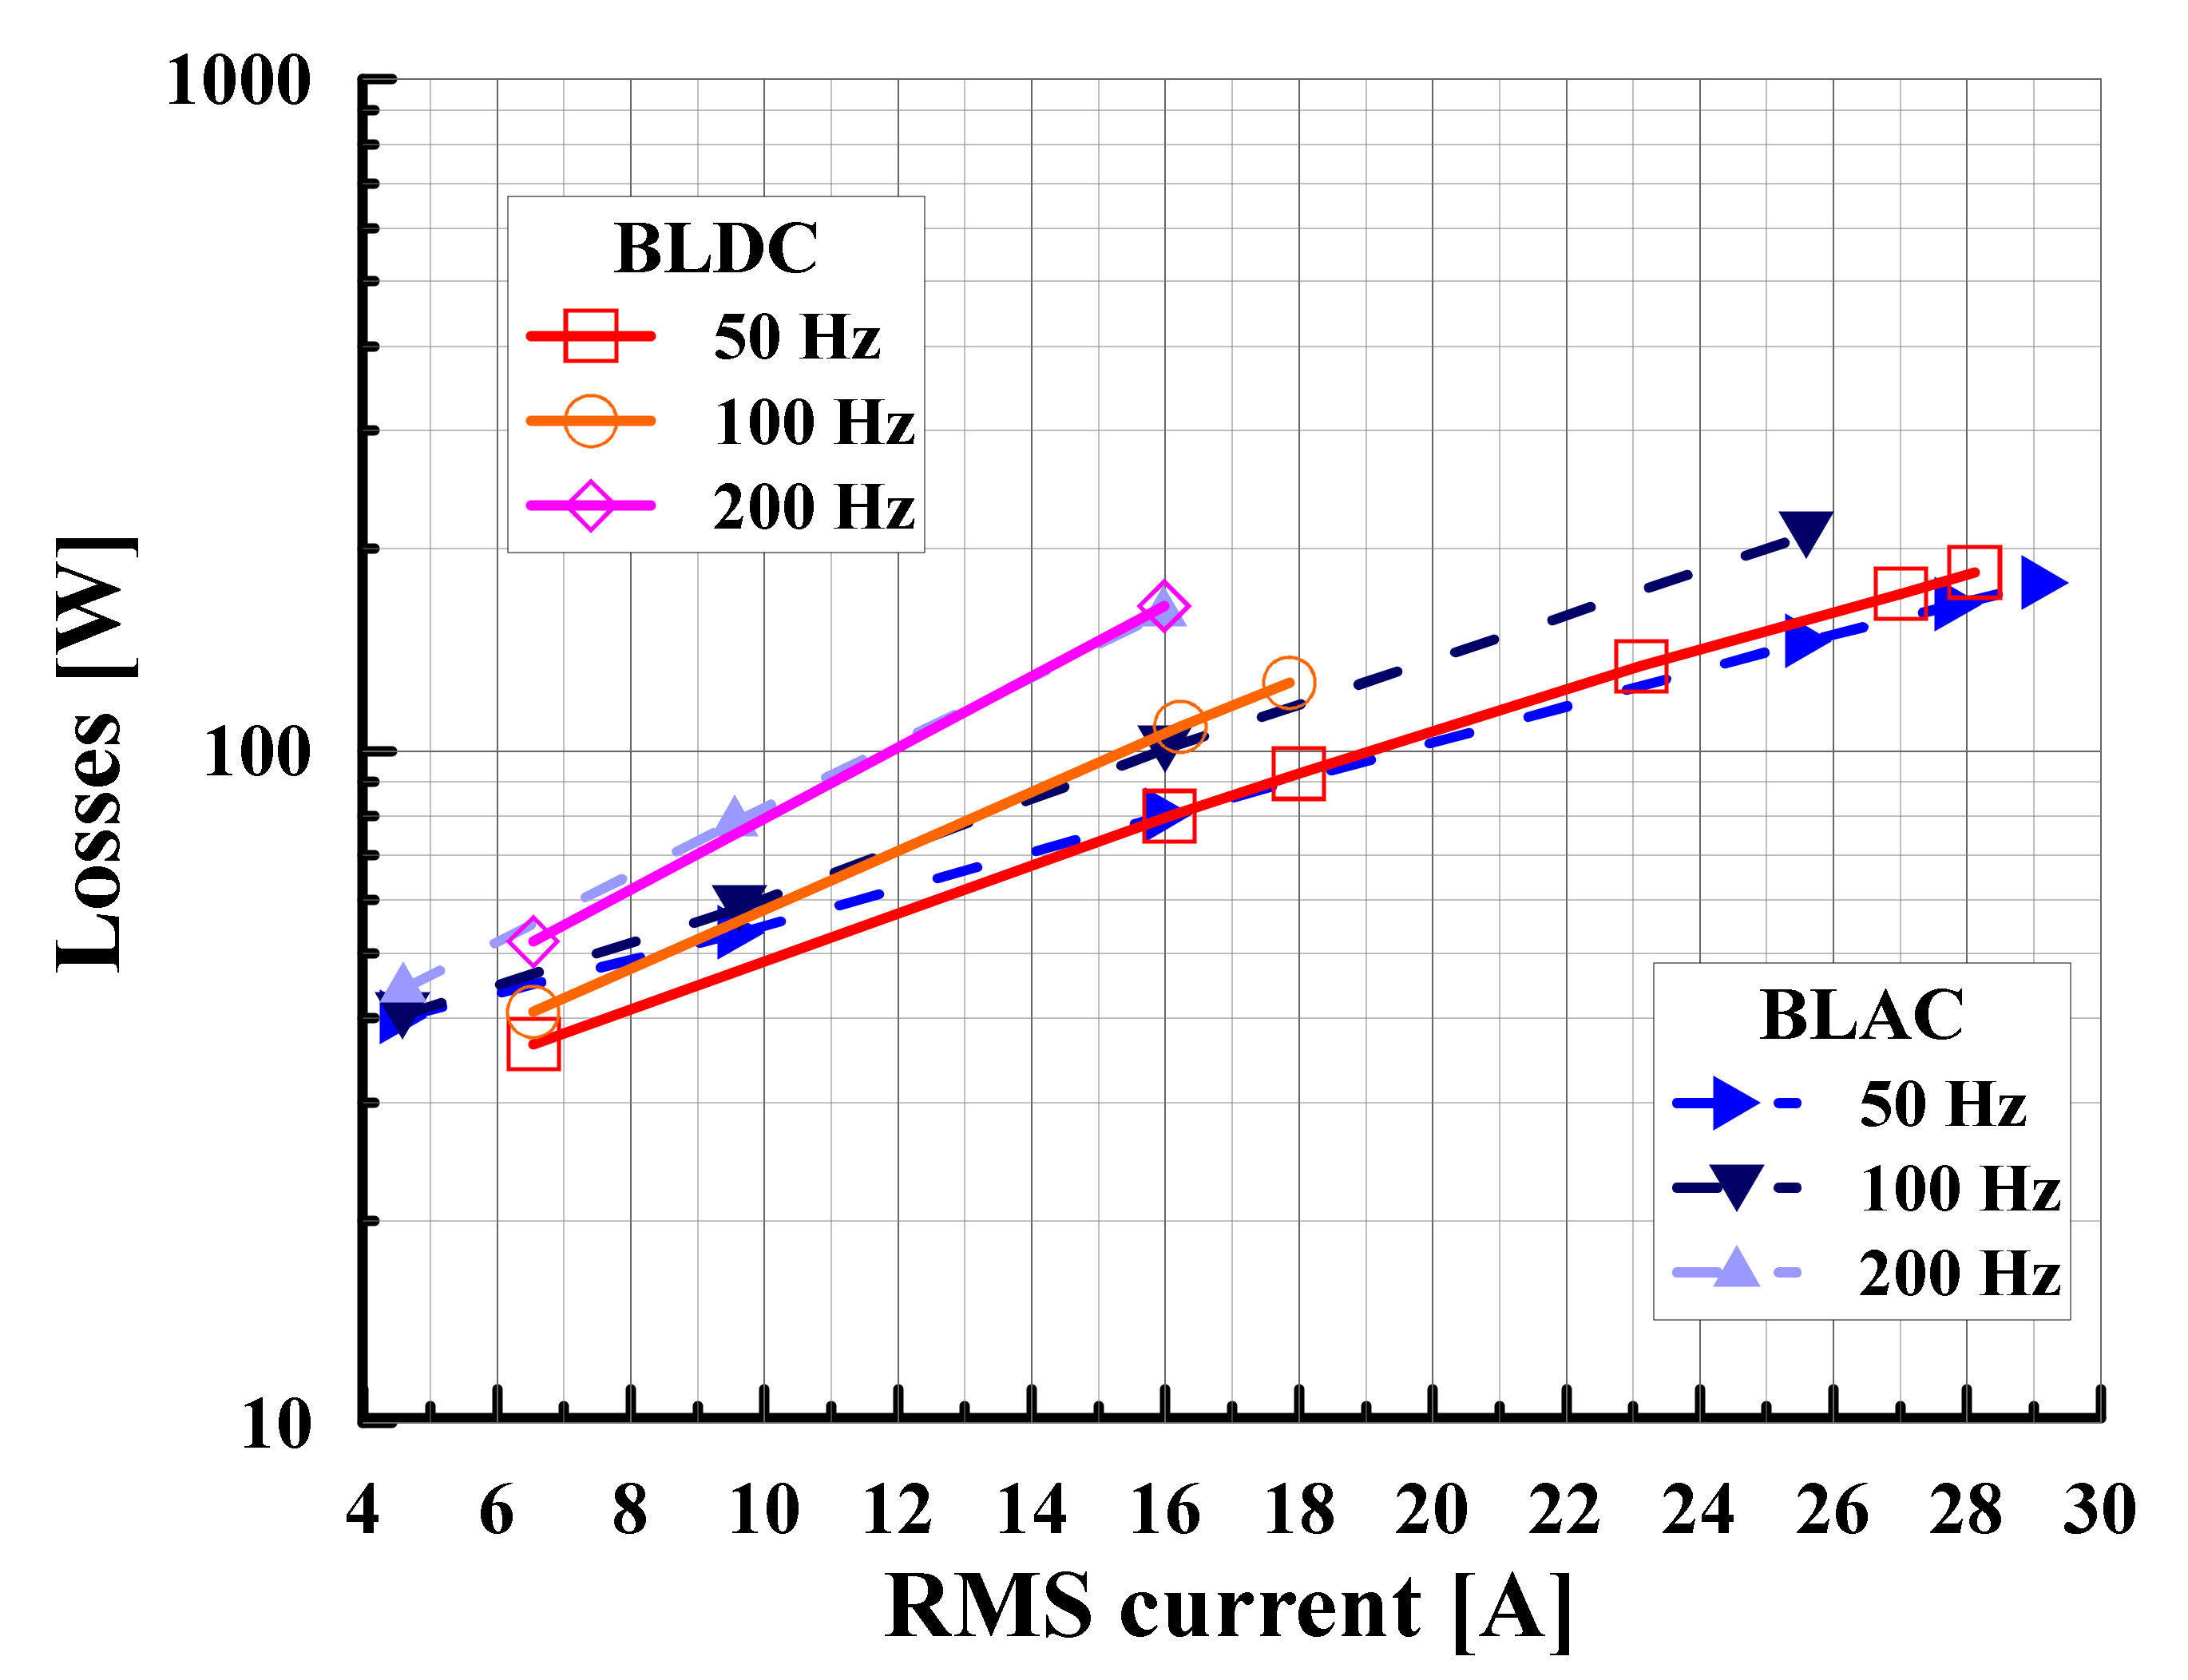
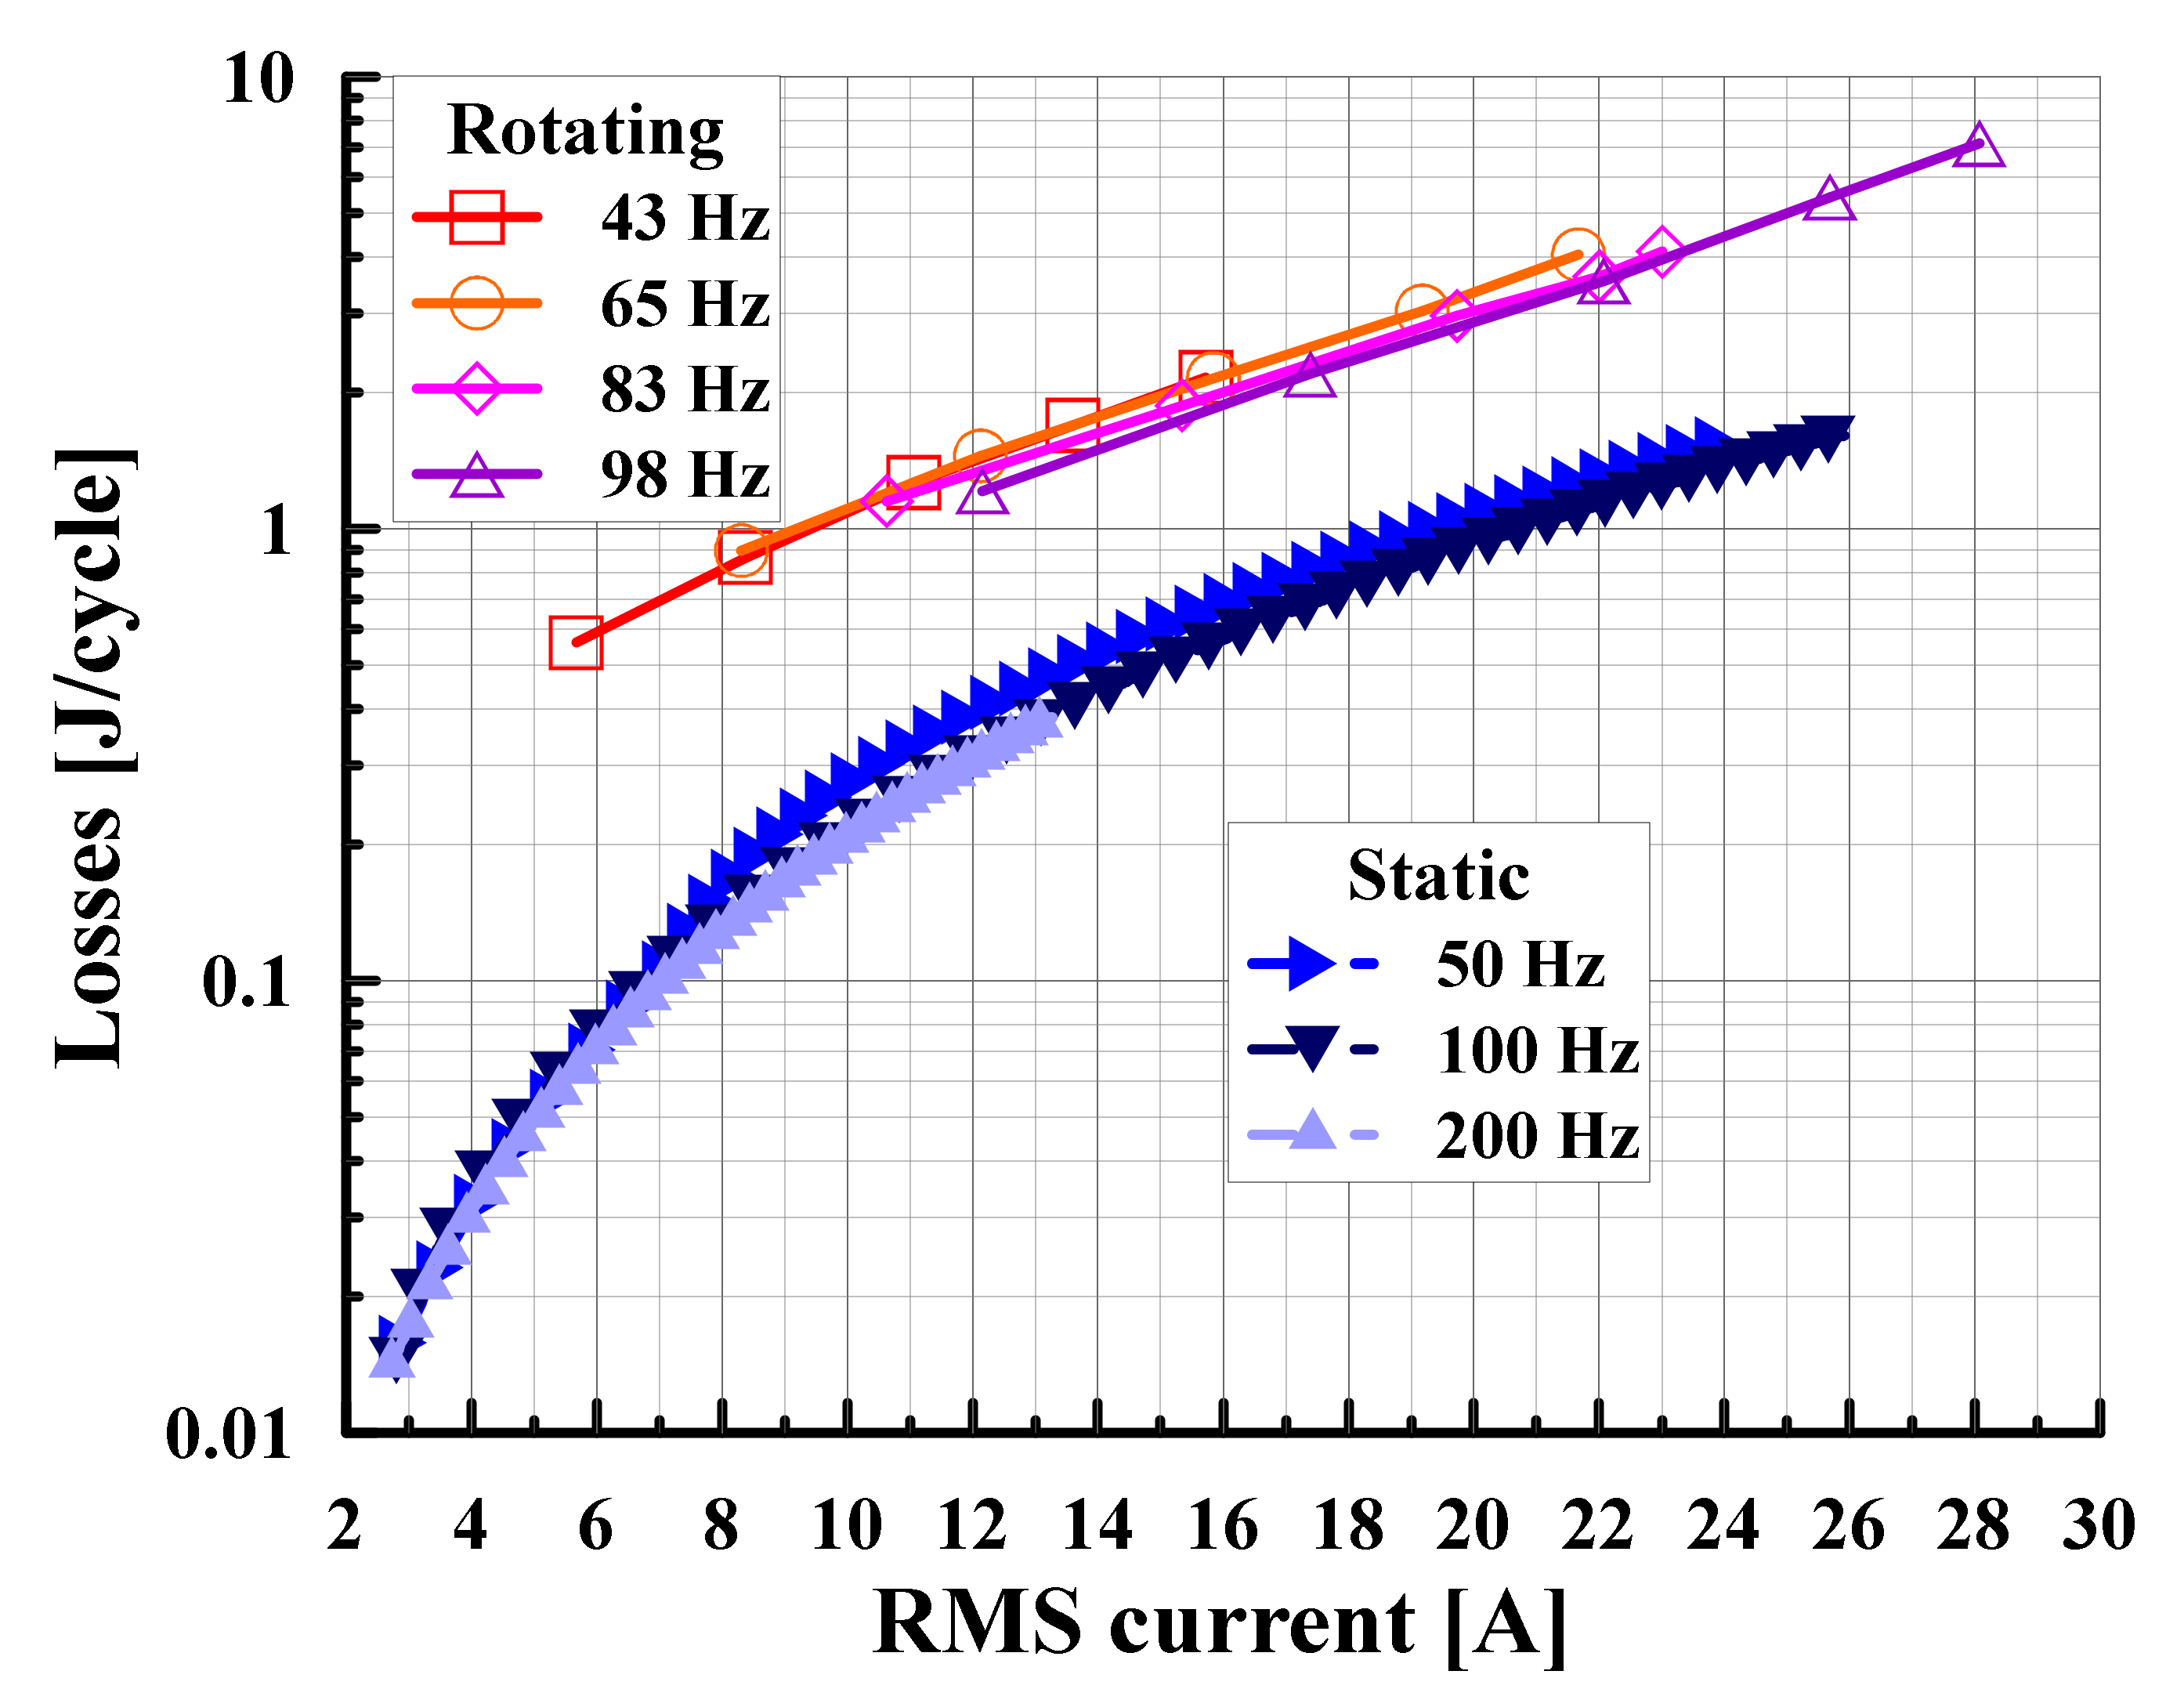
4.4. Experimental Results in Generator Mode

The variable load RL in the test bench described in Section 2.3 has 5 values of resistance, which gives the corresponding number of electrical load for the generator on each of the four pre-selected rotor speeds. Prior the tests with the load, the no-load losses were determined by the Formula (2) via running the machine on the same rotation speeds but without any electrical load.
Figure 16 shows the phase loss divided by the frequency of the current (J/cycle), depending on the average effective value of the current in the phase. The dotted line also shows data on losses in the phase with the fixed rotor installed. For these lines, the rotor angles with the maximum loss values are taken.
We can see a good coincidence of the curves at different frequencies for the generator mode; therefore, the nature of the losses is hysteresis, since it does not depend on the frequency. The level of losses with a movable rotor is much higher. The increase in losses is associated with additional hysteresis losses in the HTS layers of the winding tapes, which occur in an alternating external magnetic field.

5. Discussion

The design of an electrical machine with HTS windings is a very complex task due to its multidisciplinary parts. When working in the windings of electric machines, the coils from HTS tape carry transport AC current and are exposed to an external rotating magnetic field. Provided experimental research shows the influence of frequency, transport current, waveform, and presence of magnetic field on AC losses. Figure 6 and Figure 10 show increased losses for BLDC and BLAC operating modes. It means that for the practical application, it is better to have a signal close to sinusoidal, and frequencies on the kHz order should be filtered.
Figure 12, Figure 13, Figure 14 and Figure 15 show an increase of losses by several times for the case with the installed rotor. Figure 16 show increasing of losses with the rotating rotor. It is connected with additional hysteresis losses in tapes.
All of these results show increasing losses in AC windings operating in the magnetic circuit of electrical machines. Obtained results give an opportunity to select operating current, electrical frequency, and external magnetic flux density to realize target cryogenic losses. Finally, it will help to design electrical machines more accurately and increase their efficiency.

Author Contributions

Conceptualization, N.I. and K.K.; methodology, S.Z., N.I., D.S.; software, V.Z., D.S. and S.Z.; validation, V.Z., K.K.; formal analysis, N.I.; investigation, V.P., I.S.; resources, V.P., I.S.; data curation, S.Z.; writing—original draft preparation, N.I.; writing—review and editing, S.Z., N.I., V.Z. and D.S.; visualization, V.Z.; supervision, N.I.; project administration, K.K.; funding acquisition, N.I., K.K. All authors have read and agreed to the published version of the manuscript.

Funding

The research was carried out within the state assignment of Ministry of Science and Higher Education of the Russian Federation (theme No. FSFF-2020-0015).

Institutional Review Board Statement

Not applicable.

Informed Consent Statement

Not applicable.

Data Availability Statement

Not applicable.

Conflicts of Interest

The authors declare no conflict of interest. The funders had no role in the design of the study; in the collection, analyses, or interpretation of data; in the writing of the manuscript, or in the decision to publish the results.

References

  1. Grilli, F.; Benkel, T.; Hanisch, J.; Lao, M.; Reis, T.; Berberich, E.; Wolfstadter, S.; Schneider, C.; Miller, P.; Palmer, C.; et al. Superconducting motors for aircraft propulsion: The Advanced Superconducting Motor Experimental Demonstrator project. J. Phys. Conf. Ser. 2020, 1590, 012051. [Google Scholar] [CrossRef]
  2. Haran, K.S.; Haran, K.; Kalsi, S.; Arndt, T.; Karmaker, H.; Badcock, R.; Buckley, B.; Haugan, T.; Izumi, M.; Loder, D.; et al. High power density superconducting rotating machines—Development status and technology roadmap. Supercond. Sci. Technol. IOP Publ. 2017, 30, 123002. [Google Scholar] [CrossRef]
  3. Kovalev, K.; Ivanov, N.; Zhuravlev, S.; Nekrasova, J. Development and testing of 10 kW fully HTS generator. J. Phys. Conf. Ser. 2020, 1559, 012137. [Google Scholar] [CrossRef]
  4. Zhuravlev, S.; Zechikhin, B.; Ivanov, N.; Nekrasova, J. Analytical calculation of the magnetic field in electrical machines with HTS excitation and armature windings. Mater. Res. Express 2019, 6, 076001. [Google Scholar] [CrossRef]
  5. Larbalestier, D.; Gurevich, A.; Feldmann, D.; Polyanskii, A. High-Tc superconducting materials for electric power applications. Nature 2001, 414, 368–377. [Google Scholar] [CrossRef] [PubMed]
  6. Kovalev, K.; Penkin, V.; Ivanov, N.; Kosheleva, N.; Serovaev, G. Multidisciplinary Approach to the Design of Superconducting Electrical Machines. IOP Conf. Ser. Mater. Sci. Eng. 2019, 581, 012012. [Google Scholar] [CrossRef]
  7. Berrospe-Juarez, E.; Zermeño, V.; Trillaud, F.; Grilli, F. Real-time simulation of large-scale HTS systems: Multi-scale and homogeneous models using the T-A formulation. Supercond. Sci. Technol. 2019, 32, 065003. [Google Scholar] [CrossRef] [Green Version]
  8. Zhang, H.; Zhang, M.; Yuan, W. An efficient 3D finite element method model based on the T-A formulation for superconducting coated conductors. Supercond. Sci. Technol. 2017, 30, 024005. [Google Scholar] [CrossRef]
  9. Benkel, T.; Liu, Y.; Pardo, E.; Reis, T.; Grilli, F. T-A Formulation to Model Electrical Machines with HTS Coated Conductor Coils. IEEE Trans. Appl. Supercond. 2020, 99, 5205807. [Google Scholar] [CrossRef] [Green Version]
  10. Ainslie, M.; Hu, D.; Zermeno, V.; Grilli, F. Numerical Simulation of the Performance of High-Temperature Superconducting Coils. J. Supercond. Nov. Magn. 2016, 30, 1987–1992. [Google Scholar] [CrossRef] [Green Version]
  11. Pardo, E.; Grilli, F.; Liu, J.; Wolfstadter, S.; Reis, T. AC Loss Modeling in Superconducting Coils and Motors With Parallel Tapes as Conductor. IEEE Trans. Appl. Supercond. 2019, 29, 5202505. [Google Scholar] [CrossRef] [Green Version]
  12. Bruyn, B.; Jansen, J.; Lomonova, E. AC losses in HTS coils for high-frequency and non-sinusoidal currents. Supercond. Sci. Technol. 2017, 30, 095006. [Google Scholar] [CrossRef] [Green Version]
  13. Fetisov, S.; Zubko, V.; Zanegin, S.; Nosov, A.; Vysotsky, V. Numerical Simulation and Cold Test of a Compact 2G HTS Power Cable. IEEE Trans. Appl. Supercond. 2018, 28, 5400905. [Google Scholar] [CrossRef]
  14. Messina, G.; Yazdani-Asrami, M.; Marignetti, F.; Della Corte, A. Characterization of HTS Coils for Superconducting Rotating Electric Machine Applications: Challenges, Material Selection, Winding Process, and Testing. IEEE Trans. Appl. Supercond. 2021, 31, 2. [Google Scholar] [CrossRef]
  15. Statra, Y.; Menana, H.; Douine, B. Contribution to the experimental characterization of the electromagnetic properties of HTS. Prog. Electromagn. Res. M 2020, 93, 137–144. [Google Scholar] [CrossRef]
  16. Shen, B.; Li, C.; Geng, J.; Dong, Q.; Ma, J.; Gawith, J.; Zhang, K.; Li, Z.; Chen, J.; Zhou, W.; et al. Power Dissipation in the HTS Coated Conductor Tapes and Coils Under the Action of Different Oscillating Currents and Fields. IEEE Trans. Appl. Supercond. 2019, 29, 8201105. [Google Scholar] [CrossRef]
  17. Yazdani-Asrami, M.; Gholamian, S.; Mirimani, S.; Adabi, J. Calculation of AC magnetizing loss of ReBCO superconducting tapes subjected to applied distorted magnetic fields. J. Supercond. Nov. Magn. 2018, 31, 3875–3888. [Google Scholar] [CrossRef]
  18. Song, W.; Fang, J.; Jiang, Z. Numerical AC loss analysis in HTS stack carrying nonsinusoidal transport current. IEEE Trans. Appl. Supercond. 2019, 29, 5900405. [Google Scholar] [CrossRef]
  19. Wang, Y.S. Keynote talk—Review of AC loss measuring methods for HTS tape and unit. IEEE Int. Conf. Appl. Supercond. Electromagn. Devices 2013, 534, 14219749. [Google Scholar]
  20. Weng, F.; Zhang, M.; Lan, T.; Wang, Y.; Yuan, W. Fully superconducting machine for electric aircraft propulsion: Study of AC loss for HTS stator. Supercond. Sci. Technol. 2020, 33, 104002. [Google Scholar] [CrossRef]
  21. Zhu, K.; Guo, S.; Ren, L.; Xu, Y.; Yan, S.; Liang, S.; Tang, Y.; Shi, J.; Li, J. AC loss measurement of HTS coil under periodic current. Phys. C Supercond. Appl. 2020, 569, 1353562. [Google Scholar] [CrossRef]
  22. Ainslie, M.; Yuan, W.; Hong, Z.; Pei, R.; Flack, T.; Coombs, T. Modeling and electrical measurement of transport AC loss in HTS-based superconducting coils for electric machines. IEEE Trans. Appl. Supercond. 2011, 21, 3265–3268. [Google Scholar] [CrossRef]
  23. Zanegin, S.; Ivanov, N.; Shishov, D.; Shishov, I.; Kovalev, K.; Zubko, V. AC losses test of HTS racetrack coils for HTS motor winding. J. Phys. Conf. Ser. 2020, 1559, 12142. [Google Scholar] [CrossRef]
  24. LOCTITE® STYCAST 2850FT [Electronic Resource]. Available online: https://www.henkel-adhesives.com/us/en/product/potting-compounds/loctite_stycast_2850ftbl.html (accessed on 18 March 2021).
  25. Zubko, V.; Fetisov, S.; Zanegin, S.; Nosov, A.; Vysotsky, V. Optimization of 2G HTS Current Leads Working at External Magnetic Field. IEEE Trans. Appl. Supercond. 2017, 99, 4800205. [Google Scholar] [CrossRef]
  26. Vysotsky, V.; Fetisov, S.; Zubko, V.; Zanegin, S.; Nosov, A.; Ryabov, S.; Bykovsky, N.; Svalov, G.; Volkov, E.; Fleishman, L.; et al. Development and Test Results of HTS Windings for Superconducting Transformer with 1 MVA Rated Power. IEEE Trans. Appl. Supercond. 2017, 27, 5500105. [Google Scholar] [CrossRef]
  27. Yazdani-Asrami, M.; Zhang, M.; Yuan, W. Challenges for developing high temperature superconducting ring magnets for rotating electric machine applications in future electric aircrafts. J. Magn. Magn. Mater. 2021, 522, 167543. [Google Scholar] [CrossRef]
  28. Zanegin, S.; Ivanov, N.; Shishov, D.; Shishov, I.; Kovalev, K.; Zubko, V. Manufacturing and Testing of AC HTS-2 Coil for Small Electrical Motor. J. Supercond. Nov. Magn. 2019, 33, 355–359. [Google Scholar] [CrossRef]
  29. Kovalev, K.; Zhuravlev, S.; Rusanov, D.; Ivanov, N.; Zanegin, S.; Podguzov, V. Experimental research of stator with HTS ring winding. In Proceedings of the 2020 International Conference on Electrotechnical Complexes and Systems, Ufa, Russia, 27–30 October 2020. [Google Scholar]
  30. Michal, V. Three-Level PWM Floating H-Bridge Sinewave Power Inverter for High-Voltage and High-Efficiency Applications. IEEE Trans. Power Electron. 2016, 31, 4065–4074. [Google Scholar] [CrossRef]
  31. Lee, S.; Heng, Y. Improved Single-Phase Split-Source Inverter with Hybrid Quasi-Sinusoidal and Constant PWM. IEEE Trans. Ind. Electron. 2017, 64, 2024–2031. [Google Scholar] [CrossRef]
  32. Yazdani-Asrami, M.; Song, W.; Zhang, M.; Yuan, W.; Pei, X. Magnetization Loss in HTS Coated Conductor Exposed to Harmonic External Magnetic Fields for Superconducting Rotating Machines. IEEE Access 2021, 9, 1. [Google Scholar] [CrossRef]
  33. Yazdani-Asrami, M.; Song, W.; Zhang, M.; Yuan, W.; Pei, X. AC transport loss in superconductors carrying harmonic current with different phase angles for large-scale power components. IEEE Trans. Appl. Supercond. 2020, 31, 5900205. [Google Scholar]
  34. ANSYS Multiphysics, Release 16, ANSYS Inc [Electronic Resource]. Available online: https://www.ansys.com/it-solutions/platform-support/previous-releases (accessed on 18 March 2021).
  35. Zanegin, S.; Ivanov, N.; Zubko, V.; Kovalev, K.; Shishov, I.; Podguzov, V. Losses analysis of HTS racetrack coil operating in an external magnetic field. In Proceedings of the 2020 International Conference on Electrotechnical Complexes and Systems, Ufa, Russia, 27–30 October 2020. [Google Scholar]
Figure 1. Schematic representation of the measurement bench.
Applsci 11 02741 g001
Figure 2. Inverter simulator for HTS devices. 1—microcontroller, 2—transistor drivers, 3—transistor assemblies with built-in protection diodes, 4—feedback sensor, (DC)—laboratory power source, (Rs)—noninductive current shunt, (L)—device under test, and (DAQ)—data acquisition system.
Applsci 11 02741 g002
Figure 3. (a) Schematic of the test site; (b) Photo of the mechanical part of the bench. 1—HTS generator, 2—torque and rotation speed sensor, and 3—variable speed motor drive.
Applsci 11 02741 g003
Figure 4. (a) Manufactured racetrack coil prepared for soldering of current leads and potential taps; (b) assembled package of annular stator winding (without wiring). 1—HTS coil, 2—iron yoke, 3—brass connectors, 4—copper bridge between coupled coils, and 5—positioning elements between coils.
Applsci 11 02741 g004
Figure 5. (a) Schematic representation of an annular winding with an inside-mounted rotor; (b) locking device for the rotor. 1—assembled machine with HTS windings, 2—fixed plank with 15 holes, and 3—“arrow” device, fixed on shaft of the rotor.
Applsci 11 02741 g005
Figure 6. (a) Solitary coil losses at pure sine; (b) solitary coil losses modulated waveforms (BLAC, BLDC).
Applsci 11 02741 g006
Figure 7. (a) One period of BLDC current; (b) one period of BLAC current.
Applsci 11 02741 g007
Figure 8. Losses for BLAC current case versus computation period number.
Applsci 11 02741 g008
Figure 9. (a) The figure shows how the coils are connected inside the phase. Note that the voltage taps are soldered directly to the superconductor on the first and last phase coils to eliminate the influence of the current leads; (b) magnetic field distribution in the steel core at 60 A amplitude.
Applsci 11 02741 g009
Figure 10. (a) The losses in the assembled phase for sinusoidal current; (b) stator losses without rotor on modulated currents.
Applsci 11 02741 g010
Figure 11. Comparison of high-frequency current fluctuations in a single coil (blue) and in the assembled phase (red).
Applsci 11 02741 g011
Figure 12. Stator losses as a function of current at different rotor positions at a frequency of 50 Hz. Same frequency without rotor is depicted for reference.
Applsci 11 02741 g012
Figure 13. Stator losses as a function of current at different rotor positions at a frequency of 100 Hz. Same frequency without rotor is depicted for reference.
Applsci 11 02741 g013
Figure 14. Stator losses as a function of current at different rotor positions at a frequency of 200 Hz. Same frequency without rotor is depicted for reference.
Applsci 11 02741 g014
Figure 15. Averaged (for positions 0, 8, 15) stator losses on modulated current waveforms as a function of current.
Applsci 11 02741 g015
Figure 16. Measured sinusoidal current losses in the annular stator winding when operating in the generator mode (“Rotating”) and with the braked rotor (“Static”).
Applsci 11 02741 g016
Table 1. Parameters of the coil.
ParameterValue
2G tape typeAMSC, 5 mm wide
Min. critical current Ic, at 77 K, A100
InsulationKapton
Coil typeDouble pancake
Number of turns24
Length of linear part, mm100
Coil height, mm10
Winding height, mm7
Total wire length, m8
Table 2. Critical current of the phase at different rotor positions.
Position of the Rotor, DegreesMeasured Critical Current, AThe Ratio of the Ic w/without Rotor
044.40.5
25.642.80.48
4545.80.51
76.847.90.54
9042.20.47
Publisher’s Note: MDPI stays neutral with regard to jurisdictional claims in published maps and institutional affiliations.

