Article

Punching Shear Strength of Reinforced Concrete Flat Plates with GFRP Vertical Grids

Department of Architectural Engineering, Kyung Hee University, Deogyeong-Daero 1732, Yongin 17104, Korea
*
Author to whom correspondence should be addressed.
Appl. Sci. 2021, 11(6), 2736; https://doi.org/10.3390/app11062736
Submission received: 23 February 2021 / Revised: 16 March 2021 / Accepted: 17 March 2021 / Published: 18 March 2021
(This article belongs to the Section Civil Engineering)

Abstract

:
In this study, the structural behavior of reinforced concrete flat plates shear reinforced with vertical grids made of a glass fiber reinforced polymer (GFRP) was experimentally evaluated. To examine the shear strength, experiments were performed on nine concrete slabs with different amounts and spacings of shear reinforcement. The test results indicated that the shear strength increased as the amount of shear reinforcement increased and as the spacing of the shear reinforcement decreased. The GFRP shear reinforcement changed the cracks and failure mode of the specimens from a brittle punching to flexure one. In addition, the experimental results are compared with a shear strength equation provided by different concrete design codes. This comparison demonstrates that all of the equations underestimate the shear strength of reinforced concrete flat plates shear reinforced with GFRP vertical grids. The shear strength of the equation by BS 8110 is able to calculate the punching shear strength reasonably for a concrete flat plate shear reinforced with GFRP vertical grids.

1. Introduction

A flat plate is a structural element composed of slabs and columns without beams. Owing to the weight of the flat plate that is directly delivered to a column from a slab, a large stress concentration develops around the column causing a punching shear failure. This brittle punching failure is prompted by large shear forces and unbalanced moments transferred from the slab-column joint due to the severe horizontal displacement associated with seismic loads. Shear reinforcement is necessary to mitigate and prevent the brittle failure due to punching shear. As one of the effective shear reinforcements, the method employing a fiber reinforced polymer (FRP) has received the most attention due to the benefits of FRP such as it being lightweight with a high tensile strength and its ability to be manufactured in various shapes. FRP sheets, strips, laminates and rods have been extensively applied for the reinforcing and strengthening of reinforced concrete structures [1,2,3,4]. Bouguerra et al. [5] evaluated the punching shear performance of a flat plate by manufacturing a glass fiber reinforced polymer (GFRP) bar and used the manufactured GFRP bar instead of a steel tension reinforcement for the flat plate. Hassan et al. [6] investigated the punching shear of two-way concrete slabs with a GFRP bar as a flexural reinforcement and stirrups. They conducted the tests on 10 full-scale interior slab-column specimens considering the flexural reinforcement ratio and shear reinforcement ratio and type. The test results indicated that the punching shear capacity was governed by the flexural reinforcement ratio but the performance was enhanced by reducing the brittleness when FRP stirrups were used. Many studies have been conducted on flat slab strengthening with FRP composites. Meisami et al. [7] experimentally verified that shear strength increased when using reinforcing carbon fiber reinforced polymer (CFRP) produced in the shape of a rod by drilling a hole in the critical section of the flat plate. Soudki et al. [8] reinforced the CFRP by manufacturing it as a strip and attaching it to the underside of the flat plate; they experimentally assessed the performance of the flat plate and the applicability of the equations of the Canadian Standards Association (CSA) and the American Concrete Institute (ACI). Amiri and Talaeitabe [9] proposed a numerical model to predict the behavior of the strengthening of flat slabs with externally bonded FRP strips. Ruggieri et al. [10,11] evaluated the numerical approaches to predict the structural behavior and seismic fragility for the floor of an existing reinforced concrete (RC) building. As a result of performing a modal linear analysis, the comparison showed a substantial equivalence between the model using the rigid floor assumption and an equivalent shell.
Design standards provide the punching shear strength of concrete flat plates shear reinforced with steel stirrups with the shear strength equation of the flat plates shear reinforced with FRPs. In this study, the amount and the spacing of the shear reinforcement were examined by performing a punching shear experiment on the flat plates. The shear strengths of the flat plates were calculated from the shear strength equations of ACI 318-19 [12], BS 8110 [13] and Eurocode 2 [14]. Their applicability was assessed by comparing them to the experimental results.

2. Shear Strength Equations

The FRP design guidelines provided in the design standards are modified based on steel reinforced concrete. Current design codes have an identical general form for calculating shear strength as the sum of the shear strength of concrete and shear reinforcement by Equation (1). However, in each code, the amount of shear reinforcement is considered as a different ratio. In this study, the GFRP vertical grid, whose performance has been verified in previous research (Kim et al. [15]), was determined as the shear reinforcement for the concrete flat plate as shown in Figure 1.
The GFRP reinforcement consisted of vertical and horizontal strips. Previous research (Kim et al. [15]) noted that the resistance to shear of the horizontal strip was insignificant. Therefore, when the same method as that for the steel stirrup was applied for computing the shear strength of the GFRP plate shear reinforcement, ACI 318, BS 8110 and Eurocode 2 considered only the shear strength attributed to the vertical strip.
V n = V c + V f
where V n is the nominal punching shear strength (kN), V c is the nominal shear strength provided by the concrete (kN) and V f is the nominal shear strength provided by the GFRP vertical grid (kN).

2.1. ACI Building Code (ACI 318–19)

If there is no shear reinforcement, in ACI 318 the critical section of the flat plate is considered to be located 1/2 of the effective depth (d) away from the column. On the other hand, if shear reinforcement is present the critical section is supposed to be on the perimeter, d/2 away from the outermost shear reinforcement. Figure 2a indicates the critical section of the standard of ACI 318.
The equation provided by ACI 318 is the sum of the shear strengths of the concrete and the shear reinforcement by Equation (1), which can be replaced with Equation (2). The shear strength of the shear reinforcement is calculated by considering the vertical strips of the GFRP vertical grid as a steel stirrup. The amount of shear reinforcement on the vertical components of the GFRP plate arranged on the four faces of the column is calculated by Equation (3).
V c , A C I = 0.083 ( 2 + α s d b 0 ) λ s λ f c b 0 d   or   0.33 λ s λ f c b 0 d   or   ( 0.17 + 0.33 β ) λ s λ f c b 0 d .
V f , A C I = n A f f f u .
  • V c , A C I : the nominal shear strength provided by concrete (ACI 318) (kN).
  • V f , A C I : the nominal shear strength (ACI 318) (kN).
  • b 0 : the perimeter of the critical section (mm).
  • d: the effective depth of the slab (mm).
  • s: the spacing of the shear reinforcement (mm).
  • λ : the modification factor to reflect the reduced mechanical properties of lightweight concrete.
  • λ s : the size effect factor.
  • A f : the sectional area of the vertical strip of the GFRP grid (mm²).
  • n: the number of vertical components of the vertical grid.
  • f f u : the tensile strength of the GFRP (MPa).
  • t f : the thickness of the vertical grid (mm).
  • w f : the width of the vertical grid (mm).

2.2. British Standard Code

In BS 8110, it is assumed that the critical section is estimated as 1.5d away from the column face in the concrete flat plates without shear reinforcement. The shear reinforcement is placed around the critical section, which increases by 0.75d. Figure 2b shows the critical section suggested by BS 8110. The shear strength equation is determined by the sum of the shear strength of the concrete and shear reinforcement (Equation (1)). The shear strength of the concrete is described by considering the compressive strength of the concrete, the critical section, the effective depth of the slab and the tension reinforcement ratio as shown in Equation (4). Marzouk and Hussein [16] reported that the concrete strength was overestimated in concrete slabs using high strength concrete. The concrete compression strength is represented as a square root. BS 8110 assesses the concrete shear strength as the value of the cubic root of the concrete compressive strength. It considers the size effect attributed to the effective depth of the slabs and the tensile reinforcement ratio. Equation (5) describes the shear strength of the GFRP vertical grids, which can be computed by calculating cross-sectional areas of the shear reinforcement.
V c , B S = 0.79 γ m ( 100 · ( A s b v · d ) 1 / 3 · ( 400 d ) 1 / 4 ) b 0 d .
V f , B S = 0.95 A f * f f u
where V c , B S is the nominal shear strength provided by the concrete (BS 8110-97) (kN) and V f , B S is the nominal shear strength provided by the GFRP vertical grid (BS 8110-97) (kN).

2.3. Eurocode 2

In Eurocode 2, the critical section is estimated as 2d away from the column face in the concrete flat plates without shear reinforcement. The critical section is on the perimeter 1.5d away from the end of the shear reinforcement in the concrete flat plates with shear reinforcement. Unlike in ACI 318 and BS 8110, in Eurocode 2 the corners of the critical section form four quadrants. Figure 2c shows the Eurocode 2 critical section. Collins and Kuchma [17] reported that the shear strength was overestimated when the ACI 318 punching shear strength equation included a low flexural reinforcement ratio and when the slab was very thick. In addition, in the case of low flexural reinforcement, the shear strength was reduced. Considering the depth of the slab and the amount of the flexural reinforcement, Eurocode 2 considers the size effect of the effective depth of the slab as 1 + 200 / d and proposes a shear strength equation that considers the effects of the tension reinforcement ratio and the concrete compression strength.
The shear strength of Eurocode 2 is determined by the sum of the shear strength of the concrete and shear reinforcement (Equation (1)). The shear strength of the concrete is described in Equation (6). The shear strength of the shear reinforcement can be computed by multiplying by 1.5 as shown in Equation (7).
V c , E C 2 = 0.75 * C R d , c · k · ( 100 · ρ l · f c k ) 1 3 b 0 d .
V f , E C 2 = 1.5 n A f f f u
where V c , E C 2 is the nominal shear strength provided by the concrete (according to Eurocode 2) (kN) and V f , E C 2 is the nominal shear strength provided by the GFRP plate (according to Eurocode 2) (kN).

3. Experimental Program

3.1. Materials

The concrete strength was used with an average measured compressive strength of 20.3 MPa. The steel reinforcement for the tensile reinforcing and column had a diameter of 22 mm and a tensile strength of 500 MPa. All specimens were reinforced with a column hoop bar with a diameter of 10 mm and a tensile strength of 400 MPa. The tensile strength of the GFRP material was 480 MPa and the elastic modulus was 50 GPa. Table 1 presents the material properties of the materials used.

3.2. Specimen Details

A total of nine specimens were manufactured of which eight were shear reinforced with GFRP vertical grids and one did not have any reinforcement. Figure 3 shows a plane view of the specimen. The specimens had dimensions of 2000 × 2000 mm; the slab was 180 mm thick. Column dimensions were 250 × 250 mm; the height of the upper column was 300 mm and that of the lower column was 150 mm. The GFRP shear reinforcement was placed along the four sides of the column as described in Figure 3. Table 2 presents the specimen details. The specimen labeling method represented the variables of this study such as the amount and the spacing of the shear reinforcement. The control specimen was the plain slab without shear reinforcement. G represented the specimens that were shear reinforced with a GFRP plate. The amount of shear reinforcement ( A f × f f u ) was the product of the cross-sectional areas of the vertical strips of the GFRP grid in the critical section needed for the shear strength calculation and the tensile strength. A, B and C represented the spacing of the vertical strips of the shear reinforcement and they were 40 mm (0.3d), 69 mm (0.5d) and 104 mm (0.75d), respectively. To evaluate the shear performance, this study was designed to induce a punching shear failure rather than a flexural failure. In this case, the flexural strength was computed by the yield line theory by Johansen [18]. Johansen suggested the calculation of the maximum flexural strength, P y , demonstrated by the plasticity bending moment of the slab with simple support from the four sides as shown in Equation (8).
P y = 8 m r ( 1 1 c / l ) .
m r = ρ f y d 2 ( 1 0.59 ρ f y f c ) .
  • P y : yield line theory flexural strength (ACI 318-19) (kN).
  • m r : flexural capacity of slab per unit width.
  • c: side length of column.
  • ρ : ratio of tension reinforced bar.
  • f c : compressive strength of concrete (MPa).
As shown in Table 2, shear failure was induced in all specimens by designing the flexural strength to be greater than the shear strength. The G-184B, G-246B, G-307B and G-369B specimens had equally spaced vertical strips and the amount of the shear reinforcement was set as a variable. G-246A, G-246B, G-246C, G-307A and G-307B had equal amounts of shear reinforcement but the spacing of the vertical strips was a variable. Figure 4 shows the position of the GFRP vertical grid within the specimens.

3.3. Set Up and Instrumentation

The slabs were installed on a reaction frame as a hinge that was manufactured for the experiment and simply supported the four sides. In addition, the weight was stocked at an average speed of 1 kN/min using an actuator with a capacity of 1000 kN installed on the top of the column and as the top and bottom parts of the specimen became contrary to the conditions of the real structure based on the loading direction. Furthermore, the displacement of the specimen was recorded by installing five linear variable differential transformers (LVDTs) on the lower part of the specimen. Figure 5 shows the specimen settings.

4. Test Results

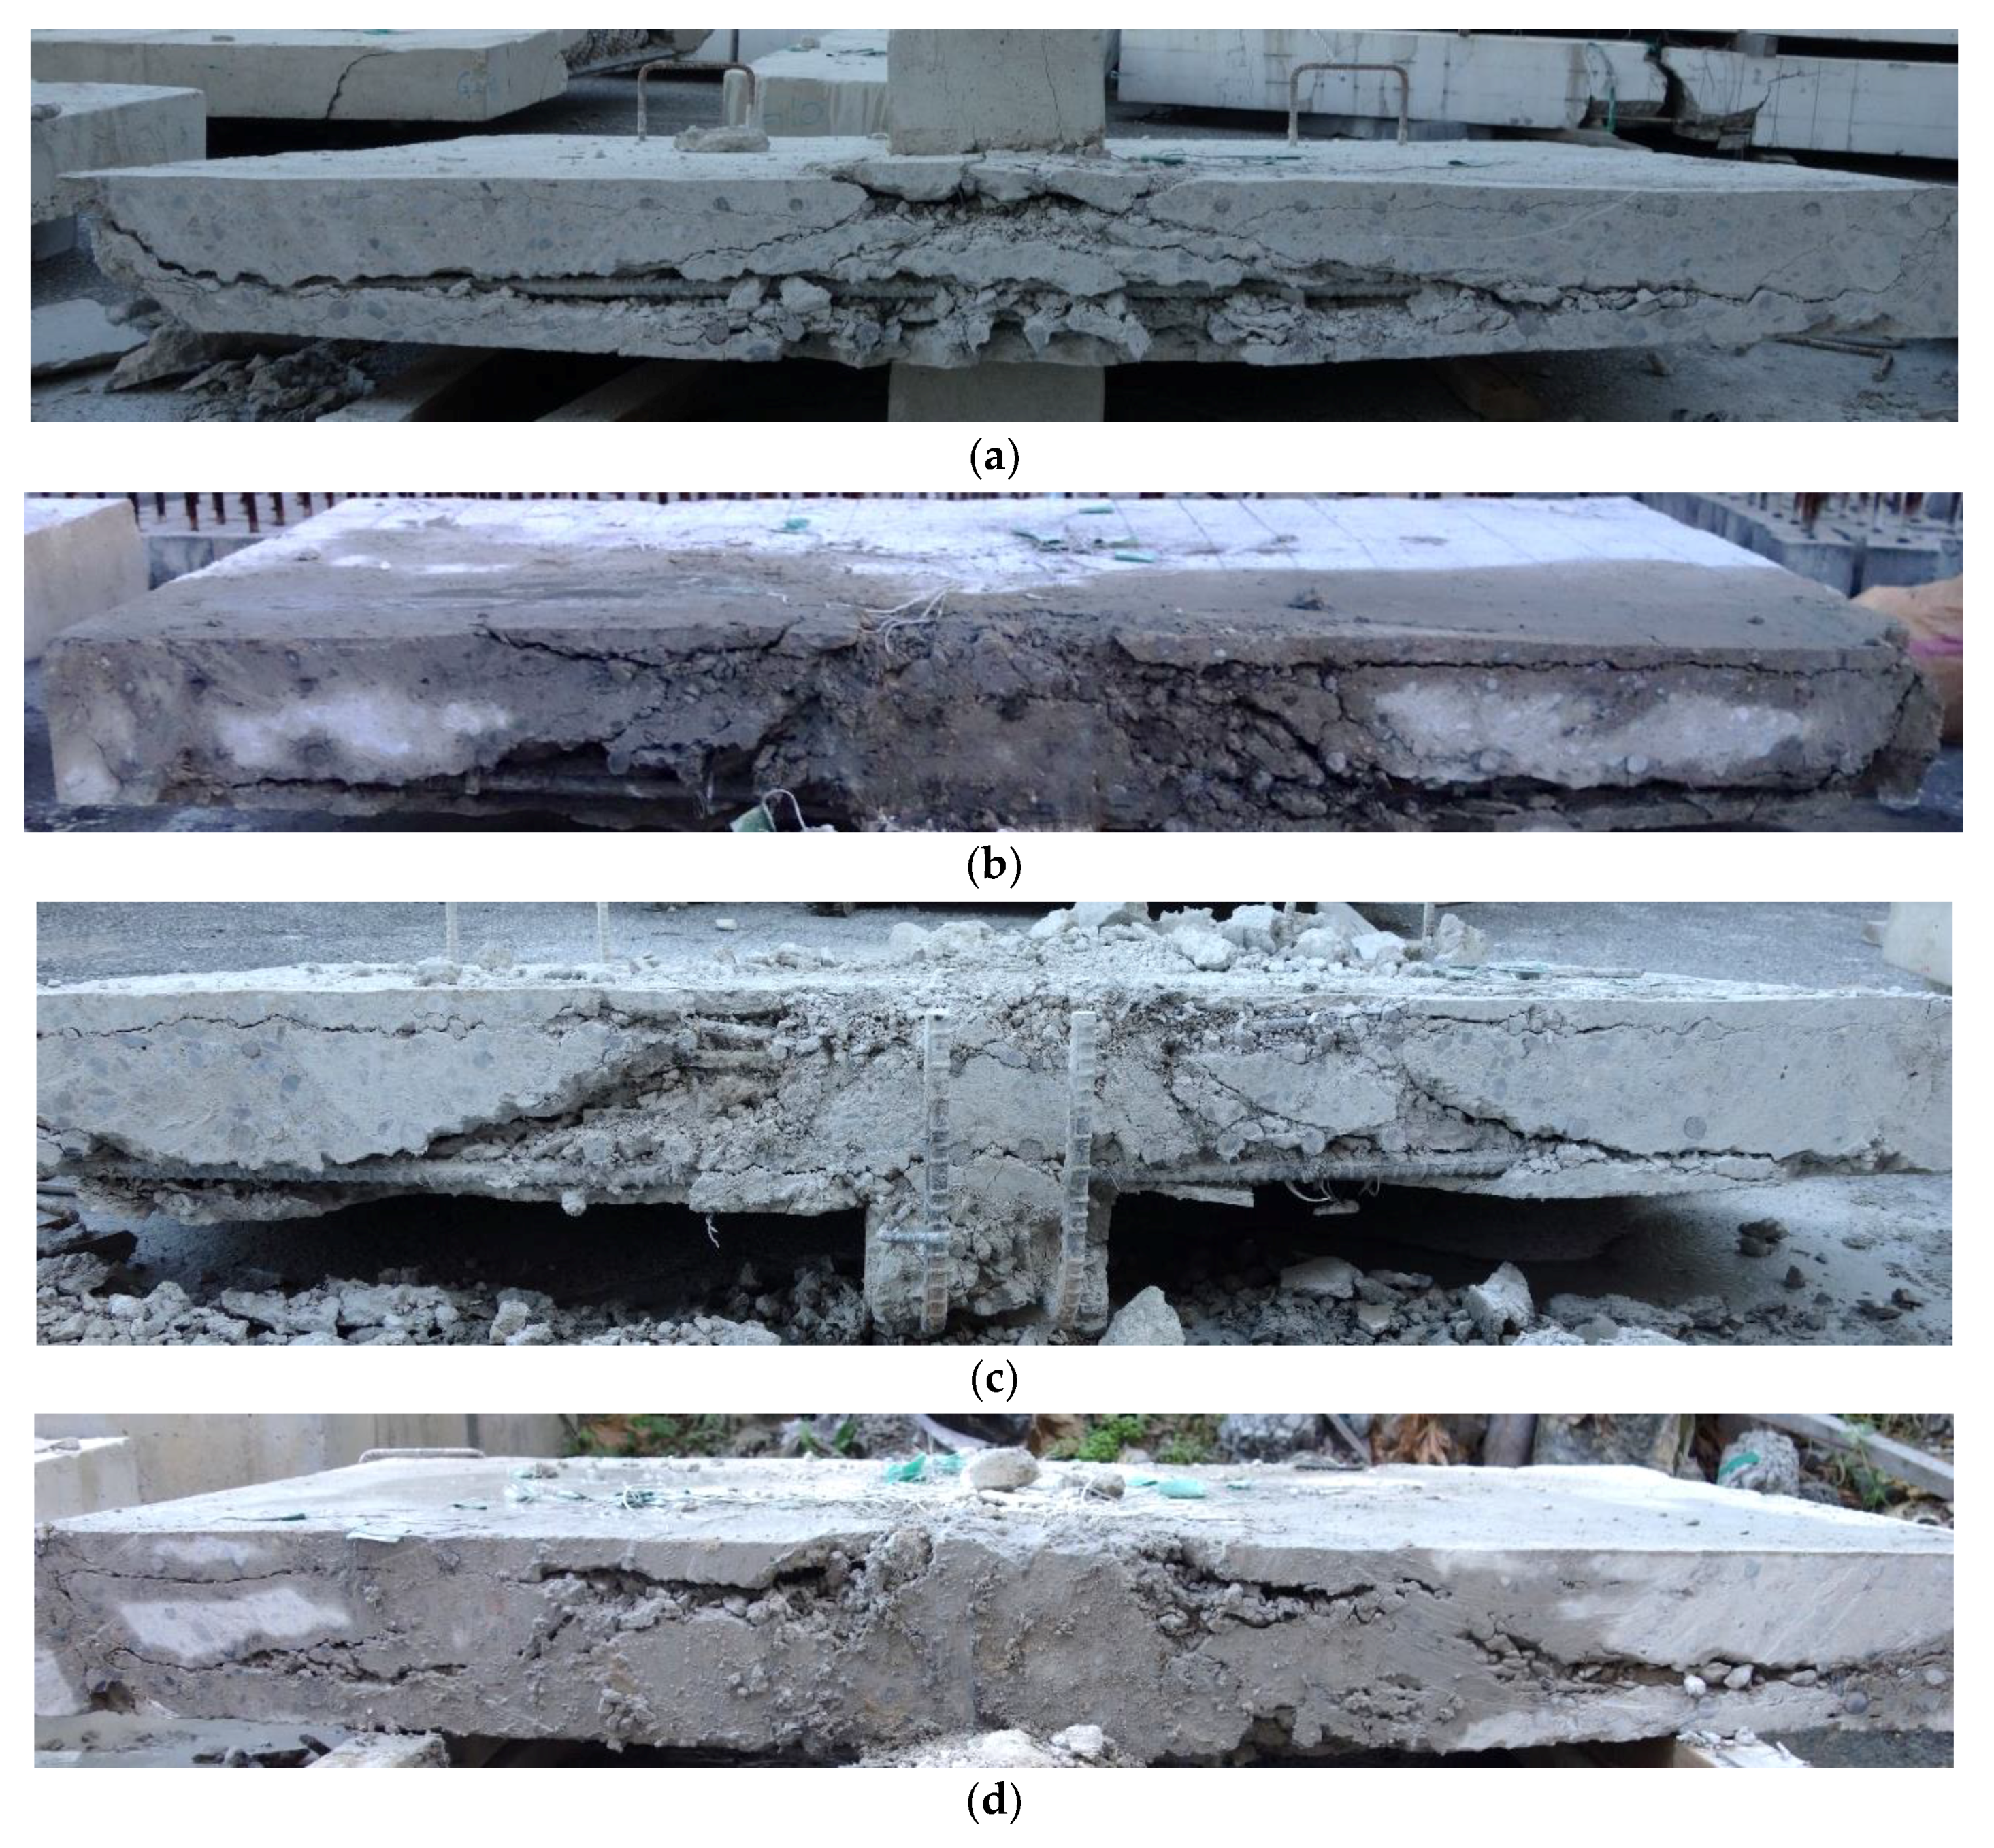
4.1. Crack Patterns and Failure

Figure 6 indicates the crack patterns of the control and the G-246B specimens and Figure 7 shows the appearance of the shear observed when a concrete cutter was applied at a spot 100 mm away from the column face of all of the specimens. Cracks started to propagate from near the column outwards along two directions on the slabs. The initial cracks of the specimen were observed in a radial shape from the side of the columns then cracks were extended from the central area as loading increased. The control specimen showed a typical punching shear failure mode in which the cracks started at the column side and developed significantly in the shape of a cone within half of the effective depth of the slab and a sudden drop was observed in the load after the maximum load. The initial crack in the specimen with the GFRP plate reinforcement was generated near the column and then cracks occurred within the critical section of the slab. As the load increased, the crack expanded in the slab in two directions similar to the control specimen. It was observed that the width and number of cracks expanded from the shear reinforcement area. In addition, the cracks developed widely toward the edges and the corners of the slabs. The G-246B specimen had larger failure areas than the control specimen (Figure 6). This indicated that the shear reinforcement produced the reinforcement effects of increasing the areas of the critical sections of the flat plate and that more concrete resisted the shear.

4.2. Shear Reinforcement

The shear force contribution of the flat plate with a shear reinforced GFRP vertical grid was analyzed and Figure 8 shows the relationship of the load displacement without and with a GFRP vertical grid. All variables were set equally in the control and G-series specimens except for the presence of a GFRP vertical grid.
Figure 8 indicates that all specimens showed almost similar behavior before applying a load of 400 kN, at which point a shear crack occurred in the specimen. In the case of the control specimen, it was verified to show a dramatic brittle failure condition and was unable to resist the shear after the shear crack was observed. In the case of the G-246B specimen, the specimen was verified to have a high shear strength in resisting shear cracks. When comparing the maximum load of each specimen with or without shear reinforcement, the maximum load of the specimen with a GFRP vertical grid was found to be approximately 635 kN whereas that of the control specimen was 450 kN; here, the difference of 185 kN between the strengths of the G-246B and the control specimen represented the shear strength contribution of the GFRP plate.

4.3. Amount of Shear Reinforcement

Figure 8 shows the effects of the GFRP shear reinforcement on the shear strength of the concrete flat plate based on the load displacement relationships of the G-184B, G-246B, G-307B and G-369B specimens. As shown in Figure 8, although all specimens showed similar behavior until they reached the maximum load, the displacement increased with the applied load. As expected, the maximum load increased with the amount of shear reinforcement. Considering the G-184B specimen as a reference, it was determined that the maximum load increased by 2% for the G-246B specimen, 11% for the G-307B specimen and 21% for the G-369B specimen. In the specimen with a high shear reinforcement ratio, the radial compressive force near the column acted horizontally. A substantial portion of this force was transmitted into the region around and under the lower part of the shear reinforcement. The eccentricity of the axial compressive force due to the high shear reinforcement ratio caused horizontal splitting cracks on the top surface of the slab. Consequently, the specimens with a high shear reinforcement ratio showed a rapid load reduction after reaching the maximum load.

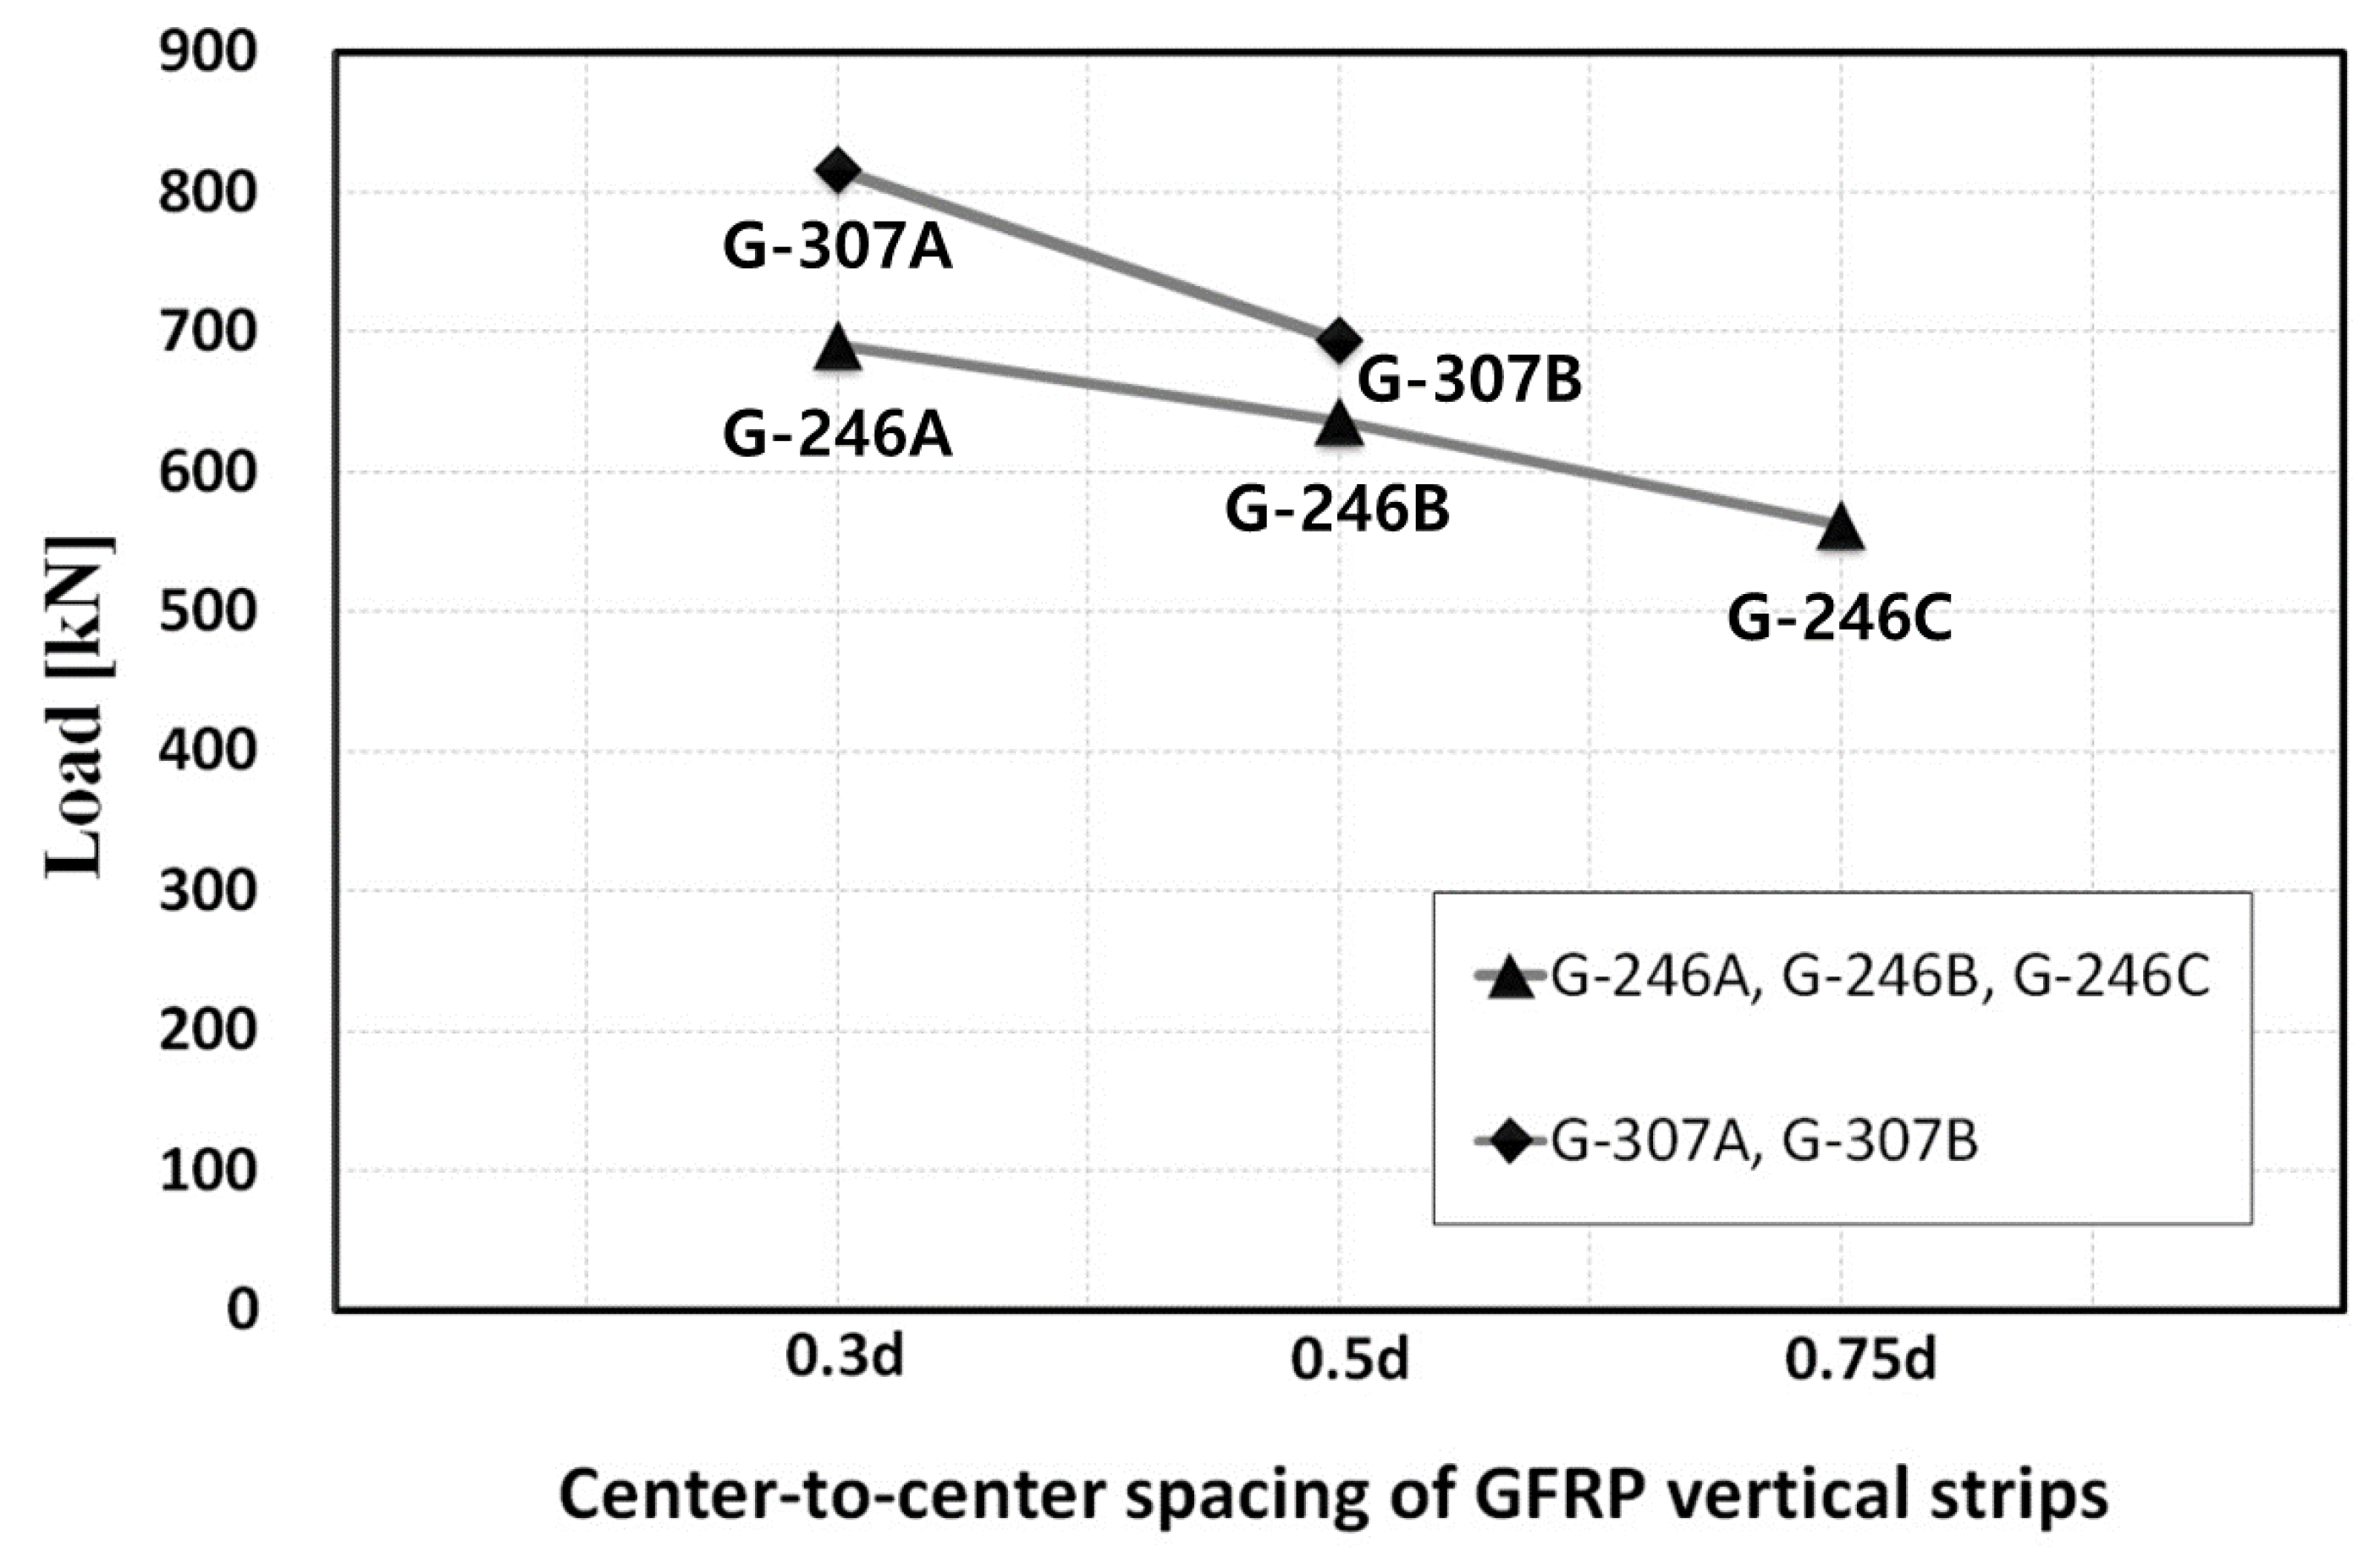
4.4. Spacing of GFRP Vertical Strips

The specimens were composed of two groups with the amount and spacing of shear reinforcement as test variables and the shear strength attributed to the spacing of the vertical strips of the shear reinforcement was analyzed. Figure 9 shows the comparison of the maximum shear strengths for each group. The shear strength of the specimens was found to increase as the spacing between the vertical strips decreased in both the amount of shear strength 246 kN and 307 kN group. The G-246A, G-246B and G-246C specimens, in which the amount of the shear reinforcement was designed to be equal (246 kN) and the reinforcement spacing was 0.3d, 0.5d and 0.75, respectively, had a greater shear strength because the reinforcement spacing was smaller. Considering the G-246C specimen as a reference, the shear strength increased by 12% for the G-246B specimen and by 22% for the G-246A specimen. For the G-307A and G-307B specimens in which the amount of shear reinforcement was designed to be equal (307 kN) and the reinforcement spacing was 0.3d and 0.5d, respectively, the specimen with the reinforcement spacing of 0.3d had a greater shear strength. Furthermore, the shear strength of the G-307A specimen exceeded that of the G-307B specimen by 17%. Both groups had the greatest maximum load when the spacing of the shear reinforcement was 0.3d.

4.5. Comparison of Code Predictions and Experimental Results

Table 3 presents the shear strength computation provided in the design standard for the concrete and the shear reinforcement and the experimental results of the control specimen. The shear strength computed according to each criterion is presented in Table 4. A comparison of the design and the experiment values revealed that the standard equations of BS 8110 and Eurocode 2 yielded values closer to the experiment values than did the ACI 318 standard. This was because the ratio of tensile reinforcement is considered in the shear strength equations of BS 8110 and Eurocode 2 and described the same results as the existing study results [19,20,21].
Table 5 and Figure 10 show a comparison of the shear strength computed by the experimental results of all specimens and those computed using ACI 318, BS 8110 and Eurocode 2. ACI 318 underestimated the experiment value with an average ratio of shear strength of 1.67 and a standard deviation of 0.12. On the other hand, BS 8110 yielded an average ratio of shear strength of 1.06 and a standard deviation of 0.15 while Eurocode 2 showed an average ratio of shear strength of 1.16 and a standard deviation of 0.08. Although the average shear strengths of BS 8110 and Eurocode 2 were closer to the experiment values than the value computed by ACI 318, they overestimated the shear strength for all of the specimens tested.

5. Conclusions

In this study, the experiments were performed on concrete flat plates shear reinforced with GFRP to compare their shear performance in terms of the amount and the spacing of the shear reinforcement. In addition, the test results were used to examine the validity of different design codes for the shear strength of a concrete flat plate. The following conclusions were drawn from this study:
(1)
The control specimen showed a cone-shaped, sharply sloped punching shear failure mode within the critical section that was 1/2 of the effective slab depth from the column face. The specimen with a GFRP plate reinforcement showed a cone-shaped failure with a gentle slope and the failure mode had wide critical sections.
(2)
The shear strength of the concrete flat plates shear reinforced with a GFRP exhibited an increase of an average of 30% compared with that of the specimen without shear reinforcement. That is, the GFRP plate shear reinforcement effectively resisted the punching shear.
(3)
The shear strength also appeared to increase with the amount of the GFRP plate. From the analysis of the shear strength attributed to the spacing of the vertical strips of the GFRP plate, the shear strength appeared to be the highest when the reinforcement spacing was 0.3d.
(4)
When comparing the test results with the computed shear strengths using the equations of ACI 318, BS 8110 and Eurocode 2, we found that BS 8110 with an average ratio of shear strength of 1.06 and a standard deviation of 0.15 and Eurocode 2 with an average ratio of shear strength of 1.16 and a standard deviation of 0.08 yielded shear strength values closer to the experimental values than ACI 318. This was because they incorporated the effects of the tension reinforcement ratio. ACI 318, with an average ratio of shear strength of 1.67 and a standard deviation of 0.12, underestimated the experiment results.

Author Contributions

Conceptualization, M.S.K. and Y.H.L.; methodology, M.S.K.; validation, Y.H.L.; investigation, M.S.K. and Y.H.L.; writing—original draft preparation, M.S.K.; writing—review and editing, Y.H.L. All authors have read and agreed to the published version of the manuscript.

Funding

This work was supported by the National Research Foundation of Korea (NRF) grant funded by the Korean government (MSIT) (No. 2019R1A2C1090033).

Institutional Review Board Statement

Not applicable.

Informed Consent Statement

Not applicable.

Data Availability Statement

The results presented in this study are available on request from the corresponding author.

Conflicts of Interest

The authors have no conflict of interest to declare.

Nomenclature

A f Sectional area of the vertical strip of the GFRP plate
b 0 Perimeter of the critical section
cSide length of the square column
dEffective depth of the slab
f c Specified compressive strength of the concrete
f f u Specified tensile strength of the GFRP plate
m r Flexural capacity of the slab per unit width
nNumber of vertical components of the GFRP plate
P y Yield line theory flexural strength
sCenter-to-center spacing of the shear reinforcement
t f Thickness of the FRP plate
V c Nominal shear strength provided by the concrete
V c , B S Nominal shear strength provided by the concrete
V c , E C 2 Nominal shear strength provided by the concrete
V f Nominal shear strength provided by the GFRP plate
V f , B S Nominal shear strength provided by the GFRP plate
V f , E C 2 Nominal shear strength provided by the GFRP plate
V n Nominal punching shear strength
V n , B S Nominal punching shear strength
V n , E C 2 Nominal punching shear strength
w f Width of the FRP plate
ρ Ratio of the tension reinforced bar
λ Modification factor to reflect the reduced mechanical properties of lightweight concrete relative to the normal weight concrete of the same compressive strength.
λ s Factor used to modify the shear strength based on the effects of member depth, commonly referred to as the size effect factor.

References

  1. Karayannis, C.G.; Kosmidou, P.M.K.; Chalioris, C.E. Reinforced concrete beams with carbon fiber reinforced polymer bars-experimental study. Fibers 2018, 6, 99. [Google Scholar] [CrossRef] [Green Version]
  2. Kosmidou, P.M.K.; Chalioris, C.E.; Karayannis, C.G. Flexural/shear strength of RC beams with longitudinal FRP bars an analytical approach. Comput. Concr. 2018, 22, 573–592. [Google Scholar]
  3. Moradi, E.; Naderpour, H.; Kheyroddin, A. An experimental approach for shear strengthening of RC beams using a proposed technique by embedded through-section FRP sheets. Compos. Struct. 2020, 238, 111988. [Google Scholar] [CrossRef]
  4. Chalioris, C.E.; Zapris, A.G.; Karayannis, C.G. U-jacketing applications of Fiber reinforced polymers in reinforced concrete t-beams against shear-test and design. Fibers 2020, 8, 13. [Google Scholar] [CrossRef] [Green Version]
  5. Bouguerra, K.; Ahmed, E.A.; El-Gamal, S.; Benmokrane, B. Testing of full scale concrete bridge deck slabs reinforced with fiber-reinforced polymer (FRP) bars. Constr. Build. Mater. 2011, 25, 3956–3965. [Google Scholar] [CrossRef]
  6. Hassan, M.; Ahmed, E.A.; Benmokrane, B. Punching shear behavior of two way slabs reinforced with FRP shear reinforcement. J. Compos. Constr. 2015, 19, 04014030. [Google Scholar] [CrossRef]
  7. Meisami, M.H.; Mostofinejad, D.; Nakamura, H. Punching shear strengthening of two-way flat slabs using CFRP rods. Compos. Struct. 2013, 99, 112–122. [Google Scholar] [CrossRef]
  8. Soudki, K.; El-Sayed, A.K.; Vanzwol, T. Strengthening of concrete slab-column connections using CFRP strips. J. King Saud. Univ. Eng. Sci. 2012, 24, 25–33. [Google Scholar] [CrossRef] [Green Version]
  9. Amiri, S.; Talaeitaba, S.B. Punching shear strengthening of flat slabs with EBROG and EBRIG-FRP strips. Structures 2020, 26, 139–155. [Google Scholar] [CrossRef]
  10. Ruggieri, S.; Porco, F.; Uva, G. A numerical procedure for modeling the floor deformability in seismic analysis of existing RC buildings. J. Build. Eng. 2018, 19, 273–284. [Google Scholar] [CrossRef]
  11. Ruggieri, S.; Porco, F.; Uva, G. A practical approach for estimating the floor deformability in existing RC buildings: Evaluation of the effects in the structural response and seismic fragility. Bull. Earthq. Eng. 2020, 18, 2083–2113. [Google Scholar] [CrossRef]
  12. ACI 318 Committee. Building Code Requirements for Reinforced Concrete and Commentary (ACI 318-19); American Concrete Institute: Farmington Hills, MI, USA, 2011. [Google Scholar]
  13. British Standards Institution. BS 8110: Structural Use of Concrete, Part. 1: Code of Practice for Design and Construction; British Standards Institution: London, UK, 1997. [Google Scholar]
  14. British Standards Institution. Eurocode 2: Design of Concrete Structures, Part 1-1: General Rules and Rules for Buildings; British Standards Institution: London, UK, 2005. [Google Scholar]
  15. Kim, D.J.; Kim, M.S.; Choi, J.; Kim, H.; Scanlon, A.; Lee, Y.H. Concrete Beams with Fiber-Reinforced Polymer Shear Reinforcement. ACI Struct. J. 2014, 111, 903–912. [Google Scholar] [CrossRef]
  16. Marzouk, H.; Hussein, A. Experimental Investigations on the Behavior of High-Strength Concrete Slabs. ACI Struct. J. 1992, 88, 107–713. [Google Scholar]
  17. Collins, M.P.; Kuchma, D.K. How Safe Are Our Large Lightly Reinforced Beams, Slabs, and Footings. ACI Struct. J. 1999, 96, 482–490. [Google Scholar]
  18. Johansen, K.W. Yield Line Formulae for Slabs; CRC Press: Boca Raton, FL, USA, 1962. [Google Scholar]
  19. Lips, S.; Ruiz, M.F.; Muttoni, A. Experimental Investigation on Punching Strength and Deformation Capacity of Shear-Reinforced Slabs. ACI Struct. J. 2012, 109, 889–900. [Google Scholar]
  20. Park, H.G.; Choi, K.K.; Chung, L. Strain-based strength model for direct punching shear of interior slab-column connections. Eng. Struct. 2011, 33, 1062–1073. [Google Scholar] [CrossRef]
  21. Yang, J.M.; Yoon, Y.S.; Cook, W.D.; Mitchell, D. Punching Shear Behavior of Two-Way Slabs Reinforced with High-Strength Steel. ACI Struct. J. 2010, 107, 468–475. [Google Scholar]
Figure 1. The component of the glass fiber reinforced polymer (GFRP) vertical grid.
Applsci 11 02736 g001
Figure 2. Critical sections provided by ACI 318-19, BS 8110–97 and Eurocode 2: (a) ACI 318–19; (b) BS 8110–97; (c) Eurocode 2.
Applsci 11 02736 g002
Figure 3. Schematic view of the test specimen.
Applsci 11 02736 g003
Figure 4. Arrangement of GFRP vertical grid in the G-184B specimen.
Applsci 11 02736 g004
Figure 5. Test set up of a typical specimen.
Applsci 11 02736 g005
Figure 6. Distribution of cracks on specimens at maximum load: (a) Control; (b) G-246B.
Applsci 11 02736 g006
Figure 7. Crack patterns in the cut section: (a) Control; (b) G-184B; (c) G-184C; (d) G-246A; (e) G-246B; (f) G-246C; (g) G-307A; (h) G-307B; (i) G-369B.
Applsci 11 02736 g007aApplsci 11 02736 g007b
Figure 8. Load displacement curve (shear reinforcement).
Applsci 11 02736 g008
Figure 9. Shear strength for various spacings of shear reinforcement.
Applsci 11 02736 g009
Figure 10. Comparison between the calculated and experimental maximum shear.
Applsci 11 02736 g010
Table 1. Material properties.
TypeDiameter (mm)Tensile Strength (MPa)Elastic Modulus (GPa)
Flexural reinforcing bar22500200
Steel stirrup9.5400200
GFRP-48050
Table 2. Specimen details.
SpecimenSlab CharacteristicsShear ReinforcementCalculated Values
f c
(MPa)
Slab Size
(mm)
Column Size
(mm)
h
(mm)
d
(mm)
ρ
(%)
f f u
(MPa)
A f   ( mm 2 ) s/dAmount of Reinforcement
A f × f f u
(kN)
P y
(kN)
P V
(kN)
Control212000
×
2000
250
×
250
1801382.2----1252374
G-184B4803840.51841252368
G-184C3840.751841252351
G-246A5120.32461252429
G-246B5120.52461252391
G-246C5120.752461252384
G-307A6400.33071252466
G-307B6400.53071252415
G-369B7680.53691252449
Table 3. Summary of shear strength equations provided by design codes.
Design Condes V n = V c + V f
V c V f
Shear StrengthSize EffectReinforcement RatioCritical PerimeterGFRP Vertical Grid
ACI 318–19 0.083 ( 2 + a s d b 0 ) λ f c λ s = 2 1 + 0.004 · d 1.0 - b 0 = 4 ( c + d ) n A f f f u
BS 8110–97 If   f c 25 MPa
0.79 γ m f c u 25 3
Or 1.25
400 d 4
( 400 d 1 )
100 ρ 3
ρ 0.03
b 0 = 4 ( c + 4 d ) 0.95 A f * f f u
Eurocode 2 0.18 γ c f c k 3 1 + 200 d 2.0 100 ρ 3   b 0 = 4 c + 4 π d 1.5 n A f f f u
Table 4. Summary of the experimental and theoretical results.
ExperimentACI 318-19BS 8110-97Eurocode 2
Specimen V c , e x p V c , A C I
(kN)
V c , e x p / V c , A C I V c , B S
(kN)
V c , e x p / V c , B S V c , E C 2
(kN)
V c , e x p / V c , E C 2
Control4503741.203971.133151.43
Table 5. Relative comparison between the experimental and theoretical shear strengths.
SpecimensDisplacement (mm) V n , e x p   ( kN ) V n , e x p / V p r e d i c t e d
ACI
318-19
BS
8110-97
EC2
G-184B11.896211.691.151.17
G-184C10.356121.751.001.22
G-246A12.016901.611.251.10
G-246B14.166351.621.031.13
G-246C10.125621.460.821.03
G-307A15.428151.901.301.31
G-307B12.056941.681.011.17
G-369B16.827531.680.951.18
Average ratio1.671.061.16
Standard deviation0.120.150.08
Publisher’s Note: MDPI stays neutral with regard to jurisdictional claims in published maps and institutional affiliations.

