Abstract
Accurate determination of rock mass deformation modulus is very important in rock engineering projects. The plate loading test (PLT) is a method that is generally used in dam construction projects to determine rock mass modulus. Numerical simulation was used to investigate the mechanisms involved in this test. The first objective of the paper was to employ 3D modeling in the interpretation of plate load tests conducted at the Bazoft dam site in Iran. Additionally, a parametric study of the effects of key parameters such as displacement measuring depth and loading plate diameter on the test results was another objective of the study. The moduli values determined numerically were compared against actual filed testing data determined from in-situ test data conducted at the Bazoft dam site, and the values determined from the ISRM suggested formula. The analysis showed that the optimum measurement depth for rock mass modulus calculation is approximately equal to the loading plate diameter and the data determined from measurement depths beyond one plate diameter can be unrealistic. Moreover, the plate diameter can have a significant effect on test results. As the measurement depth increases, the determined modulus values increase at a much more rapid pace when employing smaller size loading plates.
1. Introduction
Rocks in-situ have properties that can vary significantly over short distances. To identify and map out these variations in properties, a series of site investigation activities are a necessity on every rock engineering project. This includes both a series of laboratory tests to assess the intact rock properties, as well as a range of in situ tests, conducted directly on the undisturbed material to measure the in-situ properties of the rock mass. In situ testing has the advantage of not disturbing the material and can therefore be a useful way of determining the actual characteristics and behavior of rock mass. The static deformation modulus of the rock mass is a key parameter in the design of geotechnical structures like dams, tunnels, and caverns. This parameter represents the deformational behavior of rock mass in response to any loading and unloading. Empirical relationships such as those established by Bieniawski [1], Barton [2], and Hoek and Diederichs [3] and summarized by Palmstrom and Singh [4] that relate the rock mass deformation modulus to different rock mass classifications are estimations that can be used in the preliminary stages of the design. Furthermore, these relations do not indicate modulus anisotropy in different directions. Because of the effect of discontinuities in the rock mass, the modulus obtained from laboratory tests for intact rock does not represent the in situ deformational behavior of the rock mass. Therefore, in situ tests are typically more reliable procedures and employed in major rock engineering projects.
The plate load test is one of the most commonly used in-situ tests since it involves a large volume of the rock mass to be tested. The rock mass is loaded by a set of hydraulic jacks by two circular steel plates and the associated rock mass deformations are measured by extensometers installed within the boreholes drilled within the rock mass beneath the loading plates. Then elasticity theory (Boussinesq relation) for a semi-infinite medium is used to calculate the deformation modulus. This is the suggested method by ISRM to calculate the deformation modulus of the rock mass [5].
The assumptions used in the ISRM method are not in harmony with the actual mechanism involved in rock mass deformation. In this method, it is assumed that the rock mass is continuous, isotropic, and has a linear elastic behavior. In the real world, the behavior of rock is more complex, in particular when the structure goes through loading/unloading stages, some plastic deformation occurs within the rock mass. In this paper, a parametric study of key parameters in the plate load test was investigated. The plate load tests conducted at the Bazoft concrete dam site (Iran) were simulated numerically to demonstrate the governing test mechanisms and to interpret data for the determination of deformation modulus. The effect of plate diameter, location of anchors, and the amount of plastic strain in each loading-unloading cycle on the values of moduli were investigated employing sophisticated 3D numerical modeling considering the governing boundary conditions of the plate load test.
2. Background Studies and Plate Load Test Technique Principles
Since the definition of rock deformability by ISRM [6], various authors have investigated different aspects of the plate load test as a means of measuring in-situ rock mass deformation modulus. Unal [7] gave a review of test principles and discussed the problems associated with commonly used modulus determination approaches. A stiff plate loading system and a multi-borehole displacement-measuring system were introduced. Emphasis was given to the description of the test set-up, test theory, and the interpretation of the test results. To illustrate this, typical results obtained from a test carried out in an underground test drift, are presented in the form of a stress-strain relation. The drawbacks of the ISRM-suggested method was discussed and alternative solutions were proposed. A comprehensive application of the plate load test at the Yucca Mountain project was presented by George et al. [8].
The obtained results from sets of plate loading tests conducted by Sandia National Laboratories at the Yucca Mountain test site (Nevada, USA) was presented. The findings of these in situ tests as well as approaches undertaken for the determination of rock mass modulus were described. The obtained field data were compared against existing empirical methods and numerical modeling results. In this study, the in-situ rock mass stiffness was evaluated for both ambient temperature and thermally perturbed rock masses. Rock mass deformation modulus was estimated employing empirical techniques, borehole jacking test, numerical modeling, and the plate load test. The study suggests that the PLT rock mass modulus values better represent the actual response of the rock mass.
Palmestrom and Singh [4] presented a comprehensive comparison between in situ tests and indirect estimates of rock mass deformation modulus. The Goodman jacking test, rock mass classification-based methods (RMR, Q, RMi), and plate load test method of deformation modulus assessment were compared. The existing equations for indirect estimates of the rock mass deformation modulus from classification systems have been analyzed and adjustments are suggested. It was concluded that provided that a good in-situ characterization of the rock mass is carried out, these methods may determine comparable or possibly better modulus values taking into consideration the uncertainties associated with in situ deformation measurements caused by blast damage, test procedure, and test method. Estimates based on the RMR and RMi systems show better deformation modulus values for jointed rock masses than the Q system. It was suggested that the RMR system overestimates the rock mass modulus in massive and competent rock masses. RMi system gives better estimates of modulus for massive rock than the Q and the RMR systems. It was concluded that the plate jacking test, in which the deformations are measured by extensometers in drill holes, produces more realistic results compared with other direct measurement techniques.
Kayabasi et al. [9] presented a comparison of empirical methods used in rock mass deformation modulus assessment. The plate load test data from a dam construction site was used in conjunction with a fuzzy interface system for the comparison of the results. A set of statistical analyses was conducted and it was concluded that a combination of empirical and fuzzy methods produces satisfactory results provided enough input that is available for the fuzzy interface system. The study concluded that the elasticity modulus of the intact rock, RQD, and weathering degree are the most important parameters affecting the rock mass deformation modulus.
Agharazi et al. [10] presented a comprehensive interpretation of plate load test data conducted at the Bakhtiary Dam site project in Iran. The results of 26 plate load tests carried out at the Bakhtiary dam site were investigated to delve into the mechanisms involved in the plate load test. The test data were categorized based on the orientation of the rock mass discontinuity sets to the loading direction. The study showed that part of the scatter commonly observed in the moduli calculated from plate load tests is due to varying rock mass deformation mechanisms that occur during the test. Furthermore, it was concluded that the theoretical assumptions behind the plate load test are not in full harmony with the observed deformation mechanisms leading to scattering in plate load test data.
Yang et al. [11] conducted an investigation of the in-situ viscoelastic properties of a weak rock layer at the Dagangshan hydropower dam project in southwest China employing time-dependent plate load tests. To assess the deformation characteristics of a weak diabase dike layer, in situ large-scale compressive creep tests, using a rigid bearing plate, were carried out. The loading direction was perpendicular to the weak layer. A five-parameter Kelvin model was considered and mathematical equations were derived based on the Boussinesq problem through Laplace transform and inverse transform to describe the deformation-time history considered in the Kelvin model under three-dimensional stress-strain conditions. The finite-difference modeling was used for verification of the results. Based on the derived equations, the rock mass rheological parameters were estimated and it was concluded that the proposed five-parameter Kelvin model produces more realistic results compared to the three-parameter generalized Kelvin model or the standard Burgers model.
Amorosi et al. [12] developed a new constitutive model for the analysis of plate load test results in pyroclastic soft rocks. The developed model has a generalized yield surface including the known criteria and the elastic stiffness is related to stress by a hyper elastic formulation. The model is capable of simulating plastic strain by a set of appropriate isotropic hardening laws. The model was implemented into a finite element code and was used to simulate the plate load tests conducted in pyroclastic rocks. The test results showed specific features of rock response under applied loading conditions, including non-linear elastic behavior and structure degradation which was indicated by the reduction of shear strength parameters. The modeling results showed good agreement with the test data demonstrating the relevance of the developed model for soft rock material investigated. The damage to the rock mass, during loading and unloading cycles, was disclosed by irreversible straining which appeared in the form of plastic strain-induced damaged within the intact rock material. The macro-scale damage was demonstrated in the form of stiffness reduction and strength degradation by the reduction in rock mass cohesion and friction angle.
Kavur et al. [13] presented a comprehensive comparison of plate load test (PLT) data versus large flat jack (LFJ) data which was carried out side-by-side at the Karun III hydro-electric project in Iran. The comparison included 16 plate load tests and 12 large flat jack tests. PLT moduli obtained from displacements measured in depth were much higher than the LFJ moduli and were sometimes even higher than the modulus of the intact rock material. The analyses showed that the uncertainties associated with plate load tests are caused by the confining effects of the adjoining rock, blast-induced damages induced to test gallery walls, distressing of gallery walls, and the insufficient volume of rock tested.
In the plate load test, a cyclic load is applied to the rock mass in small test tunnels, audits, or at the ground surface and the rock mass deformation is measured at various depths beneath the loading plates. The loading system consists of four hydraulic jacks, steel spacers, and circular steel plates of 1 m in diameter which are fitted to flat rock surfaces prepared on the test gallery walls (for horizontal tests) or gallery roof/floor (for vertical tests). Rock mass deformations are measured in boreholes behind each loaded area and across the test gallery as illustrated in Figure 1. Two types of plate load tests exist: “flexible plate loading method” which is associated with uniform stress boundary conditions and “rigid plate loading method” which implies uniform displacement boundary conditions. When testing rock, then the plate may not have adequate stiffness leading to complex stress distributions, thus, the plate stiffness should be at least 100% more than the stiffness of the rock mass [14].
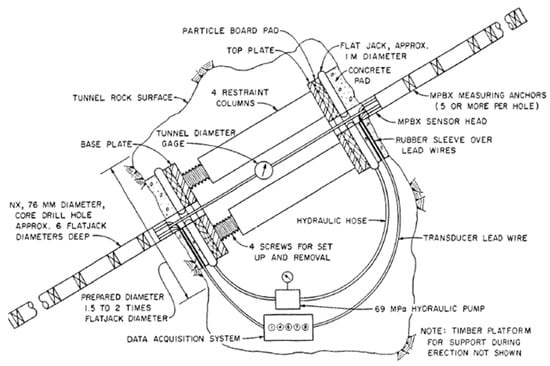
Figure 1.
Plate load test set up by ISRM suggested method [5].
The loading and unloading deformation moduli are calculated from the data determined from the cyclic loading of the rock mass. Based on elasticity theory, deformation measurements for various load cycles are utilized to compute the deformation moduli. Depending upon the type of the test, i.e., rigid or flexible loading, the following equations are used respectively [10]. These equations are commonly used in practice to determine rock mass modulus from in-situ testing data:
where , ν = Poisson ratio of the rock mass, WZ = Measured displacement at depth Z under a loaded surface, a = radius of the loaded rock mass surface, qav = average applied stress and Z = depth of the displacement measurements.
where w is the vertical displacement, a is the radius of the loading plate, q is the applied stress, E is the modulus of elasticity, v is the Poisson’s ratio and z is the depth of deformation measurement along the loading plate axis.
3. Plate Load Test Data Interpretation
In the interpretation of test results, several parameters can affect the test results and lead to incorrect determination of the deformation modulus. These parameters are classified into two groups [10]; operational factors which are directly related to the quality of the test components such as the resolution of the measuring instruments, and the quality of site preparation and installation of the test apparatus. Blast damage and rock disturbance around the test gallery are important examples of this category. In this case, the effect of blast damage will vary with several features, such as rock properties, amount of explosive used, number of holes detonated at the same time, and the quality of site preparation [4].
The incompatibility between assumptions made within the ISRM suggested method and the actual mechanisms involved in the practice, leads to some errors in the interpretation of test data. In the ISRM method, it is assumed that the rock masse is homogenous, isotropic, and continuum with linear elastic behavior which is not in harmony with actual rock mass conditions. Moreover, the effects of test gallery boundary conditions and induced stress state around the test location are not considered in calculations. Besides, these equations require prior knowledge of Poisson’s ratio of the rock as input, which is difficult to determine at the rock mass scale. The other important issue in this test is the scale effect on the test results. Oh and Vanapalli [15] presented a study looking into the scale effects in plate load tests in unsaturated soils. A good description of scale effects on plate load testing results in rock is given by Palmstrom and Singh [4]. Martin et al. [16] further discussed the significance of scale in in-situ measurement. In the study by Kavur et al. [13], it was shown that the uncertainties associated with plate load tests are caused by the confining effects of the adjoining rock, blast-induced damages induced to test gallery walls, distressing of gallery walls, and the insufficient volume of rock tested.
The dependency of calculated modulus magnitude to the displacement measurement depth in the borehole is another shortcoming of the ISRM suggested method. Furthermore, in the PLT procedure, the load is measured at the plate surface while displacements are measured by extensometers installed at varying depths within the borehole. Accordingly, the calculated moduli at higher depths may be significantly higher and sometimes unrealistic for a given test.
In another attempt, Agharazi et al. [17] employed continuum modeling to overcome the limitations proposed by the ISRM-suggested approach in the interpretation of plate load test data. They postulated that because of the inconsistency of the test gallery geometry with the half-space medium assumption embedded in the analytical relations, a systematic error occurs in the calculation of the deformation modulus. Furthermore, when the tests are conducted on jointed rock masses, the test results show a considerable scatter, mainly due to the anisotropy of the deformability of the jointed rock masses. Accordingly, numerical modeling was used to interpret the results of a series of PLTs conducted at the Bakhtiary dam site in southwest Iran. An equivalent continuum model was used to back-calculate the stiffness of bedding planes from the test results. The equivalent continuum deformation moduli of the rock mass were determined numerically for various directions of loading relative to the orientation of major joint sets. Their numerical study showed that the deformation of the rock mass is highly anisotropic and highly dependent on the geometry and mechanical properties of the discontinuities. The developed continuum model overestimates the stiffness of the jointed rock mass. The proposed model’s application is limited to the rock media where the rock mass deformation does not involve large dislocation and detachments of blocks.
Zhao et al. [18] employed the distinct element method (DEM) using the PFC code to simulate the in-situ deformability of jointed rock mass. The mechanical behavior of a jointed rock mass with varying joint configurations was evaluated numerically. The effect of rock mass confinement on rock deformability was also evaluated. They concluded that an increase in confining stress changes the deformation mode from tension to shear. The confinement issue has a controlling role in the plate load test results.
4. Plate Load Testing at the Bazoft Dam Site
The Bazoft Dam and Hydroelectric Power plant project include the design and construction of a 211 m high, double curvature, concrete dam, and an underground powerhouse, located 200 km SW of ShareKord, Chaharmahal and Bakhtiary Province in southwestern Iran. The bedrock consists of two geological units from the Eocene, Oligocene, and Miocene. The Asmari formation (As’s in Figure 2b) forms the left abutment consisting of marly-limestone and thin layers of limestone. The right abutment and the lower part of the left abutment are built over the Jahrom formation (Ja in Figure 2b and Figure 3) which consists of crystalline massive limestone with interlayers of marly limestone. Figure 2 shows the plan and longitudinal views of the Bazoft dam site illustrating the site topography, abutment geometry, and site general geology. In Figure 3 a magnified view of the right abutment, the location of the test gallery, overall view of the Jahrom (Ja) formation, and modeling domain considered in the 3D analyses are shown.
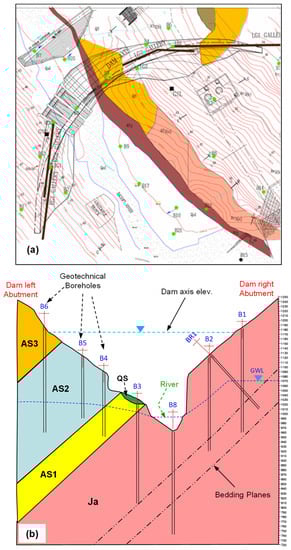
Figure 2.
Overall views of Bazoft dam site; (a) Plan view of site topography and (b) Longitudinal view of abutments geometry and general geology.
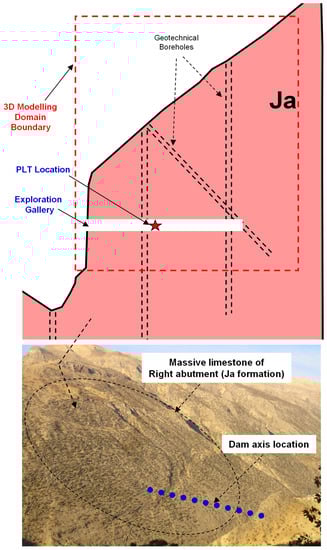
Figure 3.
Magnified views of the right abutment, conducted PLT location, and modelling domain boundary.
Three plate load tests were carried out in the right abutment of the Bazoft dam. Two PLTs were set-up in a horizontal direction and one in a vertical direction. The plate load test conducted in the lower gallery (PLH3-RG1) was set up in the horizontal direction and located at about mid-length of the test gallery as illustrated in Figure 3. The test was carried out with five loading and unloading cycles. Figure 4 shows a summary of the test results obtained. Figure 4a illustrates the stress levels that are applied to rock mass in five consecutive cycles. These stress levels are typical of plate load testing practices and are typically selected by the dam design team based on the probable stress levels that are going to be applied to the abutment by the dam once it is constructed and in operation. Once the load is increased to the predefined level in each cycle, it will be kept constant to allow the rock mass to reach an equilibrium state with the applied load and no further deformation has occurred in the rock mass. The flat portion on all graphs is indicative of this stage. After the last cycle, the rock is reloaded to the last cycle stress level and the creep behavior of the rock mass is assessed. Further details on the testing procedure can be found in [5,6,7,10]. Figure 4b,c illustrate the change in rock mass deformation at varying depths beneath the loading plate for the right and left plates respectively. As can be seen from the results, the displacement magnitude at sensor A location which is closer to the surface is significantly higher than the other sensors which are installed further deep into the rock mass. Looking at these figures indicates the significance of displacement measuring depth on the determined final deformation modulus. This issue is investigated numerically in the next sections. In Figure 5 the peak displacement at the end of each loading cycle is plotted for all sensors comparatively for the right and left test gallery walls. Referring to this figure, the displacement variations for the right and left plate are different which means that the rock mass deformational behavior on test gallery sides are different. Furthermore, the significance of deformation at the shallow anchoring points is noticeable compared to deeper measuring points. This indicates that the displacement data recorded at higher depths are not realistic in terms of rock mass behavior given the applied load level.
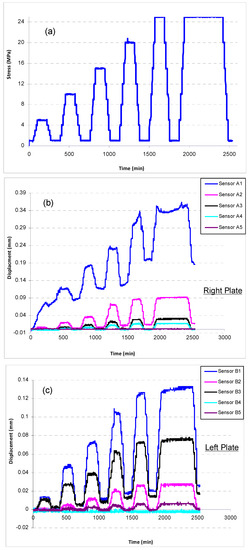
Figure 4.
A horizontal plate load test results at the Bazoft dam right abutment: (a) Pressure-time history, (b) Displacement-time variations (right plate), (c) Displacement-time variations (left plate) [19].
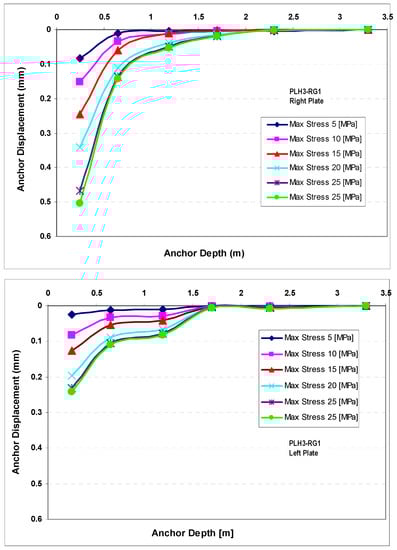
Figure 5.
Rock displacement changes beneath the plates as a function of depth for all loading cycles [19].
5. Numerical Simulation of Plate Load Test Mechanisms
In this study the plate load tests conducted at the Bazoft dam were simulated numerically aiming at illustrating the key parameters and mechanisms involved in the test. The sophisticated 3D finite difference code Flac-3D developed by Itasca Inc. [20] was used to simulate the test condition at actual scale. This code is equipped with sophisticated mesh generation, material behavior modeling, etc. capabilities and is capable of considering complex boundary conditions. The Bazoft dam right abutment geometry, test gallery geometry and location, test gallery-induced stress regime, PL test geometry and condition (loading and unloading cycles) were considered in the simulations and the effects of loading plate diameter and depth of displacement measurements locations on the calculated moduli were investigated.
Based on conducted geological and geotechnical assessments, the rock mass of the right abutment consists of massive limestone. Standard rock mechanics tests (uniaxial compressive test, Brazilian test, triaxial test) were conducted on representative rock samples obtained from geotechnical boreholes. Moreover, a comprehensive survey and mapping of dam abutments was carried out to determine the in-situ rock mass conditions. Combination of obtained laboratory data and in-situ mappings enabled the determination of rock mass ins-situ parameters (Table 1). Two exploration galleries were excavated in the right abutment and in-situ plate load tests were carried out in these galleries. The estimated Poisson’s ratio and RMR for the rock mass were 0.3 and 68–78, respectively [19]. A 3D model of the right abutment of the Bazoft dam and its test gallery was constructed. Figure 3 illustrates the actual view of the right abutment and the modelling domain considered for 3D modelling. In Figure 6 the actual PLT set up and the constructed 3D model of the right abutment and test gallery are illustrated. Figure 7 shows a magnified view of the constructed numerical model of the jacking test location and the displacement measurement borehole. In line with the pattern and location of displacement measuring points in actual test, measuring points were considered within the model and (Figure 7).

Table 1.
Physical and mechanical properties of the Bazoft dam right abutment rock [19].
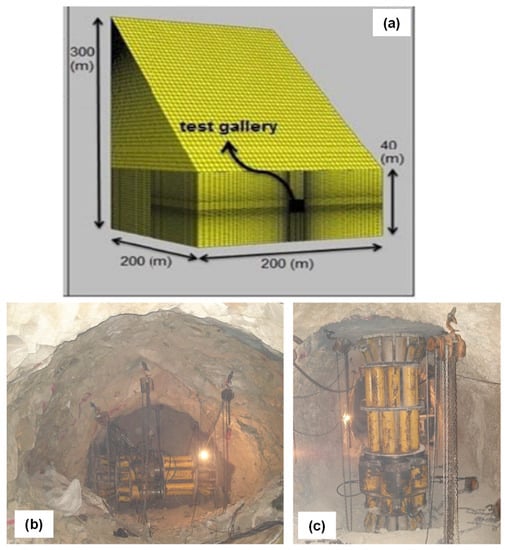
Figure 6.
(a) View of the Bazoft dam right abutment Flac-3D model, (b) View of the simulated test gallery and the horizontal PLT set up, (c) View of the vertical PLT set up.
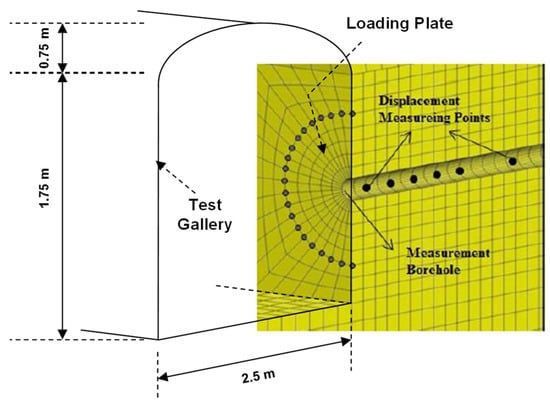
Figure 7.
View of the horizontal plate loading test set up implemented within the 3D model.
In the conducted numerical analysis, the Mohr-Coulomb constitutive model was used to simulate the rock mass behavior. Because of the plastic deformations associated with loading/unloading cycles, which affect the slope of the stress-strain curve (deformation modulus), this simple model was selected for the PLT simulations. The model geometry, material properties, and boundary conditions used in the analysis were selected based on Bazoft dam site conditions. To determine the load-displacement curve, five loading-unloading cycles were simulated. The simulated loading cycles were applied as was instructed for the in-situ tests and based on standard guidelines. At the last cycle, the rock mass loaded up to 25 MPa. In the base run model, the simulated circular loading area had a diameter of 80 cm which is equal to the diameter of loading plates used in the actual in-situ tests.
6. Numerical Simulation Results
To understand the mechanisms of the plate load test, three tests were simulated considering the location of actual in situ tests conducted in the Bazoft dam right abutment [21]. To compare the test results with numerical simulation results, the load-displacement curves were calculated at ten measuring points (see Figure 7) within the rock mass and below the loading plate. Figure 8 shows the load-displacement curve of a simulated test at a point located 60 cm beneath the loading plate.
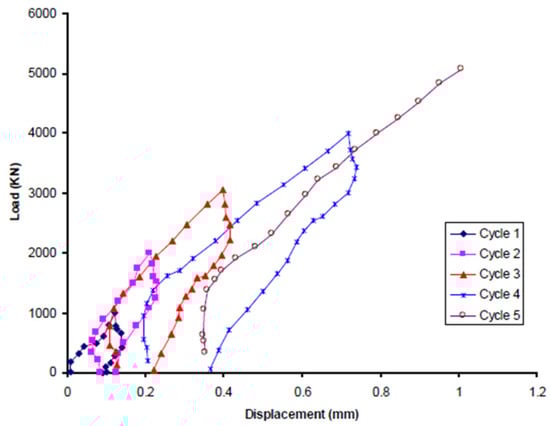
Figure 8.
Load-displacement curves determined at a measuring point 60 cm below the loading plate.
To calculate the deformation modulus, a linear strain variation during loading/unloading cycles was assumed. Figure 9 shows a stress-strain curve determined at a measurement point 60 cm beneath the plate. The slope of each loading and unloading cycles represents the loading and unloading deformation modulus respectively.
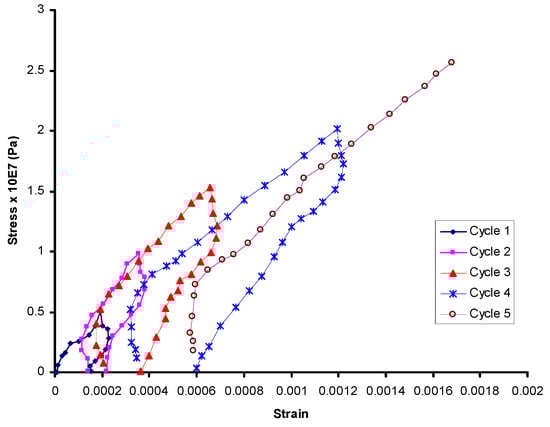
Figure 9.
Stress-strain curve determined at a measuring point 60 cm below the loading plate.
A linear fit function was used to determine the slope of each curve. These linear functions were fitted in the linear part of the curves. As can be seen from the determined curves, the initial part of the recorded data is associated with stiffness of the testing system components and matching between loading system and rock surface. This portion of the data, which is indicative of very high and sometimes infinitive modulus values, do not represent the rock mass behavior and was not considered in modulus calculations. According to [21] at the beginning of unloading, due to a time lag between loading and unloading phases, and concerning the distance between the plate and the measurement points, stress relaxation due to plate movement at the beginning of the unloading process is not transferred to the measurement points instantaneously. Therefore, displacement contours near the plate move back to the direction of the plate movement (unloading direction), but displacement contours far from the plate move in the opposite direction (loading direction) due to the loading process at the previous cycle. As a result, a transitional zone, with zero displacements, develops between these two areas as illustrated in Figure 10. This transitional zone causes the vertical slope in the beginning parts of all unloading cycles. Similarly, when the unloading process is finished and a new loading cycle is initiated, this phenomenon causes a vertical slope at the beginning part of the loading curves. Linear fit functions for five loading/unloading cycles at a depth of 60 cm below the loading surface are shown in Figure 11. Unal [7] suggested a new method for the determination of rock mass modulus based on the least square method. This method postulates an advantage to use all displacement measurements in modulus calculation, but as mentioned earlier, some portion of the displacement measurements should not be taken into account for modulus calculations.
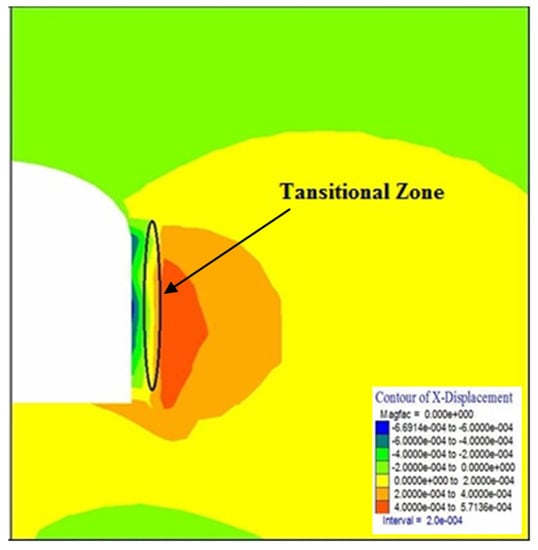
Figure 10.
Displacement contours at the beginning of the unloading phase.
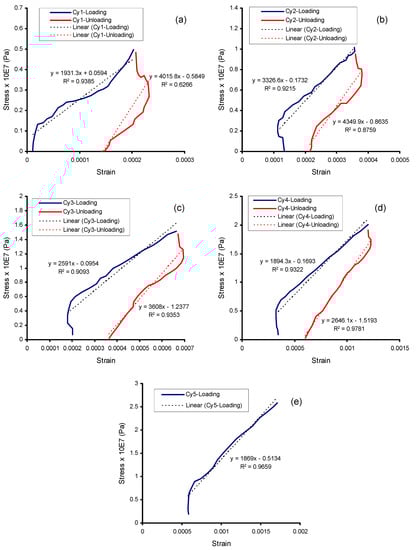
Figure 11.
Stress-Strain curves and linear fits for five loading-unloading cycles; determined at a depth of 60 cm: (a) 1st cycle, (b) 2nd cycle, (c) 3rd cycle, (d) 4th cycle, (e) 5th cycle [21].
6.1. Parametric Analysis of Displacement Measurement Depth on Deformation Modulus
With regard to the common practices of plate load testing, in which the load is measured on the surface of the plate and displacements are measured at varying depths within the rock mass, there is an apparent trend of increasing moduli with the depth of deformation measurement for a given test. In some cases, this will cause significant error such that the calculated rock mass moduli are much greater than that of the intact rock. This issue was investigated numerically. The constructed Flac-3D model represents the dam right abutment fairly well and the simulated test location was selected at a chainage of about 30 m from the test gallery entrance as in the actual test. Accordingly, it was assured that the test boundary conditions (from rock type variation, in-situ stress, excavation induced stress, abutment geometry, etc. points of view) were considered properly. The variation of deformation modulus as a function measurement depth was calculated and illustrated in Figure 12. It is observed that at a depth equal and beyond plate diameter, the calculated modulus is greater than that of the intact rock. With regard to the conducted numerical analyses, the plate diameter is the maximum depth at which displacement measurement should be conducted to determine the rock mass deformation modulus. Concerning the rock mass conditions, several parameters affect the maximum suitable measurement depth. To evaluate the effect of plate diameter on test results, a series of numerical analyses were carried out. The results are presented in the next section.
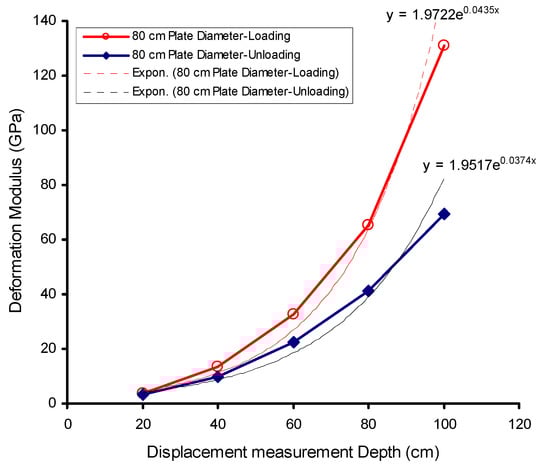
Figure 12.
The sensitivity of the deformation modulus to measurement depth in the plate load test.
6.2. Parametric Analysis of Loading Plate Diameter on Plate Load Test Results
From a continuum mechanics point of view, the plate load test mechanism and associated stress distribution can be considered as an elastic half-space and a rigid foundation problem. The stress distribution underneath the plate is fairly complex and difficult to characterize. The loading system-rock interface properties control the stress distribution beneath the loading plate. The contact stress distribution is complex and can become singular at some points on the half-space surface. The geometry of the problem can be illustrated as in Figure 13.
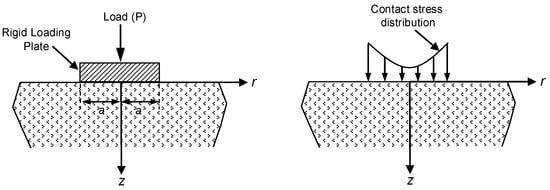
Figure 13.
Free diagram of a rigid loading plate problem.
Assuming a constant displacement distribution, the stress beneath the plate can be expressed by the following equation which its resultant is equal to the applied load:
Similarly, the vertical displacement beneath the plate can be determined by integrating the appropriate equation provided that the correct stress distribution is known at the depth of interest. Boussinesq was the first person which provided the stress distribution beneath the plate as below:
With regard to the above equation, from a theoretical point of view, the stress is minimum at r = 0 and increases to infinity as r approaches a. However, in practice, rock plastic deformations and failures at the plate edge lead to stress drop and redistribution at the plate boundaries. Moreover, Equation (6) can be verified by the necessary integrations. The stress distribution given in Equation (7) will result in a constant settlement beneath the plate. To see how displacement is related to load (P), we can use Boussinesq’s solution and integrate the given stress distribution. The displacement beneath the plate can be calculated at the plate center from the following equation [22]:
With regard to the above equation, displacement beneath the plate depends only on the applied load, P, the plate radius, a, and the elastic properties of the half-space. In order to determine displacement analytically at higher depths below the plate, a much more complicated integration must be carried out. The complexity of the stress distribution below the plate is a function of plate-rock interface frictional properties which is very difficult to characterize and measure. Therefore, numerical modeling is a viable alternative to assess the stress and displacement fields as a function of depth below the loading plate. In common practices of plate load testing, it is seen that the loading plate diameter is changed by contractors without knowing its effect on the calculated displacements and, thus, the determined in-situ moduli.
In order to shed some light on the effects of plate diameter and displacement measurement depth on plate load test results, numerical simulations were carried out. For this purpose, considering three different plate diameters of 60, 80, and 100 cm, three sets of 3D simulations were carried out to investigate the effect of plate diameter on the calculated rock mass moduli. The displacement for larger diameters should be greater than that of smaller diameters in the same load at the surface of the plate. The contours of horizontal stress distribution on the test gallery wall for two plate diameters of 80 and 100 cm are plotted in Figure 14. The stresses were evaluated at the PLT measurement points and it was observed that for the same load at the surface of the plate, at a given point, the stress value for larger plate diameters is greater than the stress value for smaller plate diameters (see Figure 14). This extra stress produces larger displacements at the measurement point and consequently leads to a reduction in the magnitude of modulus.
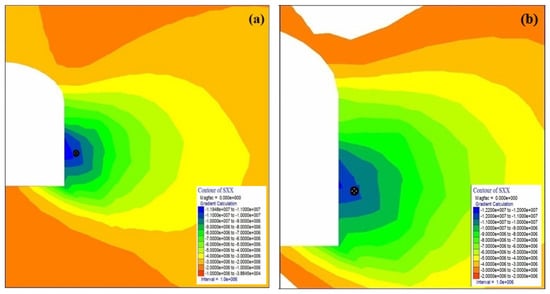
Figure 14.
Induced stress state (Pa) in the direction of loading for two plate diameters in an in-situ plate load test, (a) loading plate diameter of 80 cm (b) loading plate diameter of 100 cm.
To further illustrate the issue, the sensitivity of the calculated loading modulus to loading plate diameter was computed as a function of displacement measurement depth and plotted in Figure 15. The obtained results show that larger plate diameters result in smaller values of moduli. Looking at the obtained results as the measurement depth increases the sensitivity of modulus value to plate diameter increases at a more rapid rate and can lead to an overestimation of the modulus value.
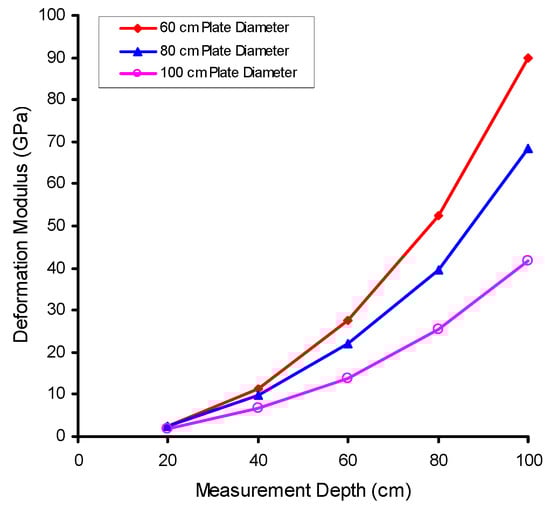
Figure 15.
The effect of plate load diameter on deformation modulus variation as a function of displacement measurement depth.
6.3. Parametric Analysis of the Effect of Plastic Strains on Loading/Unloading Moduli
In the standard uniaxial compression test on rock samples, the linear portion of the stress-strain curve represents the elastic modulus of the rock. As loading is increased beyond the elastic limit, micro-cracks propagation and coalescence lead to the formation of larger cracks and shear bands which appear in the form of plastic deformations within the rock. Plastic deformations cause the reduction of rock mass deformation modulus and rock mass damage. The computed plastic strains that occurred during loading/unloading cycles were analyzed to see how the occurred plasticity affects the PLT results. Variations of plastic strain, as a function of change in loading plate diameter, for the three simulated plate diameter scenarios are illustrated in Figure 16. Moreover, plastic strain variations were evaluated at varying depths beneath the plate. As can be seen from this figure, by an increase in plate diameter, the amount of plastic strain at a given measurement point is increased leading to the reduction of the rock mass stiffness and consequently deformation modulus. Referring to Figure 16, the plastic strain increases in a linear fashion as a function of loading plate diameter. This increase is more pronounced at shallower depths beneath the loading plate. At greater depths, less plastic deformations occur and the applied load level (loading cycle) does not influence the rock deformation and plastic failure as such. This can be seen from Figure 16b,c.
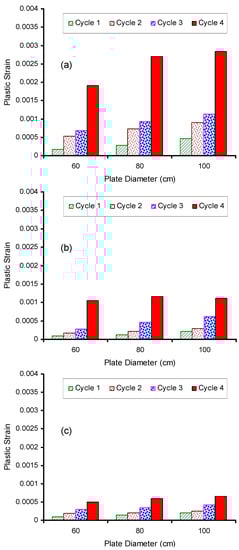
Figure 16.
Variations of plastic strain as a function of change in loading plate diameter measured at a depth of; (a) 20 cm beneath the plate, (b) 40 cm beneath the plate, and (c) 60 cm beneath the plate.
7. Comparison and Discussion of Results
To verify the conducted numerical study, the obtained results were compared against the actual in-situ tests conducted at the Bazoft concrete dam site and also the ISRM suggested method which is based on elasticity theory. Two objectives were the focus of this comparison. The first goal was to validate the numerical results and demonstrate the accuracy of 3D modeling for PLT simulation. The second objective was to compare the modulus calculation results obtained based on elasticity theory (the ISRM method) and the application of the Mohr-Coulomb model within the 3D numerical methods. The modulus values calculated at varying depths below the plate by the ISRM method, 3D simulation of an actual horizontal plate load test in a test gallery at the Bazoft dam right abutment, and the actual in-situ PLT test conducted at the same location, were compared against one another and presented in Figure 17.
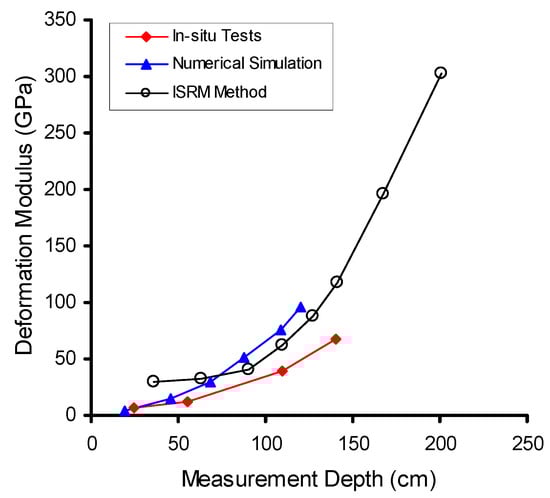
Figure 17.
A Comparison of modulus values determined for Bazoft dam right abutment employing different methods.
Referring to Figure 17, the ISRM suggested method determines larger modulus values in comparison to the other two methods. Concerning the fundamental limitation associated with this method, the values predicted at higher measurement depths are unrealistic and should be avoided. For example, the calculated modulus for the massive limestone of Bazoft dam right abutment, at a depth of about 170 cm below the loading plate, is measured to be slightly over 200 GPa which is higher than the stiffness of steel. These values are incorrect and must be excluded when reporting the test results. Also, it can be seen that for measurement depths of up to the loading plate radius, the in-situ data and numerical modeling data are in good harmony and match each other. At measurement depths beyond plate radius, the pattern of modulus variation as a function of depth changes significantly. The modulus obtained from the test data is solely based on the deformation measured at a single point below the plate. Depending on the load level, plate diameter, and the quality of rock, at depths beyond one plate diameter, the recorded displacements can be very small and sometimes negligible. Regardless of the method of modulus calculations (e.g., [5,7], etc.), the data reported for higher depths are unrealistic and must not be reported as the rock mass modulus. This problem becomes more pronounced if smaller size plates are used in the plate load tests. The numerically produced data show a different trend for modulus variation as a function of depth. In the constructed Flac-3D model, the test key boundary conditions were considered properly. These conditions are dam right abutment geometry and height, test gallery shape and dimension and associate gallery induced stress change at the test location, and the PLT geometry and direction. Moreover, a Mohr-Coulomb constitutive model was used for the rock mass to allow for plastic deformations as a function of loading. Accordingly, it is believed that the in-situ confining effects of the rock mass, significantly enhances the rock load-bearing capacity and its in-situ stiffness. The modeling results show that the depth has a much more pronounced effect on rock mass in-situ stiffness as can be seen from Figure 17.
8. Conclusions
The validity of the determination of the rock mass deformation modulus using the plate load tests conducted at the Bazoft dam project site was evaluated numerically. The 3D numerical simulation, using the Mohr-Coulomb constitutive model, was successfully used to simulate the in-situ PLT conducted at the Bazoft dam. The analysis showed that the optimum measurement depth for rock mass modulus calculation is approximately equal to the loading plate radius. The data determined from measurement depths beyond one plate diameter can be erroneously high and unrealistic. In practical applications of the plate load test, the diameter of the loading platen is reduced from the standard size to smaller values to ease the test. This affects the stress field provided by the loading plate and significantly influences the test data and leads to erroneous results in the calculation of rock mass modulus. The analysis results show that the plate diameter can have a significant effect on test results. As the measurement depth increases, the determined modulus values increase at a much more rapid pace when employing smaller loading plates as illustrated in Figure 17. By measuring plastic strains in each loading/unloading cycle, it was shown that by an increase in plate diameter, the amount of plastic strain, for a given measuring point, would increase leading to the reduction of the rock mass stiffness and consequently deformation modulus. Based on obtained results, it is concluded that the initial vertical parts of the load-displacement curves or consequently stress-strain curves (vertical slope) are due to a time lag between loading and unloading phases and also the distance between loading plates and measurement points. Therefore, the vertical parts should not be taken into account in the determination of rock mass modulus. Considering the fundamental shortcomings of the ISRM suggested method in the interpretation of test results, the best way for modulus calculation is the depiction of stress-strain curves and measuring the slope of these curves. With regard to the capabilities of sophisticated numerical methods, which enable the consideration of PLT governing boundary conditions, a combination of standard in-situ tests and 3D numerical modeling is recommended for the in-situ characterization of rock masses for important projects.
Funding
This research received no external funding.
Institutional Review Board Statement
Not Applicable.
Informed Consent Statement
Not Applicable.
Data Availability Statement
The study did not report any data.
Conflicts of Interest
The author declares no conflict of interest.
References
- Bieniawski, Z. Determining rock mass deformability: Experience from case histories. Int. J. Rock Mech. Min. Sci. Géoméch. Abstr. 1978, 15, 237–247. [Google Scholar] [CrossRef]
- Barton, N. Scale effects or sampling bias. Scale Eff. Rock Mech. 1990, 182, 31–55. [Google Scholar]
- Hoek, E.; Diederichs, M. Empirical estimation of rock mass modulus. Int. J. Rock Mech. Min. Sci. 2006, 43, 203–215. [Google Scholar] [CrossRef]
- Palmstrom, A.; Sing, R. The deformation modulus of rock masses, comparison between in situ tests and indirect estimates. Tunn. Undergr. Space Technol. 2001, 16, 115–131. [Google Scholar] [CrossRef]
- ISRM. Suggested method for determining in situ deformability of rock. Int. J. Rock Mech. Min. Sci. 1979, 16, 143–146. [Google Scholar]
- ISRM. Report of the Commission on Terminology; ISRM: Lisbon, Portugal, 1975. [Google Scholar]
- Unal, E. Determination of in situ deformation modulus: New approach for plate-loading test. Int. J. Rock Mech. Min. Sci. 1997, 34, 897–915. [Google Scholar] [CrossRef]
- George, J.T.; Finley, R.E.; Riggins, M. Determination of rock mass modulus using the plate loading method at Yucca Mountain, Nevada. In Proceedings of the 9th ISRM Congress, International Society for Rock Mechanics and Rock Engineering, Paris, France, 25 August 1999. [Google Scholar]
- Kayabasi, A.; Gokceoglu, C.; Ercanoglu, M. Estimating the deformation modulus of rock masses: A comparative study. Int. J. Rock Mech. Min. Sci. 2003, 40, 55–63. [Google Scholar] [CrossRef]
- Agharazi, A.; Tannant, D.D.; Martin, C.D. Characterizing rock mass deformation mechanisms during plate load tests at the Bakhtiary dam project. Int. J. Rock Mech. Min. Sci. 2012, 49, 1–11. [Google Scholar] [CrossRef]
- Yang, W.; Zhang, Q.; Li, S.; Wang, S. Estimation of in situ viscoelastic parameters of a weak rock layer by time de-pendent plate-loading tests. Int. J. Rock Mech. Min. Sci. 2014, 66, 169–176. [Google Scholar] [CrossRef]
- Amorosi, A.; Aversa, S.; Boldini, D.; Laera, A.; Nicotera, M.V. Application of a new constitutive model to the analysis of plate load tests in a pyroclastic rock. Int. J. Rock Mech. Min. Sci. 2015, 78, 271–282. [Google Scholar] [CrossRef]
- Kavur, B.; Cvitanović, N.Š.; Hrženjak, P. Comparison between plate jacking and large flat jack test results of rock mass deformation modulus. Int. J. Rock Mech. Min. Sci. 2015, 73, 102–114. [Google Scholar] [CrossRef]
- Boyle, W. Interpretation of plate load test data. Int. J. Rock Mech. Min. Sci. Géomeéch. Abstr. 1992, 29, 133–141. [Google Scholar] [CrossRef]
- Vanapalli, S.K.; Oh, W.T. Uncertainties in Interpreting the Scale Effect of Plate Load Tests in Unsaturated Soils. In Proceedings of the International Symposium on Engineering under Uncertainty: Safety Assessment and Management (ISEUSAM-2012); Springer: Berlin/Heidelberg, Germany; pp. 141–163. [CrossRef]
- Martin, C.D.; Read, R.S.; Chandler, R. Does scale influence in situ stress measurements? Some findings at the Under-ground Research Laboratory. In Proceedings of the International Workshop on Scale Effects in Rock Masses, Rotterdam, The Netherlands, 7 June 1990; pp. 307–315. [Google Scholar]
- Agharazi, A.; Martin, D.; Tannant, D. Numerical analysis of plate-load test results on fractured rocks using an equiv-alent-continuum model: Case study of the Bakhtiary dam site. Int. J. Geomech. 2015, 15, 05014001. [Google Scholar] [CrossRef]
- Zhao, W.; Huang, R.; Yan, M. Mechanical and fracture behavior of rock mass with parallel concentrated joints with different dip angle and number based on PFC simulation. Géoméch. Eng. 2015, 8, 757–767. [Google Scholar] [CrossRef]
- Iran Water & Power Resources Development Company (IWPC). Bazoft Dam and Hydropower Project: In-Situ Plate Loading Test Results Report; IWPC: Tehran, Iran, 2010. [Google Scholar]
- Itasca Consulting. Flac-3D User Manual: Fast Lagrangian Analysis of Continua in 3D; Itasca Consulting Group: Minneapolis, MN, USA, 2002. [Google Scholar]
- Khodabakhshi, A.; Mortazavi, A. Numerical modeling of determination of in situ rock mass deformation modulus using the plate load test. Int. J. Geol. Environ. Eng. 2018, 12, 545–552. [Google Scholar]
- Davis, R.O.; Selvadruai, A.P.S. Elasticity and Geomechanics, 2nd ed.; Cambridge University Press: Cambridge, UK, 2002. [Google Scholar]
Publisher’s Note: MDPI stays neutral with regard to jurisdictional claims in published maps and institutional affiliations. |
© 2021 by the author. Licensee MDPI, Basel, Switzerland. This article is an open access article distributed under the terms and conditions of the Creative Commons Attribution (CC BY) license (http://creativecommons.org/licenses/by/4.0/).