Article

Polylactic Acid/Carbon Nanoparticle Composite Filaments for Sensing

1
Institute for Polymers and Composites, University of Minho, 4804-533 Guimarães, Portugal
2
Leibniz Institute of Polymer Research Dresden (IPF), Hohe Str. 6, 01069 Dresden, Germany
3
Centre for Textile Science and Technology, University of Minho, 4804-533 Guimarães, Portugal
*
Author to whom correspondence should be addressed.
Present Address: College of Material Science and Engineering, Henan University of Technology, Lianhua Str. 100, Zhengzhou 450001, China.
Appl. Sci. 2021, 11(6), 2580; https://doi.org/10.3390/app11062580
Submission received: 21 February 2021 / Revised: 9 March 2021 / Accepted: 12 March 2021 / Published: 15 March 2021
(This article belongs to the Special Issue Advanced Materials for Defense: Designing for Performance)

Abstract

:

Featured Application

Wearable devices.

Abstract

Polylactic acid (PLA) is a bio-based, biodegradable polymer that presents high potential for biomedical and sensing applications. Ongoing works reported in the literature concern mainly applications based on 3D printing, while textile applications are hindered by the limited flexibility of PLA and its composite filaments. In the present work, PLA/multiwall carbon nanotube (MWCNT) composite filaments were produced with enhanced flexibility and electrical conductivity, which may be applied on a textile structure. A biodegradable plasticizer was incorporated in the nanocomposites, aiming at improving MWCNT dispersion and increasing the flexibility of the filaments. Filaments were produced with a range of compositions and their morphology was characterized as well as their thermal, thermomechanical, and electrical properties. Selected compositions were tested for sensing activity using saturated acetone vapor, demonstrating a suitable response and potential for the application in fabrics with sensing capacity.

1. Introduction

Poly(lactic acid) (PLA) is a biocompatible, biodegradable, melt-processable polymer with good mechanical properties, wicking, breathability, and ability for adsorption of organic compounds, which has been extensively researched as a replacement for noncompostable polymers. PLA and PLA composites have been developed for applications in garment, medical textiles, and disposables [1,2]. Other potential application areas include wearable devices, patch sensors for motion [3], 3D-printed lithium-ion batteries [4], flexible pressure sensors [5], functional coatings for textiles [6], and piezoresistive sensors [7]. The brittleness and low mechanical properties of PLA are, however, a limitation for application in wearables, motivating research on plasticization [8] and reinforcement with nanoparticles [9] and seeking enhanced mechanical performance and flexibility.
A plasticizer for PLA should be nontoxic, biocompatible, and should present good miscibility with the polymer, leading to a decrease in the glass transition temperature (Tg) [10]. A major problem concerns the immiscibility and tendency for migration of plasticizers to the surface of PLA with consequent loss. This effect is most important for low molecular weight (MW) plasticizers such as lactide monomer and ester-like plasticizers and thus the preference for higher MW plasticizers. Poly(ethylene) glycol (PEG) and poly(propylene) glycol (PPG) are available in a range of Mw values and are attractive as plasticizers [11]. PPG is a viscous liquid with low Tg (−60 °C to −75 °C) unable to crystallize [12]. Studies of the miscibility of PPG with amorphous PLA were first performed by Kulinski et al. [12], comparing the effect of different concentrations of PPG with MW of 425 g·mol−1 and PPG with MW of 1000 g·mol−1. It was concluded that the ability for plastic deformation of PLA was increased for lower MW PPG, increasing with PPG content, with phase separation occurring only for the incorporation of 12.5 wt.% of PPG with higher MW. Semicrystalline PLA was more effectively plasticized by PPG as compared to PEG with similar MW [13].
Plasticizers can benefit PLA nanocomposites by increasing their processability, aiding the dispersion of fillers, and improving their mechanical properties [14,15,16]. Table 1 shows a summary of three-component PLA composites described in the literature.
Table 1. Polylactic acid (PLA) composite systems with different plasticizers and fillers.
PlasticizerFillerProcessing MethodReference
Tributyl 2-acetylcitrateBi0·5Sb1·5Te3
MWCNT
Melt extrusion[17]
PEG (MW 200 g·mol−1)Reduced graphene oxide Batch mixing [18]
Epoxidized soybean oil MWCNTSolvent casting[14]
PEG
(MW 950–1050 g·mol−1)
Acid treated MWCNTTwo-roll mill[19]
PEG
(MW 200 g·mol−1)
Graphene nanoplatelets Batch mixing
and compression molding
[20]
PEG
(MW 2000 g·mol−1)
SWCNTMelt extrusion
and compression molding
[15]
TriacetinFlax fiberMelt extrusion[21]
Poly(butylene adipate-co-terephthalate) Rami fiberMelt extrusion
and compression molding
[22]
Epoxidized linseed oilHazelnut shell flourMelt extrusion[16]
PEG
(MW 6000 g·mol−1)
CaCO3 Halloysite nanotubes
LAK 301
Micro-sized talc
Melt extrusion[23]
GlycerolBamboo
(different forms)
Batch mixing[24]
PEG
(MW 1500 g·mol−1)
ZnO
Clove essential oil
Solvent cast[25]
Acetyl triethyl citrateMontmorillonite
layered silicate
Melt extrusion[26]
Diglycerine tetraacetate and PEG
(MW 1000 g·mol−1)
Sodium montmorillonite and organoclaysMilling and injection molding[27]
PEG
(MW 6000 g·mol−1)
MontmorilloniteMelt extrusion[28]
PEG
(MW 1000 g·mol−1)
MontmorilloniteBatch mixing
and compression molding
[29]
PEG
(MW 6000 g·mol−1)
OrganoclayMelt extrusion and microinjection molding[30]
PEG
(MW 400 g·mol−1) and Tributyl Citrate
Nanosized CaCO3Melt extrusion[31]
GlycerolHalloysite nanoclaySolvent casting[32]
Methoxy polyethylene glycol SilicaBatch mixing[33]
PLA nanocomposites produced with carbon nanotubes (CNT) showed improved dispersion of CNT upon addition of a plasticizer, enabling the preparation of electrically conductive, flexible multifunctional nanostructured composites with lower Tg compared to PLA, finding applications as shape-memory polymers [14,15].
In the present work, we report the melt extrusion of PLA with multiwall CNT (MWCNT), comparing composites with the neat polymer and PPG as a plasticizer. The influence of PPG on the dispersion of MWCNT in PLA and its plasticizing effect is studied. Electrical conductivity and sensing ability under acetone vapor are studied for composites with different MWCNT content. Filaments were produced with different diameters foreseeing an application in textile wearable devices.

2. Materials and Methods

2.1. MWCNT Dispersion in PPG

MWCNT (NC 7000, Nanocyl, Sambreville, Belgium) were dispersed in ethanol (EtOH) in an ultrasonic bath for 5 min. The dispersion was added to diluted PPG (MW 425 g·mol−1, Sigma-Aldrich, Sintra, Portugal) in EtOH (1:20 v/v) and stirred for 1 h 30 min with a homogenizer IKA® ULTRA-TURRAX® T 18, with a dispersing element S 18 N 10 G (IKA®-Werke GmbH & Co. KG, Staufen, Germany). The resulting suspensions were then used to coat the PLA pellets.

2.2. Coating of PLA Pellets

Semicrystalline PLA pellets (Luminy® L175, Total Corbion PLA, 4203 NS Gorinchem, The Netherlands) were coated with MWCNT dispersions in PPG by stirring with a common kitchen mixer until EtOH evaporation. Coated pellets were further dried for 2 h at 60 °C and then for 8 h at 100 °C prior to melt extrusion.

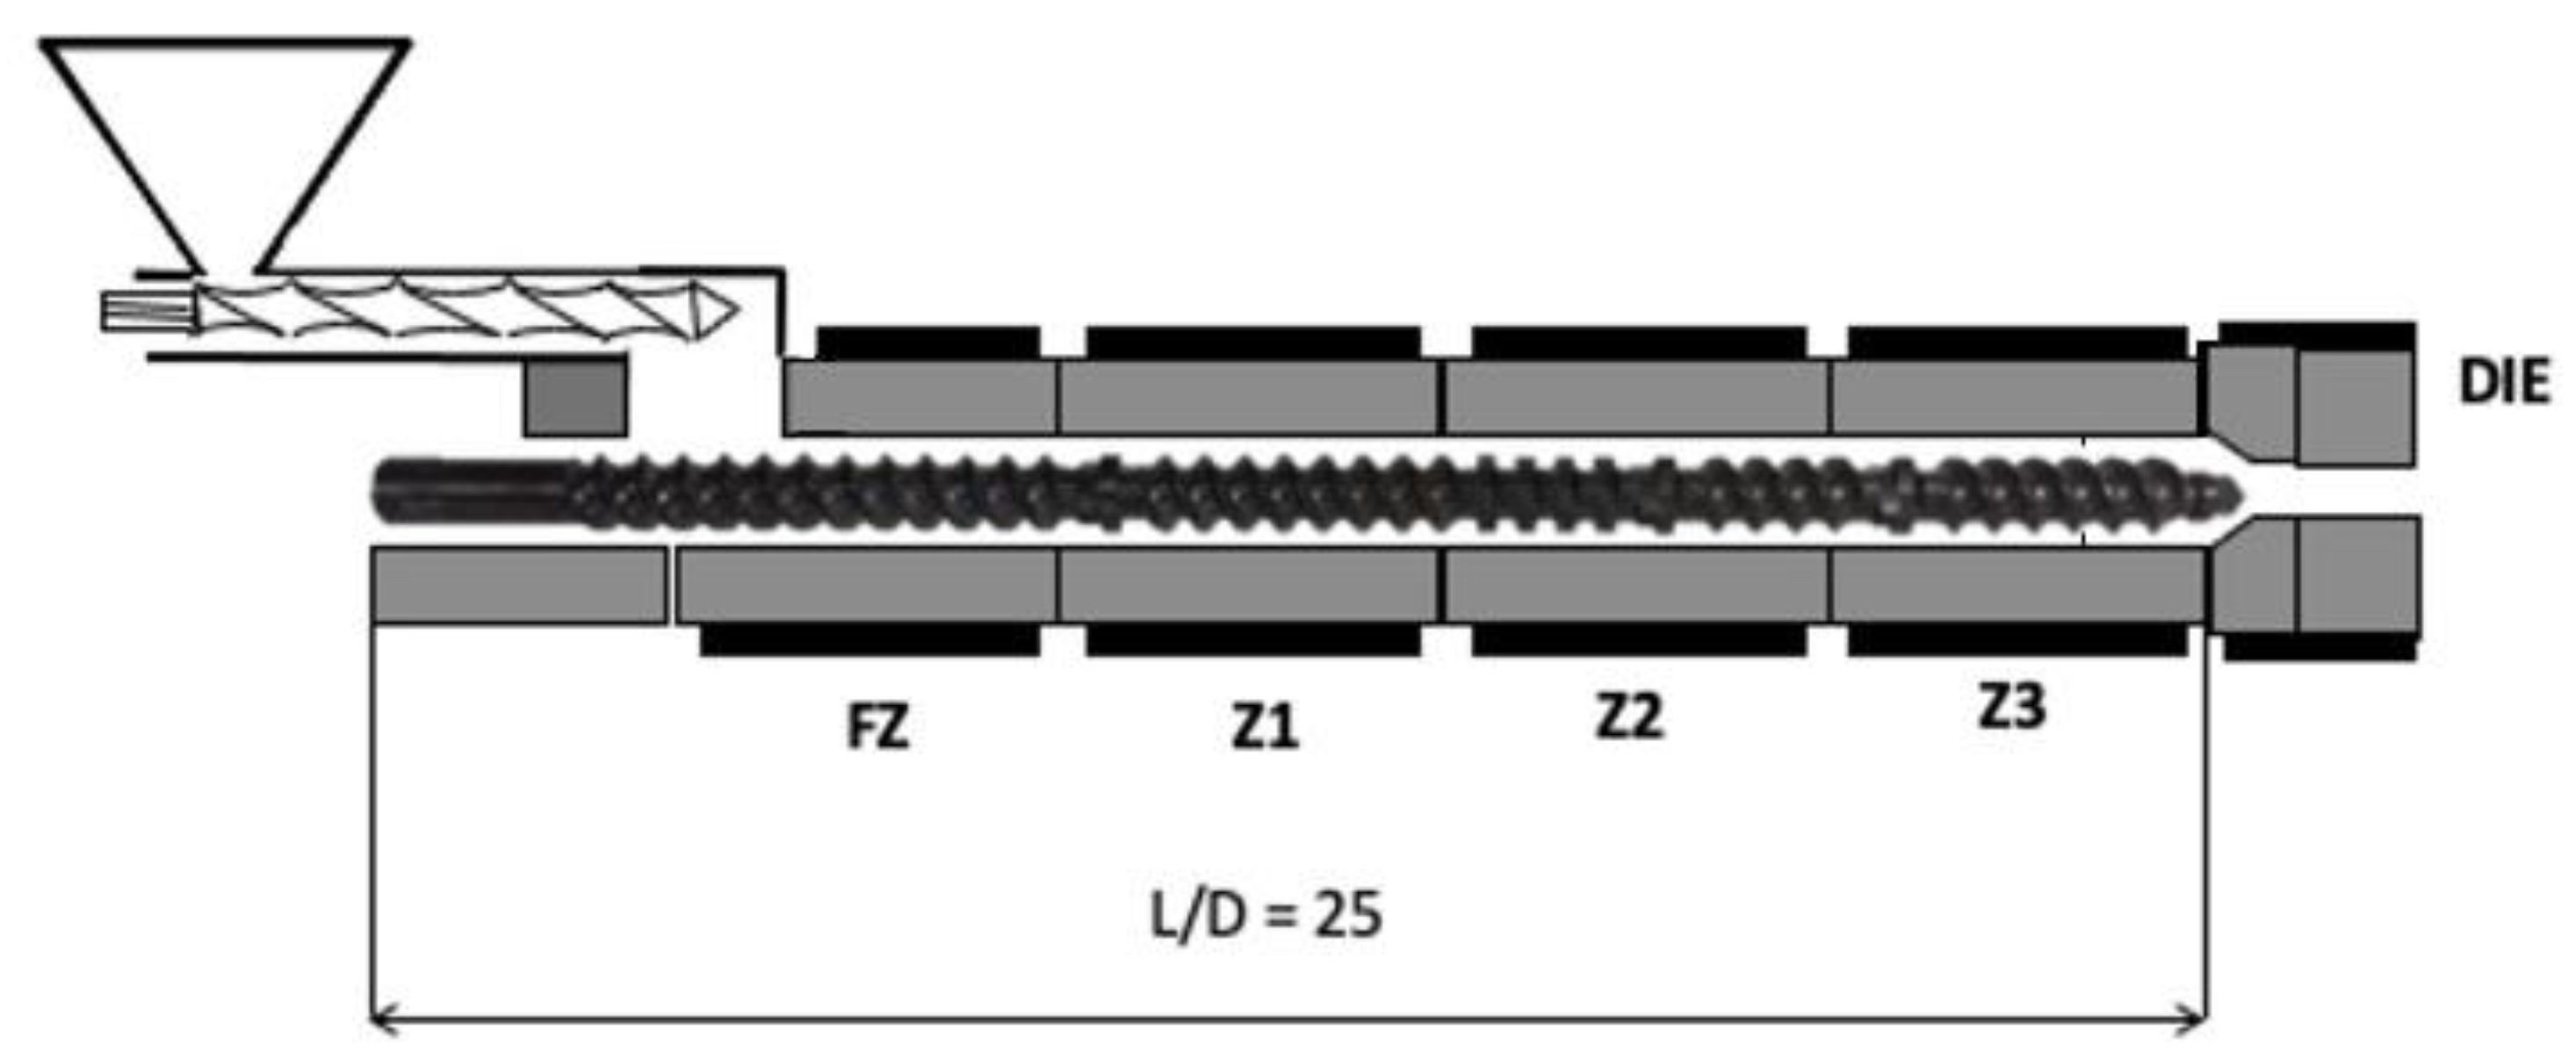
2.3. Melt Extrusion of PLA/MWCNT/PPG Composites

Melt compounding of PLA nanocomposites was carried out in a co-rotating intermeshing twin-screw extruder (Rondol Microlab, France) with 10 mm diameter screws composed of three mixing sections (Figure 1) and a length-to-diameter ratio (L/D) of 25. A temperature profile was defined for the feeding zone (FZ), the three different zones in the barrel (Z1, Z2, and Z3) and die, as follows: 120 °C/160 °C/175 °C/180 °C/175 °C. A volumetric feeder (Piovan MDP1, Italy) supplied coated and noncoated PLA pellets at FZ. For composites without prior coating with PPG and MWCNT, MWCNTs were added manually at FZ. The pellets were dried for 2 h at 60 °C and then for 8 h at 100 °C before processing. The extruded rod presented a diameter of approximately 1.5 mm after the die exit. A filament puller with controlled speed was used to collect the extruded filament and set the diameter at approximately 0.5 mm. Filaments were collected with larger diameter (collected directly from the die exit) and with smaller diameter (collected with diameter control).
The compositions prepared are listed in Table 2.

2.4. Characterization of PLA Composite Filaments

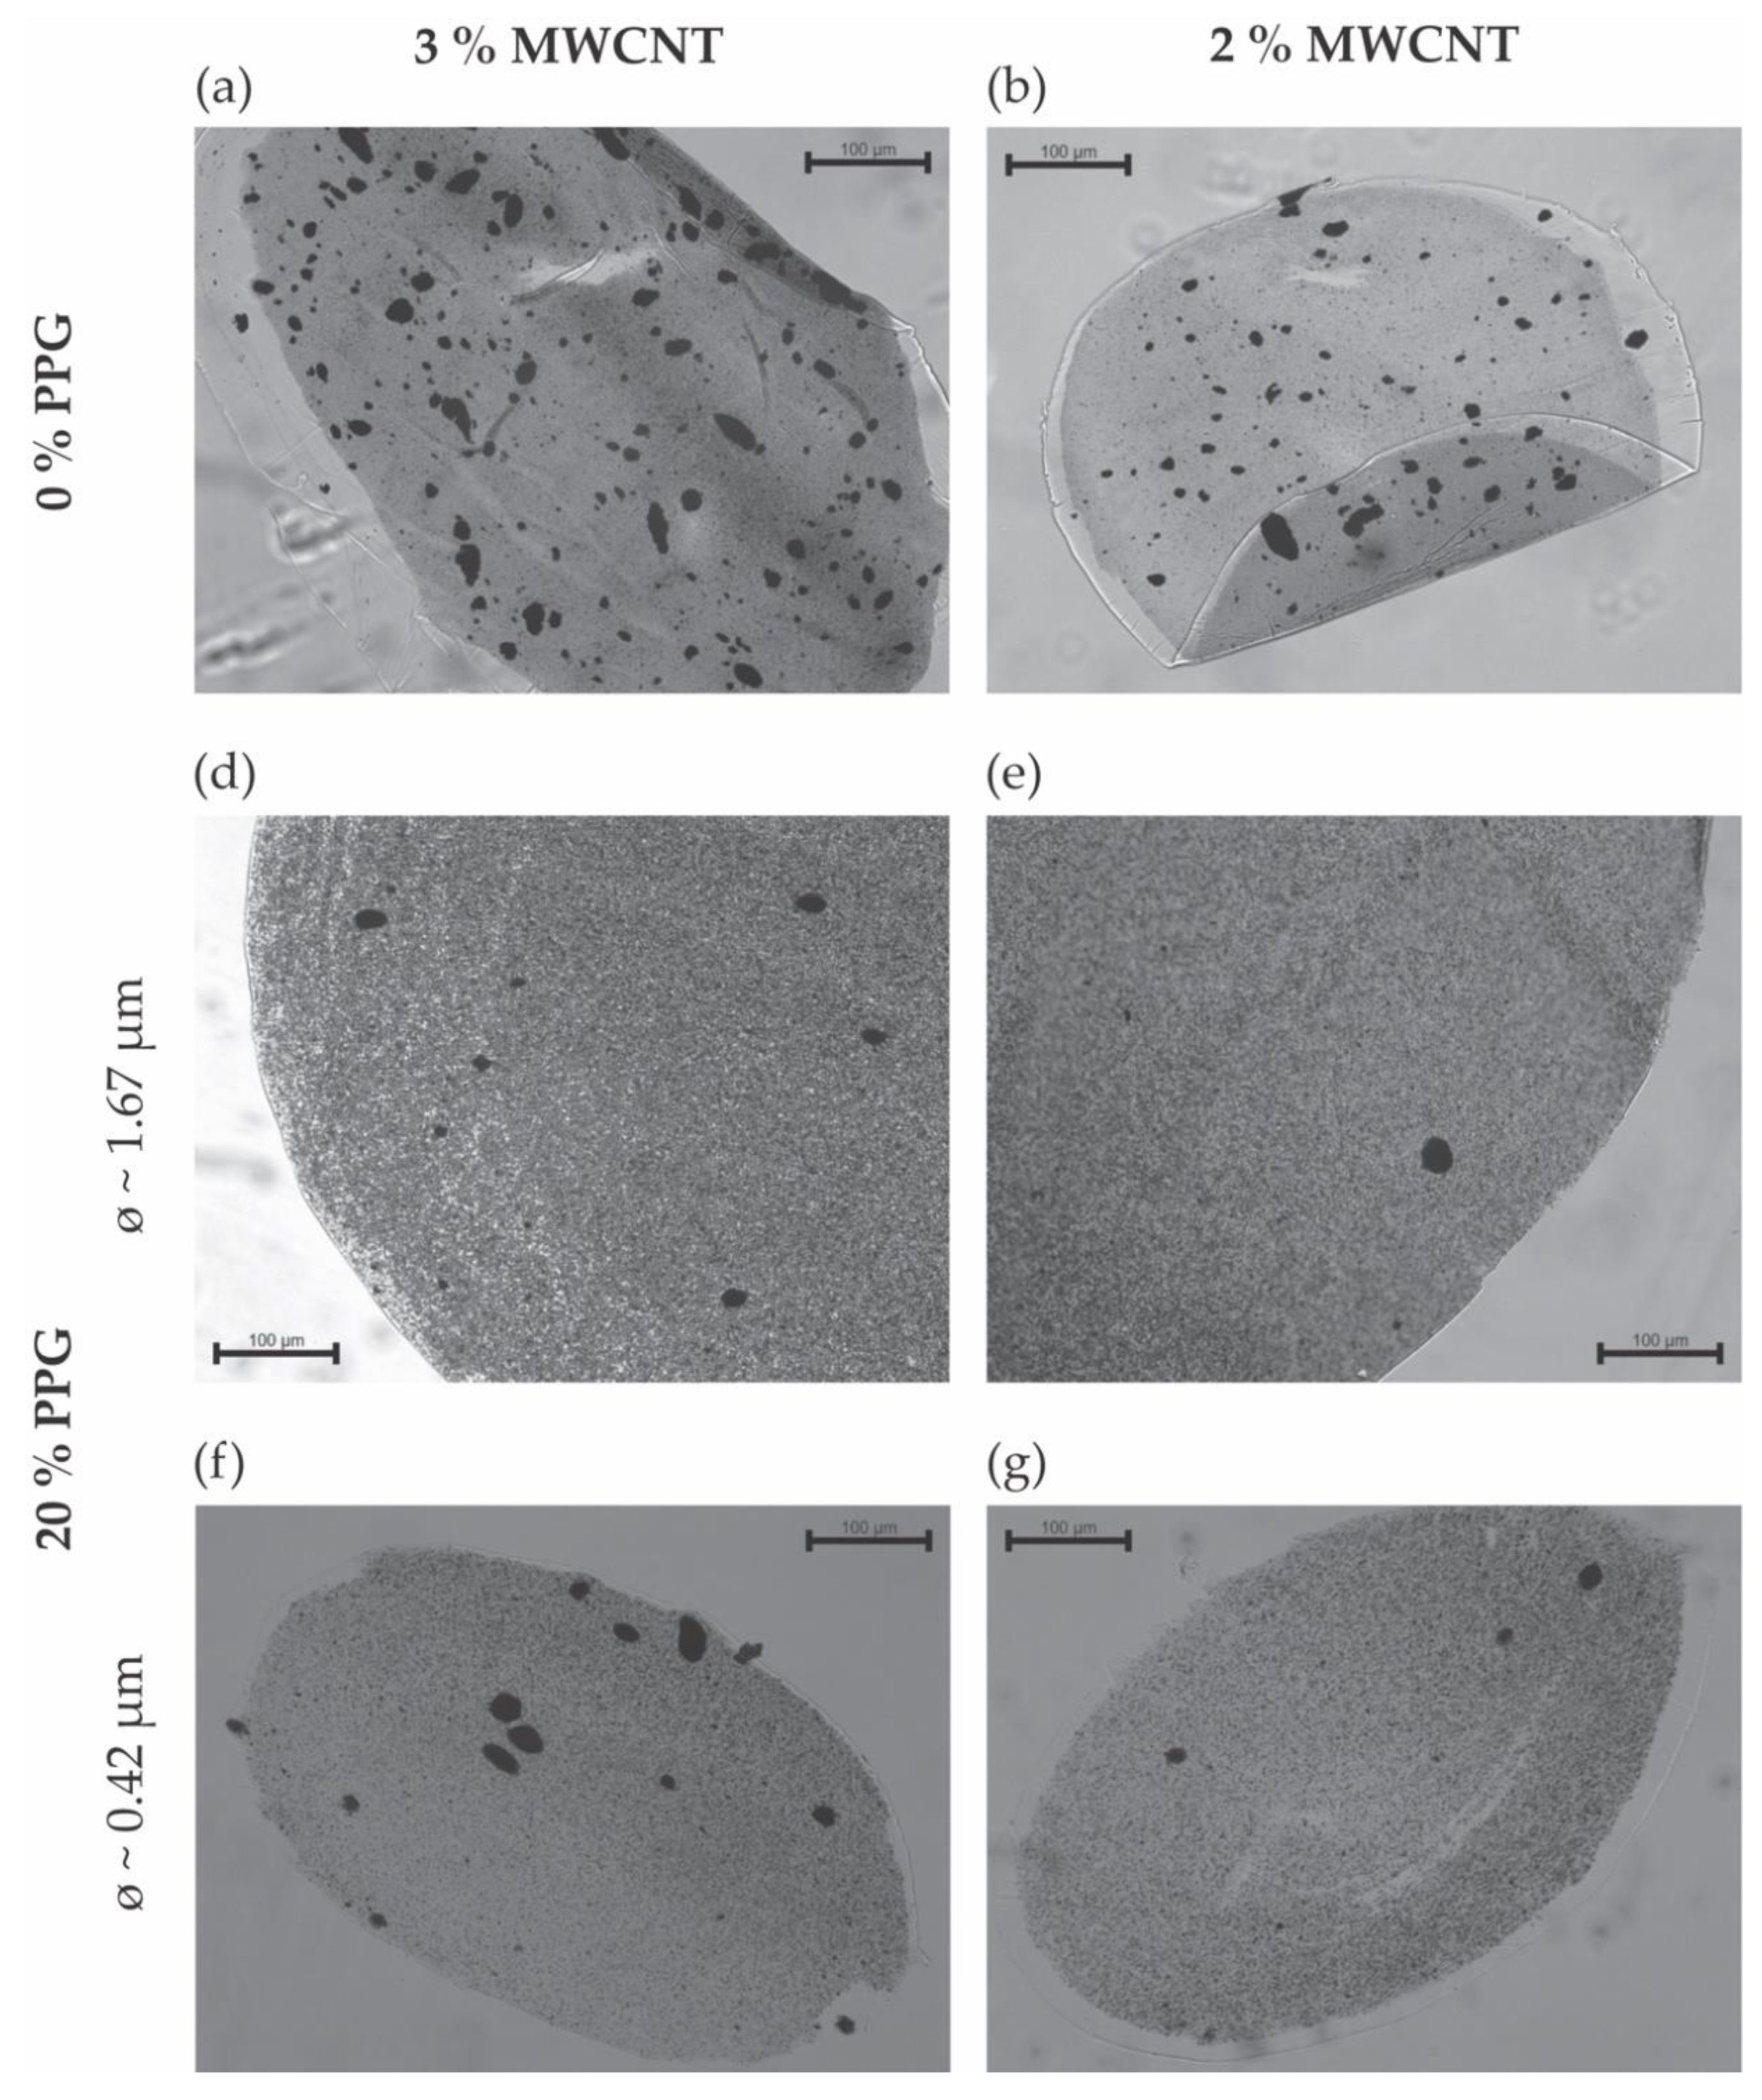
2.4.1. Optical Microscopy

Optical microscopy (OM) images were obtained with a Leica DM2500 PLA microscope equipped with a digital camera Leica DMC2900. Transversal sections of 1.5–2 µm thickness were cut with an ultramicrotome (Leica UC6). LAS X software was used to record the images and ImageJ software to analyze total and particle areas. Contrast differences were employed and the agglomerate areas larger than 5 µm2 were measured. The analysis was performed on micrographs collected from at least three different sections per composite.

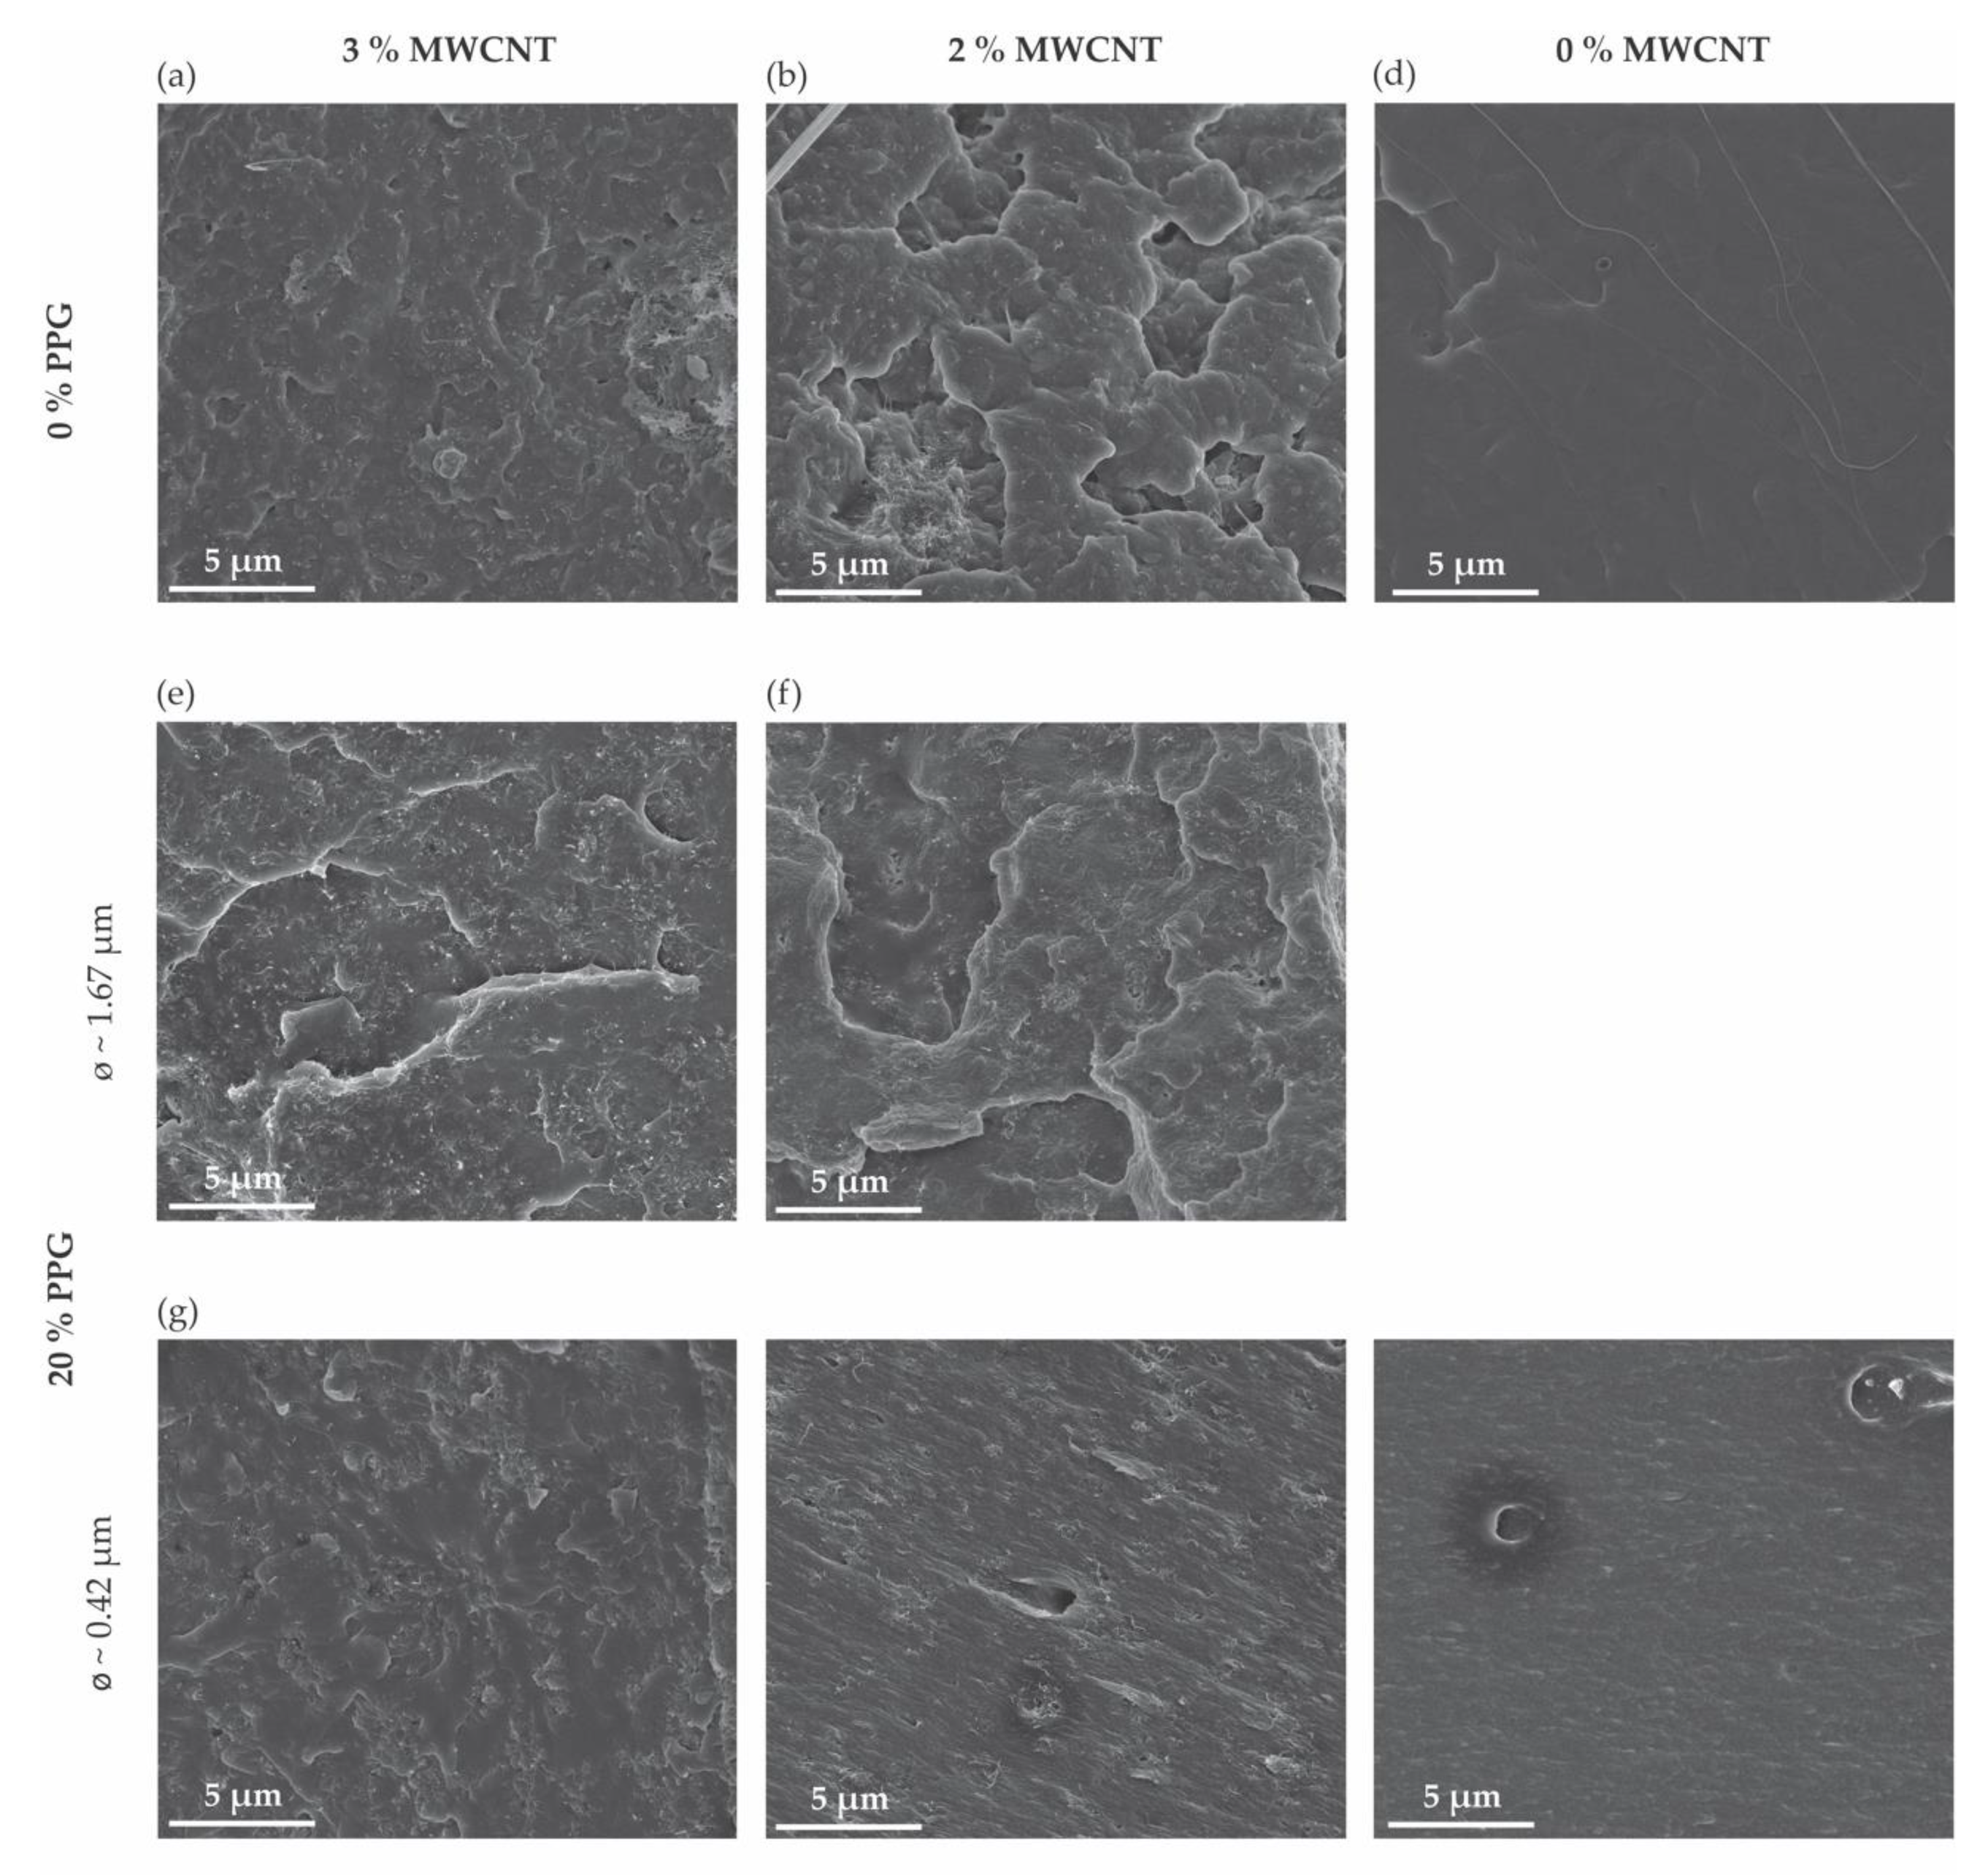
2.4.2. Scanning Electron Microscopy

Scanning electron microscopy (SEM) images were obtained with a Nano SEM–FEI Nova 200 (FEG/SEM) (FEI Europe Company, Hillsboro, OR, USA) at high vacuum (resolution of 1.0 nm at 15 kV). Samples were cryofractured in liquid nitrogen, and the resulting surfaces were coated with Au/Pd to observe the transversal section of filaments. The images were obtained in secondary electron mode.

2.4.3. Thermogravimetric Analysis

Thermogravimetric analysis (TGA) measurements were performed on a TGA Q500 from T.A. Instruments® (New Castle, DE, USA) (weighting precision of +/− 0.01%, 0.1 µg sensitivity) at a heating rate of 50 °C·min−1 from 40 °C to 500 °C followed by 10 °C·min−1 from 500 °C to 700 °C, under N2 atmosphere in a platinum crucible.

2.4.4. Differential Scanning Calorimetry

An ultra-microbalance PERKIN-ELMER AD-4 Autobalance was used to weigh the samples in Al crucibles (Ø 6 mm, Netzsch-Gerätebau GmbH, Selb, Germany).
Differential scanning calorimetry (DSC) scans were performed in a Netzsch DSC 200 F3 Maia® (Netzsch-Gerätebau GmbH, Selb, Germany), equipped with a cooling system Netzsch Intracooler 40 (Netzsch-Gerätebau GmbH, Selb, Germany) at a heating rate of 10 °C·min−1, from −10 °C to 190 °C, under nitrogen atmosphere. An error of 0.5 °C is associated with all temperature measurements. Peak areas and relevant transition temperatures were determined with Netzsch Proteus® software.

2.4.5. Raman Spectroscopy

Raman spectra were obtained using a HORIBA LabRAM HR Evolution confocal Raman microscope spectrometer (Horiba Scientific, Piscataway, NJ, USA) using Horiba Scientific’s Labspec 6 Spectroscopy Suite Software for instrument control, data acquisition, and processing. The Raman spectrometer was equipped with a 532 nm laser, a Syncerity CCD Camera detector (Horiba) and a microscope equipped with a 10× and 100× magnification objectives. A grating of 600 gr·mm−1 was used. For each composite, three spectra were collected from distinct zones of the filament and averaged, and peak positions were determined by applying a baseline (in LabSpec 6) and fitting with a Lorentzian function (in OriginPro 2016).

2.4.6. Dynamic Mechanical Analysis

Dynamic mechanical analysis (DMA) was carried out in a TT DMA (Triton Technology, Grantham, UK) equipped with a 1L Dewar and a TTDMA AutoCryo Type 2 for cooling with liquid nitrogen. The analysis was performed in tension mode with a 10 mm gauge length. The measurements were carried out at a frequency of 1 Hz with a displacement amplitude of 0.001 mm, from −50 °C to 120 °C at a heating rate of 2 °C·min−1. Storage and loss moduli (E′ and E″, respectively) reported at 0 °C were obtained by computing a linear fit in the temperature range from −40 C to 10 °C.

2.4.7. Resistivity Measurements

Electrical resistivity measurements were carried out on a Keithley SMU 2635B SourceMeter® (Keithley Instruments Inc., Cleveland, OH, USA). Intensity/voltage (I/V) curves were acquired under direct current (DC) on a source range of 20 V (from −10 V to 10 V with 0.5 V steps) at room temperature. A linear fit was applied, in Microsoft Excel, to calculate the resistance (R) as the inverse of the I/V curve slope. Bulk conductivity (σDC) was calculated according to Equation (1), where L is the length of the conductive path (distance between electrodes) and A is the sample cross-section area.
σ DC   =     L A   × R

2.4.8. Vapor Sensing Measurements

The vapor sensing ability of the composite filaments was investigated by in situ monitoring of their electrical resistance response upon alternating exposure to acetone vapor and dry air for four successive cycles. The exposure time to organic vapor and the drying time in dry air were 100 s and 150 s, respectively. Prior to the exposure to the saturated acetone vapor, the filaments were set in the measuring chamber under dry-air flow for 50 s to reach a stable initial resistance (Ri). The filaments for the vapor sensing test were coated with silver ink at the end sides to ensure good contact between the specimen and the electrodes. All samples were tested at 25 °C. The set-up of the sensing device is a self-made equipment described in previous works [34]. The sample resistance R was measured using a Keithley 2001 digital multimeter (Keithley Instruments Inc., Cleveland, OH, USA), and the experimental results are presented as relative resistance (Rrel). Rrel is the ratio of the resistance variation (ΔR = R − Ri) to the initial resistance. A bubbler evaporation system was used to deliver the desired organic vapor to the detection chamber using dry air as carrier. In the drying run, pure dry air was passed through the chamber. The total gas flow rate was set to 30 L·h−1 using a mass flow controller.

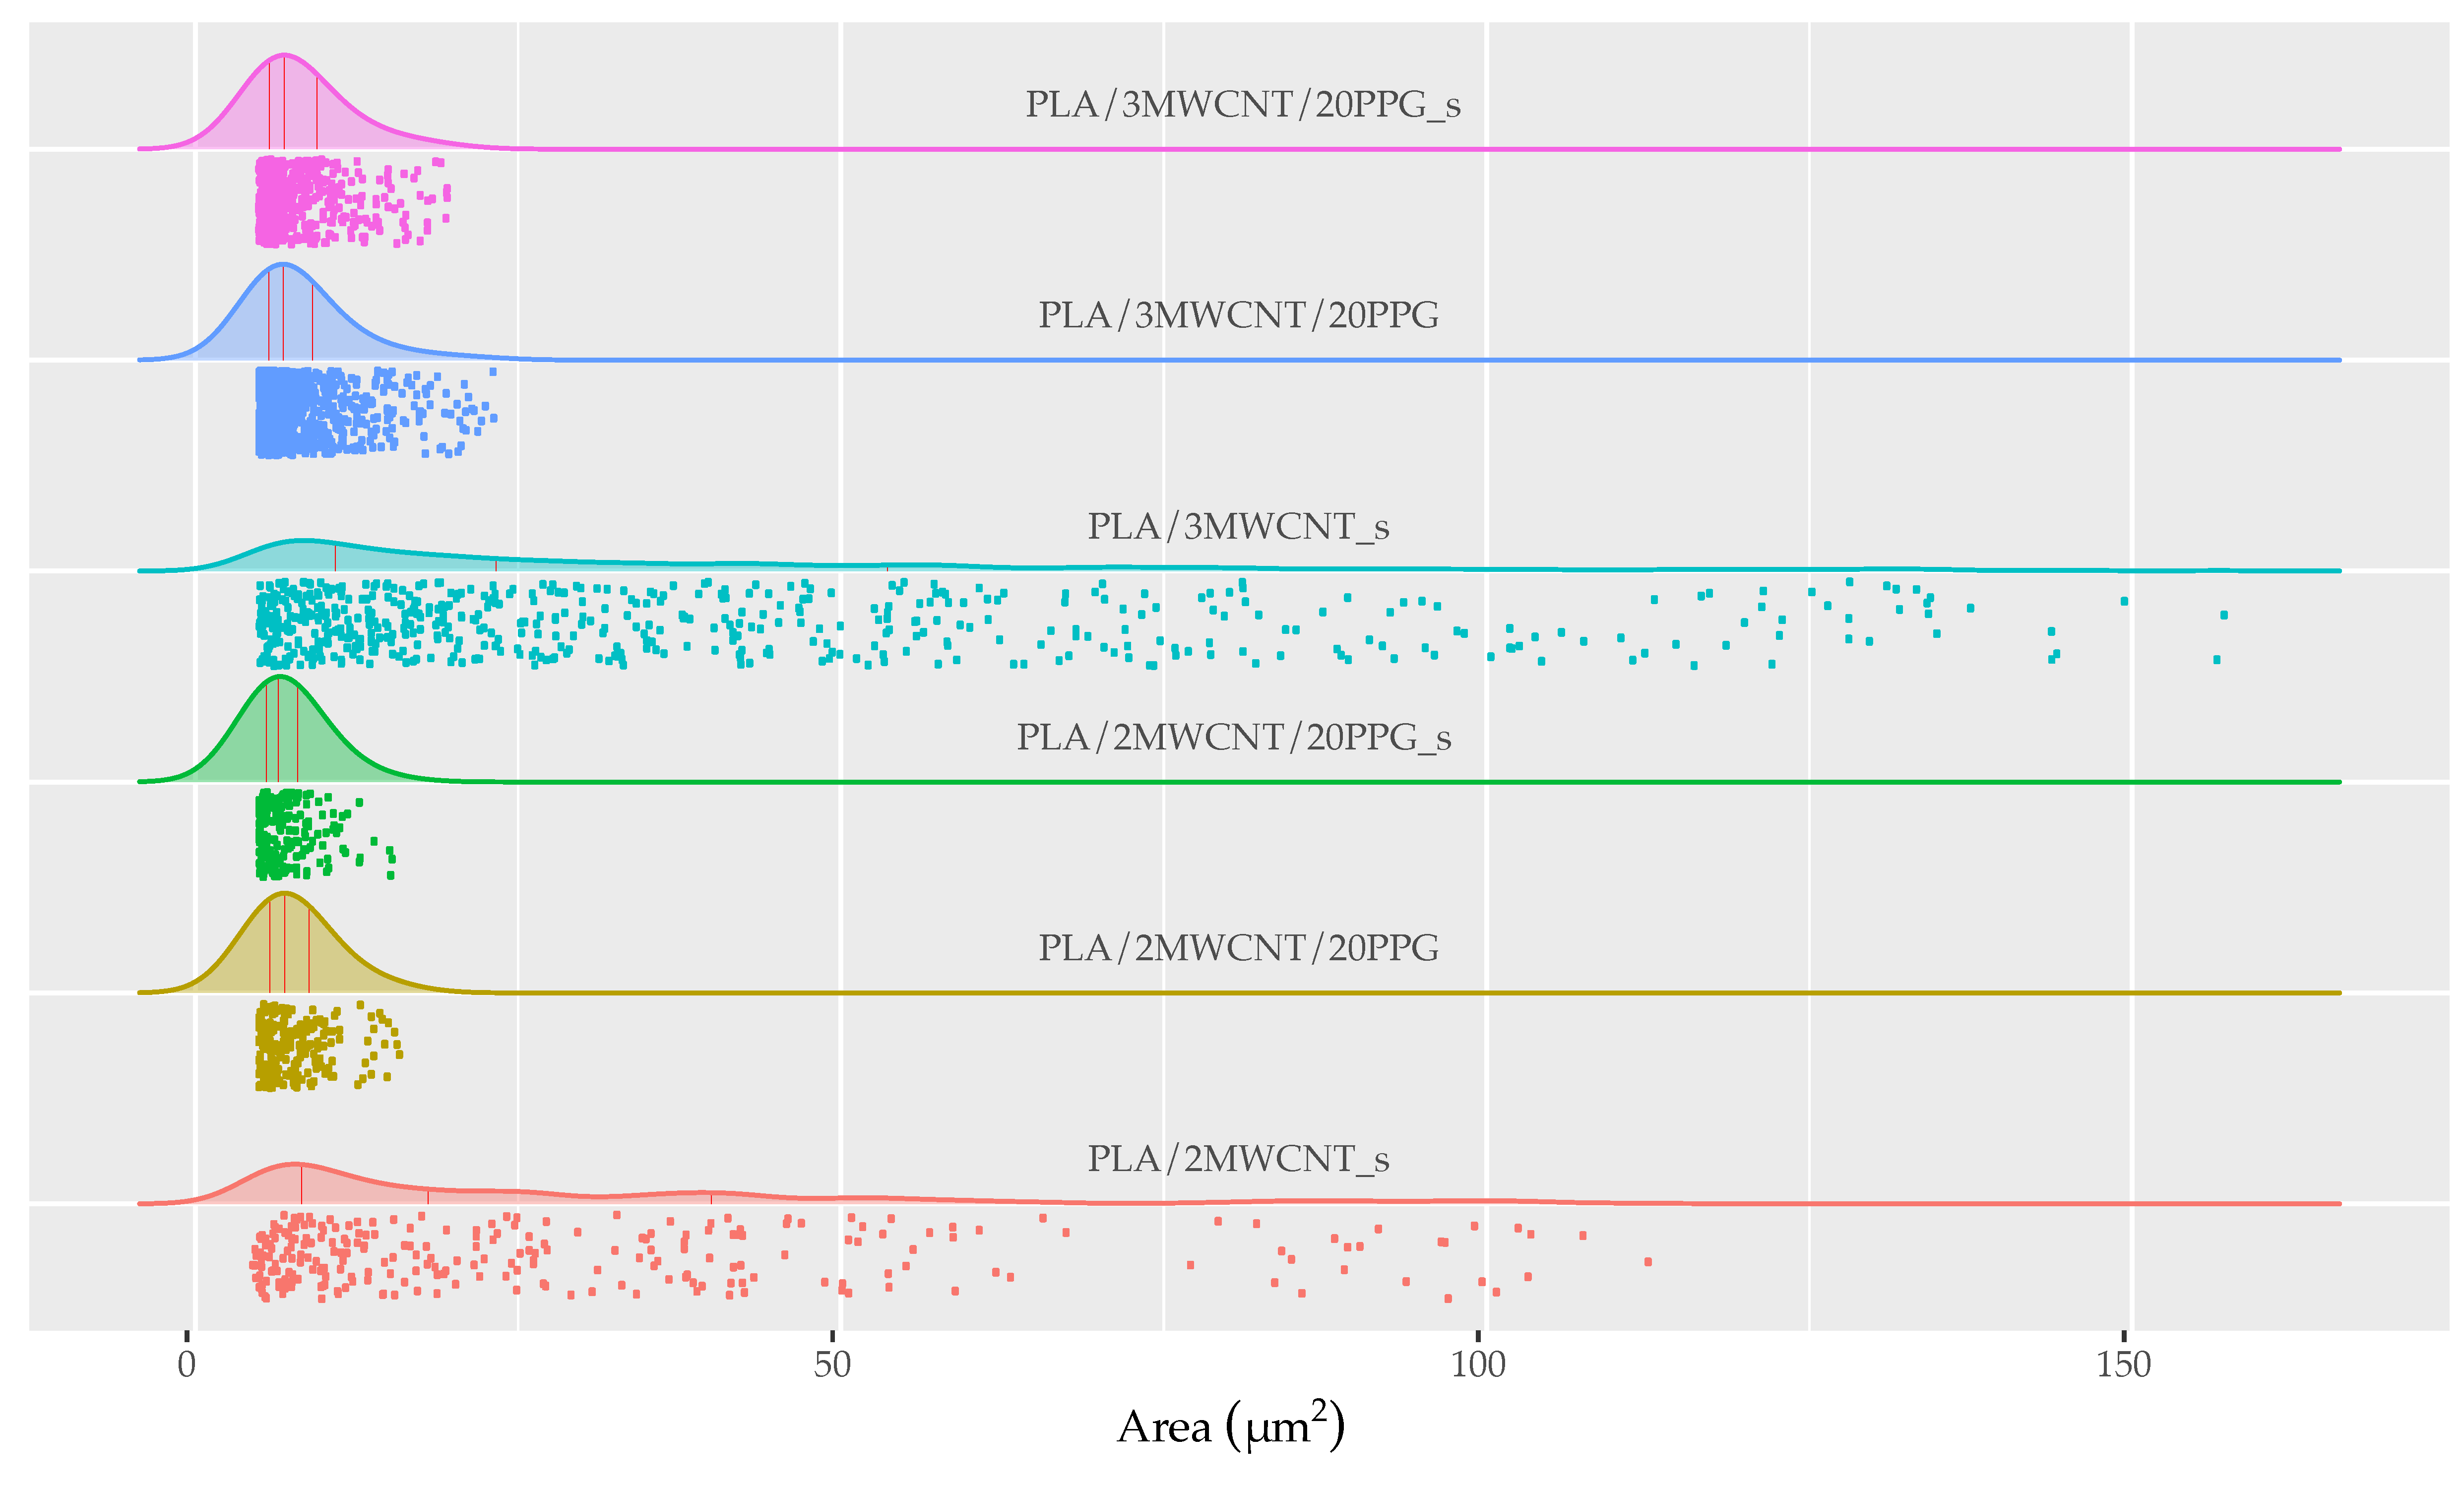
2.5. Statistical Analysis and Data Visualization

Statistics and data visualization were performed in RStudio (1.3.959); dplyr [35], tidyverse [36], and plyr [37] packages were used to treat data, and plots were created with ggplot2 [38], cowplot [39], and ggridges [40] packages.

3. Results

3.1. Morphology of Melt-Extruded Filaments

OM images of the composite filament cross sections with different loads of MWCNT, with and without PPG, are displayed in Figure 2. OM analysis provides a 2D description of the MWCNT fraction that did not disperse in the polymer during melt mixing, remaining as agglomerates. The micrographs show that filaments with 3 wt.% MWCNT present a larger number of agglomerates compared to 2 wt.% MWCNT. They also illustrate the effect of the predispersion of MWCNT in PPG, resulting in improved dispersion of MWCNT with consequent decrease in the number of agglomerates present as well as formation of smaller agglomerates.
Statistical analysis confirms that melt-extruded filaments of neat PLA and MWCNT present agglomerates with larger area (Table 3) with medians ranging from 18 to 23 µm2. Nanocomposites incorporating PPG present agglomerates with smaller median areas, within a narrow range from 6 to 7 µm2. OM images depict prominent agglomerates of MWCNT for composites without PPG and smaller MWCNT agglomerates for composites prepared with PPG.
Density plots (Figure 3) and the cumulative distribution (Figure S1) of agglomerate areas show that composites with PPG present smaller agglomerates with a narrower area range (75% of agglomerates < 10 µm2, Table 3), whereas composites without PPG present a wider dispersion in agglomerate areas. A Kruskal–Wallis statistic for alpha = 5% shows that both the addition of PPG (for H(1) = 5.39, p-value = 0.02) and MWCNT concentration (for H(1) = 7.79, p-value = 0.005) have a significant effect in the agglomerate area ratio. It may be concluded that (i) the agglomerate area ratio is significantly lower for composites containing PPG and that (ii) increasing MWCNT concentration increases the agglomerates area ratio. The latter conclusion is expected and reported in Table 3. Comparison of filaments with similar composition shows that the composites without PPG display the highest agglomerate area ratio values, with a larger area covered by MWCNT agglomerates.
SEM images of the cross sections of melt-extruded composite filaments (Figure 4) depict a homogenous matrix, indicating good miscibility of PPG in PLA at the prepared compositions. The dispersed fraction of MWCNT is well distributed across the composite.

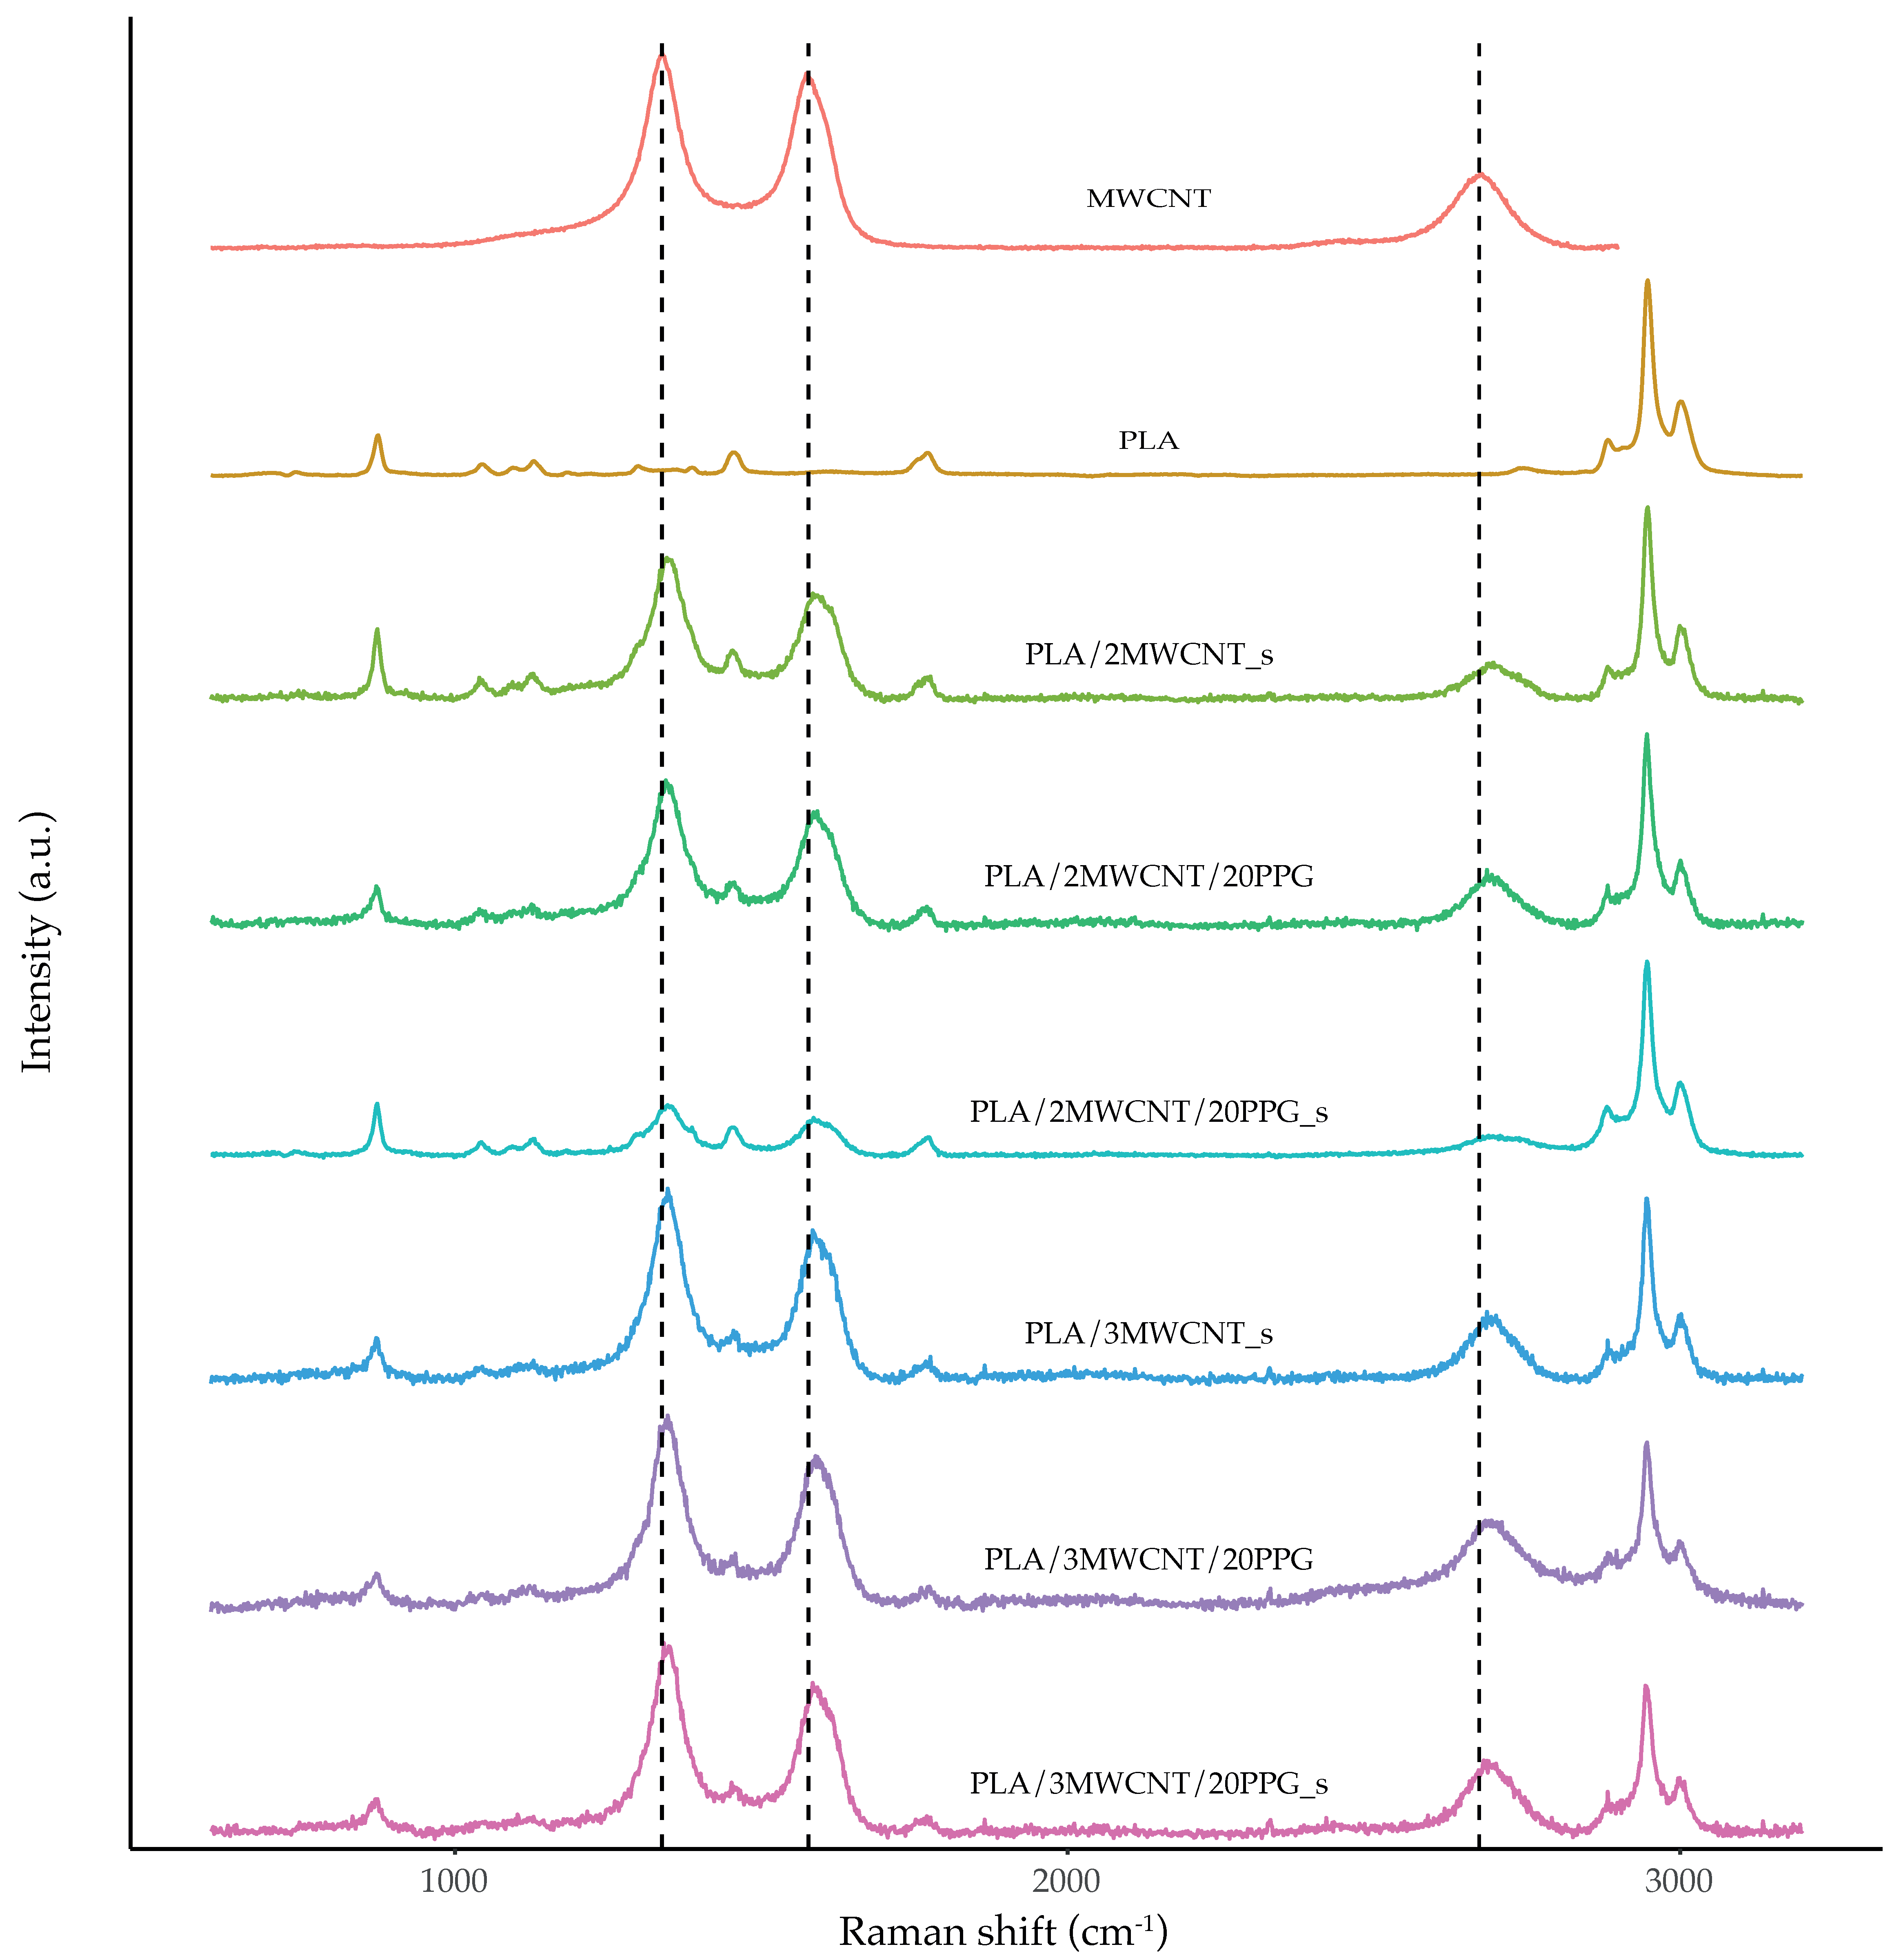
3.2. Raman Spectroscopy

Raman spectra of neat-PLA were recorded and averaged, and the spectrum is presented in the supplementary materials (Figure S2) with highlighted bands corresponding to the vibrational modes of each bond. Bands of the vibrational modes of C = O, C–O–C, and C–H bonds are common to the Raman spectra of all composites. The asymmetrical stretch of CH3 bond, with a Raman shift ~ 1450 cm−1, is observed between the D and G bands of MWCNT (~ 1338 cm−1 and ~ 1577 cm−1, respectively) as presented in Figure 5. The slight upshift of D, G, and 2D (~ 2672 cm−1) bands for the composites relative to the MWCNT in powder form (Figure 5) may be attributed to the dispersion and disentanglement of MWCNT and a slight compression effect of the surrounding polymer [41,42].

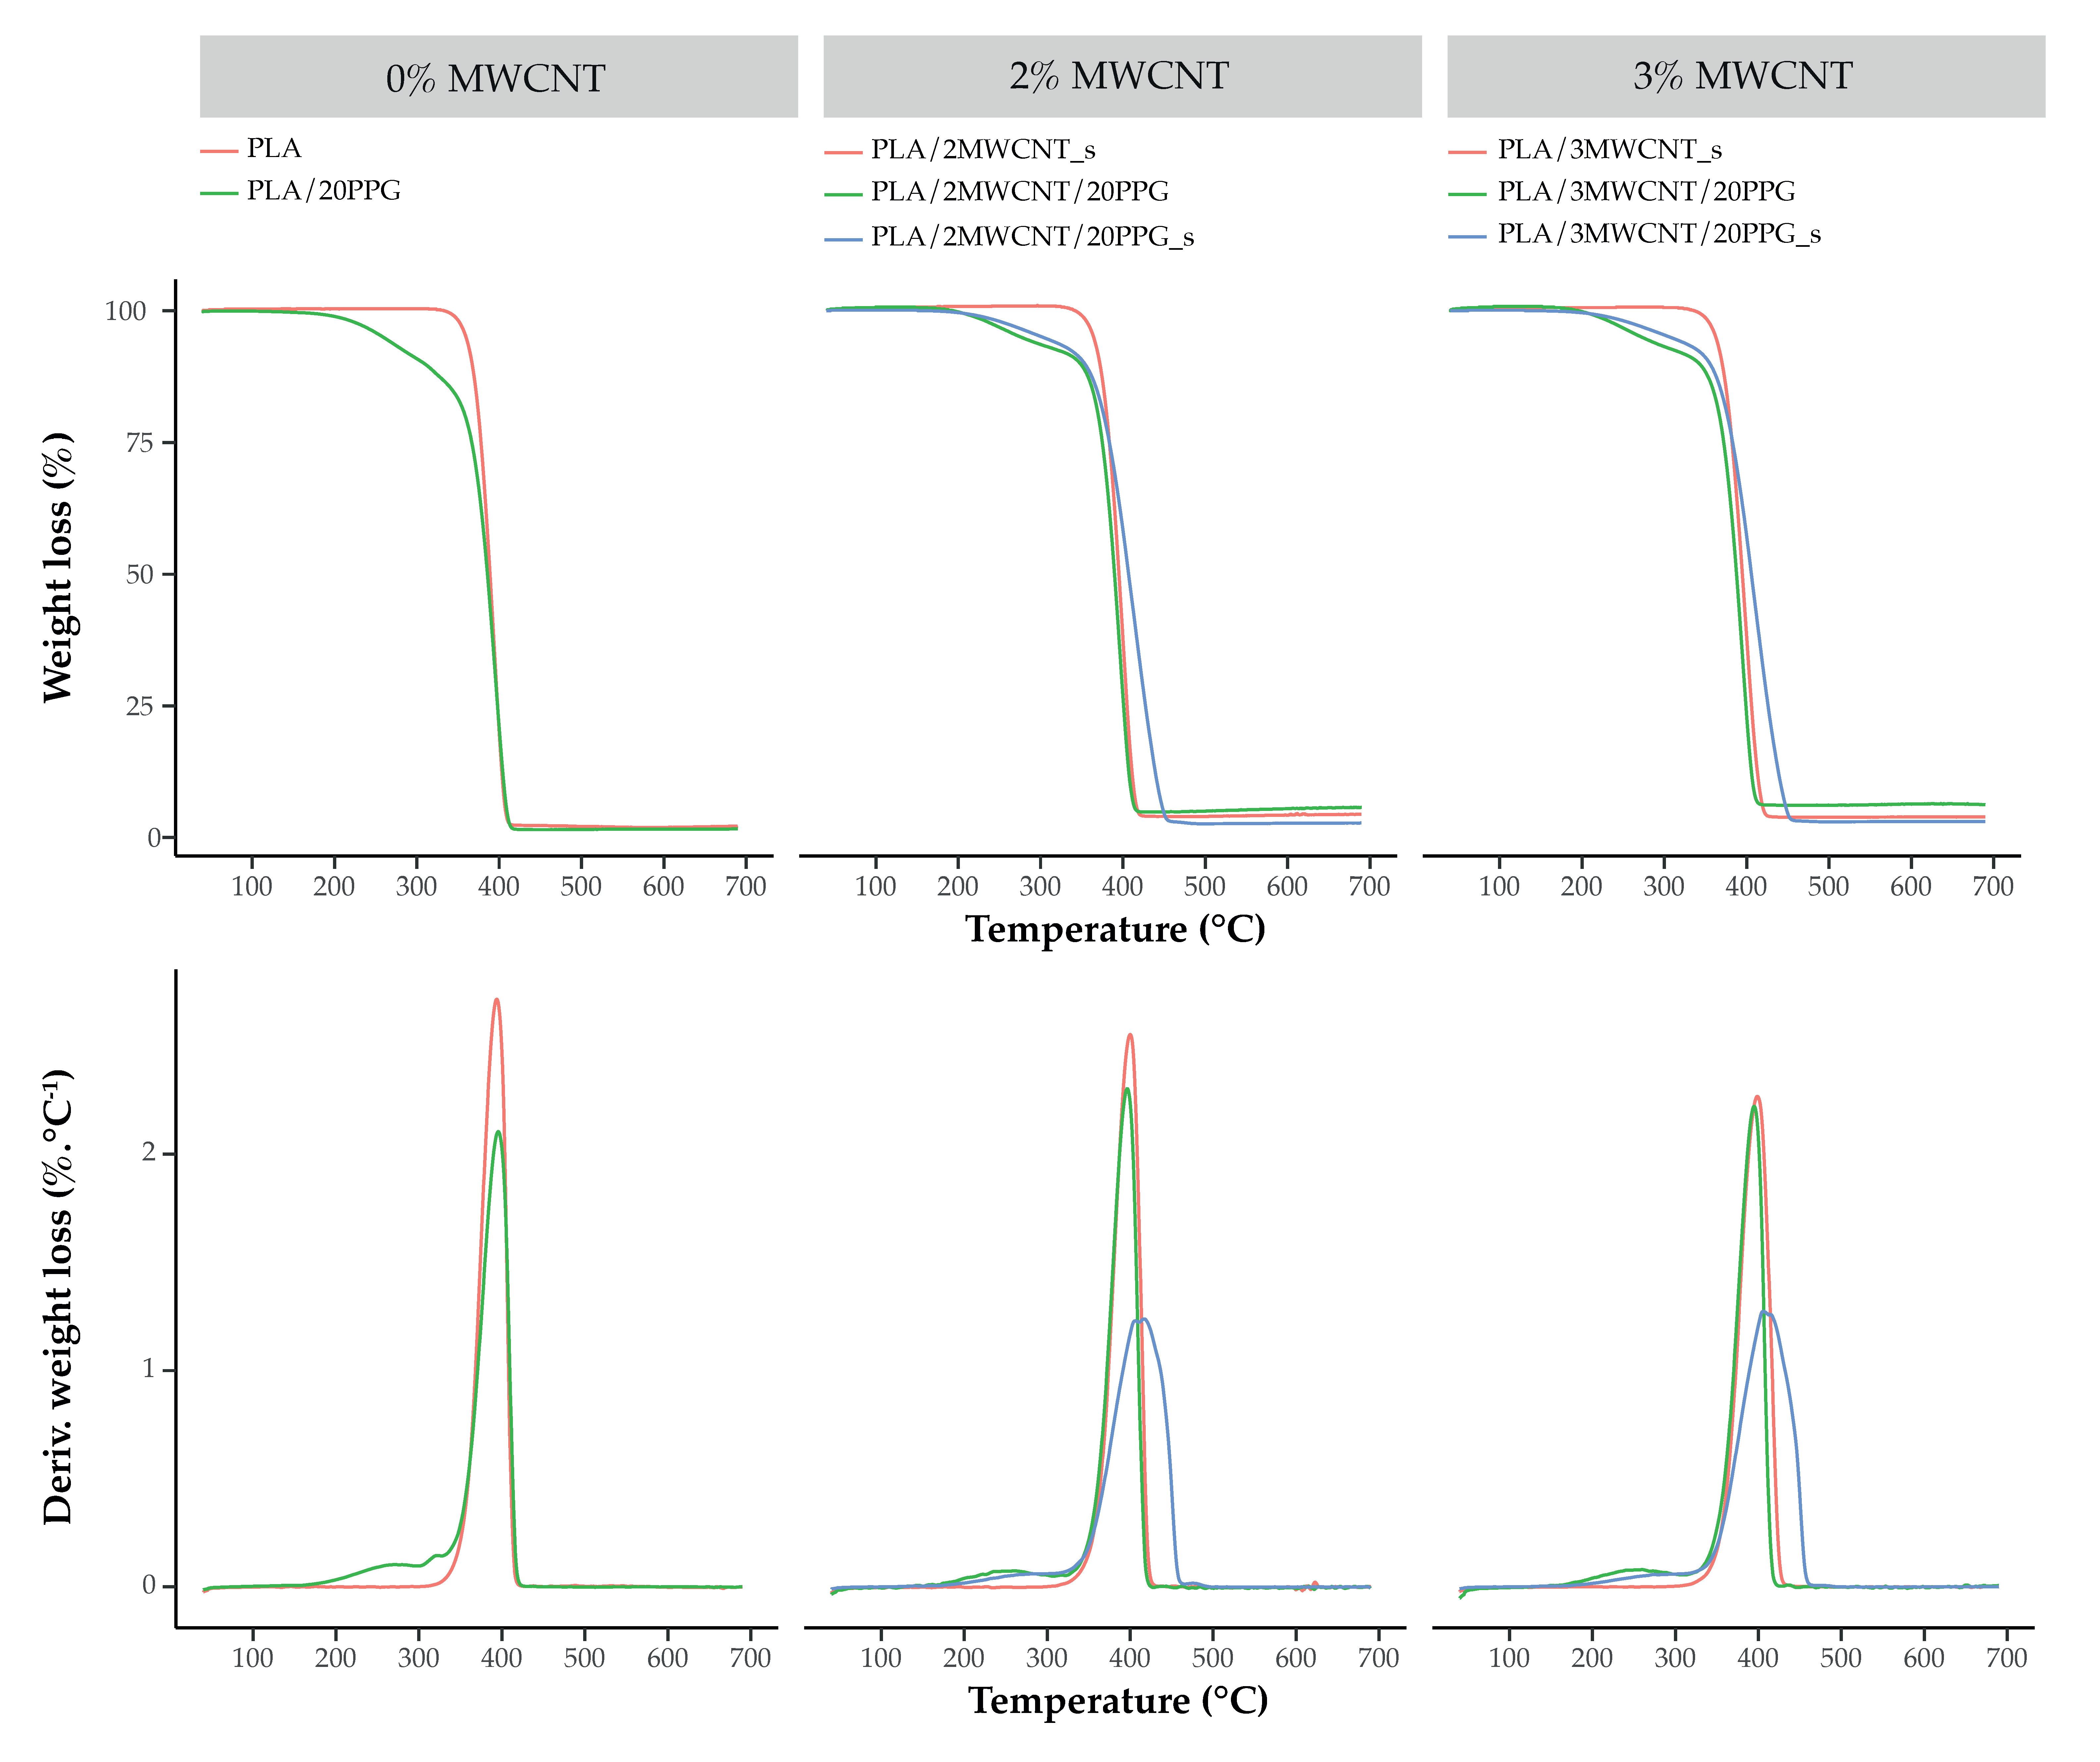
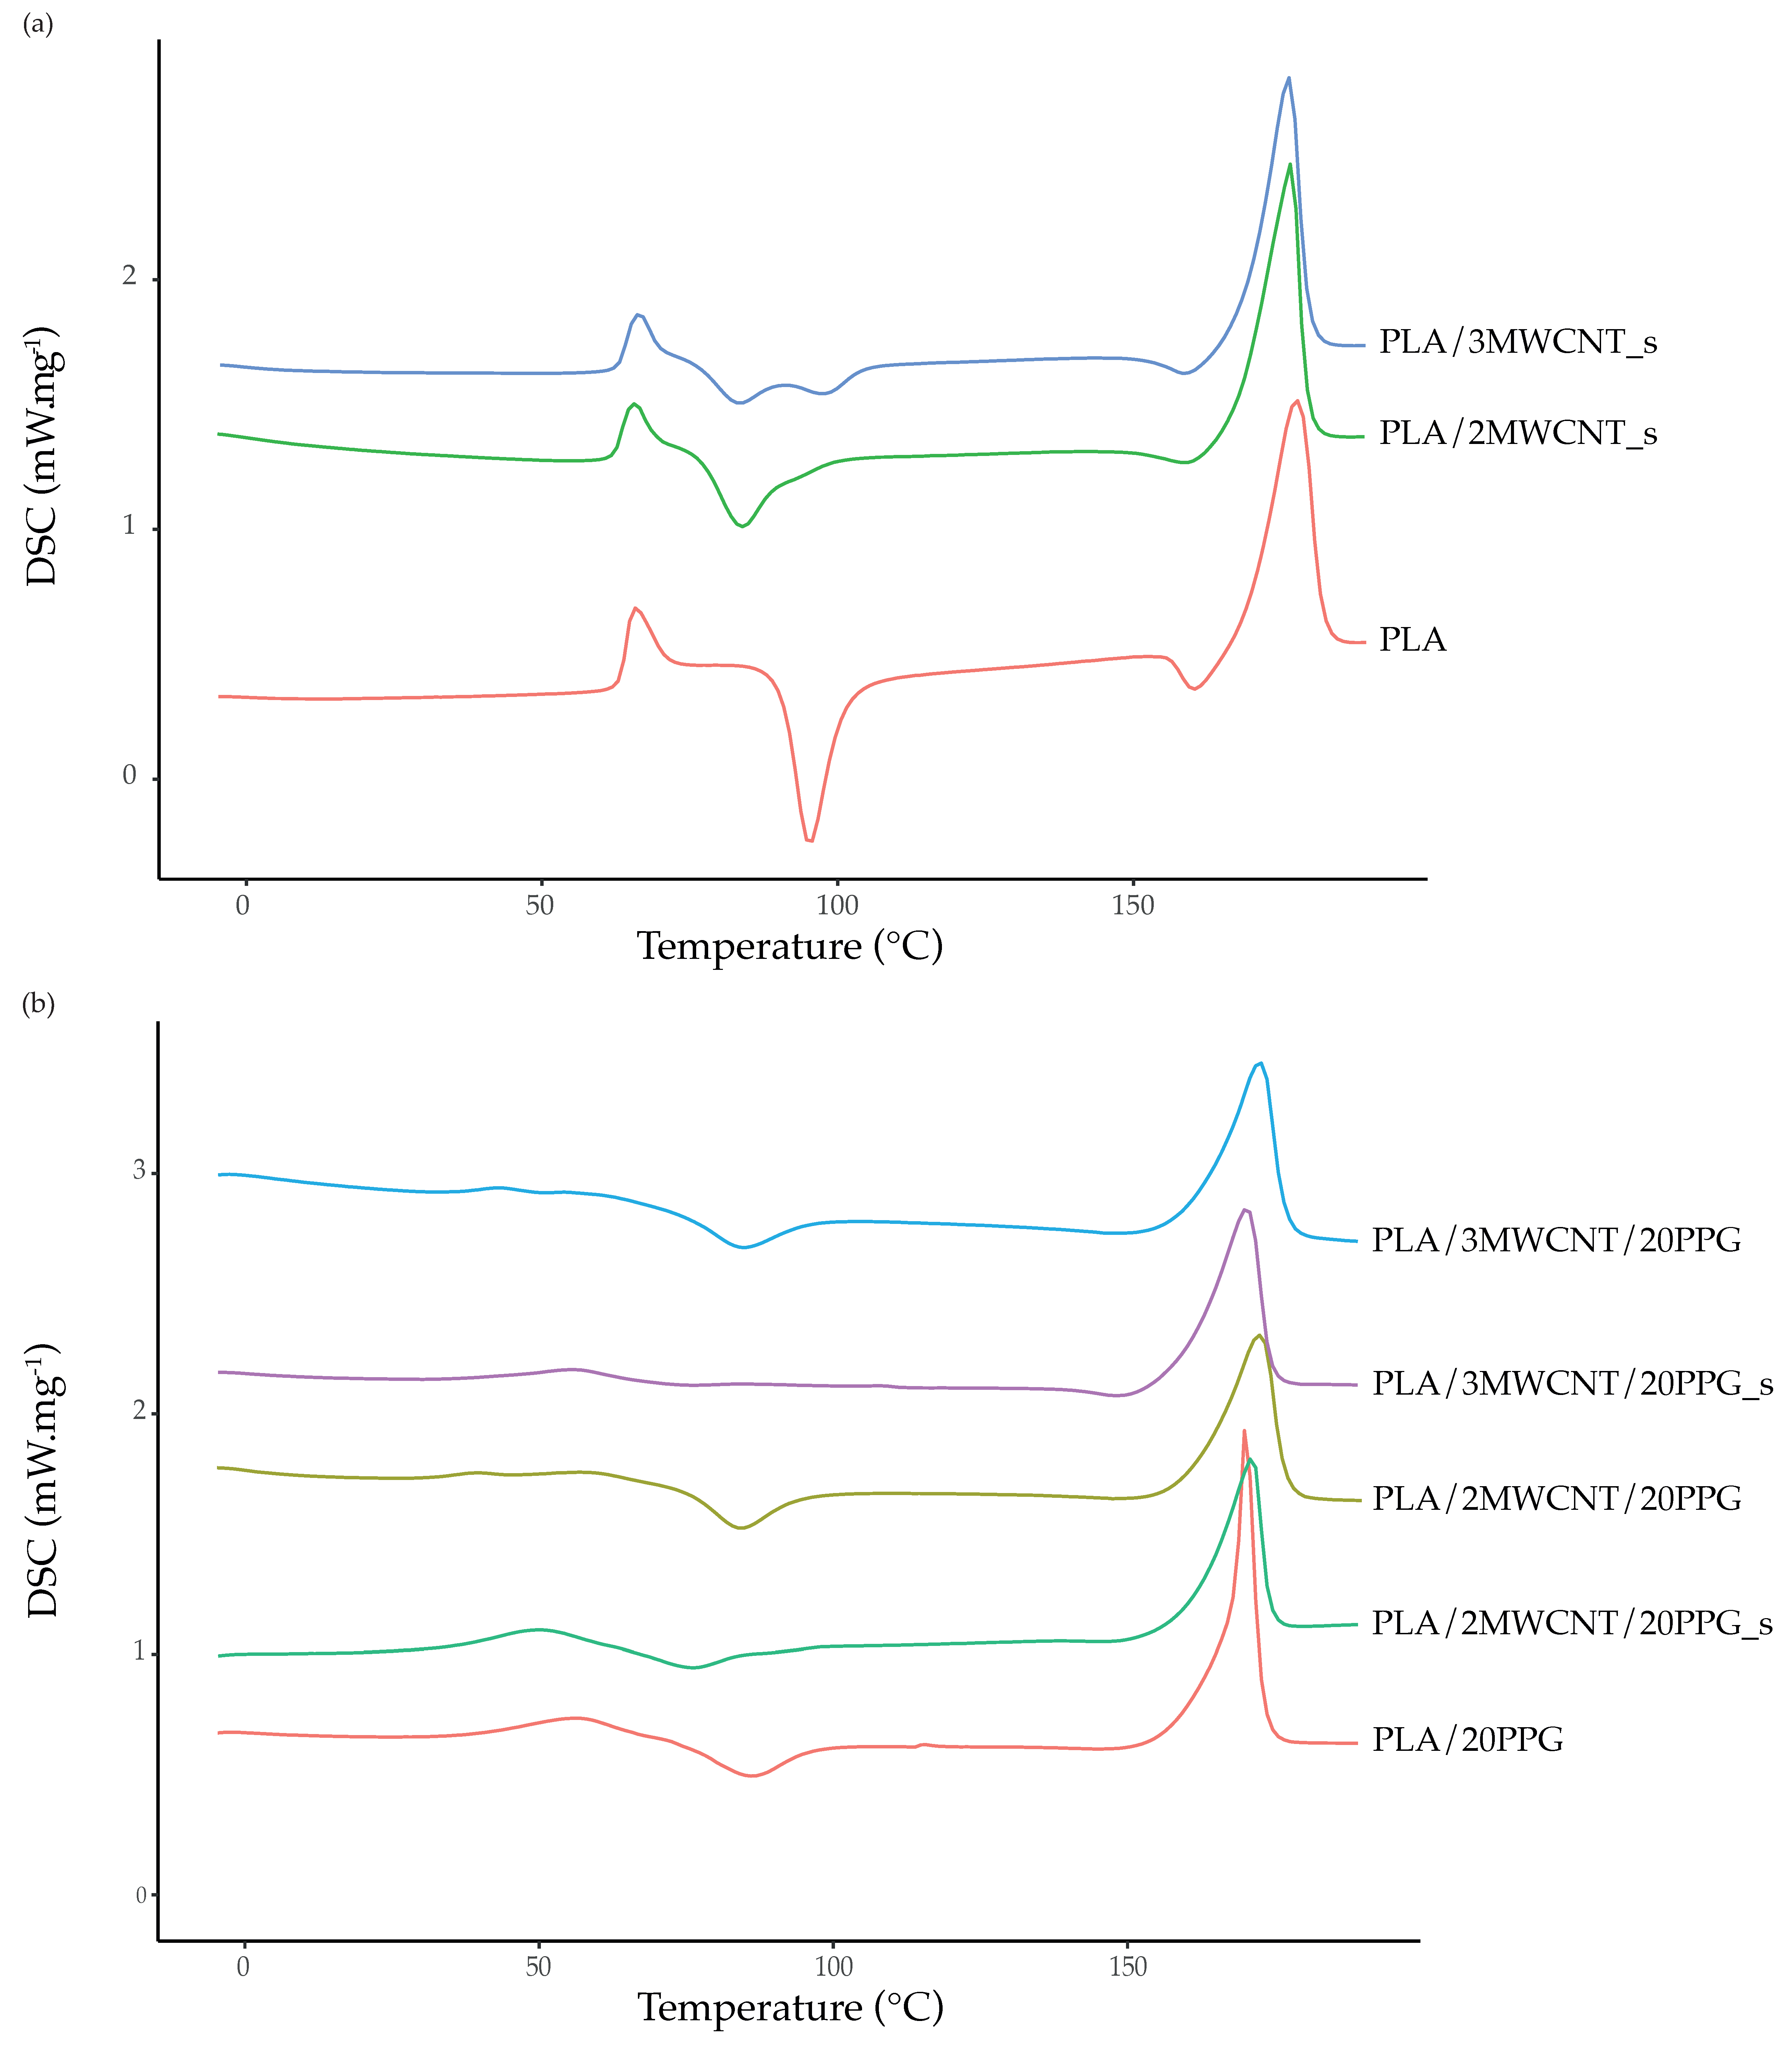
3.3. Thermal Characterization

The thermal characterization of the extruded filaments was performed by TGA and DSC analysis.
Thermal degradation curves, and the corresponding derivatives (DTG), of PLA and composites are presented in Figure 6. Neat PLA displays one degradation step with first derivative peak maximum occurring at 394 °C. Two weight loss steps are observed for PLA/20PPG: one with a first derivative peak maximum at 255 °C that may be attributed to PPG vaporization and the second near 396 °C, corresponding to PLA degradation (Figure 6, Table 4).
The weight losses observed for the composites containing PPG in the temperature range of 200–350 °C are approximately 10 wt.% (Table 4), while the PLA/PPG composition shows a weight loss near 15 wt.% in the same temperature range. Considering this weight loss an indicator of the PPG content, it remains below the target composition of 20 wt.%, suggesting loss by vaporization during melt-extrusion.
A decrease in Tg and melting temperature (TM) is observed for PLA/20PPG as compared to neat PLA, confirming the plasticizing effect of PPG (Figure 7). Composites without plasticizer show TM and Tg similar to PLA (Table 5, Figure 7). The plasticizing effect of PPG is also noticeable in MWCNT composites, which present lower Tg and TM than the corresponding nonplasticized compositions.
After melt processing into filament form, the neat PLA shows a pronounced cold-crystallization peak in the DSC crystallization scan (Figure 7), i.e., upon heating, the PLA filaments can still rearrange and crystallize further when temperature rises above Tg. Compositions containing PPG appear more stable upon heating, showing lower tendency for molecular rearrangement and depicting smaller cold crystallization enthalpy (ΔHcc). This observation is quite relevant, as it may indicate higher dimensional stability of the filaments prepared with plasticizer, and their possible application at higher service temperatures. The PLA and composite filaments containing PPG present a slight increase of the total melting enthalpy (ΔHM), thus indicating that the PLA crystallization ability was not hampered by the presence of PPG.

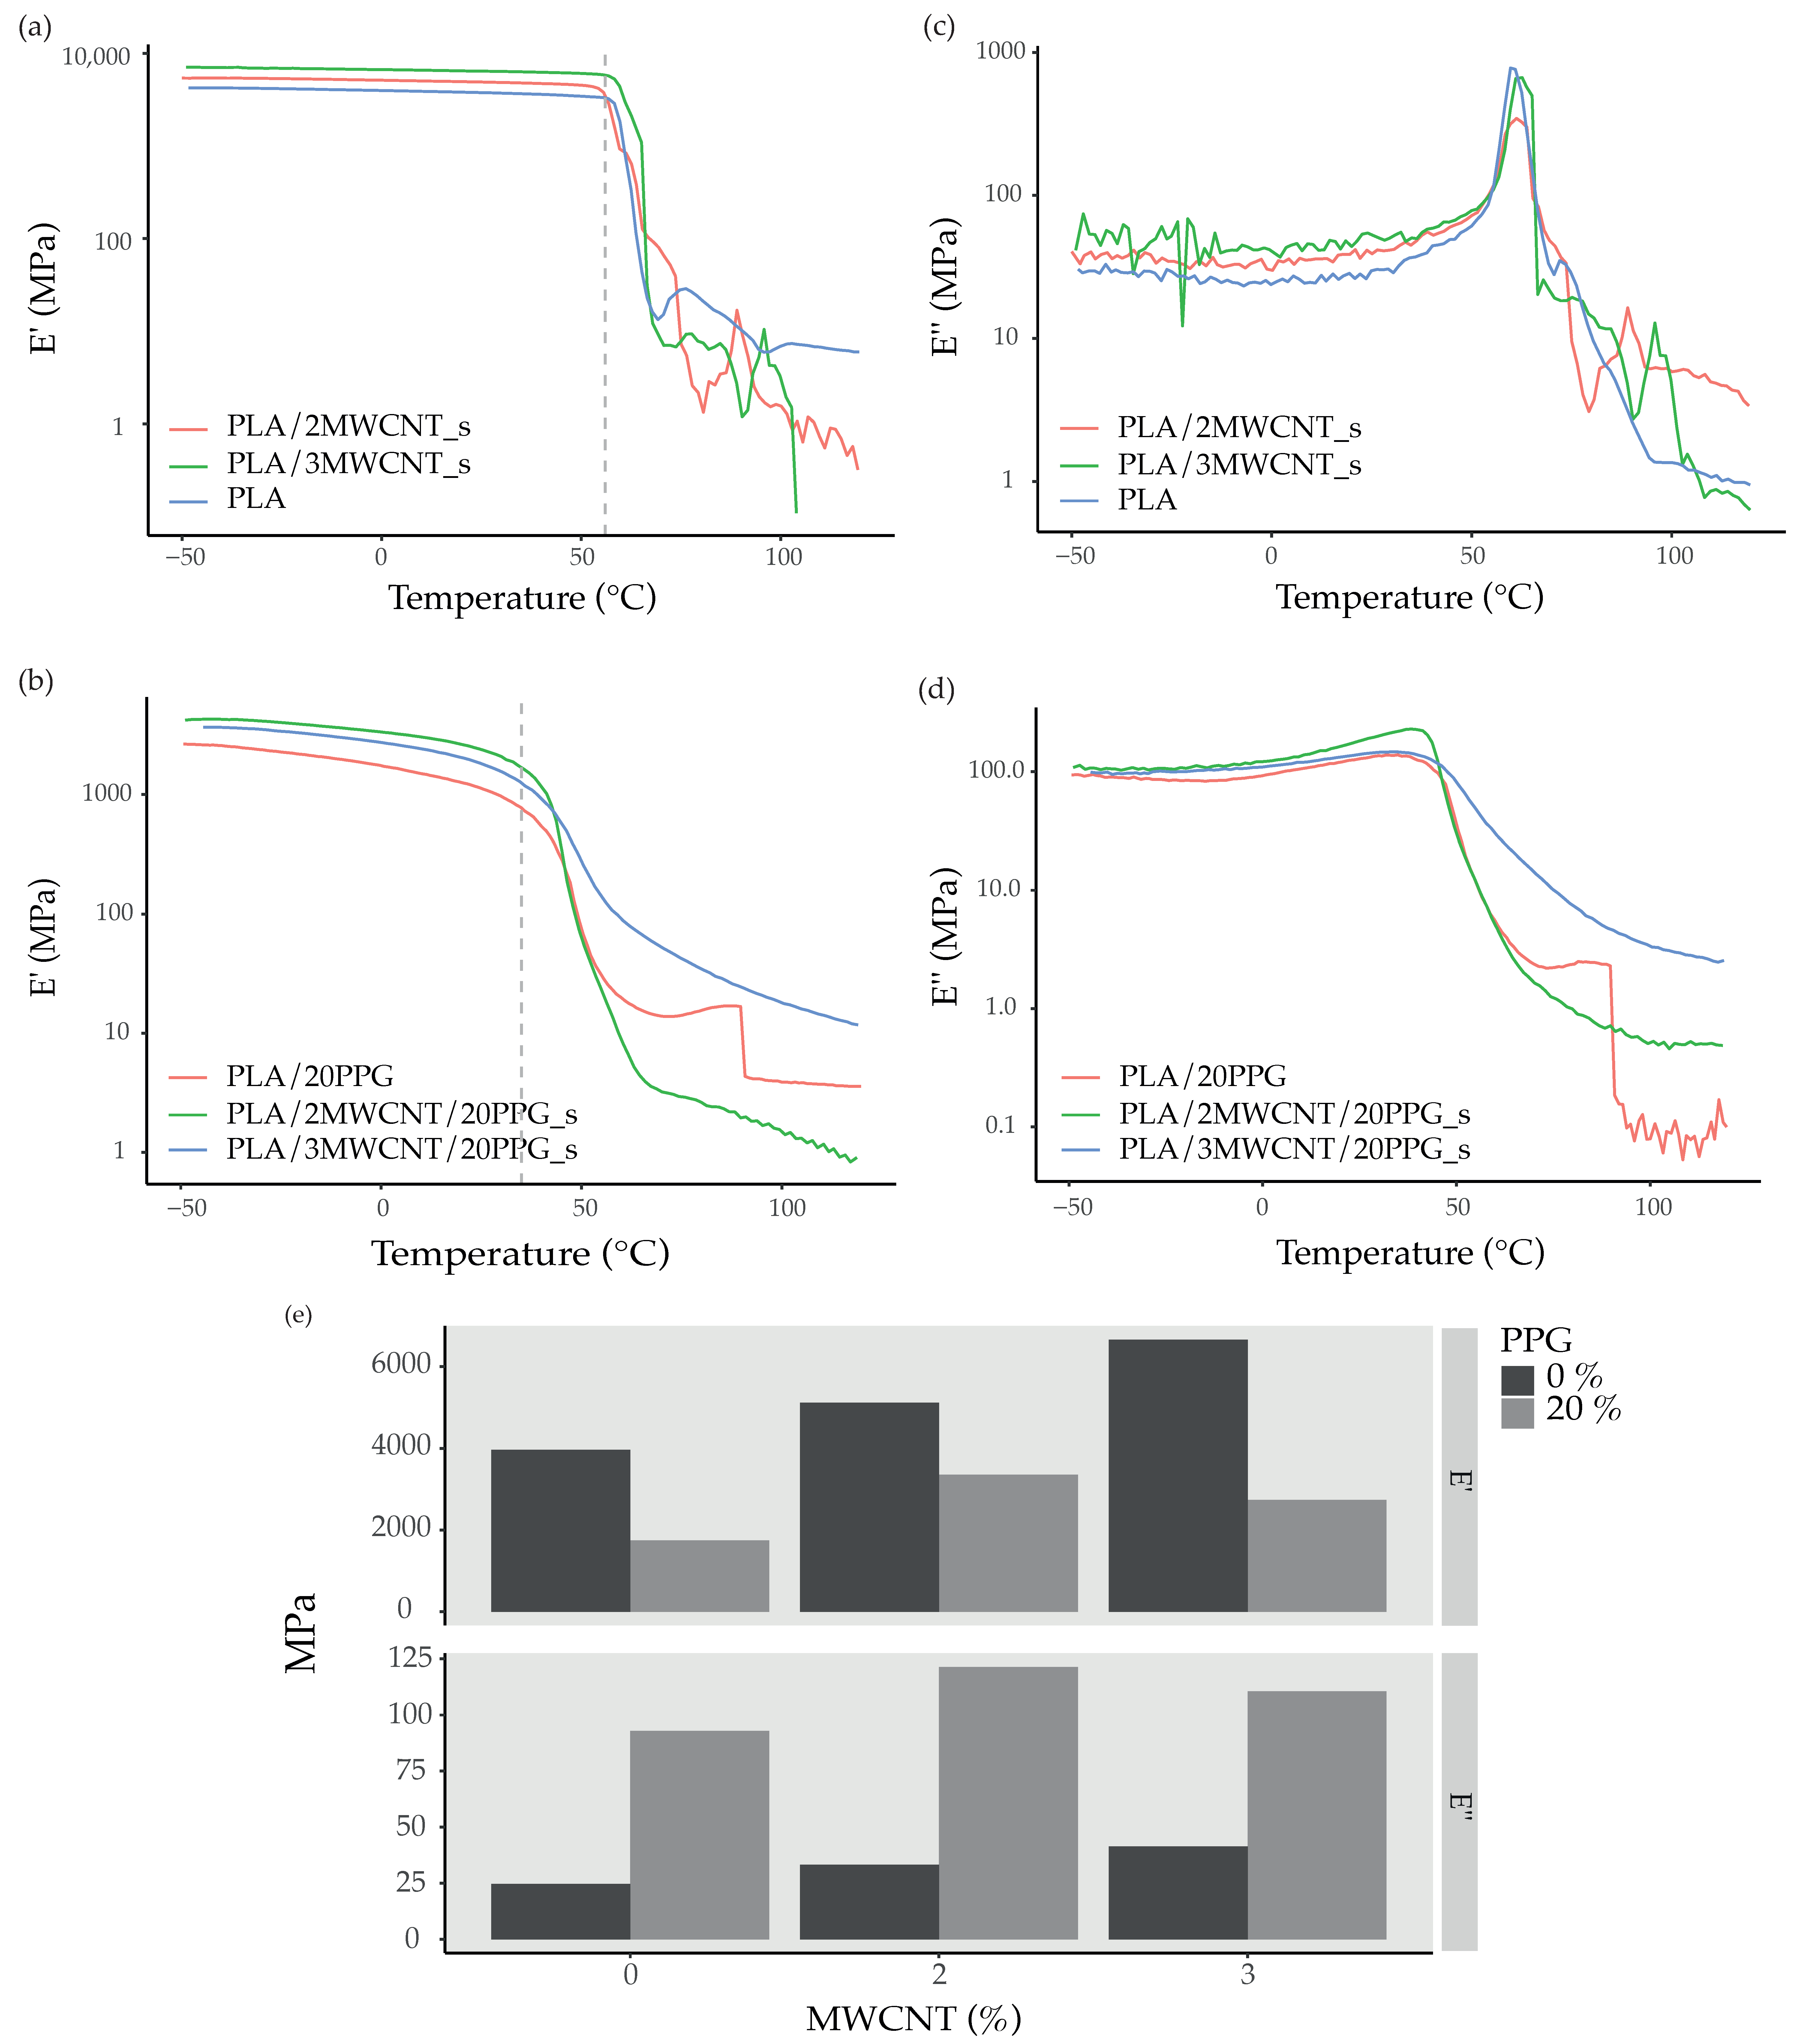
3.4. Dynamic Mechanical Properties

DMA analysis shows the effect of the addition of high modulus MWCNT to PLA with and without PPG. While the addition of MWCNT increases the composite storage modulus (E′), the plasticizer has the opposite effect, decreasing E′ and increasing the loss modulus (E″) for PLA and its composites. The composites with MWCNT and PPG present lower E′ compared to neat PLA but higher than plasticized PLA, showing the relevance of the PPG plasticizing effect. The smaller-diameter nonplasticized composite filaments show increasing E′ with MWCNT load. The addition of PPG lowers the value of E′ continuously from −40 °C (the melting temperature of PPG) until approximately 40 °C, while the nonplasticized composites maintain their E′ value along the whole temperature range until reaching the Tg of PLA (Figure 8).
The plasticizing effect of PPG in the composite filaments is confirmed by the increase in E″, therefore showing higher ability for energy dissipation compared to the corresponding nonplasticized composites (Figure 8e). The peak maximum of Tanδ (Table 6) indicates the temperature at which significant segmental motions of the polymer chains are enabled, corresponding to the polymer Tg. Tan δ is observed at lower temperature for PLA and composites containing PPG compared to neat PLA and its composites (Table 5), consistent with the results obtained by DSC.

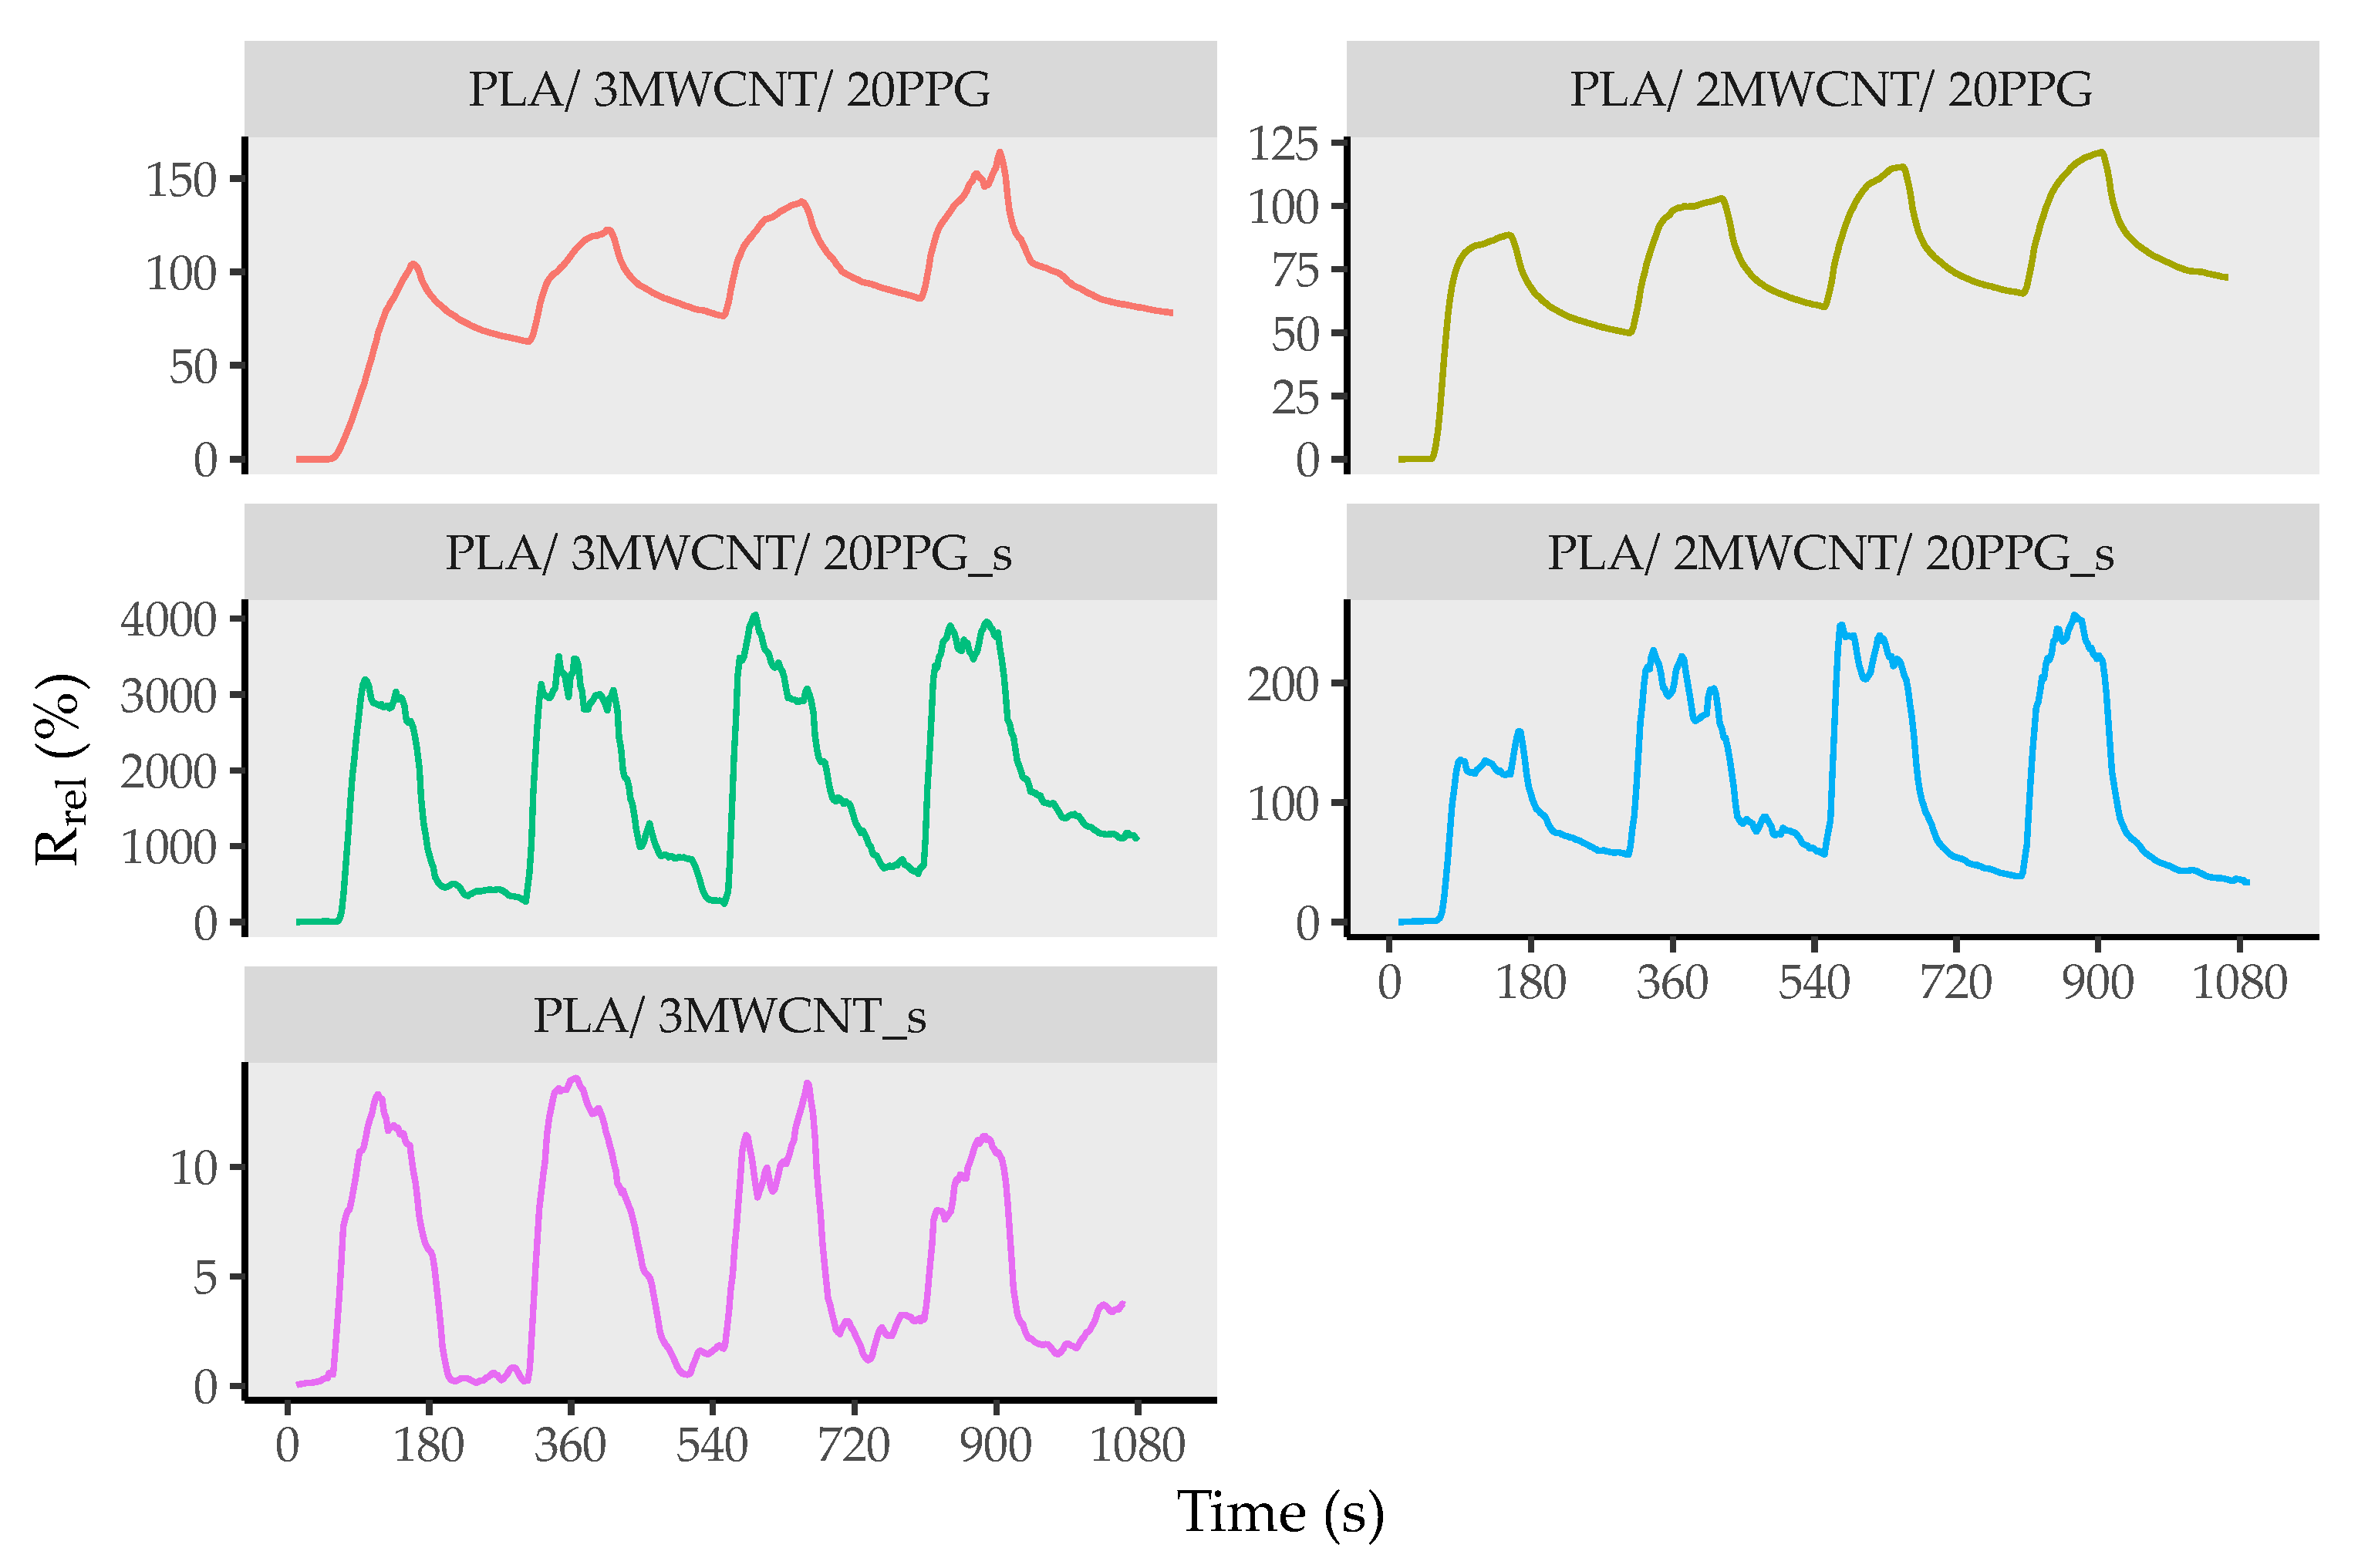
3.5. Conductivity and Sensing Ability of Composite Filaments

The results obtained for the DC volume conductivity (σDC) of the PLA composite filaments are presented in Figure 9. Measurements were performed on the small-diameter (~0.5 mm) composite filaments with and without PPG, and on the large-diameter filaments (~1.5 mm) with PPG, to monitor possible effects that may be induced during filament collection, which may affect the MWCNT distribution in the composite.
All composite filaments produced without plasticizer show σDC in the order of 10−7 S·cm−1. The composite filaments with 3 wt.% MWCNT and PPG presented a σDC in the order of 10−3 S·cm−1 for both small and large diameter, and similar results were obtained for large-diameter 2 wt.% MWCNT/PPG filaments. The plasticizer played a major role aiding the dispersion of MWCNT, as observed by OM, and the enhanced MWCNT dispersion allowed the formation of electrically conductive filaments. However, the small-diameter filaments with 2 wt.% MWCNT/PPG yielded lower σDC, which may be due to the filament preparation procedure, namely the pulling action imposed on the melt during filament forming. This slight pulling of the polymer melt may induce an orientation effect, leading to a decrease of the electrical conductivity [43]. This marginal pulling effect was consequent for the electrical conductivity of the composites with lower MWCNT content but not for the filaments with higher MWCNT concentration. The latter presented similar average electrical conductivity for large- and small-diameter filaments, despite increasing its scatter along the filament’s length.
The cyclic sensing response of PLA composite filaments was investigated using saturated acetone vapor. As observed in Figure 10, small- and large-diameter samples react to the immersion in acetone vapor by an increase in the relative resistance Rrel and to the rinsing with dry air with a resistance decrease. Thereby, large differences are observed depending on the concentration of MWCNTs and the addition of PPG. The small-diameter composite filaments with 3 wt.% MWCNT without PPG shows the lowest response with Rrel values of approximately 15% after the 150 s immersion time. Addition of PPG significantly increases Rrel values up to about 150% in the large-diameter filaments and up to 3700% in the small-diameter filaments. Filaments with 2 wt.% MWCNT and PPG yielded lower signal than filaments with 3 wt.% MWCNT, with maximal Rrel near 125% for the thick and near 250% for the thin filaments. Thereby, all the large-diameter filaments present lower signal noise but also a much lower reversibility in the drying process, retaining high Rrel values even after 100 s exposure to dry air. The smaller-diameter filaments show higher signal noise, despite higher reversibility within the drying period with a small shift of the starting Rrel values after each cycle. The small-diameter filaments with 3 wt.% MWCNT and 20 wt.% PPG are the best performing, showing high response and good reversibility. This demonstrates the suitability of these composite filaments for integration in fabrics for gas-sensing applications.

4. Conclusions

The present work describes the preparation and characterization of composite filaments based on PLA and MWCNT, and the evaluation of the effect of the addition of PPG as a plasticizer. The addition of PPG was observed to assist the dispersion of MWCNT within the PLA matrix, reducing the size and number of MWCNT agglomerates and thus increasing the electrical conductivity of the composites. The plasticized composites were thermally stable up to approximately 200 °C. The plasticizing effect was confirmed by DSC and DMA, showing a consistent decrease by nearly 15 °C of the glass transition temperature for plasticized PLA and its composites. The tendency for cold crystallization of PLA observed above Tg was considerably reduced by the incorporation of the plasticizer. DMA results showed larger E″ values for composites containing PPG, demonstrating enhanced ability for energy dispersion as compared to neat PLA and its MWCNT composites.
The addition of PPG to the composites and the diameter of the filaments produced were observed to influence the sensing response toward acetone vapor. The electrical conductivity and sensing ability achieved for the smaller-diameter filaments (∅ ~ 500 µm) are promising; however, their textile application is so far limited to simple textile structures, considering the large filament diameter. The next steps include the production of composite filaments with smaller diameter and their characterization, aiming at the production of a wearable functional textile or textiles for leakage detection.

Supplementary Materials

The following are available online at https://www.mdpi.com/2076-3417/11/6/2580/s1, namely: Figure S1: Cumulative distribution plots of the measured MWCNT agglomerate areas, for all the composites; and Figure S2: Raman spectra of PLA.

Author Contributions

Conceptualization, M.C.P. and F.N.F.; methodology, M.M.S. and M.C.P.; investigation M.M.S.; sample characterization M.M.S., P.E.L., and Y.L.; data curation M.M.S., P.E.L., and Y.L.; writing—original draft preparation, M.M.S.; writing—review and editing, M.C.P., P.E.L., and P.P.; supervision, M.C.P.; project administration, M.C.P. and F.N.F.; resources, M.C.P., F.N.F., and P.P. All authors have read and agreed to the published version of the manuscript.

Funding

This research was funded by FEDER/FEEI through FCT, National Funds Reference UID/CTM/50025/2019 and UID/CTM/00264/2019 and the Project TSSIPRO-Technologies for Sustainable and Smart Innovative Products, NORTE-01-0145-FEDER-000015, supported by Programa Operacional Regional do Norte Funding.

Institutional Review Board Statement

Not applicable.

Informed Consent Statement

Not applicable.

Data Availability Statement

The data presented in this study are available on request from the corresponding author.

Acknowledgments

M.C.P. is grateful to IPF Dresden for providing a grant for a research stay. M.M.S. is thankful to Luís Amorim and Magda Silva for the support provided.

Conflicts of Interest

The authors declare no conflict of interest.

References

  1. Gupta, B.; Revagade, N.; Hilborn, J. Poly(lactic acid) fiber: An overview. Progress Polym. Sci. 2007, 32, 455–482. [Google Scholar] [CrossRef]
  2. Castro-Aguirre, E.; Iniguez-Franco, F.; Samsudin, H.; Fang, X.; Auras, R. Poly(lactic acid)-Mass production, processing, industrial applications, and end of life. Adv. Drug Deliv. Rev. 2016, 107, 333–366. [Google Scholar] [CrossRef] [PubMed] [Green Version]
  3. Lim, S.; Son, D.; Kim, J.; Lee, Y.B.; Song, J.K.; Choi, S.; Lee, D.J.; Kim, J.H.; Lee, M.; Hyeon, T.; et al. Transparent and Stretchable Interactive Human Machine Interface Based on Patterned Graphene Heterostructures. Adv. Funct. Mater. 2015, 25, 375–383. [Google Scholar] [CrossRef]
  4. Reyes, C.; Somogyi, R.; Niu, S.; Cruz, M.A.; Yang, F.C.; Catenacci, M.J.; Rhodes, C.P.; Wiley, B.J. Three-Dimensional Printing of a Complete Lithium Ion Battery with Fused Filament Fabrication. ACS Appl. Energy Mater. 2018, 1, 5268–5279. [Google Scholar] [CrossRef]
  5. Guo, Y.; Zhong, M.J.; Fang, Z.W.; Wan, P.B.; Yu, G.H. A Wearable Transient Pressure Sensor Made with MXene Nanosheets for Sensitive Broad-Range Human-Machine Interfacing. Nano Lett. 2019, 19, 1143–1150. [Google Scholar] [CrossRef]
  6. De Falco, F.; Guarino, V.; Gentile, G.; Cocca, M.; Ambrogi, V.; Ambrosio, L.; Avella, M. Design of functional textile coatings via non-conventional electrofluidodynamic processes. J. Colloid Interface Sci. 2019, 541, 367–375. [Google Scholar] [CrossRef] [PubMed]
  7. Zhao, Z.C.; Li, B.T.; Xu, L.Q.; Qiao, Y.; Wang, F.; Xia, Q.Y.; Lu, Z.S. A Sandwich-Structured Piezoresistive Sensor with Electrospun Nanofiber Mats as Supporting, Sensing, and Packaging Layers. Polymers 2018, 10, 575. [Google Scholar] [CrossRef] [PubMed] [Green Version]
  8. Anderson, K.S.; Schreck, K.M.; Hillmyer, M.A. Toughening polylactide. Polym. Rev. 2008, 48, 85–108. [Google Scholar] [CrossRef]
  9. Goncalves, C.; Goncalves, I.C.; Magalhaes, F.D.; Pinto, A.M. Poly(lactic acid) Composites Containing Carbon-Based Nanomaterials: A Review. Polymers 2017, 9, 269. [Google Scholar] [CrossRef] [Green Version]
  10. Mascia, L.; Xanthos, M. An overview of additives and modifiers for polymer blends: Facts, deductions, and uncertainties. Adv. Polym. Technol. J. Polym. Process. Inst. 1992, 11, 237–248. [Google Scholar] [CrossRef]
  11. Farah, S.; Anderson, D.G.; Langer, R. Physical and mechanical properties of PLA, and their functions in widespread applications—A comprehensive review. Adv. Drug Deliv. Rev. 2016, 107, 367–392. [Google Scholar] [CrossRef] [Green Version]
  12. Kulinski, Z.; Piorkowska, E.; Gadzinowska, K.; Stasiak, M. Plasticization of poly(L-lactide) with poly(propylene glycol). Biomacromolecules 2006, 7, 2128–2135. [Google Scholar] [CrossRef] [PubMed]
  13. Piorkowska, E.; Kulinski, Z.; Galeski, A.; Masirek, R. Plasticization of semicrystalline poly(L-lactide) with poly(propylene glycol). Polymer 2006, 47, 7178–7188. [Google Scholar] [CrossRef]
  14. Mohan, R.; Subha, J.; Alam, J. Influence of Multiwalled Carbon Nanotubes on Biodegradable Poly(lactic acid) Nanocomposites for Electroactive Shape Memory Actuator. Adv. Polym. Technol. 2018, 37. [Google Scholar] [CrossRef]
  15. Sun, Y.C.; Chu, M.; Huang, M.; Hegazi, O.; Naguib, H.E. Hybrid Electroactive Shape Memory Polymer Composites with Room Temperature Deformability. Macromol. Mater. Eng. 2019, 304. [Google Scholar] [CrossRef]
  16. Balart, J.F.; Fombuena, V.; Fenollar, O.; Boronat, T.; Sanchez-Nacher, L. Processing and characterization of high environmental efficiency composites based on PLA and hazelnut shell flour (HSF) with biobased plasticizers derived from epoxidized linseed oil (ELO). Compos. Part B Eng. 2016, 86, 168–177. [Google Scholar] [CrossRef]
  17. Wang, J.Z.; Li, H.Z.; Liu, R.X.; Li, L.L.; Lin, Y.H.; Nan, C.W. Thermoelectric and mechanical properties of PLA/Bi0.5Sb1.5Te3 composite wires used for 3D printing. Compos. Sci. Technol. 2018, 157, 1–9. [Google Scholar] [CrossRef]
  18. Ahmad, A.F.; Ab Aziz, S.; Abbas, Z.; Obaiys, S.J.; Matori, K.A.; Zaid, M.H.M.; Raad, H.K.; Aliyu, U.S. Chemically Reduced Graphene Oxide-Reinforced Poly(Lactic Acid)/Poly(Ethylene Glycol) Nanocomposites: Preparation, Characterization, and Applications in Electromagnetic Interference Shielding. Polymers 2019, 11, 661. [Google Scholar] [CrossRef] [PubMed] [Green Version]
  19. Norazlina, H.; Hadi, A.A.; Qurni, A.U.; Amri, M.; Mashelmie, S.; Kamal, Y. Effects of multi-walled carbon nanotubes (MWCNTs) on the degradation behavior of plasticized PLA nanocomposites. Polym. Bull. 2019, 76, 1453–1469. [Google Scholar] [CrossRef]
  20. Chieng, B.W.; Ibrahim, N.A.; Yunus, W.; Hussein, M.Z. Poly(lactic acid)/Poly(ethylene glycol) Polymer Nanocomposites: Effects of Graphene Nanoplatelets. Polymers 2014, 6, 93–104. [Google Scholar] [CrossRef] [Green Version]
  21. Oksman, K.; Skrifvars, M.; Selin, J.F. Natural fibres as reinforcement in polylactic acid (PLA) composites. Compos. Sci. Technol. 2003, 63, 1317–1324. [Google Scholar] [CrossRef]
  22. Chen, D.K.; Li, J.; Ren, J. Study on sound absorption property of ramie fiber reinforced poly(L-lactic acid) composites: Morphology and properties. Compos. Part A Appl. Sci. Manuf. 2010, 41, 1012–1018. [Google Scholar] [CrossRef]
  23. Shi, X.T.; Zhang, G.C.; Phuong, T.V.; Lazzeri, A. Synergistic Effects of Nucleating Agents and Plasticizers on the Crystallization Behavior of Poly(lactic acid). Molecules 2015, 20, 1579–1593. [Google Scholar] [CrossRef]
  24. Posada, J.C.; Jaramillo, L.Y.; Cadena, E.M.; Garcia, L.A. Bio-based composites from agricultural wastes: Polylactic acid and bamboo Guadua angustifolia. J. Compos. Mater. 2016, 50, 3229–3237. [Google Scholar] [CrossRef]
  25. Ahmed, J.; Mulla, M.; Jacob, H.; Luciano, G.; Bini, T.B.; Almusallam, A. Polylactide/poly(epsilon-caprolactone)/zinc oxide/clove essential oil composite antimicrobial films for scrambled egg packaging. Food Packag. Shelf Life 2019, 21. [Google Scholar] [CrossRef]
  26. Thellen, C.; Orroth, C.; Froio, D.; Ziegler, D.; Lucciarini, J.; Farrell, R.; D’Souza, N.A.; Ratto, J.A. Influence of montmorillonite layered silicate on plasticized poly(L-lactide) blown films. Polymer 2005, 46, 11716–11727. [Google Scholar] [CrossRef]
  27. Shibata, M.; Someya, Y.; Orihara, M.; Miyoshi, M. Thermal and mechanical properties of plasticized poly(L-lactide) nanocomposites with organo-modified montmorillonites. J. Appl. Polym. Sci. 2006, 99, 2594–2602. [Google Scholar] [CrossRef]
  28. Zenkiewicz, M.; Richert, J.; Rozanski, A. Effect of blow moulding ratio on barrier properties of polylactide nanocomposite films. Polym. Test. 2010, 29, 251–257. [Google Scholar] [CrossRef]
  29. Gorrasi, G.; Tammaro, L.; Vittoria, V.; Paul, M.A.; Alexandre, M.; Dubois, P. Transport properties of water vapor in polylactide/montmorillonite nanocomposites. J. Macromol. Sci. Phys. 2004, B43, 565–575. [Google Scholar] [CrossRef]
  30. Mohapatra, A.K.; Mohanty, S.; Nayak, S.K. Properties and characterization of biodegradable poly(lactic acid) (PLA)/poly(ethylene glycol) (PEG) and PLA/PEG/organoclay: A study of crystallization kinetics, rheology, and compostability. J. Thermoplast. Compos. Mater. 2016, 29, 443–463. [Google Scholar] [CrossRef]
  31. Nekhamanurak, B.; Patanathabutr, P.; Hongsriphan, N. Thermal-mechanical property and fracture behaviour of plasticised PLA-CaCO3 nanocomposite. Plast. Rubber Compos. 2012, 41, 175–179. [Google Scholar] [CrossRef]
  32. Risyon, N.P.; Othman, S.H.; Basha, R.K.; Talib, R.A. Effect of Halloysite Nanoclay Concentration and Addition of Glycerol on Mechanical Properties of Bionanocomposite Films. Polym. Polym. Compos. 2016, 24, 795–801. [Google Scholar] [CrossRef]
  33. Lai, S.M.; Chen, J.R.; Han, J.L.; Yu, Y.F.; Lai, H.Y. Preparation and properties of melt-blended polylactic acid/polyethylene glycol-modified silica nanocomposites. J. Appl. Polym. Sci. 2013, 130, 496–503. [Google Scholar] [CrossRef]
  34. Li, Y.L.; Pötschke, P.; Pionteck, J.; Voit, B. Electrical and vapor sensing behaviors of polycarbonate composites containing hybrid carbon fillers. Eur. Polym. J. 2018, 108, 461–471. [Google Scholar] [CrossRef]
  35. Wickham, H.; François, R.; Henry, L.; Müller, K. dplyr: A Grammar of Data Manipulation. R Package Version 1.0.2. Available online: https://CRAN.R-project.org/package=dplyr (accessed on 9 December 2020).
  36. Wickham, H.; Averick, M.; Bryan, J.; Chang, W.; D’Agostino McGowan, L.; François, R.; Grolemund, G.; Hayes, A.; Henry, L.; Hester, J.; et al. Welcome to the {tidyverse}. J. Open Source Softw. 2019, 4, 1686. [Google Scholar] [CrossRef]
  37. Wickham, H. The Split-Apply-Combine Strategy for Data Analysis. J. Stat. Softw. 2011, 40, 1–29. [Google Scholar] [CrossRef] [Green Version]
  38. Wickham, H. ggplot2: Elegant Graphics for Data Analysis; Springer: New York, NY, USA, 2016. [Google Scholar]
  39. Wilke, C.O. cowplot: Streamlined Plot Theme and Plot Annotations for ‘ggplot2’. Available online: https://CRAN.R-project.org/package=cowplot (accessed on 12 January 2021).
  40. Wilke, C.O. ggridges: Ridgeline Plots in ‘ggplot2’. Available online: https://CRAN.R-project.org/package=ggridges (accessed on 9 December 2020).
  41. McNally, T.; Pötschke, P.; Halley, P.; Murphy, M.; Martin, D.; Bell, S.E.J.; Brennan, G.P.; Bein, D.; Lemoine, P.; Quinn, J.P. Polyethylene multiwalled carbon nanotube composites. Polymer 2005, 46, 8222–8232. [Google Scholar] [CrossRef]
  42. Batakliev, T.; Petrova-Doycheva, I.; Angelov, V.; Georgiev, V.; Ivanov, E.; Kotsilkova, R.; Casa, M.; Cirillo, C.; Adami, R.; Sarno, M.; et al. Effects of Graphene Nanoplatelets and Multiwall Carbon Nanotubes on the Structure and Mechanical Properties of Poly(lactic acid) Composites: A Comparative Study. Appl. Sci. 2019, 9, 469. [Google Scholar] [CrossRef] [Green Version]
  43. Bautista-Quijano, J.R.; Pötschke, P.; Brünig, H.; Heinrich, G. Strain sensing, electrical and mechanical properties of polycarbonate/multiwall carbon nanotube monofilament fibers fabricated by melt spinning. Polymer 2016, 82, 181–189. [Google Scholar] [CrossRef]
Figure 1. Extrusion layout: the screws are composed of an initial transport zone at feeding zone (FZ), followed by the first set of mixing blocks at the beginning of Z1, a transport zone, plus an intensive mixing zone at Z2; at Z3, there is a small mixing zone in between transport ones.
Applsci 11 02580 g001
Figure 2. Optical microscopy (OM) (transmission mode) images of filament composites with different diameters, filler load, and PPG wt.%.
Applsci 11 02580 g002
Figure 3. Density plot of MWCNT agglomerate areas. Red lines indicate the quartiles.
Applsci 11 02580 g003
Figure 4. SEM images (secondary electron mode) of composite filaments. Magnification indicated by the scale bar.
Applsci 11 02580 g004
Figure 5. Raman spectra of neat PLA, composites, and pristine MWCNT. Dashed lines indicate MWCNT’s D, G, and 2D band positions.
Applsci 11 02580 g005
Figure 6. Thermal degradation of neat PLA and composites under N2 atmosphere. Thermogravimetric analysis curves are displayed in the top row and the corresponding derivatives in the bottom row.
Applsci 11 02580 g006
Figure 7. Representative differential scanning calorimetry (DSC) scans of (a) neat PLA filaments and composite filaments with MWCNT, and (b) composite filaments with PPG.
Applsci 11 02580 g007
Figure 8. (a) Storage modulus G′ curves of neat PLA and PLA-MWCNT composites, and (b) PLA composites with plasticizer. (c) Loss modulus G″ curves of neat PLA and PLA-MWCNT composites, and (d) PLA composites with plasticizer. (e) E′ and E″ at 0 °C of PLA and composites.
Applsci 11 02580 g008
Figure 9. Direct current (DC) conductivities of composite filaments. Error bars denote maximum and minimum σDC.
Applsci 11 02580 g009
Figure 10. Typical electrical resistance response of PLA/MWCNT and PLA/MWCNT/PPG filaments to C3H6O vapor.
Applsci 11 02580 g010
Table 2. Melt-extruded PLA/multiwall carbon nanotube (MWCNT)/ poly(propylene) glycol (PPG) composites.
Sample DesignationCompositionAverage Diameter (mm)
PPG (wt.%)MWCNT (wt.%)
PLA001.17
PLA/20PPG2000.75
PLA/2MW/20PPG2021.64
PLA/3MW/20PPG2031.69
PLA/2MW_s *020.50
PLA/3MW_s *030.54
PLA/2MW/20PPG_s *2020.44
PLA/3MW/20PPG_s *2030.39
* The “s” indicates small-diameter filaments.
Table 3. Quartiles (Median, Q 1 , and Q 3 ) of the areas measured per sample, area ratio, and count of agglomerates per mm2.
SampleMedian (µm2)Q1 (0.25) (µm2)Q3 (0.75) (µm2)Area Ratio (%)Number of Agglomerates (mm−2)
PLA/2MWCNT_s18.058.2539.961.74356
PLA/3MWCNT_s23.3010.8353.605.83789
PLA/2MWCNT/20PPG_s 6.445.527.911.38303
PLA/3MWCNT/20PPG_s6.915.739.421.93648
PLA/2MWCNT/20PPG 6.915.028.800.37178
PLA/3MWCNT/20PPG6.825.689.091.88336
Table 4. Thermogravimetric analysis results for PLA, PLA with PPG, and its MWCNT composites.
SampleWeight Loss at 350 °C
(wt.%)
Temperature of PPG Vaporization (DTG Peak, °C)Temperature at Max. Rate of PLA Degradation (DTG Peak, °C)Residue at 700 °C
(wt.%)
PLA1.4 ± 0.7-394.0 ± 3.62.8 ± 0.8
PLA/20PPG15.3 ± 1.1254.6 ± 4.8395.5 ± 0.41.6 ± 0.2
PLA/2MWCNT/20PPG9.3 ± 0.3253.7 ± 3.7409.6 ± 6.72.80 ± 0.04
PLA/2MWCNT/20PPG_s11.0 ± 0.4246.9 ± 7.6396.0 ± 0.35.4 ± 0.2
PLA/2MWCNT_s1.0 ± 0.4-400.6 ± 1.14.3 ± 0.9
PLA/3MWCNT/20PPG8.9 ± 0.2264.7 ± 6.6409.2 ± 5.83.1 ± 0.1
PLA/3MWCNT/20PPG_s11.6 ± 0.2244.4 ± 2.0395.3 ± 0.46.1 ± 0.3
PLA/3MWCNT_s1.7 ± 0.4-396.4 ± 2.74.1 ± 0.8
Table 5. Glass transition temperature, Tg; cold crystallization temperature, Tcc; melting temperature, TM; enthalpy of cold crystallization, ΔHcc; and enthalpy of melting, ΔHM, as measured by DSC analysis for PLA and MWCNT composites.
SampleTg (°C)Tcc (°C)TM (°C)ΔHcc (J·g−1)ΔHM (J·g−1)
PLA63.8 ± 0.395.2 ± 0.3177.5 ± 0.337.949.4
PLA/20PPG53.8 ± 4.085.9 ± 0.0169.2 ± 1.314.355.5
PLA/2MWCNT_s63.0 ± 0.283.5 ± 0.6176.4 ± 0.324.748.7
PLA/2MWCNT/20PPG_s47.3 ± 2.373.4 ± 4.0171.4 ± 0.412.042.1
PLA/2MWCNT/20PPG35.4 ± 3.686.1 ± 1.5172.5 ± 0.521.847.4
PLA/3MWCNT_s63.7 ± 0.482.0 ± 0.9176.9 ± 0.619.547.2
PLA/3MWCNT/20PPG_s54.2 ± 2.286.9 ± 5.3170.3 ± 0.52.948.2
PLA/3MWCNT/20PPG50.4 ± 10.785.6 ± 0.8172.7 ± 0.320.750.9
Table 6. E′, E″, and tan δ peak for neat PLA and composites.
SampleAt 0 °CTemperature of tan δ Peak (°C)Temperature of E″ Maximum (°C)
E′ (GPa)E″ (MPa)
PLA4.024.766.460.9
PLA/20PPG1.792.952.533.8
PLA/2MWCNT_s5.133.271.561.4
PLA/2MWCNT/20PPG_s3.4121.357.738.8
PLA/3MWCNT_s6.741.473.763.0
PLA/3MWCNT/20PPG_s2.7110.657.133.2
Publisher’s Note: MDPI stays neutral with regard to jurisdictional claims in published maps and institutional affiliations.

