
Using Attenuated Total Reflection (ATR) Apparatus to Investigate the Temperature Dependent Dielectric Properties of Water, Ice, and Tissue-Representative Fats


 ,
,  and
and
Abstract
1. Introduction
Overview
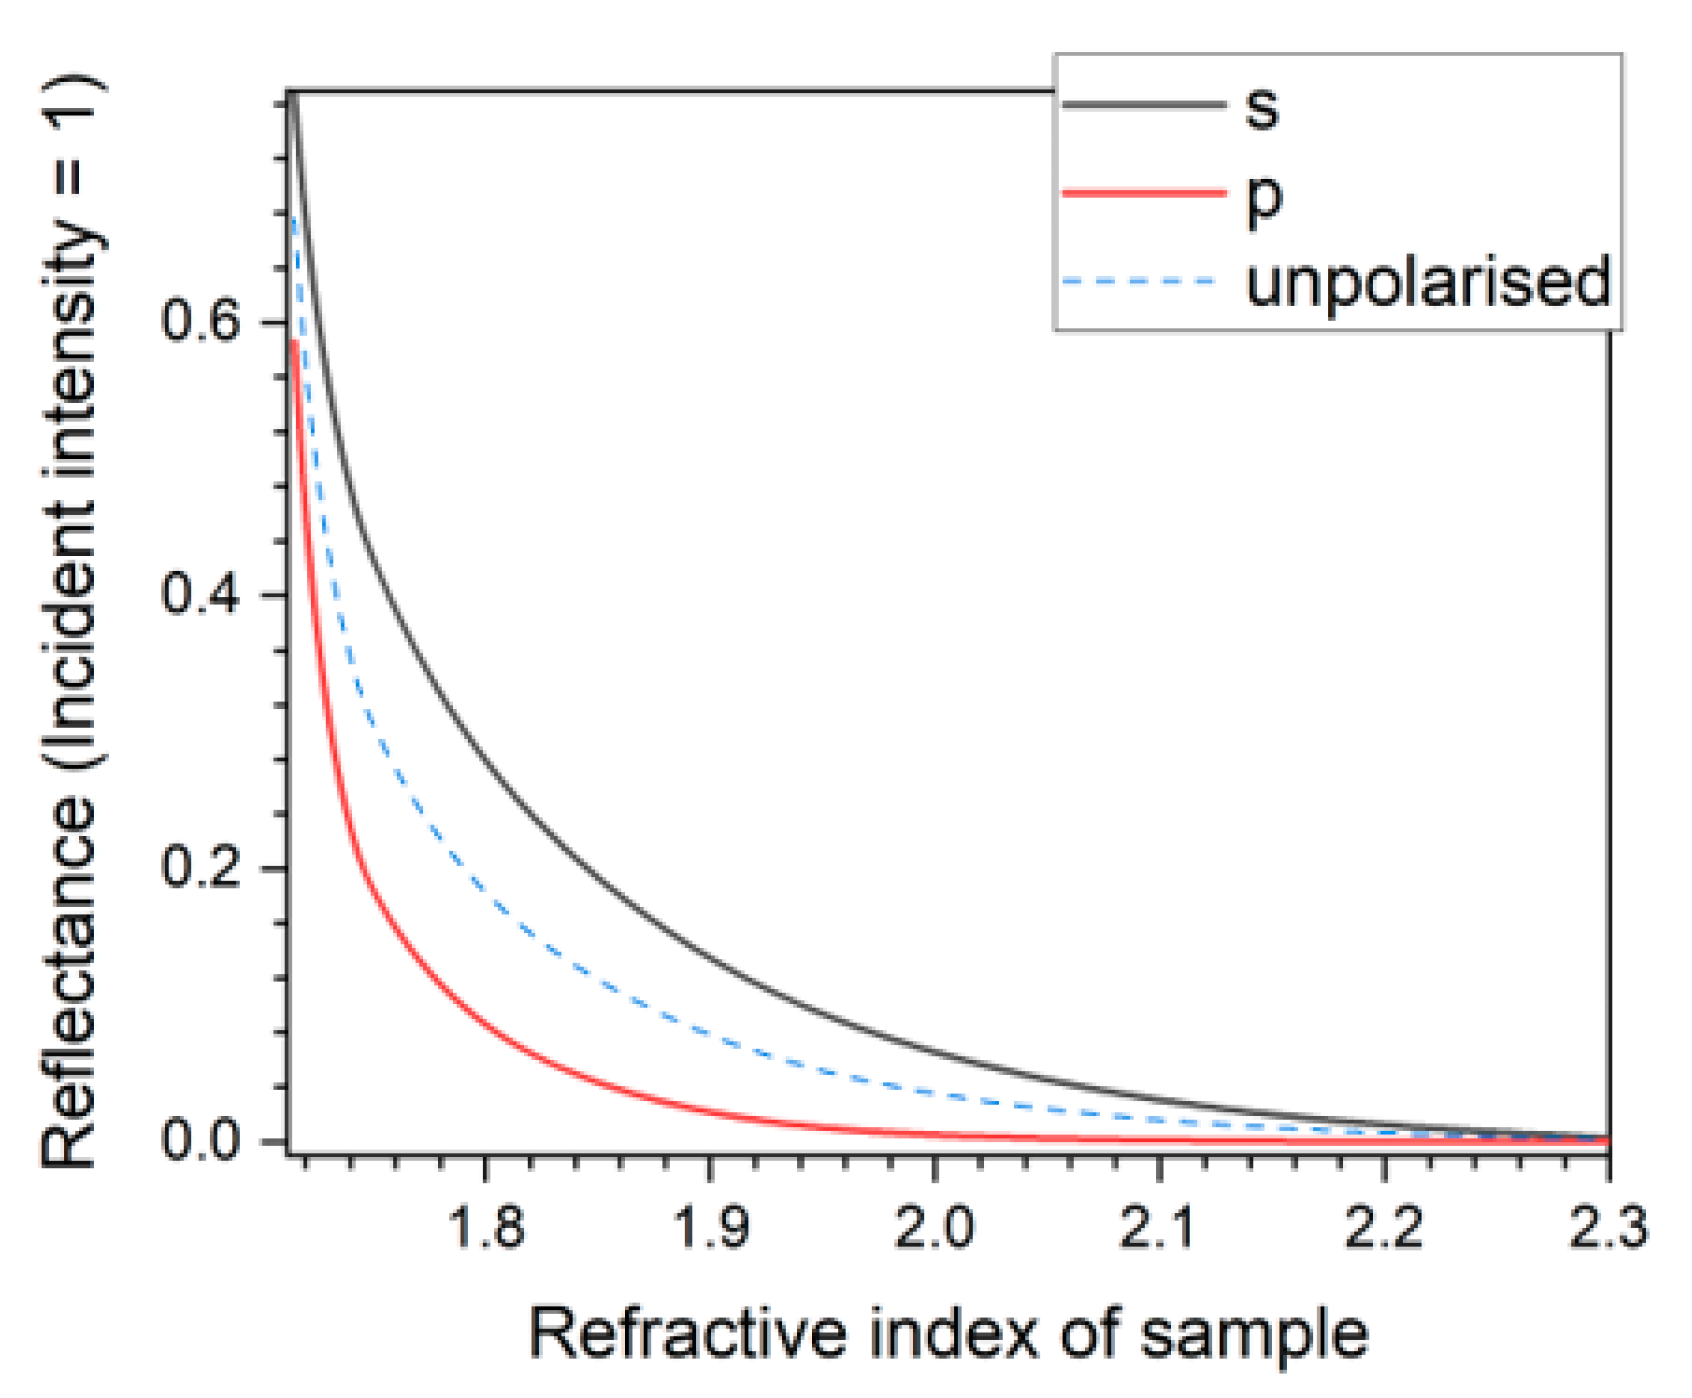
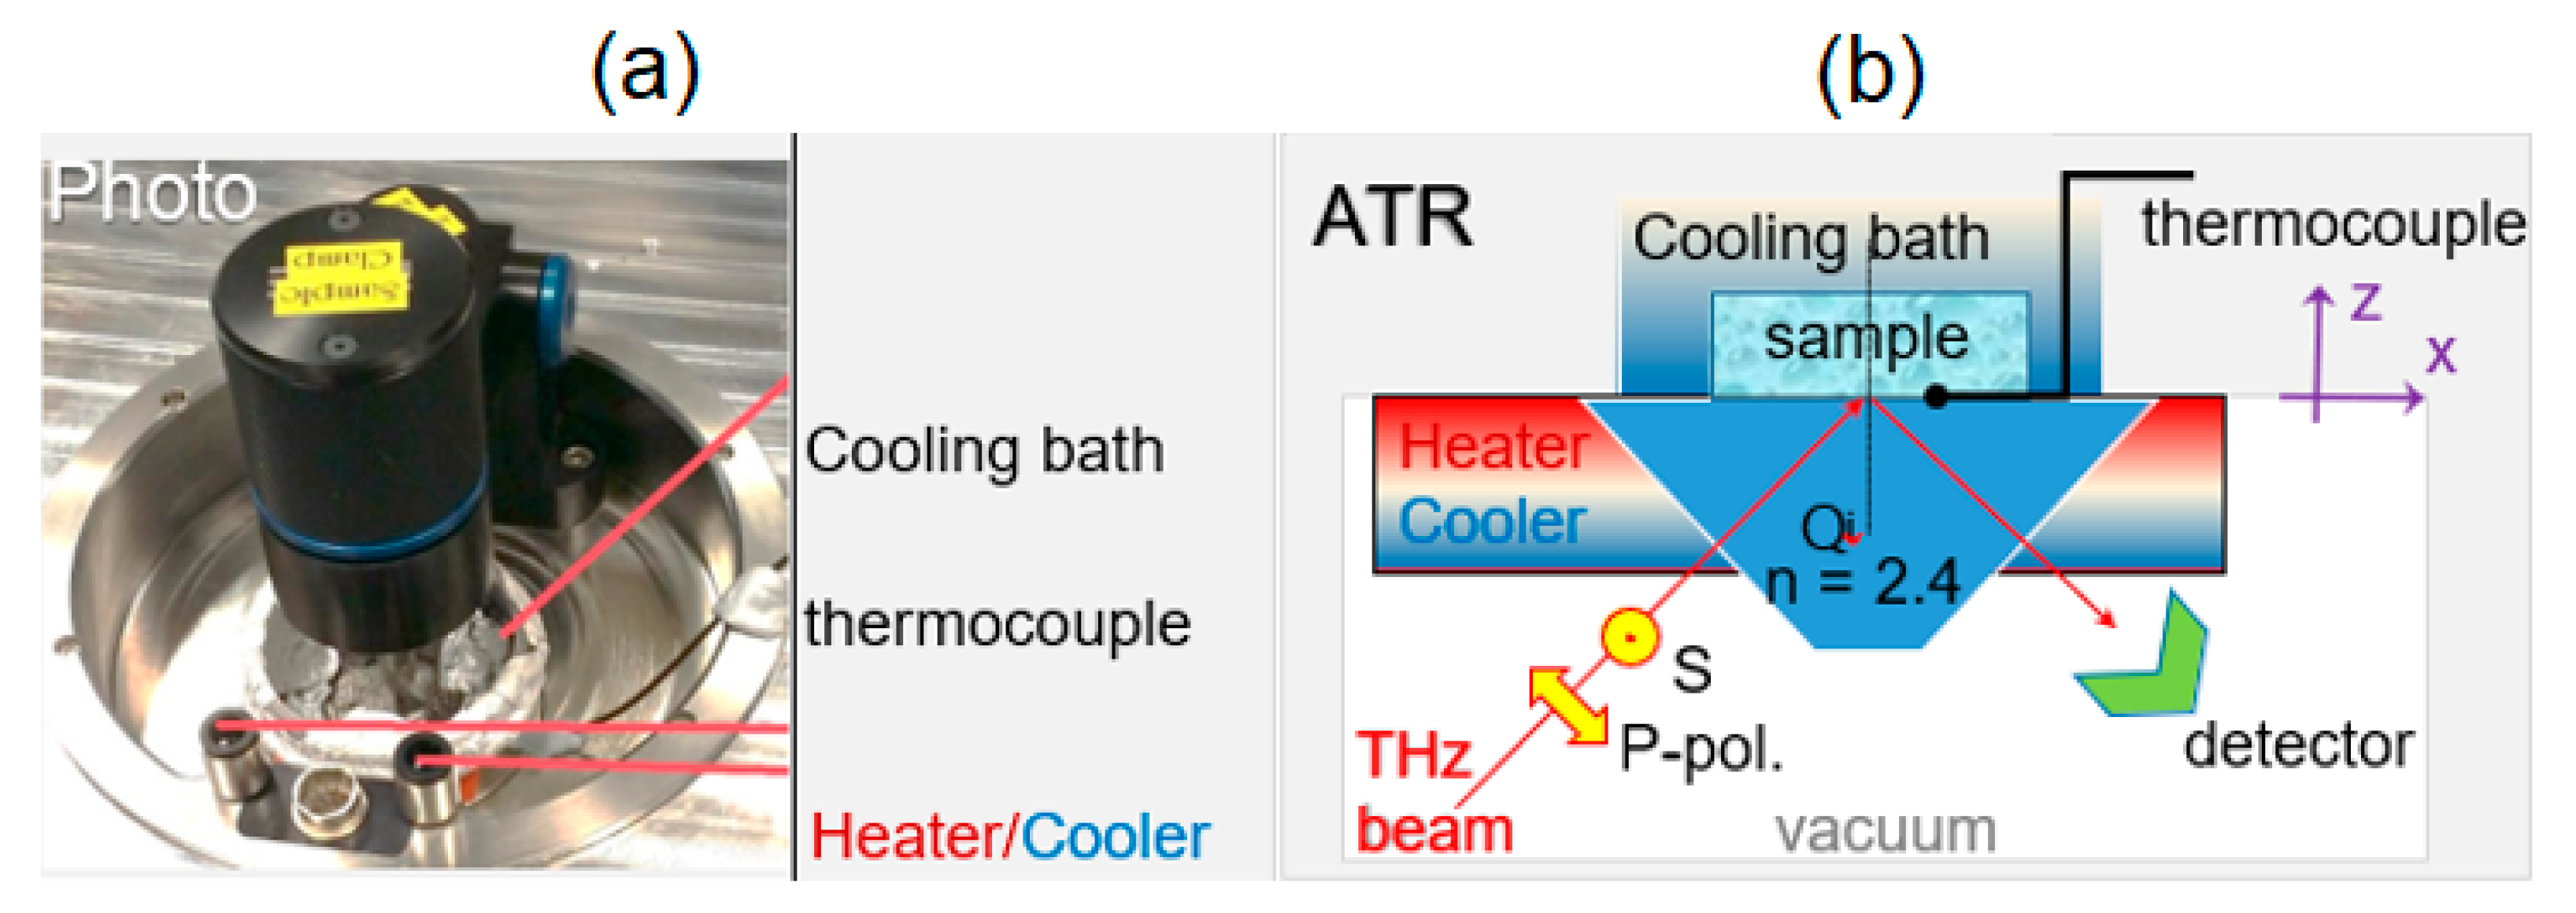
2. Attenuated Total Reflection
3. Materials and Methods
4. Results
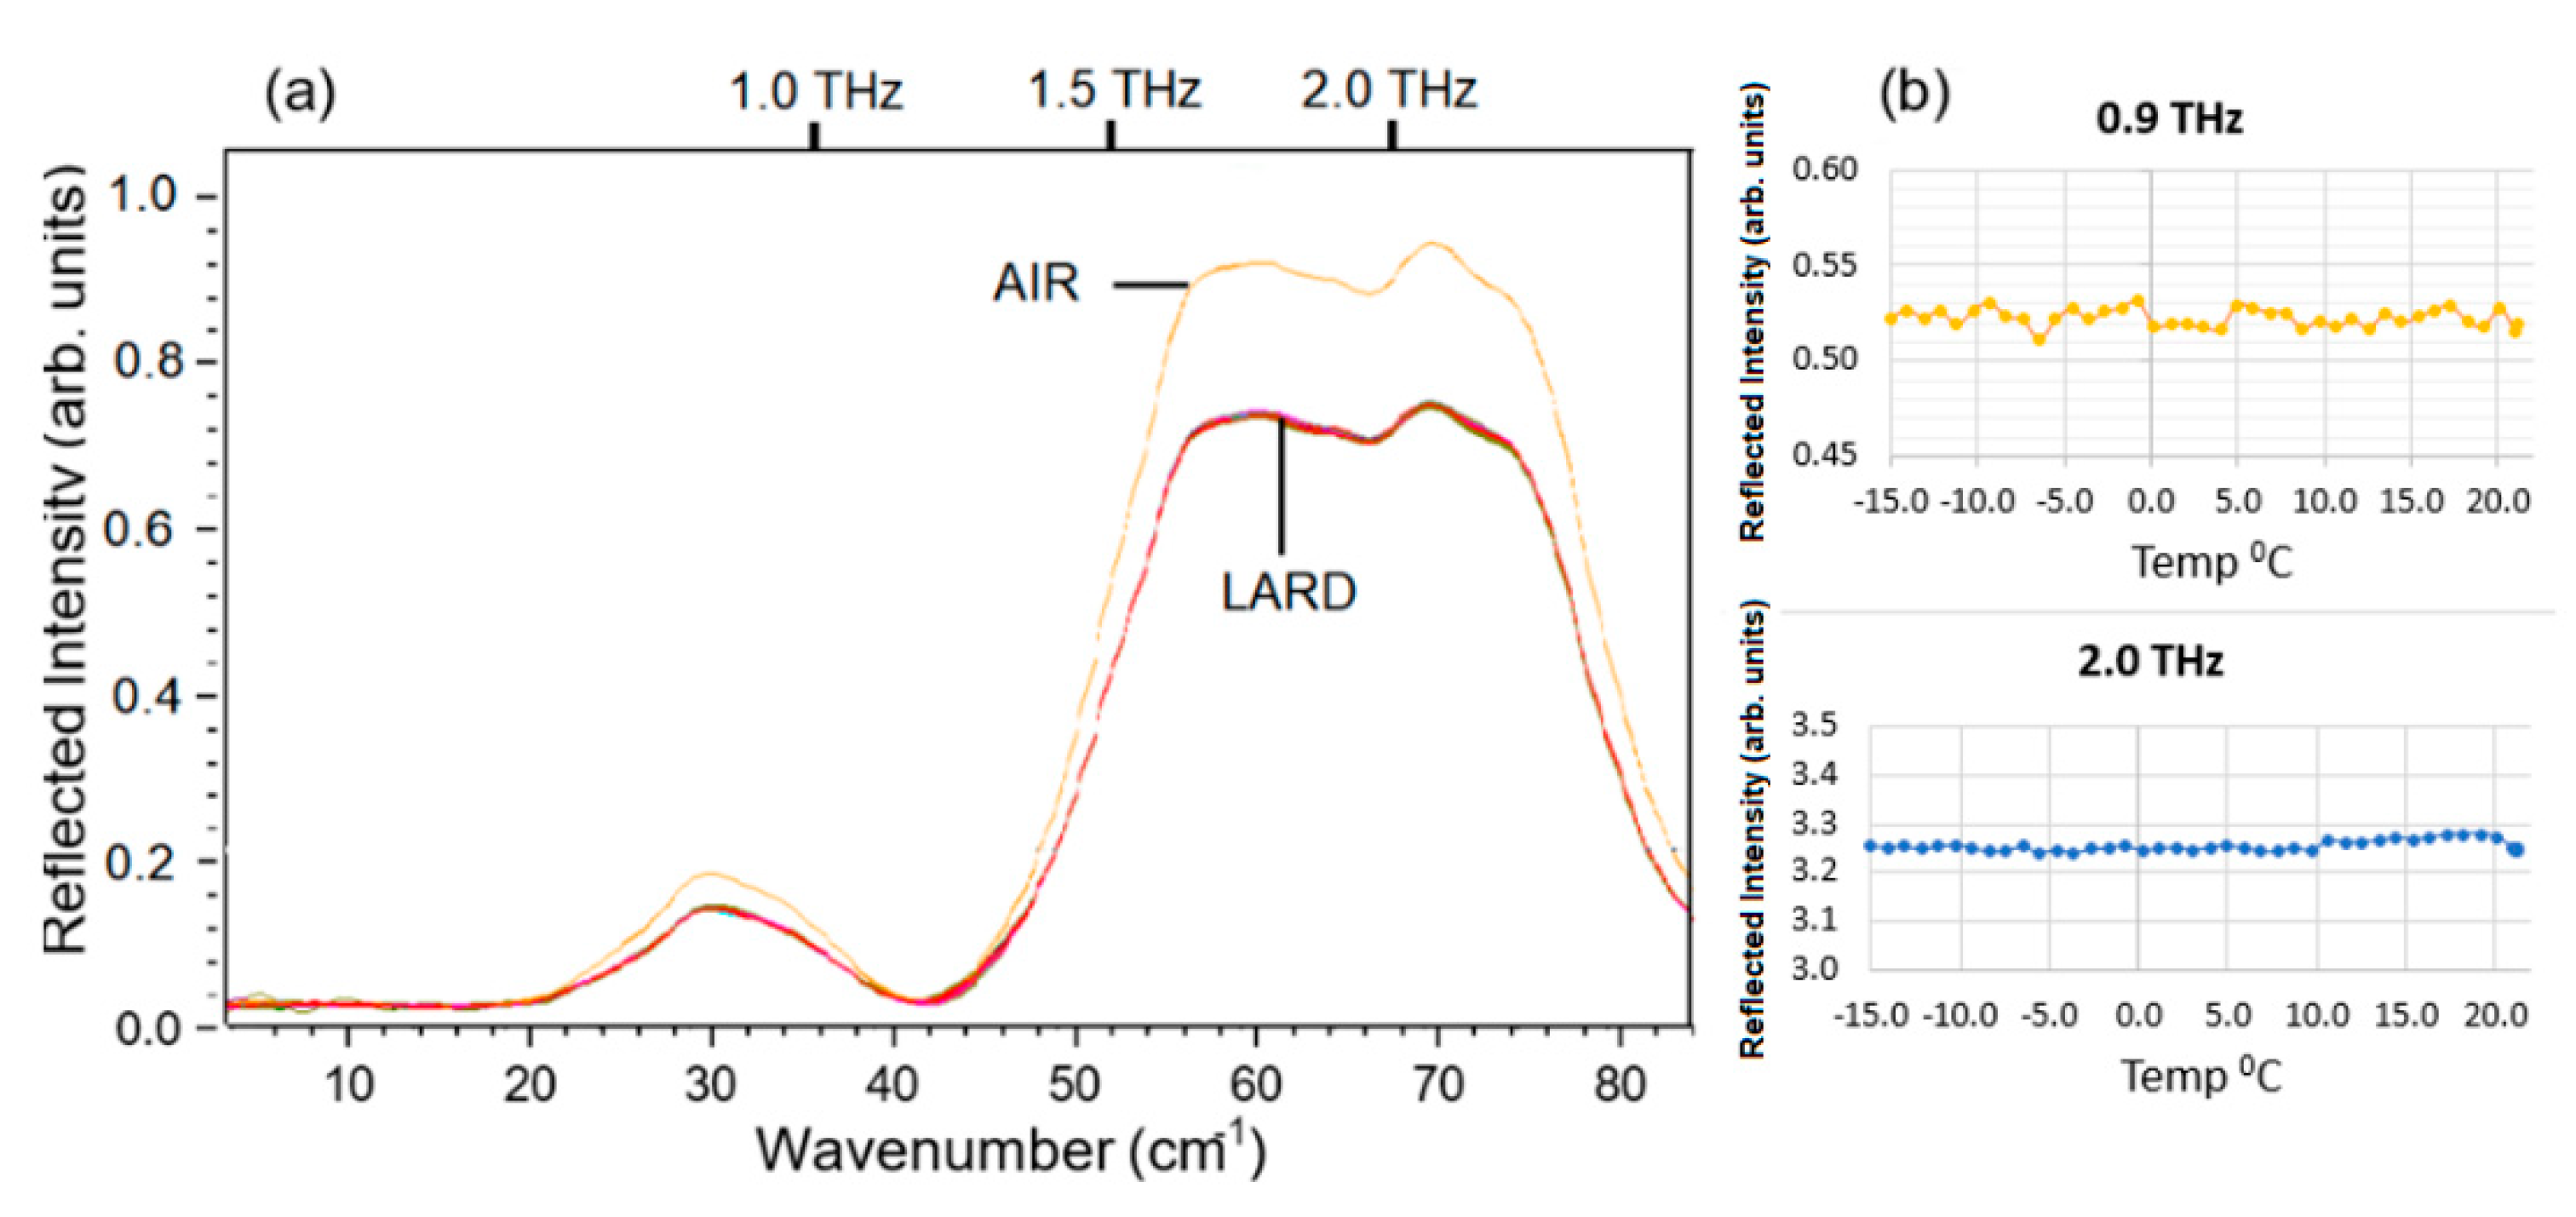
4.1. Air
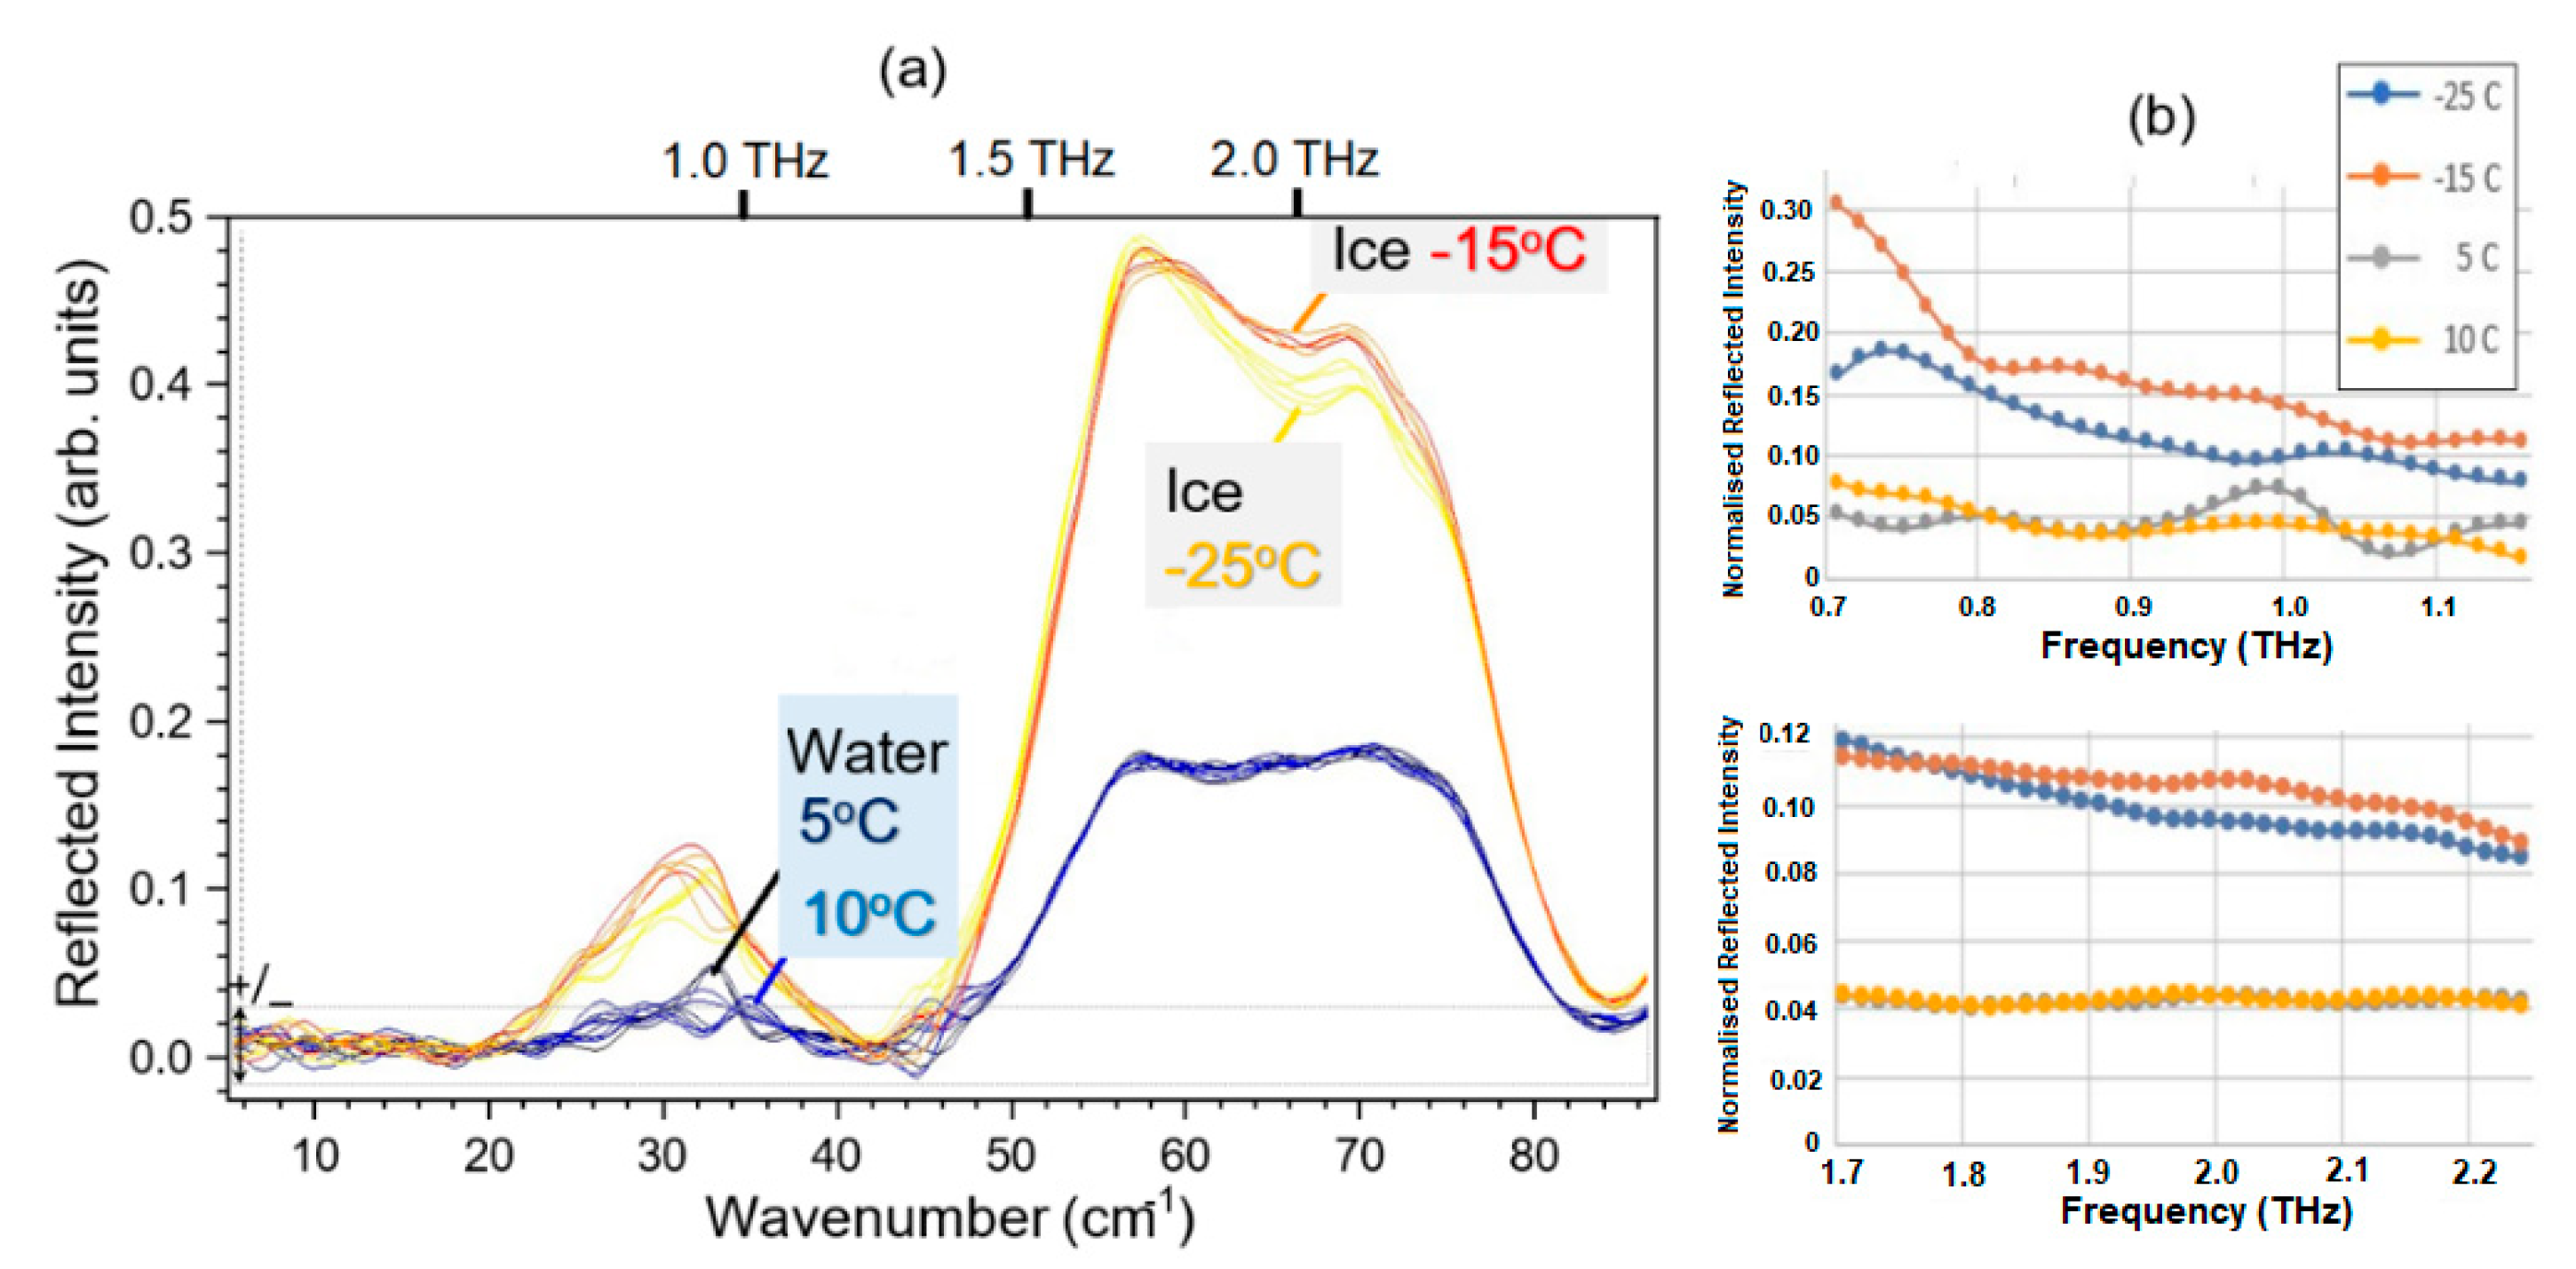
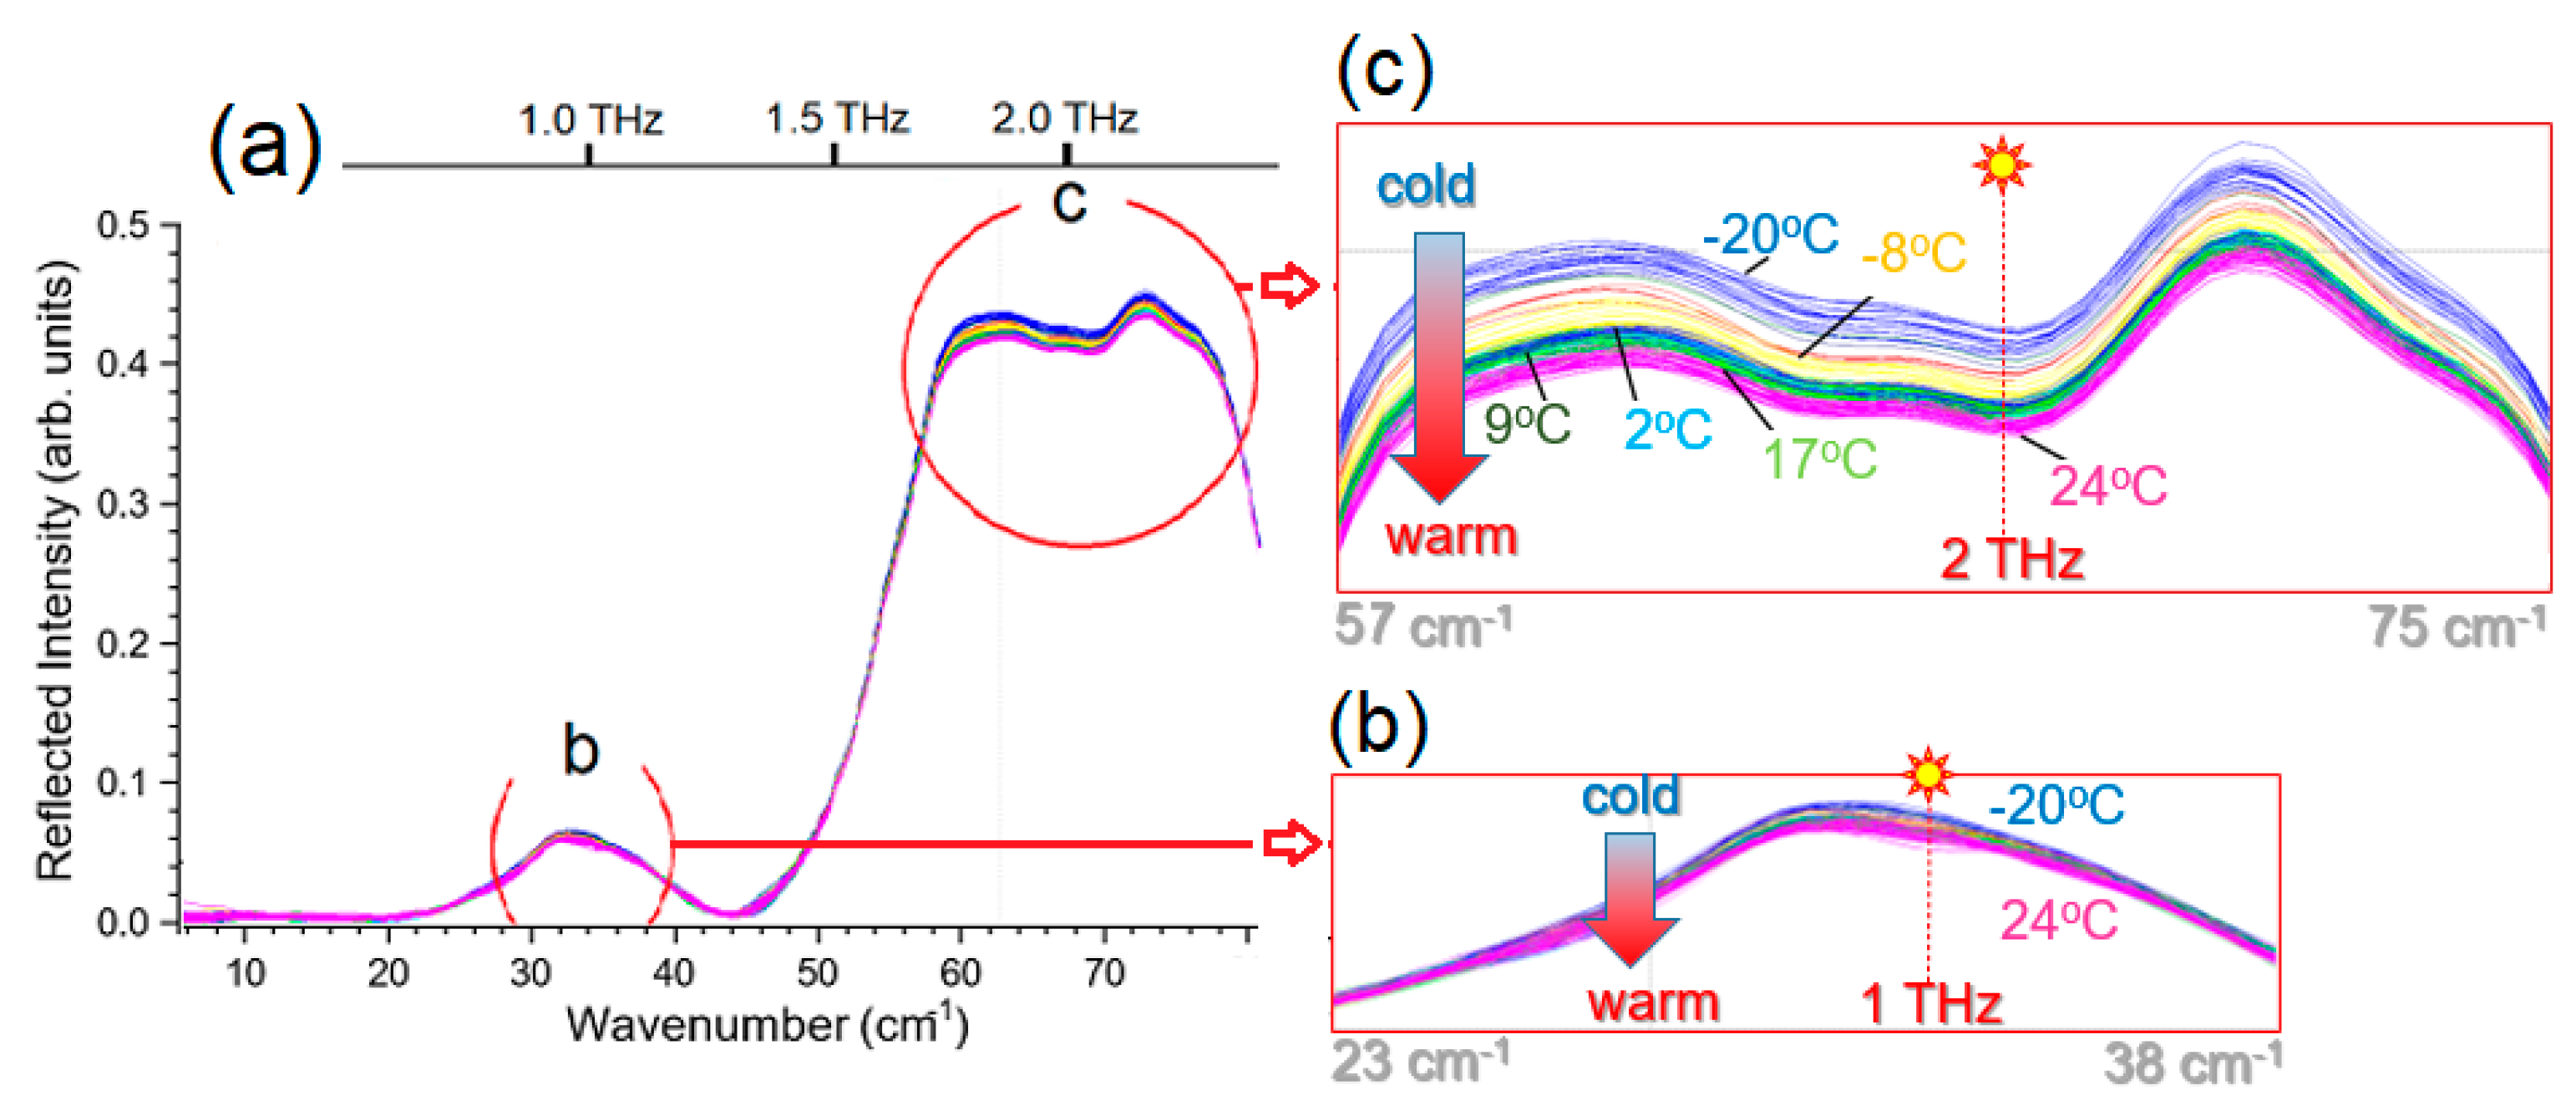
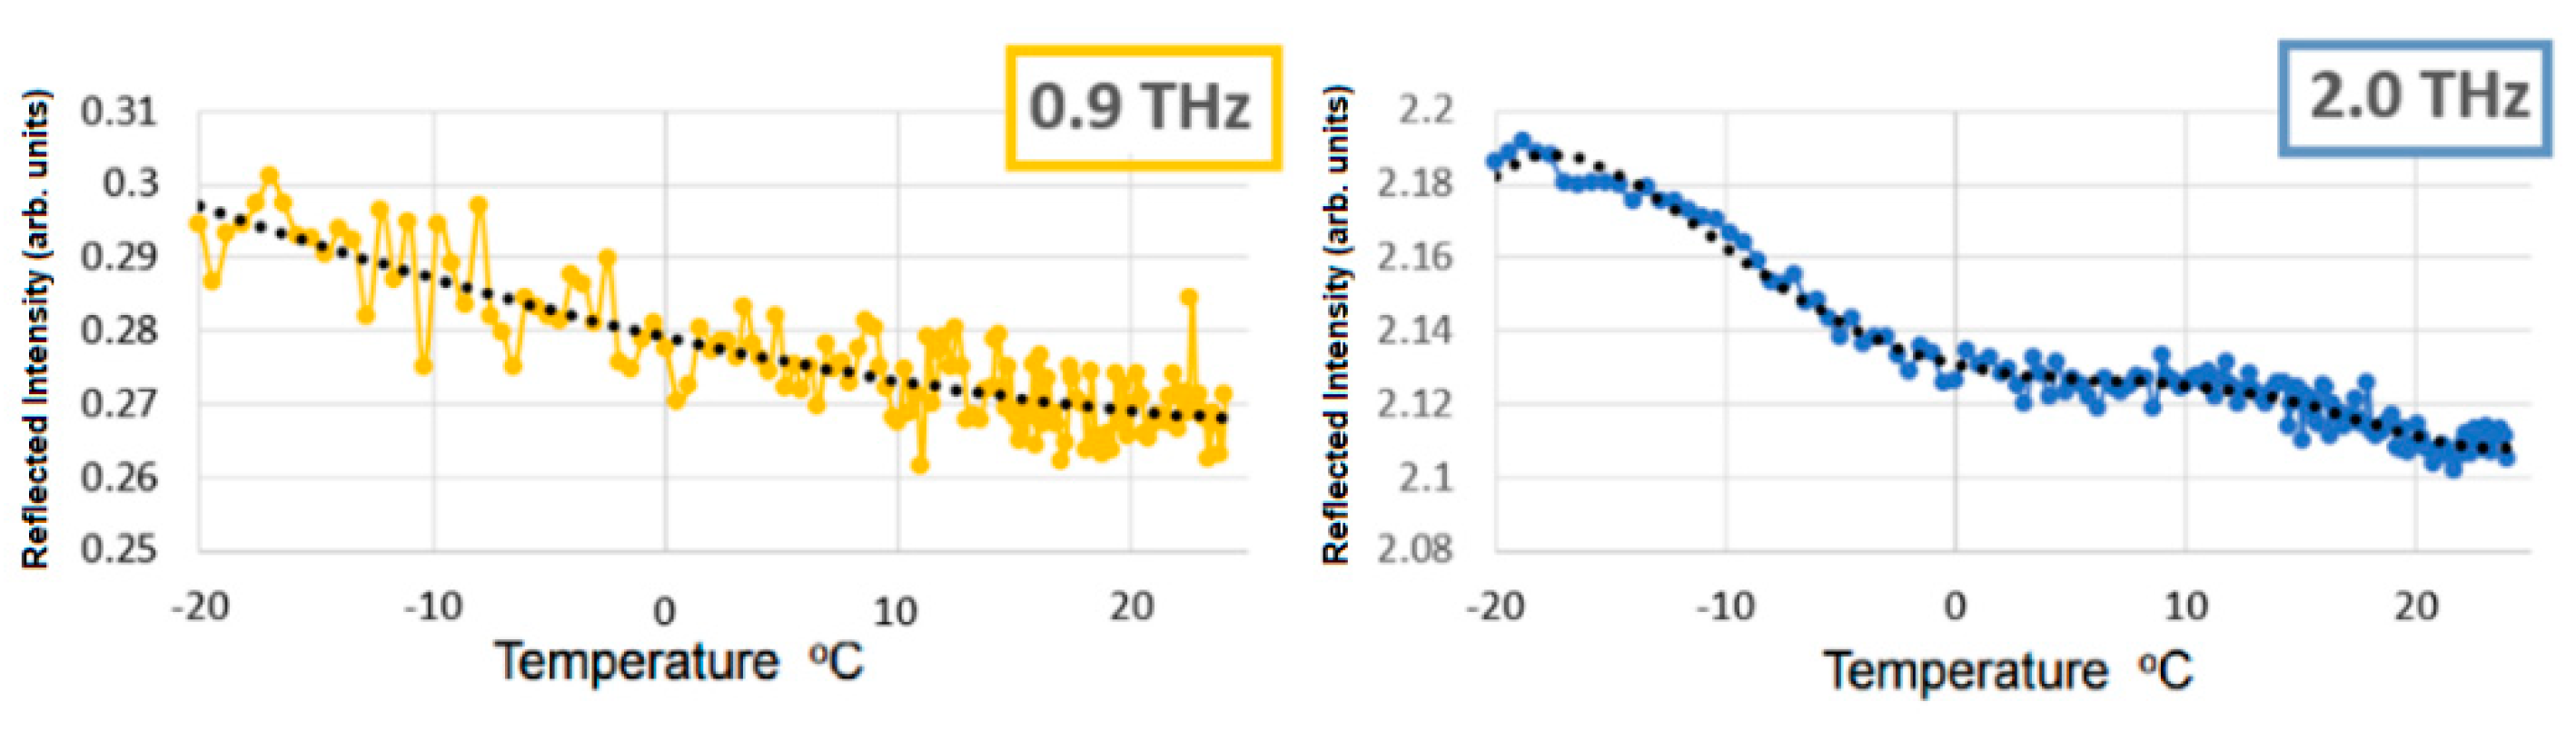
4.2. Water and Ice
4.3. Rendered Porcine Lard
4.4. Lurpak® Butter
5. Discussion
6. Conclusions and Outlook
Author Contributions
Funding
Institutional Review Board Statement
Informed Consent Statement
Data Availability Statement
Acknowledgments
Conflicts of Interest
References
- Vilagosh:, Z.; Lajevardipour, A.; Wood, A.W. Computational phantom study of frozen melanoma imaging at 0.45 terahertz. Bioelectromagnetics 2019, 40, 118–127. [Google Scholar] [CrossRef] [PubMed]
- Wallace, V.P.; Fitzgerald, A.J.; Pickwell, E.; Pye, R.J.; Taday, P.F.; Flanagan, N.; Ha, T. Terahertz pulsed spectroscopy of human basal cell carcinoma. Appl. Spectrosc. 2006, 60, 1127–1133. [Google Scholar] [CrossRef]
- Ashworth, P.C.; Pickwell-MacPherson, E.; Provenzano, E.; Pinder, S.E.; Purushotham, A.D.; Pepper, M.; Wallace, V.P. Terahertz pulsed spectroscopy of freshly excised human breast cancer. Opt. Express 2009, 17, 12444–12454. [Google Scholar] [CrossRef]
- Fitzgerald, A.J.; Wallace, V.P.; Pinder, S.E.; Purushotham, A.D.; O’Kelly, P.; Ashworth, P.C. Classification of terahertz-pulsed imaging data from excised breast tissue. J. Biomed. Opt. 2012, 17, 016005. [Google Scholar] [CrossRef] [PubMed]
- Gavdush, A.; Chernomyrdin, N.; Komandin, G.; Dolganova, I.N.; Nikitin, P.V.; Musina, G.R.; Katyba, G.M.; Kucheryavenko, A.S.; Reshetov, I.V.; Potapov, A.; et al. Terahertz dielectric spectroscopy of human brain gliomas and intact tissues ex vivo: Double-Debye and double-overdamped-oscillator models of dielectric response. Biomed. Opt. Express 2021, 12, 69. [Google Scholar] [CrossRef] [PubMed]
- Vilagosh, Z.; Lajevardipour, A.; Appadoo, D.; Ng, S.H.; Juodkazis, S.; Wood, A.W. Char-acterisation of Biological Materials at THz Frequencies by Attenuated Total Reflection: Lard. Appl. Sci. 2020, 10, 8692. [Google Scholar] [CrossRef]
- Lee, K.; Jeoung, K.; Kim, S.H.; Ji, Y.-B.; Son, H.; Choi, Y.; Huh, Y.-M.; Suh, J.-S.; Oh, S.J. Measuring water contents in animal organ tissues using terahertz spectroscopic imaging. Biomed. Opt. Express 2018, 9, 1582–1589. [Google Scholar] [CrossRef] [PubMed]
- Baker, G.L. Human Adipose Tissue Composition and Age. Am. J. Clin. Nutr. 1969, 22, 829–835. [Google Scholar] [CrossRef]
- Provyn, S.; Clarys, J.P.; Wallace, J.; Scafoglieri, A.; Reilly, T. Quality Control, Accuracy, and Prediction Capacity of Dual Energy X-ray Absorptiometry Variables and Data Acquisition. J. Physiol. Anthr. 2008, 27, 317–323. [Google Scholar] [CrossRef]
- Gniadecka, M.; Nielsen, O.; Wulf, H. Water content and structure in malignant and benign skin tumours. J. Mol. Struct. 2003, 661–662, 405–410. [Google Scholar] [CrossRef]
- Sim, Y.C.; Park, J.Y.; Ahn, K.-M.; Park, C.; Son, J.-H. Terahertz imaging of excised oral cancer at frozen temperature. Biomed. Opt. Express 2013, 4, 1413–1421. [Google Scholar] [CrossRef]
- He, Y.; Ung, B.S.-Y.; Parrott, E.P.J.; Ahuja, A.T.; Pickwell-MacPherson, E. Freeze-thaw hysteresis effects in terahertz imaging of biomedical tissues. Biomed. Opt. Express 2016, 7, 4711–4717. [Google Scholar] [CrossRef] [PubMed]
- Yanina, I.Y.Y.; Nikolaev, V.; Zakharova, O.A.; Borisov, A.; Dvoretski, K.N.; Berezin, K.V.; Kochubey, V.I.; Kistenev, Y.V.; Tuchin, V.V. Measurement and modeling of optical properties of heated adipose tissue in the terahertz range. Terahertz Photonics 2020, 11348, 1134817. [Google Scholar] [CrossRef]
- Hasted, J.; Husain, S.; Frescura, F.; Birch, J. The temperature variation of the near millimetre wavelength optical constants of water. Infrared Phys. 1987, 27, 11–15. [Google Scholar] [CrossRef]
- Liebe, H.; Hufford, G.; Manabe, T. A model for the complex permittivity of water at fre-quencies below 168 1 THz. Int. J. Infrared Millim. Waves 1991, 12, 659–675. [Google Scholar] [CrossRef]
- Zhang, C.; Lee, K.-S.; Zhang, X.-C.; Wei, X.; Shen, Y. THz spectroscopy of ice. Lasers Electro Opt. Soc. IEEE 2002, 2, 646–647. [Google Scholar]
- Woodward, R.M.; E Cole, B.; Wallace, V.P.; Pye, R.J.; Arnone, D.D.; Linfield, E.H.; Pepper, M. Terahertz pulse imaging in reflection geometry of human skin cancer and skin tissue. Phys. Med. Biol. 2002, 47, 3853–3863. [Google Scholar] [CrossRef] [PubMed]
- Ashworth, P.; Zeitler, J.; Pepper, M.; Wallace, V. Terahertz spectroscopy of biologically relevant liquids at 175 low temperatures. In Proceedings of the Infrared Millimeter Waves and 14th International Conference on Teraherz Electronics, Shanghai, China, 18–22 September 2006; p. 184. [Google Scholar]
- Hansen, W.N. Expanded formulas for attenuated total reflection and the derivation of ab-sorption rules for single and multiple ATR spectrometer cells. Spectrochim. Acta 1965, 21, 815–833. [Google Scholar] [CrossRef]
- Ramer, G.; Lendl, B. Attenuated Total Reflection Fourier Transform Infrared Spectroscopy. In Encyclopedia of Analytical Chemistry: Online; John Wiley and Sons, Ltd.: Berlin, Germany, 2013. [Google Scholar]
- Dai, J.; Zhang, J.; Zhang, W.; Grischkowsky, D. Terahertz time-domain spectroscopy char-acterization of the far-infrared absorption and index of refraction of high-resistivity, float-zone silicon. JOSA B 2004, 21, 1379–1386. [Google Scholar] [CrossRef]
- Kubarev, V.V. Optical properties of CVD-diamond in terahertz and infrared ranges. Nucl. Instrum. Methods Phys. Res. Sect. A Accel. Spectrometers De-tectors Assoc. Equip. 2009, 603, 22–24. [Google Scholar] [CrossRef]
- Amma, S.I.; Luo, J.; Pantano, C.G.; Kim, S.H. Specular reflectance (SR) and attenuated total reflectance (ATR) infrared (IR) spectroscopy of transparent flat glass surfaces: A case study for soda lime float glass. J. Non-Cryst. Solids 2015, 428, 189–196. [Google Scholar] [CrossRef]
- Møller, U.; Folkenberg, J.R.; Jepsen, P.U. Dielectric Properties of Water in Butter and Water—AOT—Heptane Systems Measured Using Terahertz Time-Domain Spectroscopy. Appl. Spectrosc. 2010, 64, 1028–1036. [Google Scholar] [CrossRef] [PubMed]
- Reid, C.B.; Pickwell-MacPherson, E.; Laufer, J.G.; Gibson, A.P.; Hebden, J.C.; Wallace, V.P. Accuracy and resolution of THz reflection spectroscopy for medical imaging. Phys. Med. Biol. 2010, 55, 4825–4838. [Google Scholar] [CrossRef] [PubMed]
- Ryu, M.; Linklater, D.P.; Hart, W.; Balcytis, A.; Skliutas, E.; Malinauskas, M.; Appadoo, D.; Tan, Y.-R.E.; Ivanova, E.P.; Morikawa, J.; et al. 3D printed polarizing grids for IR-THz synchrotron radiation. J. Opt. 2018, 20, 035101. [Google Scholar] [CrossRef]
- Rohman, A.; Triyana, K.; Erwanto, Y. Differentiation of lard and other animal fats based on triacylglycerols composition and principal component analysis. Int. Food Res. J. 2012, 19, 475–479. [Google Scholar]


| Frequency | α | n1 | n2 | S-Pol. | Reflectance | Non-Pol. | |
|---|---|---|---|---|---|---|---|
| THz | cm−1 | Silicon | Sample | P-Pol. | |||
| water | 0.9 | 190 | 3.42 | 2.10 | 0.60 | 0.36 | 0.48 |
| ice | 0.9 | 10 | 3.42 | 1.78 | 0.74 | 0.55 | 0.65 |
| water | 2.0 | 300 | 3.42 | 1.95 | 0.53 | 0.28 | 0.41 |
| ice | 2.0 | 50 | 3.42 | 1.78 | 0.55 | 0.30 | 0.42 |
| abs coef. (α) cm−1 | 10 | 35 | 65 | 10 | 35 | 65 |
| frequency THz | 0.3 | 0.3 | 0.3 | 1.0 | 1.0 | 1.0 |
| sample ref index (n2) | 1.62 | 1.28 | 1.00 | 1.62 | 1.28 | 1.00 |
| diamond ref index (n1) | 2.40 | 2.40 | 2.40 | 2.40 | 2.40 | 2.40 |
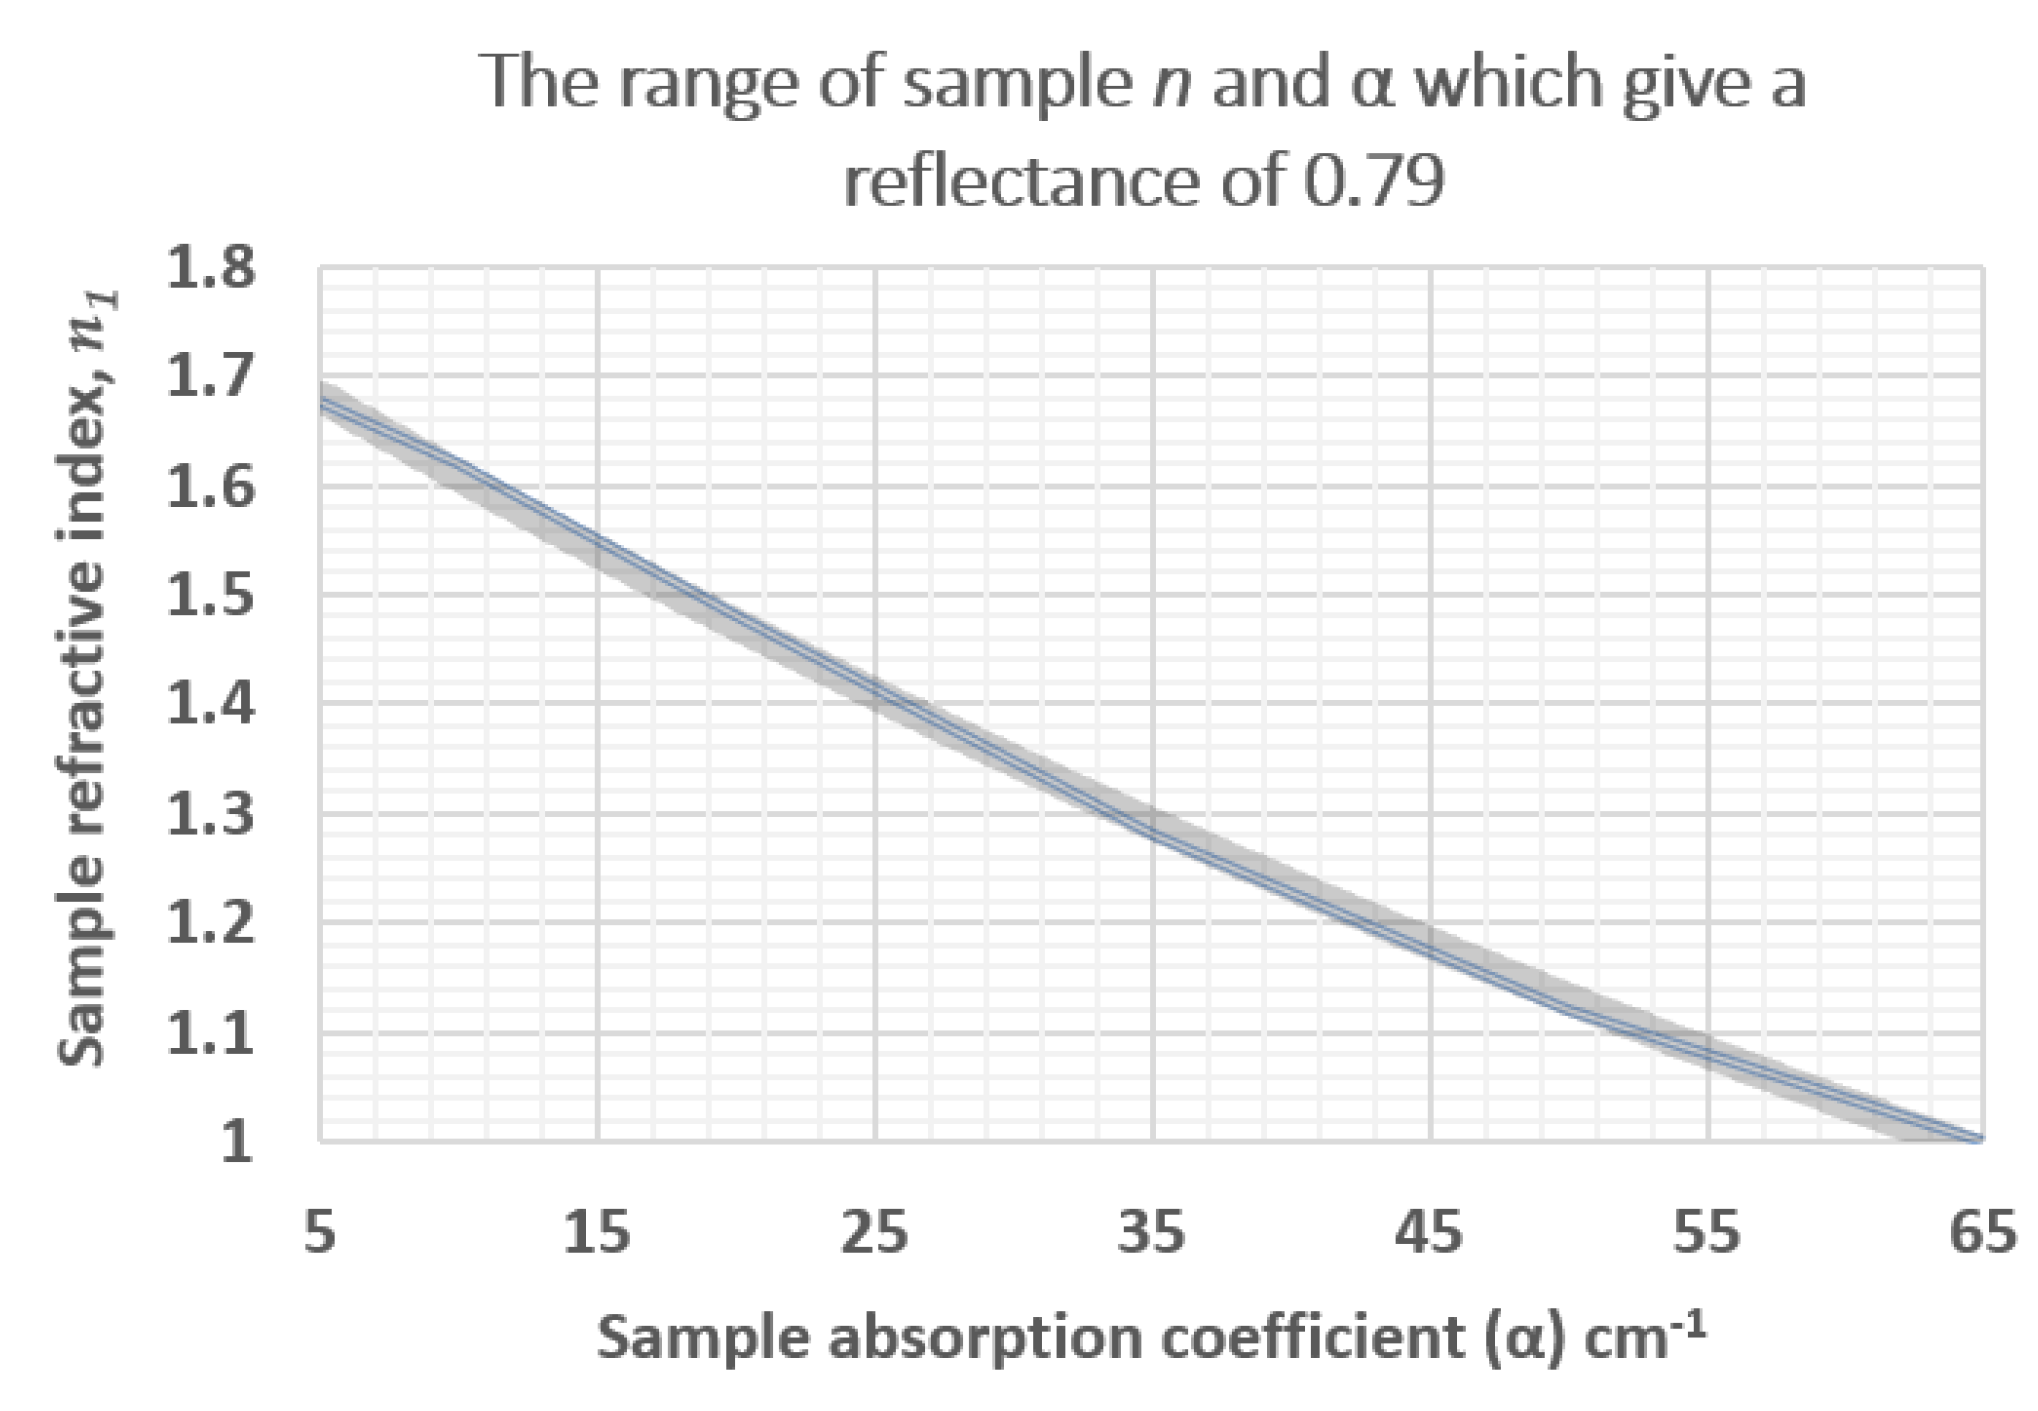
| reflected intensity (non-pol) | 0.49 | 0.50 | 0.52 | 0.79 | 0.79 | 0.79 |
| Frequency | n | Reflectance | |||
|---|---|---|---|---|---|
| THz | S-Polarised | P-Polarised | Non-Polarised | ||
| water | 0.9 | 2.10 | 0.0092 | 0.000085 | 0.0046 |
| ice | 0.9 | 1.78 | 0.27 | 0.073 | 0.17 |
| water | 2.0 | 1.95 | 0.076 | 0.0059 | 0.041 |
| ice | 2.0 | 1.78 | 0.27 | 0.073 | 0.017 |
| ice | 2.0 | 1.82 | 0.20 | 0.040 | 0.012 |
| Predicted | Experiment | Experiment | ||
|---|---|---|---|---|
| 0.9 THz | with n = 1.78 | −25 °C | −15 °C | |
| 0.17 | 0.15 | 0.11 | ||
| 2.0 THz | with n = 1.78 | with n = 1.82 | ||
| 0.17 | 0.12 | 0.095 | 0.11 |
Publisher’s Note: MDPI stays neutral with regard to jurisdictional claims in published maps and institutional affiliations. |
© 2021 by the authors. Licensee MDPI, Basel, Switzerland. This article is an open access article distributed under the terms and conditions of the Creative Commons Attribution (CC BY) license (http://creativecommons.org/licenses/by/4.0/).
Share and Cite
Vilagosh, Z.; Lajevardipour, A.; Appadoo, D.; Juodkazis, S.; Wood, A.W. Using Attenuated Total Reflection (ATR) Apparatus to Investigate the Temperature Dependent Dielectric Properties of Water, Ice, and Tissue-Representative Fats. Appl. Sci. 2021, 11, 2544. https://doi.org/10.3390/app11062544
Vilagosh Z, Lajevardipour A, Appadoo D, Juodkazis S, Wood AW. Using Attenuated Total Reflection (ATR) Apparatus to Investigate the Temperature Dependent Dielectric Properties of Water, Ice, and Tissue-Representative Fats. Applied Sciences. 2021; 11(6):2544. https://doi.org/10.3390/app11062544
Chicago/Turabian StyleVilagosh, Zoltan, Alireza Lajevardipour, Dominique Appadoo, Saulius Juodkazis, and Andrew W. Wood. 2021. "Using Attenuated Total Reflection (ATR) Apparatus to Investigate the Temperature Dependent Dielectric Properties of Water, Ice, and Tissue-Representative Fats" Applied Sciences 11, no. 6: 2544. https://doi.org/10.3390/app11062544
APA StyleVilagosh, Z., Lajevardipour, A., Appadoo, D., Juodkazis, S., & Wood, A. W. (2021). Using Attenuated Total Reflection (ATR) Apparatus to Investigate the Temperature Dependent Dielectric Properties of Water, Ice, and Tissue-Representative Fats. Applied Sciences, 11(6), 2544. https://doi.org/10.3390/app11062544