Featured Application
The scheme proposed in this paper will be applied to the fire protection of the cables in service in an oil storage company.
Abstract
Improving the fire resistance of the key cables connected to firefighting and safety equipment is of great importance. Based on the engineering practice of an oil storage company, this study proposes a modification scheme that entails spraying fire-retardant coatings on the outer surface of a cable tray to delay the failure times of the cables in the tray. To verify the effect, 12 specimens were processed using five kinds of fire-retardant coatings and two kinds of fire-resistant cotton to coat the cable tray. The specimens were installed in the vertical fire resistance test furnace. For the ISO 834 standard fire condition, a fire resistance test was carried out on the specimens. The data for the surface temperature and the insulation resistance of the cables in trays were collected, and the fireproof effect was analyzed. The results showed that compared with the control group, the failure time of the cable could be delayed by 1.57–14.86 times, and the thicker the fire-retardant coatings were, the better the fireproof effect was. In general, the fire protection effect of the fire-retardant coating was better than that of the fire-resistant cotton.
1. Introduction
As an electrical product for transmitting electricity, information, and electromagnetic energy, cables have been widely used in various areas of the modern economy, which is the basic guarantee for the normal operation of the modern economy and society.
As the insulation and the sheathing of cables are generally made of plastic or rubber and other flammable materials, they can easily be damaged under high temperature conditions [1]. For example, the fire accident in the Dalian’s oil depot on 16 July 2010 caused damage to the power supply lines and distribution rooms at the initial stage of the fire. All the low-voltage power supply was interrupted, so all of the oil tank emergency shut-off valves could not be electrically shut off. The manual operation of the electric valve was slow and dangerous, which caused great difficulties in firefighting [2,3]. Therefore, in the case of fire, some key cables connected to the firefighting and safety equipment became the weak point of the emergency system. Therefore, it is of great significance to improve the fire resistance of such key cables [4,5].
There are two common methods to improve the fire resistance of key lines: one is to use fire-resistant cables, and the other is to bury the cable [6]. These two methods are not suitable for the existing cables that have already been laid. The amount of work and economic loss caused by shutdown construction is large, and the second method is not convenient for the maintenance and replacement of individual cables. Therefore, it is necessary to consider other schemes for the fire-resistant transformation of a cable system.
At present, the research on cable fires mainly focuses on the combustion characteristics of a cable. These articles describe the carrying out of experiments or numerical simulations on the propagation direction and velocity of the flame on a cable, the combustion temperature distribution, toxic gas diffusion, and other parameters, and they reveal the characteristics of cable fire [7,8,9,10,11,12,13,14]. Some experimental research studies and numerical calculations about cable failure have mainly focused on the direct fire protection of cables [15,16,17,18,19,20,21,22]. Polanský et al. [15] used fire barriers made from mica glass tape and from ceramifiable silicone rubber to protect cables and to monitor the insulation state of cables during fire testing. This study provided ideas for the fire-resistant design of cable insulation sheaths, and it proved that it was appropriate to judge the state of cables by measuring the insulation resistance of cables. Ji Wang et al. [16] studied the insulation failure time of VV cables and ZC-YJV cables coated with different thicknesses of fire-retardant coatings under standard fire conditions. The results showed that the application of fire-retardant coating could delay the insulation failure time of a cable when heated. Ji Wang et al. [17] also studied the relationship between the thickness of a fire-retardant coating and the failure time when a cable was directly coated with the fire-retardant coating. The results showed that the failure time increased with the increase of the coating thickness. However, the cable failed in less than 10 min in the experiment. Therefore, the method of directly coating fire-retardant coating onto the cable surface could delay the failure time of the cable, but the time was not enough. Zhongjun Shu et al. [23] considered using different conduits to protect cables. The results showed that when the heat flux of the environment was low, the protection effect of the threading flame retardant polyvinyl chloride (PVC) conduits was slightly better than that of metal conduits, and when the heat flux was high, the result was the opposite.
Through previous field investigation in an oil storage company, it was found that most of the cables in the fire dike of the company’s oil tank area were laid in cable trays. Therefore, according to the previous research results and engineering practice, this paper proposes coating the fire-retardant coatings on cable trays to delay the failure time of the cables in trays. There are few relevant regulations and reference data about the type and thickness of fire-retardant coatings used in this fire protection method. Although fire-resistant cable trays coated with fire-retardant coatings have been produced and sold by some manufacturers, there is little research on the protective effect of such trays on cables. The relevant standards GA 479-2004 “Fire resistance cables tray” and GB 29415-2013 “Fire-resistant cable trunk” do not specify the thickness of a fire-retardant coating; they only require that the performance of a fire-retardant coating meets the requirements of GB 14907-2002 “fire-retardant coating for steel structure” [24,25]. Therefore, the standards in this respect need to be further improved [26,27,28].
In this research, for the ISO 834 standard fire condition, a vertical fire resistance test furnace was used to test cable trays coated with different types and thicknesses of fire-retardant coatings. The surface temperature and the insulation resistance changes of cables in trays were collected, and the fire resistance effect was analyzed in order to provide a reference for the fire resistance transformation of the cable tray in service.
2. Materials and Methods
2.1. Materials and Instruments
In the investigation of the oil storage company mentioned above, it was found that the power cable and the control cable used for the emergency shut-off valve of the company were RVV 3*1.5 mm2 and ZA-KVVP 14*1.5 mm2, respectively. In this experiment, the above two kinds of cables were selected for testing. The two kinds of cables were composed of 3 and 14 copper wires, each copper wire was separated by insulating skin, and the cross-sectional area of each copper wire was 1.5 mm2. The two types of cables are shown in Figure 1.
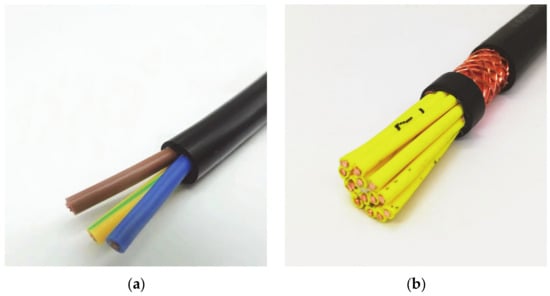
Figure 1.
Photos of cables: (a) RVV 3*1.5 mm2; (b) ZA-KVVP 14*1.5 mm2.
According to the test standard, the cross-section size of the tray was 200 × 100 mm, and the length was 1800 mm [29,30].
Five kinds of fire-retardant coatings were used in this experiment, namely, brand A intumescent fire-retardant coatings for steel structures (water-based), brand B intumescent fire-retardant coatings for steel structures (water-based), brand B intumescent fire-retardant coatings for steel structures (oil-based), and brand C non-intumescent fire-retardant coatings for steel structures. In order to compare with other common fireproof materials, two kinds of fire-resistant cotton with thicknesses of 30 mm and 50 mm were selected. For the convenience of writing, the above materials’ names will be abbreviated according to Table 1.

Table 1.
Abbreviation comparison of the materials’ names.
The parameters of the above materials are shown in Table 2.

Table 2.
Parameters of the materials.
The coating thickness was measured with a Kedian MC-2000 coating thickness gauge. The temperature and the insulation resistance were collected with an Agilent keysight 34970A data acquisition instrument that was set to collect every 10 s. The temperature measurement range of the instrument was 0.000 °C–1200.000 °C, and the insulation resistance measurement range was 1–999,999,999 Ω.
The test furnace that was used was a vertical fire-resistant test furnace with liquefied petroleum gas (LPG) as fuel. The opening size was 4.5 × 3.0 m. The appearance is shown in Figure 2a. Open fire heating was adopted for the fire resistance test. In order to make the specimen subject to the flame act similar to the actual fire, the temperature change in the test furnace referred to the ISO 834 standard fire condition, and the change law met the following functional relationship [31]:
where T is the average furnace temperature at the time of t in (°C), T0 is the initial temperature in the furnace in [°C], which needed to be in the range of 5 °C–40 °C, and t is the time of the test in [min].
T = T0 + 345 log10 (8 t + 1),
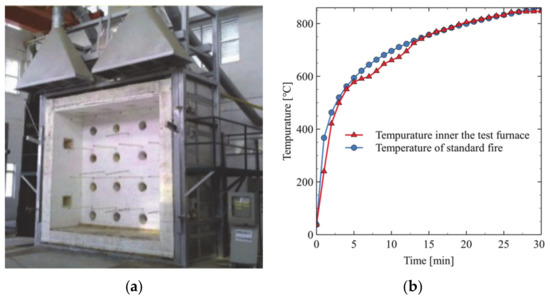
Figure 2.
Vertical fire resistance test furnace: (a) appearance of the test furnace; (b) comparison between furnace temperature test curve and standard fire curve.
Figure 2b shows that the trend of the furnace temperature test curve was generally consistent with the standard fire curve, so it was considered that the experimental results were effective.
2.2. Construction of Specimen
The fire-retardant coatings on the surfaces of the cable trays were constructed according to the construction manual of the corresponding brand. After cleaning and derusting, applying antirust primer, and spraying fire-retardant coatings repeatedly until the target thickness, coating quality detection and repair, and specimen maintenance were achieved, the cable tray specimens coated with fire-retardant coatings were obtained [32,33,34]. For the test group of fire-resistant cotton, the fire-resistant cotton was tightly wrapped outside the cable tray box with wire winding and wrapped with an aluminum sheet.
A total of 12 cases were made. The parameters of each case are shown in Table 3.

Table 3.
Cases of the experiment.
Figure 3 shows the partially constructed specimens.
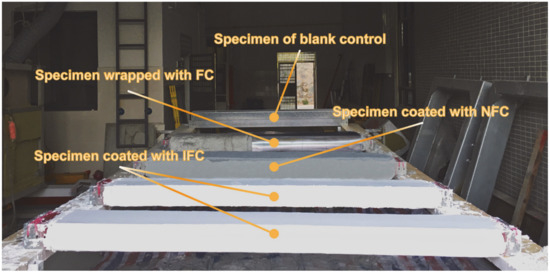
Figure 3.
Construction of completed specimens.
2.3. Installation and Test Method of Specimens
The installation and test method of the specimens referred to the national standard GA/T 537-2005 and GB/T 9978-1999 [29,30] for the fire resistance test method of a cable tray, and improvements were made according to the actual needs of the experiment. The horizontal installation of the specimen in the fire resistance test furnace is shown in Figure 4.
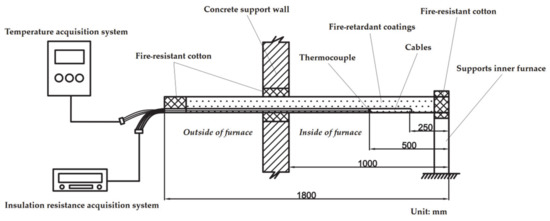
Figure 4.
Schematic diagram of horizontally installed specimen.
One power cable and one control cable were arranged in each cable tray, each 5 m in size, so that the cables could be arranged in a U-shape, both ends of which extended out of the furnace. The turning point of the cable was 250 mm away from the end of the tray’s in-furnace side. Three K-type armored thermocouples were 500 mm away from the end of the tray’s in-furnace side, and they were arranged in the center of the inner bottom surface of the tray and on the surfaces of the two cables in order to test the temperature of the inner surface of the tray and the surfaces of the two cables.
The concrete brick wall was built in advance as the supporting structure at the opening of the furnace. Three 600 × 250 mm holes were reserved in the middle of the brick wall. Two specimens were installed in each hole. The gap between the holes and the specimens was sealed with fire-resistant cotton. In consideration of the heat exchange between the open end of the tank box and the outside air during the experiment, the temperature in the tray was lower than the actual fire situation, so the fire-resistant cotton was used to seal the opening. The end of the tray’s in-furnace side was not coated with fire-retardant coating due to the support needs when the coating was sprayed. To prevent the flame from directly invading or heating the tray, the end of the tray’s in-furnace side in the furnace was sealed and wrapped with fire-resistant cotton.
Considering that the insulation failure time of each copper wire in the cables was slightly different in the actual fire, in order to find the insulation failure of the cable as soon as possible, all the copper wires in the cable are connected to the insulation resistance test circuit. The insulation resistance inside two cables and between two cables and the tray are measured, and three insulation resistance data points were obtained for each specimen. The wiring diagram is shown in Figure 5.
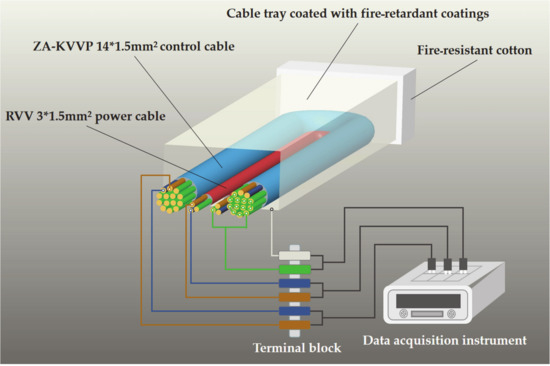
Figure 5.
Wiring diagram of insulation resistance test circuit.
Through previous studies, we knew that the change of the cable insulation resistance under fire conditions was essentially divided into the following stages: The insulation resistance stayed higher than 109 Ω for a period of time. Next, the resistance suddenly dropped by an order of magnitude at a certain time point. Then the resistance continuously dropped for a period of time. When the resistance was close to the critical value of 105 Ω, the insulation resistance suddenly dropped again, and it dropped to about 10 Ω in an instant [15,16,17,23,35,36,37]. However, there was no consistent standard for how to judge the cable failure with insulation resistance. Many scholars have given different criteria. Hui XIE et al. [35] adopted the method of judging a failure when the cable insulation resistance value was lower than the critical value of 105 Ω. However, after the insulation resistance reaches the critical value, the cable will be completely destroyed and invalidated quickly, so using this method as a criterion is not safe and effective. The method adopted by Murphy et al. [36] was judging the cable failure when the insulation resistance dropped by an order of magnitude. However, a cable can still run for a period of time when the insulation resistance is continuously decreasing, so using this method as a criterion is too conservative since the method cannot effectively reflect the actual failure time of the cable. Some scholars have also mentioned using two orders of magnitude drop in the insulation resistance as the criterion [37]. This method is closer to the actual failure time of a cable than the one order of magnitude drop scheme, and it is not too risky, so this method was selected as the criterion in this research.
According to the emergency plan and system rehearsal of the oil storage company mentioned above, the fire resistance time of the cables of important lines needs to reach 20 min to ensure the completion of the emergency task. Therefore, in this research, the fire resistance of 20 min was regarded as the qualified standard.
Finally, the pre-arranged thermocouple was connected to the temperature acquisition instrument to start the experiment. Figure 6 shows the site where the experiment was ready to start after the installation.
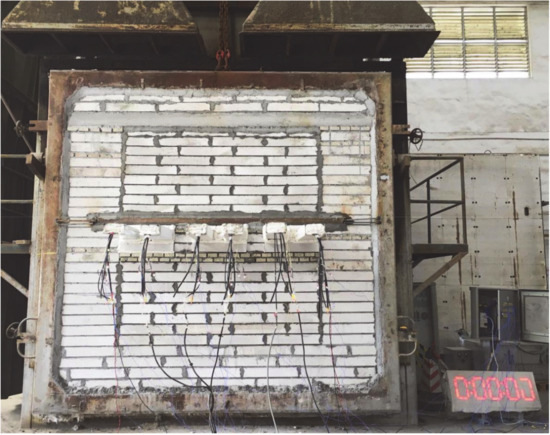
Figure 6.
Experimental site after installation.
2.4. Fire Protection Principle of Materials
In order to explain the principle of fire prevention method more clearly, we will briefly introduce the fire prevention principle of this three kinds of materials.
For the intumescent fire-retardant coating for steel structure (IFC), when the IFC layer is heated, the matrix melts, and the blowing agent decomposes gas, which makes the matrix expand and foam, forming a loose char shield, thus delaying the speed of heat transfer to the protected substrate and preventing further degradation of the underlying material. The expanding coatings can be generally divided into four states: full expanded char, blowing, melting, and virgin zone, according to the distance from the heat source from near to far [38].
For the non-intumescent fire-retardant coating for steel structure (NFC) and fire-resistant cotton (FC), their low thermal conductivity and non-flammability are used to prevent flame from invading the substrate.
3. Results and Discussion
3.1. Data Characteristics of Representative Cases
The experiment of 12 cases was completed two times, and for each case, 3 groups of temperature data and 3 groups of insulation resistance data were obtained. Due to the large amount of data, we needed to study the data characteristics of some cases and select appropriate data to characterize the fire protection effect before the overall discussion. In order to make the data representative, the thickest case of each fireproof material was selected and the control group was added. Finally, the 1st, 2nd, 3rd, 7th, 8th, and 11th cases were selected to draw the temperature and the logarithmic value of the insulation resistance-time curve, as shown in Figure 7.
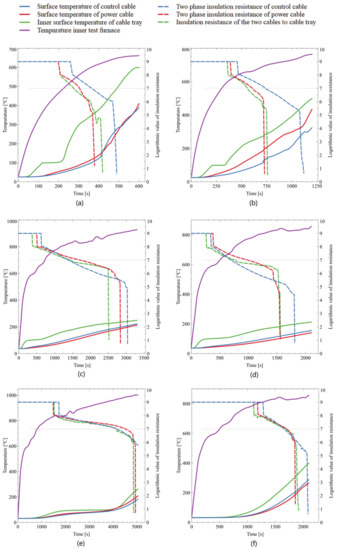
Figure 7.
Temperature and logarithmic value for insulation resistance-time curve: (a) curves of case 1; (b) curves of case 2; (c) curves of case 3; (d) curves of case 7; (e) curves of case 8; (f) curves of case 11.
From the temperature curve, it was obvious that the furnace temperature was the highest, followed by the inner surface temperature of the tray. For the surface temperature of the two kinds of cables, there was no obvious law, and the two temperatures were generally close. The difference between the surface temperature curve of the cable and the furnace temperature curve could directly show the fire protection effect. For example, the difference between the three temperature curves in the tray and the furnace temperature curve in Figure 6e was the largest, which indicated that the fire protection effect of the specimen coated with 40 mm NFC in case 8 was the best. Among the 3 temperatures, we could choose any temperature for the comparison of 12 cases of experimental results. However, considering the fact that the research object was the failure time of the cable, the surface temperature of the cable was preferred. When a fire occurred, after receiving the signal from the control cable, the power cable would supply power to the emergency equipment, and the power cable was equivalent to the last working cable. Therefore, the surface temperatures of the power cables in 12 cases were selected for comparative analysis.
The insulation resistance curve was similar to the law mentioned above. In the initial stage of the curve, the resistance value did not change significantly. With the increase of the temperature in the furnace, the resistance value decreased rapidly, indicating that the insulation performance of the cable decreased rapidly. Accordingly, the first inflection point appeared in the curve. After that, the insulation resistance value continued to decline until the short circuit occurred, the cable insulation completely failed, and the second inflection point appeared in the curve. Using the failure criterion that the insulation resistance dropped by two orders of magnitude (i.e., the insulation resistance value <107 Ω) for analysis, it was found that the failure sequence of the three insulation resistances in each case did not show an obvious law. For the three insulation resistances in each case, any insulation failure could represent the failure of the circuit, so we took the time when the insulation resistance was first lower than 107 Ω in each case as the failure time of each case.
After making clear how to compare the fire protection effect of each case, we analyzed the overall data to obtain the fire protection effect of each case.
3.2. Analysis of Overall Data
According to the previous analysis, we first determined the insulation resistance data that were lower than 107 Ω in each case, counted the cable failure time for each case, calculated the multiple cable failure time, and counted the surface temperature of a power cable at 20 min and the cable failure time, as shown in Table 4.

Table 4.
Result statistics for 12 cases.
We could see from the table that compared with the control group, the failure time of the cable could be delayed by 1.57 to 14.86 times. According to the above table, the failure time of each case, the surface temperature of the power cable at 20 min, and the failure time were plotted as a dot plot, as shown in Figure 8, in order to compare the effects of each case more intuitively.
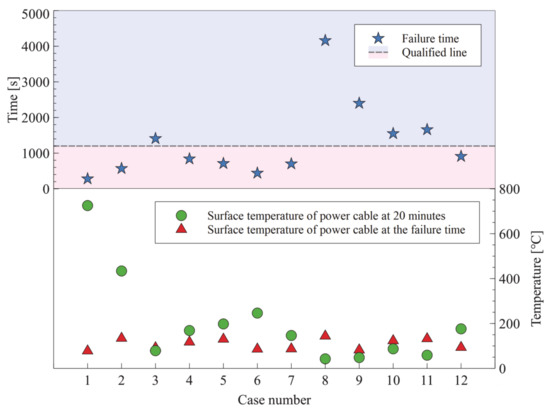
Figure 8.
Dot plot of surface temperature of power cable and failure time for 12 cases.
There are 5 cases above the qualified line in the figure, which are case 3, case 8, case 9, case 10, and case 11. Among these cases, one case of IFC was qualified, three cases of NFC were qualified, and one case of FC was qualified.
We used the time of the failure to characterize the fire protection effect. The later the failure time was, the better the fire protection effect was. Therefore, according to the statistical results, the fire protection effects of the 12 cases were ranked from good to bad as follows: case 8 > case 9 > case 11 > case 10 > case 3 > case 12 > case 4 > case 5 > case 7 > case 2 > case 6 > case 1. The high and low trends of the blue five-pointed star and the green dot were roughly symmetrical, as shown in Figure 8. That is, the order of the fire protection effects of the 12 cases from good to bad was roughly the same as the order of the surface temperature of the power cable at 20 min from low to high, which indicated that the temperature rise rate had a certain relationship with the failure time of the cable. The red triangle in the figure indicates the surface temperature of the power cable when it failed, which generally fluctuated around 100 °C.
The comparison of the power cable’s surface temperature curves for the 12 cases is shown in Figure 9. The temperature of each case increased in accordance with the trend of S-type or anti-S-type. Obviously, the temperature rise of the blank control group was the fastest. Among the other cases, the temperature rise of case 2 was the fastest, and that of case 8 was the slowest.
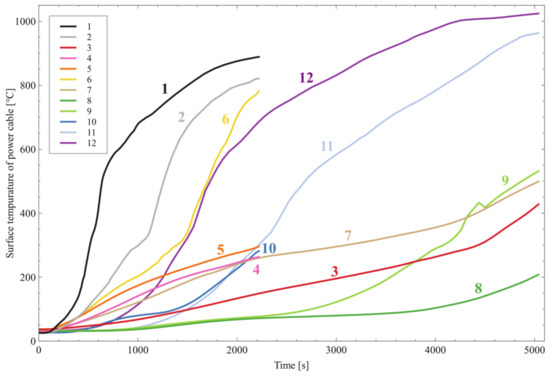
Figure 9.
Power cable’s surface temperature curves for 12 cases.
The insulation resistance data that were lower than 107-Ω earliest in each case were selected, and the comparison diagram of the insulation resistance change curve was drawn, as shown in Figure 10. The order of the cable failure time could be compared with the y = 7 line.
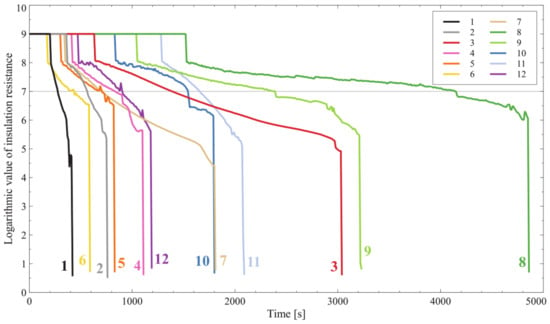
Figure 10.
Insulation resistance change curves for 12 cases.
3.3. Classification Discussion Based on Overall Results
After comparing the overall fire protection effect, we compared the fire protection effect of various materials via classification.
3.3.1. Different Brands of IFC
After comparing the data for case 2 and case 3 in Figure 8, it was obvious that brand B IFC (W) was better than brand A IFC (W). Figure 11 shows the specimens of case 2 and case 3 after the fire test. It could be seen from the observation that the fire-retardant coatings of case 3 still adhered to the tray after expansion, while the coatings of case 2 had poor adhesiveness, and a large amount of the coatings fell off at the bottom and side of the tray. The adhesion effect shown here was consistent with the adhesive strength of this two coatings in Table 2.
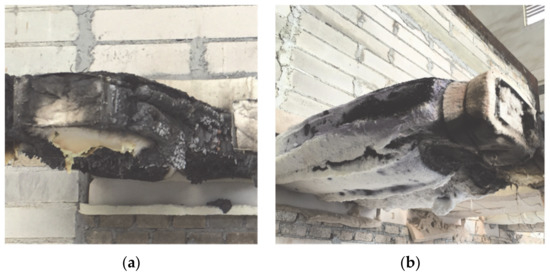
Figure 11.
Appearance of specimens after fire test: (a) specimen of case 2; (b) specimen of case 3.
The coatings of case 2 and case 3 after the fire test were taken for thickness measurements, and the data was recorded in Table 5. It could be seen that the expansion ratio of case 3 is larger than that of case 2. Hence, we could conclude that the adhesive property and the expansion effect of the brand B IFC (W) were better than those of brand A.

Table 5.
Thickness statistics of IFC before and after the test.
By comparing the temperature curves of case 2 and case 3 in Figure 9, it could be inferred that the low expansion ratio of case 2 resulted in a larger temperature rise, and the slope of the case 2 temperature curve suddenly became larger at about 1200 s, which might have been caused by the coating shedding of case 2.
At the same time, we also considered the char structure produced by different kinds of coatings after heating. Taking the coating of case 2 and case 3 respectively, we found that the char structure of case 3 was more compact in appearance, as shown in Figure 12.
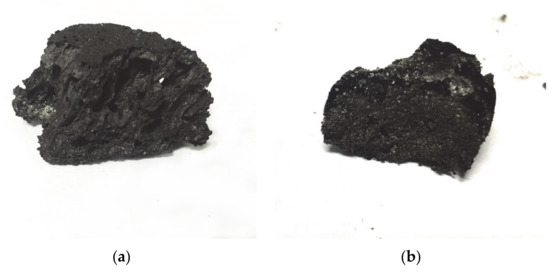
Figure 12.
Char after experiment: (a) char of case 2; (b) char of case 3.
Further, we observed the microstructure of char by SEM (scanning electron microscope) at 100 times, as shown in Figure 13. It could be found that the char of case 2 had a porous and loose structure, while the char of case 3 was compact, and the gap between cells was closed. According to the discussion of Puri, R.G. et al. [38], the fire protection effect of char structure like case 3 was better.
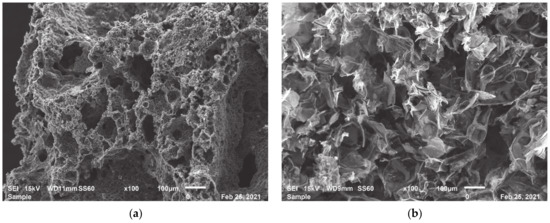
Figure 13.
SEM image: (a) char of case 2; (b) char of case 3.
Therefore, before selecting IFC for large-scale projects, we can heat the coated plate and compare the expansion progress, cohesiveness and char structure of coatings to select a better one.
3.3.2. Different Types of Coating Solvents
By comparing the data of case 3 and case 7 in Figure 8, it could be concluded that the fire protection effect of the brand B IFC (W) was better than that of the IFC (O). The coatings of case 3 and case 7 after the fire test were taken for thickness measurements, and the data were recorded in Table 6. It could be seen that the expansion effect of the brand B IFC (W) was also better than that of the IFC (O).

Table 6.
Thickness statistics of IFC before and after the test.
3.3.3. Different Thickness
After comparing the data for case 3, case 4, case 5, and case 6 in Figure 8, it was found that the thicker the coatings were, the better the fire protection effect was. After observing the coatings of these four cases, the expansion effect for each case of coatings was found to be good, and there was essentially no shedding phenomenon. The coatings of these four cases after the fire test were taken for thickness measurements, and the data were recorded in Table 7.

Table 7.
Thickness statistics of IFC before and after the test.
From the table, we could find two phenomenon:
- The expansion ratio of the coatings decrease with the increase of the coating thickness.
- The final coating thickness of case 4 after expansion was similar to that of case 3, but the failure time was very different.
According to the principle of IFC in Section 2.4, shielded by the upper char layer (closer to fire), the lower layer might be in the last three stages without full expansion, so it seemed unreasonable to take it as a conclusion directly. We took the upper char layer and the lower char layer after the experiment, and found that the color of the lower char layer was lighter, as shown in Figure 14, which further indicated that the lower char might not fully expand.
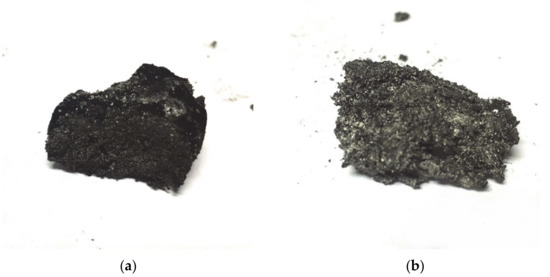
Figure 14.
Char after experiment: (a) upper char layer; (b) lower char layer.
In order to find out the reason of these two phenomenon and draw a reasonable conclusion, we did a simple supplementary experiment. We put the plates coated with 1.5 mm and 2.5 mm brand B IFC (W) under the condition of pool fire and heated it fully until the char no longer expanded, as shown in Figure 15. In the experiment, the coatings near the center of the fire source foamed first, the coating thickness was recorded every minute.
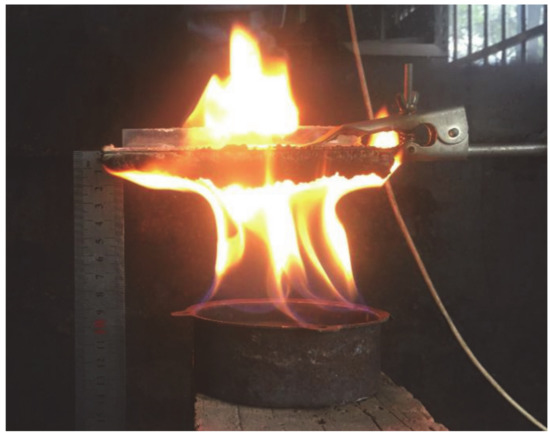
Figure 15.
Supplementary experiment.
The thickness of the fully expanded coating was measured and recorded in Table 8.

Table 8.
Thickness statistics of IFC before and after the test.
The coating thickness curve is shown in Figure 16.
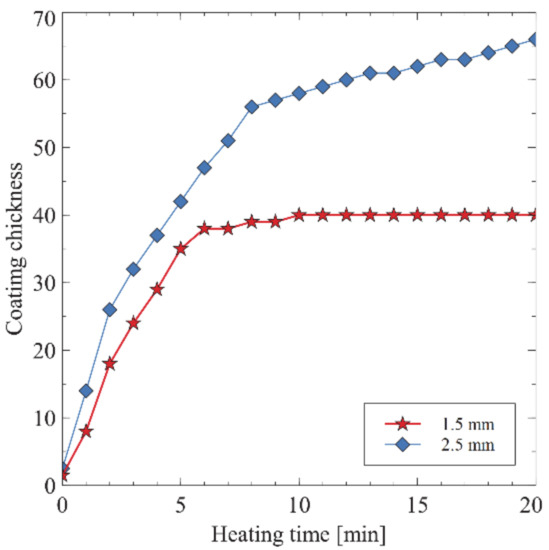
Figure 16.
Curve of coating thickness with heating time.
From Table 8 and Figure 16, we could see that the expansion ratio of the same kind of coating had nothing to do with the initial coating thickness. After the complete expansion, the expansion ratio was basically the same, and the expansion speed gradually slowed down with time. However, the coating with thicker initial thickness always had thicker thickness in the whole process of expansion, so this might be the reason why the temperature rise of 2.5 mm specimen was slower than that of 1.5 mm specimen in Figure 9.
Further observation of the temperature curve displayed in Figure 9 showed that the initial stage of the temperature curve of case 3 was a downward convex curve, while the initial stage of the temperature curve of case 4, case 5, and case 6 was an upward convex curve, which indicated that the initial temperature rises of the latter three cases were faster. According to the analysis of the supplementary experiment, it was speculated that this might have been because the coating thickness was thinner during the heating process due to the thinner initial thickness, and when the coating were expanding, a large amount of heat was transferred to the tray at early stage. Even after the coating completely expanded, the temperature rise rate decreased, but because the temperature in the tray had reached a high value, the cable still failed quickly. Therefore, when IFC were used to protect the cables in the trays, a certain initial thickness of the coatings was necessary.
For case 8, case 9, and case 10, brand C NFC were used, and the thicker the coating was, the better the fire protection effect was. The initial temperature rises for these three cases were relatively slow, and the temperature rise rate slowly increased with time.
For case 11 and case 12 using brand D FC, the thicker the material was, the better the fire protection effect was. The initial temperature rise rate of these two cases was low, but in contrast to that of NFC, the temperature rise rate in the medium-term increased quickly, resulting in a rapid temperature rise, which made the fire protection effect less than that of NFC with the same thickness.
3.3.4. Different Fireproof Materials
In the experiment, the three kinds of materials that met the fire protection requirements were brand B IFC (W), brand C NFC, and brand D FC. In order to compare the fire protection effect of the three materials, we counted the failure time data of some cases, as shown in Table 9.

Table 9.
Failure time data for some cases.
By comparing case 3 and case 12, we found that although the material thickness of case 3 was much less than that of case 12, the failure time was later than that of case 12. Considering that the fire protection effect of the three materials was positively related to the thickness, so it could be inferred that the fire protection effect of the Brand B IFC (W) was better than that of the brand D FC for the same thickness condition.
By comparing case 8, case 9, and case 11, it was found that the material thicknesses of cases 8 and 9 were less than that of case 11, but the failure times were later than that of case 11. It could be inferred that the fire protection effect of the brand C NFC was better than that of brand D FC for the same thickness condition. This result was consistent with the thermal conductivity of this two materials in Table 2.
By comparing case 3 and case 10, it was found that although the failure time of case 3 was earlier than that of case 10, the difference was not significant. Additionally, considering the fact that the material thickness of case 3 was far less than that of case 10, we could speculate that the fire protection effect of the brand B IFC (W) was better than that of the brand C NFC for the same thickness condition.
For the selection of these three materials, there were the following considerations:
- The IFC (W) had thin thickness, a good fire protection effect, and a beautiful appearance, but the construction was more complex, and the material price and the construction cost were larger than those of NFC and NFC. The water resistance and the durability of the coating were worse than those of the NFC, but the water resistance and the durability could be improved by brushing the topcoat.
- The NFC had strong durability, the material price per square meter was the lowest among the three materials, and the fire-retardant effect was good, but the good fire-retardant effect was obtained with the thickness. The coating was thick, heavy, rough, and not beautiful enough, but it could also be brushed with a topcoat to make it more beautiful.
- The construction of FC was relatively convenient, and the price was moderate. It could be wrapped with high-temperature glue or iron wire winding. The thickness was large and the fire protection effect was general. It could easily be soaked by rain outside, so the surface could be waterproof and beautified with a tarpaulin or aluminum sheet.
It could be seen that the three schemes had their own advantages and disadvantages, and they needed to be selected according to the actual needs.
4. Conclusions
After experimental verification, we could draw the following conclusions:
- Taking the insulation resistance drop by two orders of magnitude as the cable failure criterion, it was concluded that the failure time of the cable could be delayed to 1.57 to 14.86 times the blank control. The fire protection effects of the 12 cases were ranked from good to bad as follows: case 8 > case 9 > case 11 > case 10 > case 3 > case 12 > case 4 > case 5 > case 7 > case 2 > case 6 > case 1. The failure time of the cable had a certain relationship with the temperature rise rate in the tray.
- For IFC, the water-based coatings with better adhesion, expansion effect and more compact char structure should be selected. When IFC were used to protect the cables in the trays, a certain initial thickness of the coatings was necessary, and the thicker the IFC were, the better the fire protection effect was.
- For NFC, the thicker the coating was, the better the fire protection effect was. The initial temperature rise of a specimen coated with NFC was relatively slow, and the temperature rise rate slowly increased with time.
- For FC, the thicker the material was, the better the fire protection effect was. The initial temperature rise rate of a specimen wrapped with FC was low, but the temperature rise rate in the medium-term suddenly increased rapidly, resulting in a rapid temperature rise.
- Among the materials with a qualified failure time, the order of the fire protection effect at the same thickness was: IFC > NFC > FC. There were advantages and disadvantages to the use of the three fire protection materials for fire protection transformation, and the materials needed to be selected according to actual needs.
Author Contributions
Conceptualization, D.L.; methodology, D.L. and F.J.; investigation, L.W.; resources, J.L. and J.Y.; experiment, F.J. and W.Y.; data curation, F.J.; writing—original draft preparation, F.J.; writing—review and editing, D.L.; supervision, D.L.; project administration, F.J. and J.L.; funding acquisition, D.L. All authors have read and agreed to the published version of the manuscript.
Funding
This research was supported by Funds of Guangdong Provincial Key Laboratory of Fire Science and Technology (No:39000-42080092).
Institutional Review Board Statement
Not applicable.
Informed Consent Statement
Not applicable.
Data Availability Statement
Data available on request due to restrictions eg privacy or ethical.
Conflicts of Interest
The authors declare no conflict of interest.
References
- Lai, S.H. Current situation and application of cable fire retardant coating. Fire Tech. Prod. Inf. 2013, 06, 48–49. [Google Scholar]
- Zhang, X.Q.; Ma, H.; Zhi, H.Q. Thought about Dalian “7·16” fire—Discussion about problem of “Code for Design of Oil Depot” and modification suggestion. Fire Sci. Technol. 2010, 29, 783–785. [Google Scholar]
- Han, J. Lessons from Dalian “7·16” Fire Explosion Accident and Preventive Measures. Petrochem. Saf. Environ. Prot. Technol. 2012, 28, 1–6. [Google Scholar]
- James, L.M. Fire protection of critical circuits-a life and property preserver. IEEE Trans. Ind. Appl. 1998, 34, 689–696. [Google Scholar]
- Zhu, J. Cable fire protection technology. Fire Tech. Prod. Inf. 2008, 11, 28–30. [Google Scholar]
- Petrochemical Standards of the People’s Republic of China SH/T 3019-2016. Design Specification for Instrument Tubing and Wiring in Petrochemical Industry; China Petrochemical Press: Beijing, China, 2016. [Google Scholar]
- Huang, X.J.; Wang, Y.H.; Ren, Z.Y.; Li, Z.B.; Cheng, C.H.; Wanki, C. Experimental investigation on maximum ceiling jet temperature generated by a vertically spreading cable fire. Fire Saf. J. 2020, 103125. [Google Scholar] [CrossRef]
- An, W.G.; Tang, Y.H.; Liang, K.; Cai, L.; Wang, T.; Wang, Z. Study on temperature distribution and CO diffusion induced by cable fire in L-shaped utility tunnel. Sustain. Cities Soc. 2020, 62, 102407. [Google Scholar] [CrossRef]
- An, W.G.; Wang, T.; Liang, K.; Tang, Y.H.; Wang, Z. Effects of interlayer distance and cable spacing on flame characteristics and fire hazard of multilayer cables in utility tunnel. Case Stud. Therm. Eng. 2020, 22, 100784. [Google Scholar] [CrossRef]
- Niu, Y.J.; Li, W.T. Simulation Study on Value of Cable Fire in the Cable Tunnel. Procedia Eng. 2012, 43, 569–573. [Google Scholar] [CrossRef]
- Liang, K.; Hao, X.F.; An, W.G.; Tang, Y.H.; Cong, Y.Z. Study on cable fire spread and smoke temperature distribution in T-shaped utility tunnel. Case Stud. Therm. Eng. 2019, 14, 100433. [Google Scholar] [CrossRef]
- Tao, H.W.; Zhang, X.C.; Guo, Z.M.; Zeng, W.Y.; Huang, X.J.; Zheng, Z.H.; Xu, W.B. Combustion characteristics and heat release rate of vertical cable fire for sustainable energy system in an analogue underground compartment. Sustain. Cities Soc. 2019, 45, 406–412. [Google Scholar] [CrossRef]
- Du, Y.; Sun, Y.K.; Jiang, J.; Li, G.Q. Effect of cavity radiation on transient temperature distribution in steel cables under ISO834 fire. Fire Saf. J. 2019, 104, 79–89. [Google Scholar] [CrossRef]
- Kerekes, Z.; Restas, A.; Lubloy, E. The effects causing the burning of plastic coatings of fire-resistant cables and its consequences. J. Therm. Anal. Calorim. 2020, 139, 775–787. [Google Scholar] [CrossRef]
- Polanský, R.; Polanská, M. Testing of the fire-proof functionality of cable insulation under fire conditions via insulation resistance measurements. Eng. Fail. Anal. 2015, 57, 334–349. [Google Scholar] [CrossRef]
- Wang, J.; Shu, Z.J. On protecting effect of fire retardant coating for insulation failure of cable in fire condition. Fire Sci. Technol. 2011, 30, 412–415. [Google Scholar]
- Wang, J.; Shu, Z.J.; Chen, Z. The protective effect of a fire-retardant coating on the insulation failure of PVC cable. Eng. Fail. Anal. 2013, 34, 1–9. [Google Scholar] [CrossRef]
- Panagiotis, K.; Ryan, J.; Gary, W.; Peter, W. Fire Performance of Structural Cables: Current Understanding, Knowledge Gaps, and Proposed Research Agenda. J. Struct. Eng. 2020, 146, 03120002. [Google Scholar]
- Lelak, J.; Sulova, J.; Valach, R.; Kment, A.; Pipa, M. Comparison of dielectrical properties of LV cables with different fire barriers ensuring circuit integrity under fire conditions at high ambient temperatures. In Proceedings of the International Conference on Diagnostics in Electrical Engineering (Diagnostika), Pilsen, Czech Republic, 1–4 September 2020; IEEE: New York, NY, USA, 2020. [Google Scholar]
- Tabuani, D.; Bellucci, F.; Terenzi, A.; Camino, G. Flame retarded Thermoplastic Polyurethane (TPU) for cable jacketing application. Polym. Degrad. Stab. 2012, 97, 2594–2601. [Google Scholar] [CrossRef]
- Sener, A.A.; Demirhan, E. The investigation of using magnesium hydroxide as a flame retardant in the cable insulation material by cross-linked polyethylene. Mater. Des. 2008, 29, 1376–1379. [Google Scholar] [CrossRef]
- Liu, K. Study on Influence of Fire-Retardant Coating on Ignition Characteristics of Cable and the Temperature Distribution of Overloaded Cable. Master’s Thesis, University of Science and Technology of China, Hefei, China, 2019. [Google Scholar]
- Shu, Z.J.; Sun, Q.H.; Chen, N.; Yang, S.S. Effect of protecting with conduits on insulation failure of ZR-VV cable. Fire Sci. Technol. 2010, 29, 473–477. [Google Scholar]
- Industry Standard of Public Security of China GA 479-2004. Fire Resistance Cables Tray; Standards Press of China: Beijing, China, 2004. [Google Scholar]
- National Standards of the People’s Republic of China GB 29415-2013. Fire-Resistant Cable Trunk; Standards Press of China: Beijing, China, 2013. [Google Scholar]
- Song, S.L. Suggestions on the thickness of fire retardant coating for fire resistant cable tray. Electr. World 2016, 57, 32. [Google Scholar]
- Hou, Q.F. Discussion on the application of fire-resistant wire trunk in design and construction. Build. Electr. 2016, 35, 64–68. [Google Scholar]
- Chen, L.M. Standard problems and analysis of building electrical fire resistant trunk. Proj. Manag. 2009, 2, 44–47. [Google Scholar]
- Industry Standard of Public Security of China GA/T 537-2005. Flame-Retardant, Fire-Proof, Fire Resistance Specifications of Testing Method of Busbar Trunking System (Busways); Standards Press of China: Beijing, China, 2005. [Google Scholar]
- National Standards of the People’s Republic of China GB/T 9978-2008. Fire-Resistance Test-Elements of Building Construction; Standards Press of China: Beijing, China, 2008. [Google Scholar]
- International Organization for Standardization ISO 834. ISO 834-1, Fire Resistance Test-Elements of Building Construction, Part 1: General Requirements; International Organization for Standardization ISO 834: Geneva, Switzerland, 1999. [Google Scholar]
- Puspitasari, W.C.; Faiz, A.; Sami, U.; Patthi, H.; Puteri, S.M.M.; Patrick, J.M. The study of adhesion between steel substrate, primer, and char of intumescent fire retardant coating. Progress Org. Coat. 2019, 127, 181–193. [Google Scholar] [CrossRef]
- Andrea, L.; Cristian, M. Intumescent coatings used for the fire-safe design of steel structures: A review. J. Constr. Steel Res. 2019, 162, 105712. [Google Scholar]
- Mariappan, T. Recent developments of intumescent fire protection coatings for structural steel: A review. J. Fire Sci. 2016, 34, 120–163. [Google Scholar] [CrossRef]
- Xie, H.; Zhang, J.Q.; Liu, Y.F.; Zhang, B.S.; Wang, L.F.; Fan, M.H. Study on Insulation Failure Time and Failure Temperature of the Aged Cables under External Heating. Procedia Eng. 2018, 211, 1012–1017. [Google Scholar] [CrossRef]
- Jill, E.M. Determination of Failure Criteria for Electric Cables Exposed to Fire for Use in a Nuclear Power Plant Risk Analysis. Master’s Thesis, Worcester Polytechnic Institute, Worcester, MA, USA, 2004. [Google Scholar]
- Yang, Y.C.; Li, Q.; Zhang, J.Q.; Fan, M.H. The study of the cable failure criteria used in fire PSA. Procedia Eng. 2016, 135, 510–514. [Google Scholar] [CrossRef][Green Version]
- Puri, R.G.; Khanna, A.S. Intumescent coatings: A review on recent progress. J. Coat. Technol. Res. 2017, 14, 1–20. [Google Scholar] [CrossRef]
Publisher’s Note: MDPI stays neutral with regard to jurisdictional claims in published maps and institutional affiliations. |
© 2021 by the authors. Licensee MDPI, Basel, Switzerland. This article is an open access article distributed under the terms and conditions of the Creative Commons Attribution (CC BY) license (http://creativecommons.org/licenses/by/4.0/).