Article

Citizens’ Perception of Smart Cities: A Case Study

by
Athanasios Georgiadis
,
Panayiotis Christodoulou
and
Zinon Zinonos
*
Intelligent Systems Laboratory, Department of Computer Science, Neapolis University Pafos, 8042 Pafos, Cyprus
*
Author to whom correspondence should be addressed.
Appl. Sci. 2021, 11(6), 2517; https://doi.org/10.3390/app11062517
Submission received: 17 February 2021 / Revised: 5 March 2021 / Accepted: 9 March 2021 / Published: 11 March 2021
(This article belongs to the Special Issue New Trends in Social Computing and Its Applications)

Abstract

:
The 21st century is considered to be “The Century of Cities”. By the end of this century, over 80% of the global population is expected to be living in urban areas. To become smart, a city should develop an approach of services that will focus mainly on citizens to be the primary beneficiaries of the services offered by a Smart City. In this work, we present through a survey of 545 participants, the citizens’ perception about the smart city concept and reveal the Greek and Cypriot citizens’ level of knowledge regards to a Smart City’s actions, applications, and elements. The final results of this study revealed several interesting outcomes. Firstly, this study showed that Cypriot citizens seem to know better what a “Smart City” is compared to Greek citizens, secondly, the study revealed that a large number of participants do not believe that any efforts have been made in their city in order to become “smart” and finally, regards to the most important challenges for the development of a smart city, the survey disclose that the cooperation of the private and public sector is the biggest challenge that needs to be tackled so as citizens can move towards a “smarter” future.

1. Introduction

At the beginning of the 21st century, cities are presented as the primary source for some of the biggest concerns and challenges that the world has ever faced. Rapid urbanization (which leads to overpopulation), diminished resources, and continuous climate changes are some of these challenges. Gradually, this leads to many other global challenges and concerns, such as energy over-consumption, climate changes, resource constraints, and air pollution. To cope with the aforementioned challenges, the concept of sustainable urban development emerged through the “Smart City” concept to define urban planning significantly [1]. The “Smart City” concept constitutes the precursor of sustainable development and it targets improving life in cities by using innovative and state-of-the-art technologies. To become smart, a city should develop an approach of services that are mainly focused on citizens who are the primary beneficiaries of the things and services a Smart City can offer.
The “Smart City” concept is defined as a concept that can tackle environmental, economic, and social challenges that modern cities are facing and will continue to face in the future [1]. By focusing only on using Information and Communication Technology systems, a smart city can get more closely related to people and communities [2]. Nowadays there may not have been yet a clear and globally accepted definition for the smart city, but, despite this fact, cities are embracing the notion of achieving smartness to achieve sustainable development and economic growth and, also, to improve their citizens’ quality of life. In a simplified way, we can define a “smart city” as a city that uses advanced technologies in order to achieve the goals it has set. These goals may be financial development, education, eradication of poverty, social equality, enhanced citizens’ security, tourism, cultural education, intercultural physique, environment, and fast citizen service in public services and can vary, depending on the city’s geographical location, the socio-economic conditions, the resources that the city can allocate and the perceptions of the respective local authorities.
Smart cities projects are related to many domains of applications, such as communication, culture, energy, environment/climate, health, tourism, and transport. “Smart cities” are closely related to “smart buildings” and “smart devices”, but neither cities, buildings, nor devices are smart by themselves. Nowadays while there is a plethora of applications that can be utilized and support the concept of Smart cities [3,4,5,6] the whole concept relies on the city administration’s smartness, politicians, and citizens to utilize technology in “smart” ways [7].
With new communication channels and interaction, citizens have acquired the opportunity to play a more active role in the city. The significant increase in citizens’ democratization and production capability has turned them into key factors for the innovation process and development of a city [8]. To succeed in the development of smart cities, citizens should be involved as an integral part of the process as they are both users and decision-makers and can also be reliable sources of data and information [9]. Citizens’ participation, ideas, and perspectives are critical factors for smart city development. The bigger the participation and the involvement in their (smart) city’s decision making, the better the understanding of the benefits and the positive impact that the smart city provides them.
In this work, we aim to present the citizens’ perception of the smart city concept, and reveal the level of knowledge of Greek and Cypriot citizens regards to a Smart City’s actions, application and elements. In addition, we target to illustrate to what extend the Greek and Cypriot citizens have realized the importance, the positive impact and the benefits that a “smart project” can offer in their lives.

2. Literature Review

In this section, various surveys and studies that present the effects and benefits as well as the impact of smart cities on the citizens’ lives and how citizens participate in forming a smart city, are analyzed. The information and communication technology (ICT) applications form an essential factor for the development of sustainable smart cities, thus their adoption has become a significant model for municipal cooperation between government and corporations.
In [10] the authors outline a study where several Taiwanese citizens are being surveyed. The purpose of this study was to emphasize the fact that smart city services provide their citizens with an improved living environment which increases the quality of life. Furthermore, the study aimed to point out how important it is for the citizens’ when their ideas and perspectives are taken into account during the planning of the smart city’s services. The results of the study highlighted the citizens’ willingness to accept the ICT-based smart city services especially when their design is based on innovative processes that offer personal privacy and high quality of services. The city engagement factor did not seem to have played a major role in influencing the participants’ usage of the smart city services in [10]. However, Belanche’s et al. in [11] presented that city attachment (engagement) affects both citizens’ attitudes toward urban services and citizens’ usage of them. The major difference between the aforementioned investigation and the one in [10] is that the findings of the latter were based on data that were collected by the citizens of a European city: the city of Zaragoza in Spain. Final outcomes revealed how citizens’ city attachment levels and other personal factors contribute to urban services usage.
As mentioned in [12], the more the citizens use the urban services, the better the service’s performance, the life’s quality, and the greater the satisfaction with urban management become. It is confirmed that the use of public transportation (which is an urban service) leads to the production of substantial savings for the citizens [13] and, also, to additional benefits for the environment, as it reduces air pollution, traffic injuries, and CO2 emissions [14]. The survey’s framework resulted from a number of hypotheses relevant to the influence that the city attachment has on attitudes toward urban services and the use of them as well as on the city attachment’s dependence on citizens’ demographic features. The data were gathered from various groups of citizens in Zaragoza (different for each group) through a questionnaire that included questions about attitudes towards urban services, city attachment and the personal necessity to use the services. Although the results indicated that city engagement affects the attitudes toward urban services positively, the effect of city attachment on the use of these services is not of high significance. Moreover, city attachment was positively affected by the age factor in a positive way and negatively affected by the educational level of the participants. In contrast, urban service usage was positively affected as well by highly educated people and it was not affected by the age or gender of participants.
Generally, the citizens’ role in smart cities is significant and their participation in the development of smart city initiatives seems crucial. In [15], the authors analyze the concept of co-production, which can be considered as a boosted type of participation of citizens, with their involvement in the creation and development of public services and policies. Co-production is based on the redistribution of power between citizens and government. “Smart” citizens constitute a fundamental dimension of smart cities thus, no smart city can be formed without smart citizens. Every smart city initiative impacts the citizens’ way of life and this can lead to a failure in case the citizens do not accept to adapt their lifestyles accordingly or to collaborate by adopting “smart” behaviors. The collaboration between the service designers and creators and the service users (citizens) is a critical condition so that the desired results can be accomplished in smart city initiatives [16]. This collaboration is one of the critical attributes of the co-production of public services. From this aspect, when citizens act like co-producers, they get the chance to participate in smart city initiatives actively and to make the city that they live in “smarter”.
Since in some cases the citizens do not get the chance to evaluate the improvements that take place in their city, the authors in [17] introduce a procedure/model to enhance the citizens’ participation in their smart city’s development plan. To become smart, a city should develop an approach of services that will mainly focus on citizens so that they could be the primary beneficiaries of the new urban project. In other words, according to the citizens’ satisfaction, the city can proceed with the development, which will be focused on its residents. In [17], the authors use Boyd Cohen’s model (Smart Cities Wheel) as a metric model, which consists of six Key Performance Indicators (KPIs), based on Kano methodology, to determine the level of satisfaction that is generated from the citizens. Through the Kano model, the attributes that provide levels of satisfaction are determined and classified. Generally, the model classifies a service’s (or product) characteristics based on the degree of interaction relations of customer satisfaction.
The research in [7] shows how smart cities are likely to be developed in India, considering the perspectives of both citizens and city officials (such as governments). It is also indicated in this study how the size of a city can influence the priorities of both citizens and authorities. Since the urban population in India increases year by year, the development of smart cities becomes mandatory. The Indian perspective regarding smart cities was extracted by a citizen survey, which provided how citizens imagine a smart city. In addition, additional smart city vision statements, which provide insights into how the city officials consider a smart city and the most important things for them were analyzed. The citizen survey obtained information about citizens’ perspectives on various areas of priority for smart city development and the analysis of the citizens’ data revealed the citizens’ priority areas, where the size of the cities played a major role in the results. Overall, in terms of importance for the citizens, Smart Living was ranked as the most selected domain (51%), while Smart Mobility ranked second (30%). According to the authors, these results make sense, considering that India faces many deficits in these two domains. The results also revealed that the city officials prioritize Smart Living, followed by Environment and Economy and that the population plays a major role in the influences and the priorities of the citizens. In other words, the population may be a determinant factor for the concept of a smart city in India.
As the authors in [18] mention, the citizens can have their roles in smart cities through their participation and interaction in a smart city concept. Citizens’ participation consists a significant part of the smart city’s development and can be either political or non-political. By taking the above statement into consideration, the authors in [18] present the citizens’ political participation, through which the citizens influence political decisions, and the non-political (general) citizen participation, through which citizens aid in finding solutions for the city’s problems. The aforementioned study is mostly related to Norwegian smart cities and municipalities and describes the concept of participation as a democracy manifestation. Authors emphasize the fact that citizens can share their knowledge, expertise, and time to improve smart city service. The authors present their model to define the requirements needed for the citizens’ electronic participation in a smart city.
Another study that is worth mentioning in this study is the one presented by the authors in [9]. The work in [9] analyses the assessment and perception of university students on the smart city concept based on their involvement with the city they currently live. The main findings reveal the most significant goal of urban planning which is the good quality of life. According to the results, the mean score was below the intermediate value of 3 in the five-point Likert scale in all six factors that affect smart cities. More specifically, Smart living (2.76) and Smart mobility (2.66) had the highest mean scores, whereas Smart governance (2.43) had the lowest. This means that the respondents’ assessment was inadequate and that they generally shared a negative perception of the city regards to all six dimensions.
The discussion about citizens’ participation in smart cities, which is followed by a relevant survey in [19] seems to be of high interest. Through this survey, which was shared between various smart city experts from different cities across the globe, the authors’ goal was to evaluate the citizens’ participation in smart cities through the eyes of the smart city experts and to identify new ways for increasing civic participation. The results of the previously mentioned survey revealed how citizens are affected by the various factors of a smart city.

3. Smart City

According to [20], the 21st century is characterized as “the century of cities”. This seems fair enough, as, by 2030, about 60% of the world’s population will be living in urban areas and big cities; this percentage will exceed 80% at the end of the century [21]. Vanolo in [22] says that, nowadays, the concept of a smart city is viewed as a vision to determine the sustainable and ideal city form in the 21st century. In other words, a smart city is a green, socially inclusive city characterized by efficiency and technological advances. The short-term goal of the cities globally is the continuous development in essential sectors such as the economy, health and education. Their long-term goal is the satisfaction of the people living in them. The innovative solutions that are offered by already-existing smart cities constitute a crucial factor for achieving these goals. However, many cities are not able to fully implement these innovations due to significant (mainly economic) difficulties. For this reason, the large urban centers are considered to be the most appropriate starting points for development so that the application spreading can be smoother and more efficient at a later stage.
In general, smart cities constitute a promising idea for an ideal future of global urbanization and the confrontation of its drawbacks. Smart cities constitute the ideal model that can lead to urban development. A smart city corresponds to an integrated, forward-looking vision, useful for defining a method for city development, as seen through the prism of digital technologies and knowledge ecosystems. Moreover, the adaption of this vision to the local needs, priorities and constraints of a city is of high importance. Even today, no city can consider itself totally “smart”. On the contrary, since societies and technologies change frequently, the smart city has to reassess itself and try new ways of thinking about technology and its engagement for the common good.

3.1. Sustainable Urban Development

Sustainability is a new development model that emerged from various concerns of the late twentieth and early twenty-first century [23]. These concerns were mostly environmental, social and economic. Molnar et al. in [24] state that the concept of sustainable development is contested; thus, there is no clear and specific definition of sustainability that is globally accepted. The “sustainable development” notion was defined through the 1987 Brundtland Commission as the “development that meets the needs of the present without compromising the ability of future generations to meet their own needs” [25]. In the next years, sustainable development became an exciting object for study for scientific purposes and policy-making, along with international organizations’ related programs, reports, and conferences [26].
The cities’ role in sustainable development is reflected in the Sustainable Development Goals (SGDs) of the United Nations Department of Economic and Social Affairs (DESA U. N.) 2030 Agenda for Sustainable Development. This role is to “make cities and human settlements inclusive, safe, resilient, and sustainable” [27]. Most of the cities consume massive energy amounts globally. The main domains of this consumption are related to waste management, public lighting, heating and cooling of buildings, infrastructure in building and maintenance, public service precaution in transport and many more. It is a fact that modern cities cause the most massive environmental pollution and energy consumption. It becomes clear that, in case humanity stays inactive against this situation, the consequences will be harmful, especially in areas of water management, accessibility and urban air pollution [23]. Therefore, the concept of sustainable urban development emerged and significantly defined urban planning and development starting in the early 1990s [28]. According to [29], any city or ecosystem is supposed to be sustainable “if its conditions of production do not destroy over time the conditions of its reproduction”. In addition, Castells in [29] stated that, essentially, sustainable development is a type of solidarity between the older and the future generations. This solidarity is based on the fact that the older generations consume carefully and pollute the least they can get so that the future generations could have the opportunity to live under the same or even better-living conditions. The desirable state is the one where cities will consume the least possible resources, will become more livable, will offer a better quality of life to their citizens, and will minimize the impact that humans have on the environment [28].
The vast array of technical and environmental requirements that appear both on the building and the neighborhood scale shows how mostly sustainable urban development has penetrated in urban growth. Requirement systems such as LEED for Neighborhood Development, CASBEE for Urban Development, EarthCraft Communities and BREEAM Communities are some of the sustainable urban development assessment frameworks [23]. The authors in [23] state that some of the essential characteristics of a sustainable community at the moment are the adequacy, quality, and resource efficiency of urban infrastructure. Essentially, cities are places that offer the ground for new ideas and new solutions. Thus, many sustainable urban development frameworks reference the role of ICTs and human participation in progressing sustainability goals in cities. The great potential of the smart city approach is already thoroughly investigated by the United Nations through their study on “Big Data and the 2030 Agenda for Sustainable Development” [23].

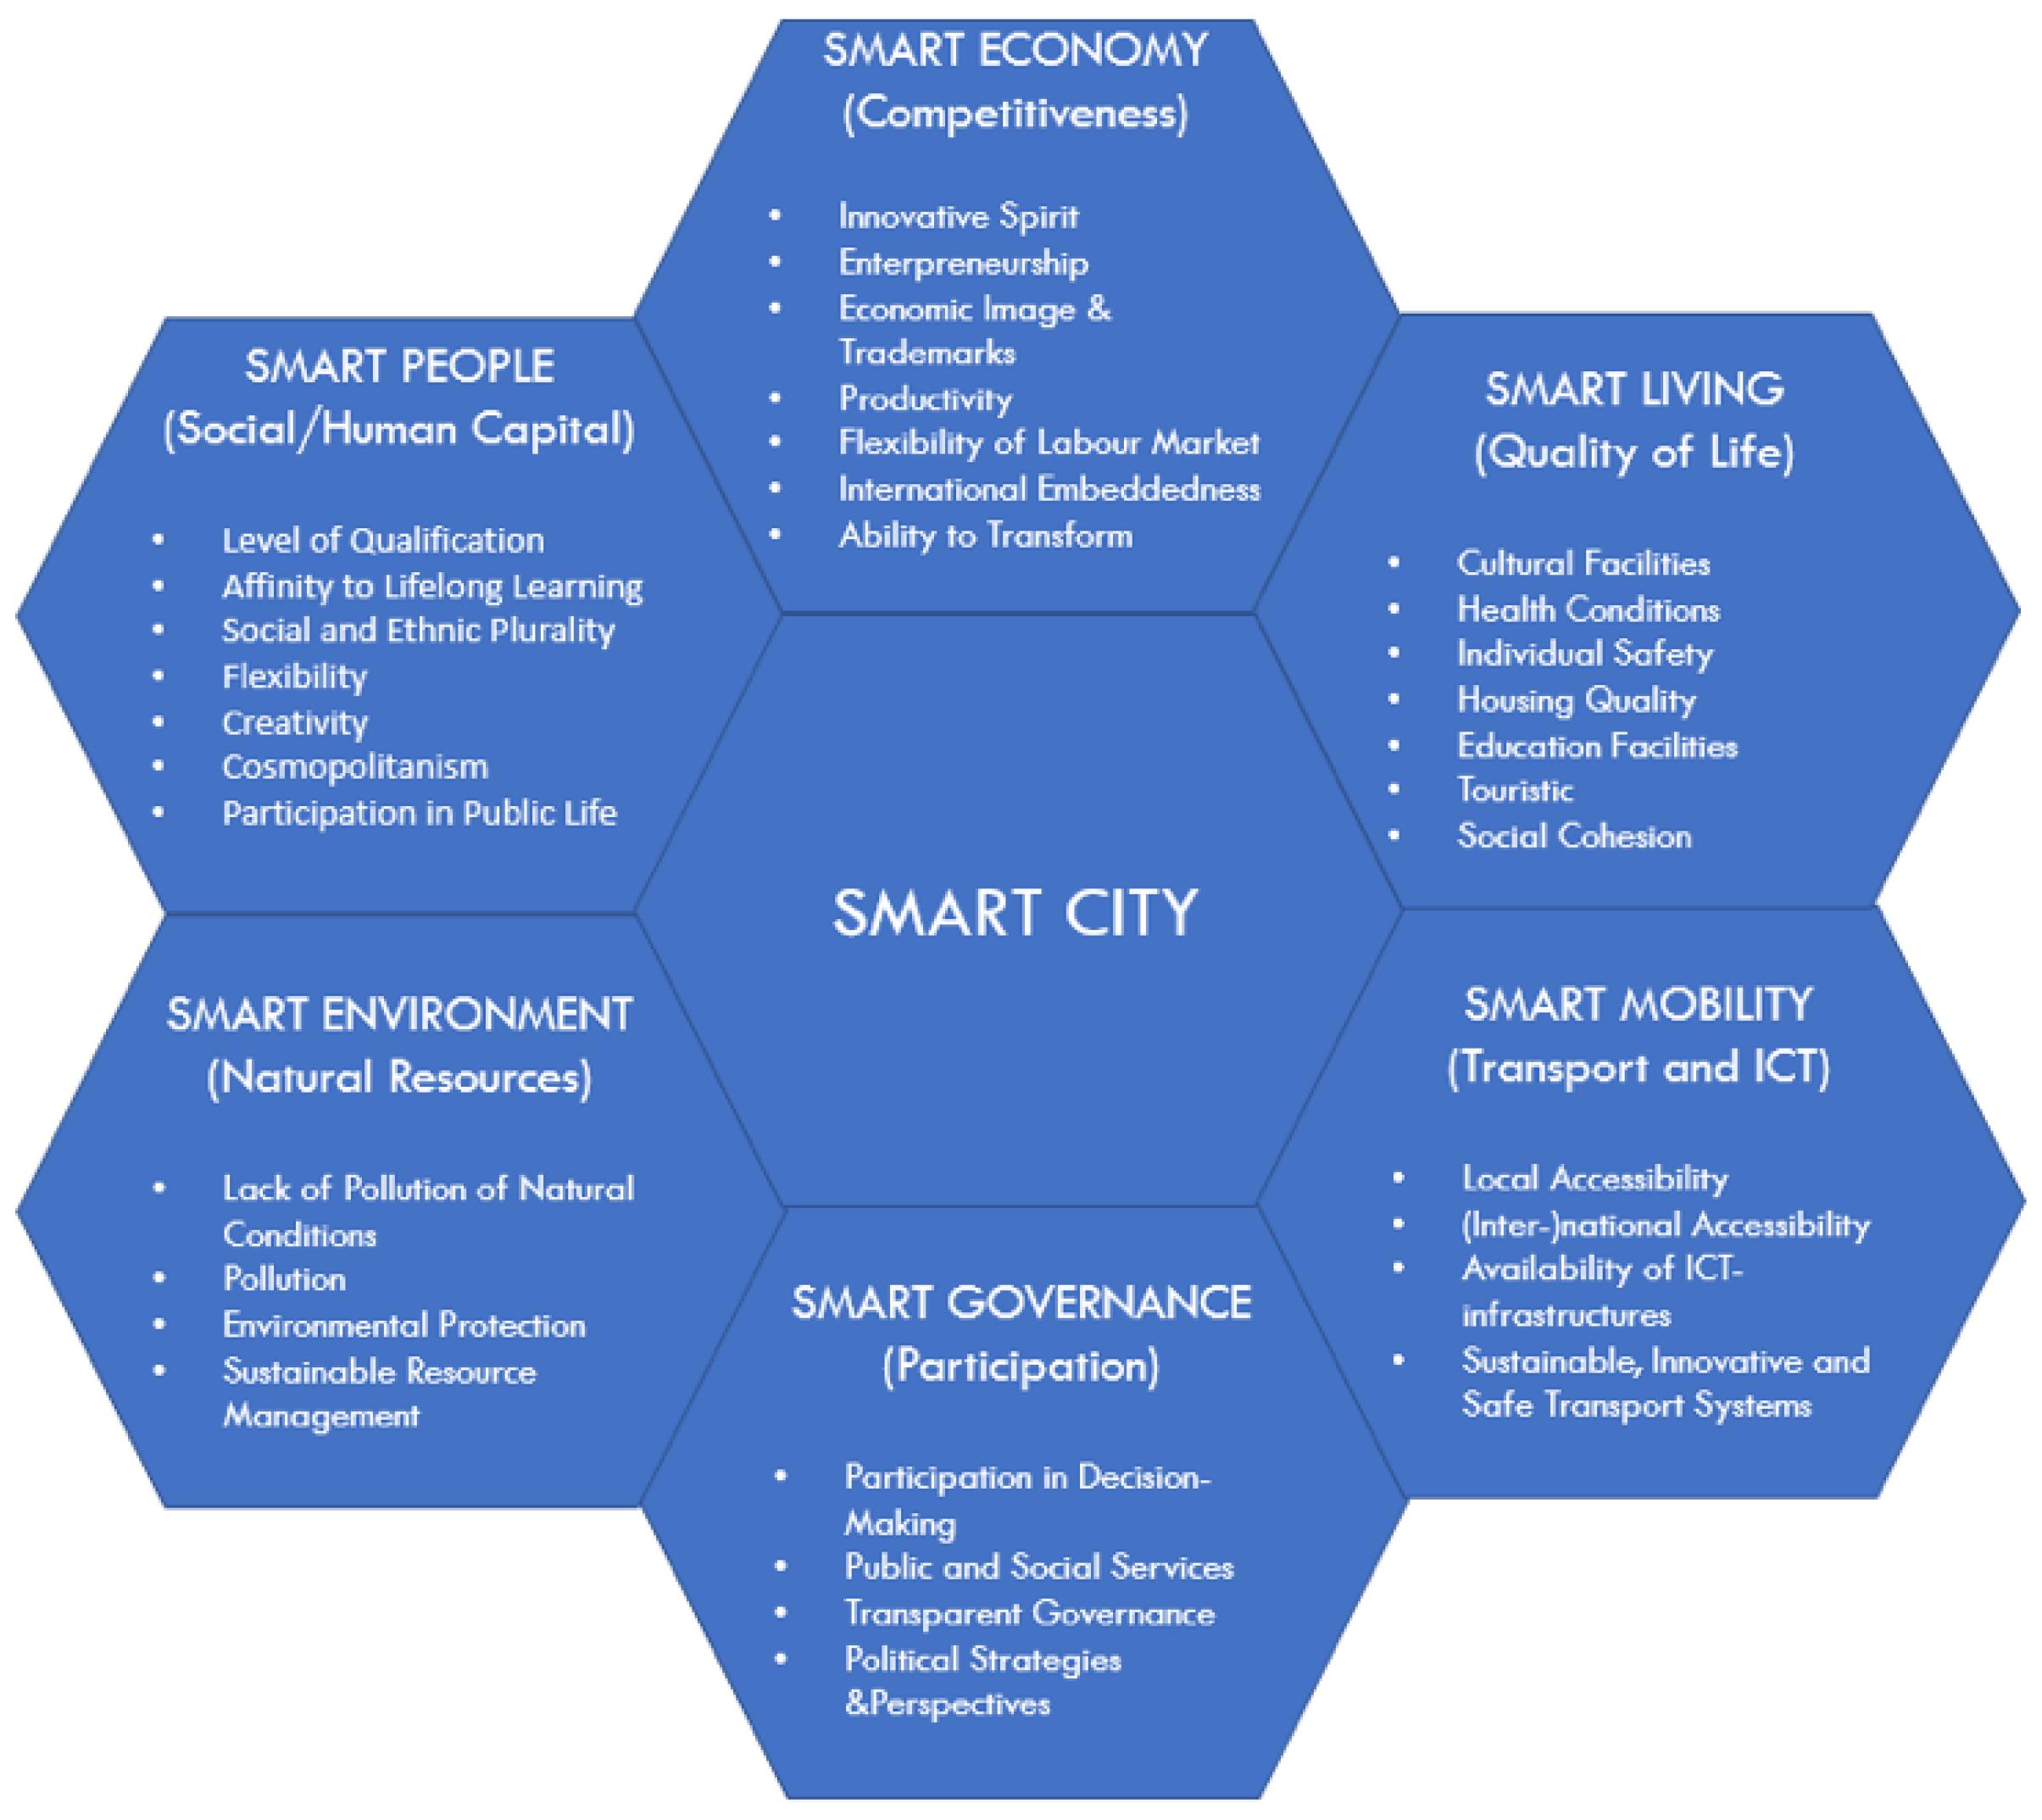
3.2. Smart City Dimensions

In Giffinger et al. [30], the authors discovered the four primary components of a smart city, which are education, participation, industry and technical infrastructure. Subsequently, after a more extensive analysis of the aforementioned components along with a smart city project that was run by the Centre of Regional Science at the Vienna University of Technology the following six main dimensions/pillars of a smart city were identified: smart economy, smart people, smart governance, smart living, smart environment and smart mobility [31]. A summary of the six main dimensions is presented in Figure 1.
The inclusion of “quality of life” as an additional dimension of a smart city would be particularly interesting. However, a significant number of scholars and researchers argue that “quality of life” should not be included in the dimension list as a separate smart city pillar, as all the actions that are taken in the other six pillars have a common goal which is to improve the quality of life [32]. Each one of the six dimensions is linked to several individual factors. The dimensions constitute a smart city model, which was developed as a ranking tool, to evaluate mid-sized European smart cities in the corresponding fields of governance, mobility, people, economy, living and environment. [33]. Furthermore, Colldahl et al. in [33] state that the six-dimension model allows the examination of a city’s current state and can identify the areas that need further development to reach the appropriate level of being “smart”. The main focus of the six-dimensional model is to solve the various problems that appear in actual cities and to prevent any possible issues that may appear, such as population-related, mobility, environmental or energy-saving problems. Each smart application should contribute to at least one of the six dimensions, without negatively affecting any of the other ones. For example, an application that contributes to economic prosperity but causes a massive environmental problem can never be considered a smart application [34]. six components of the smart city also synchronize with the “hard” and “soft” domains, thus, they cover all forms of application of the smart city concept [1].

4. Survey Methodology and Analysis

The main purpose of this work is to examine the perception that the Greek and Cypriot citizens have regards to the Smart City concept, and to present their opinions and beliefs about the current level of “smartness” that appears in the city they are currently live. The level of “smartness” is based on how much developed is each one of the six principal pillars of smart cities. Currently, most of the Greek cities have not yet delved into the smart city concept and the development of most of the six Smart City pillars is still in an early stage. In other words, Greece, as a country, is still not totally oriented and adapted towards the implementation of smart-city methods and elements in its cities. For the aforementioned reason, we decided, through this quantitative research, to examine the standpoints of the Greek and Cypriot citizens regarding the implementation of smart city elements into Greek and Cypriot cities. By doing this, some conclusions could be drawn regards to the impact that a smart city has on its citizens at present or in the future. Conclusions also emerged about the intentions of the citizens who are not at all familiar with the smart city concept, as of their interest and willingness to understand the term and the impact in their lives.

4.1. Research Questions

Based on the current literature review on smart cities and the purpose of this study, various research questions have been identified and used for further analysis. These questions lead to conclusions that reveal the Greek and Cypriot citizens’ point of view on the smart city objectives, elements, and applications. The same applies to a small sample of Greek citizens who live in other European countries and have also participated in this survey. Conclusions were eventuated through multiple comparisons and statistical analyses. In addition, in this study a questionnaire was designed based on the identified research questions so that data could be gathered and analyzed to provide thorough answers to the research questions. The research questions correspond to two main categories: the first category includes the participants that have either a small or broad knowledge of the smart city concept and its contributions while the second category includes the participants that are not familiar with the term at all. The research questions that correspond to the first category are shown below:
1.
How many of the citizens who participated in the survey have heard about the “smart city” term? How is the result formed when age, gender and city factors are taken into account?
2.
How many of the participants have a decent (or probably better) knowledge of what a smart city is? How is the result formed when age, gender and city factors are taken into account?
3.
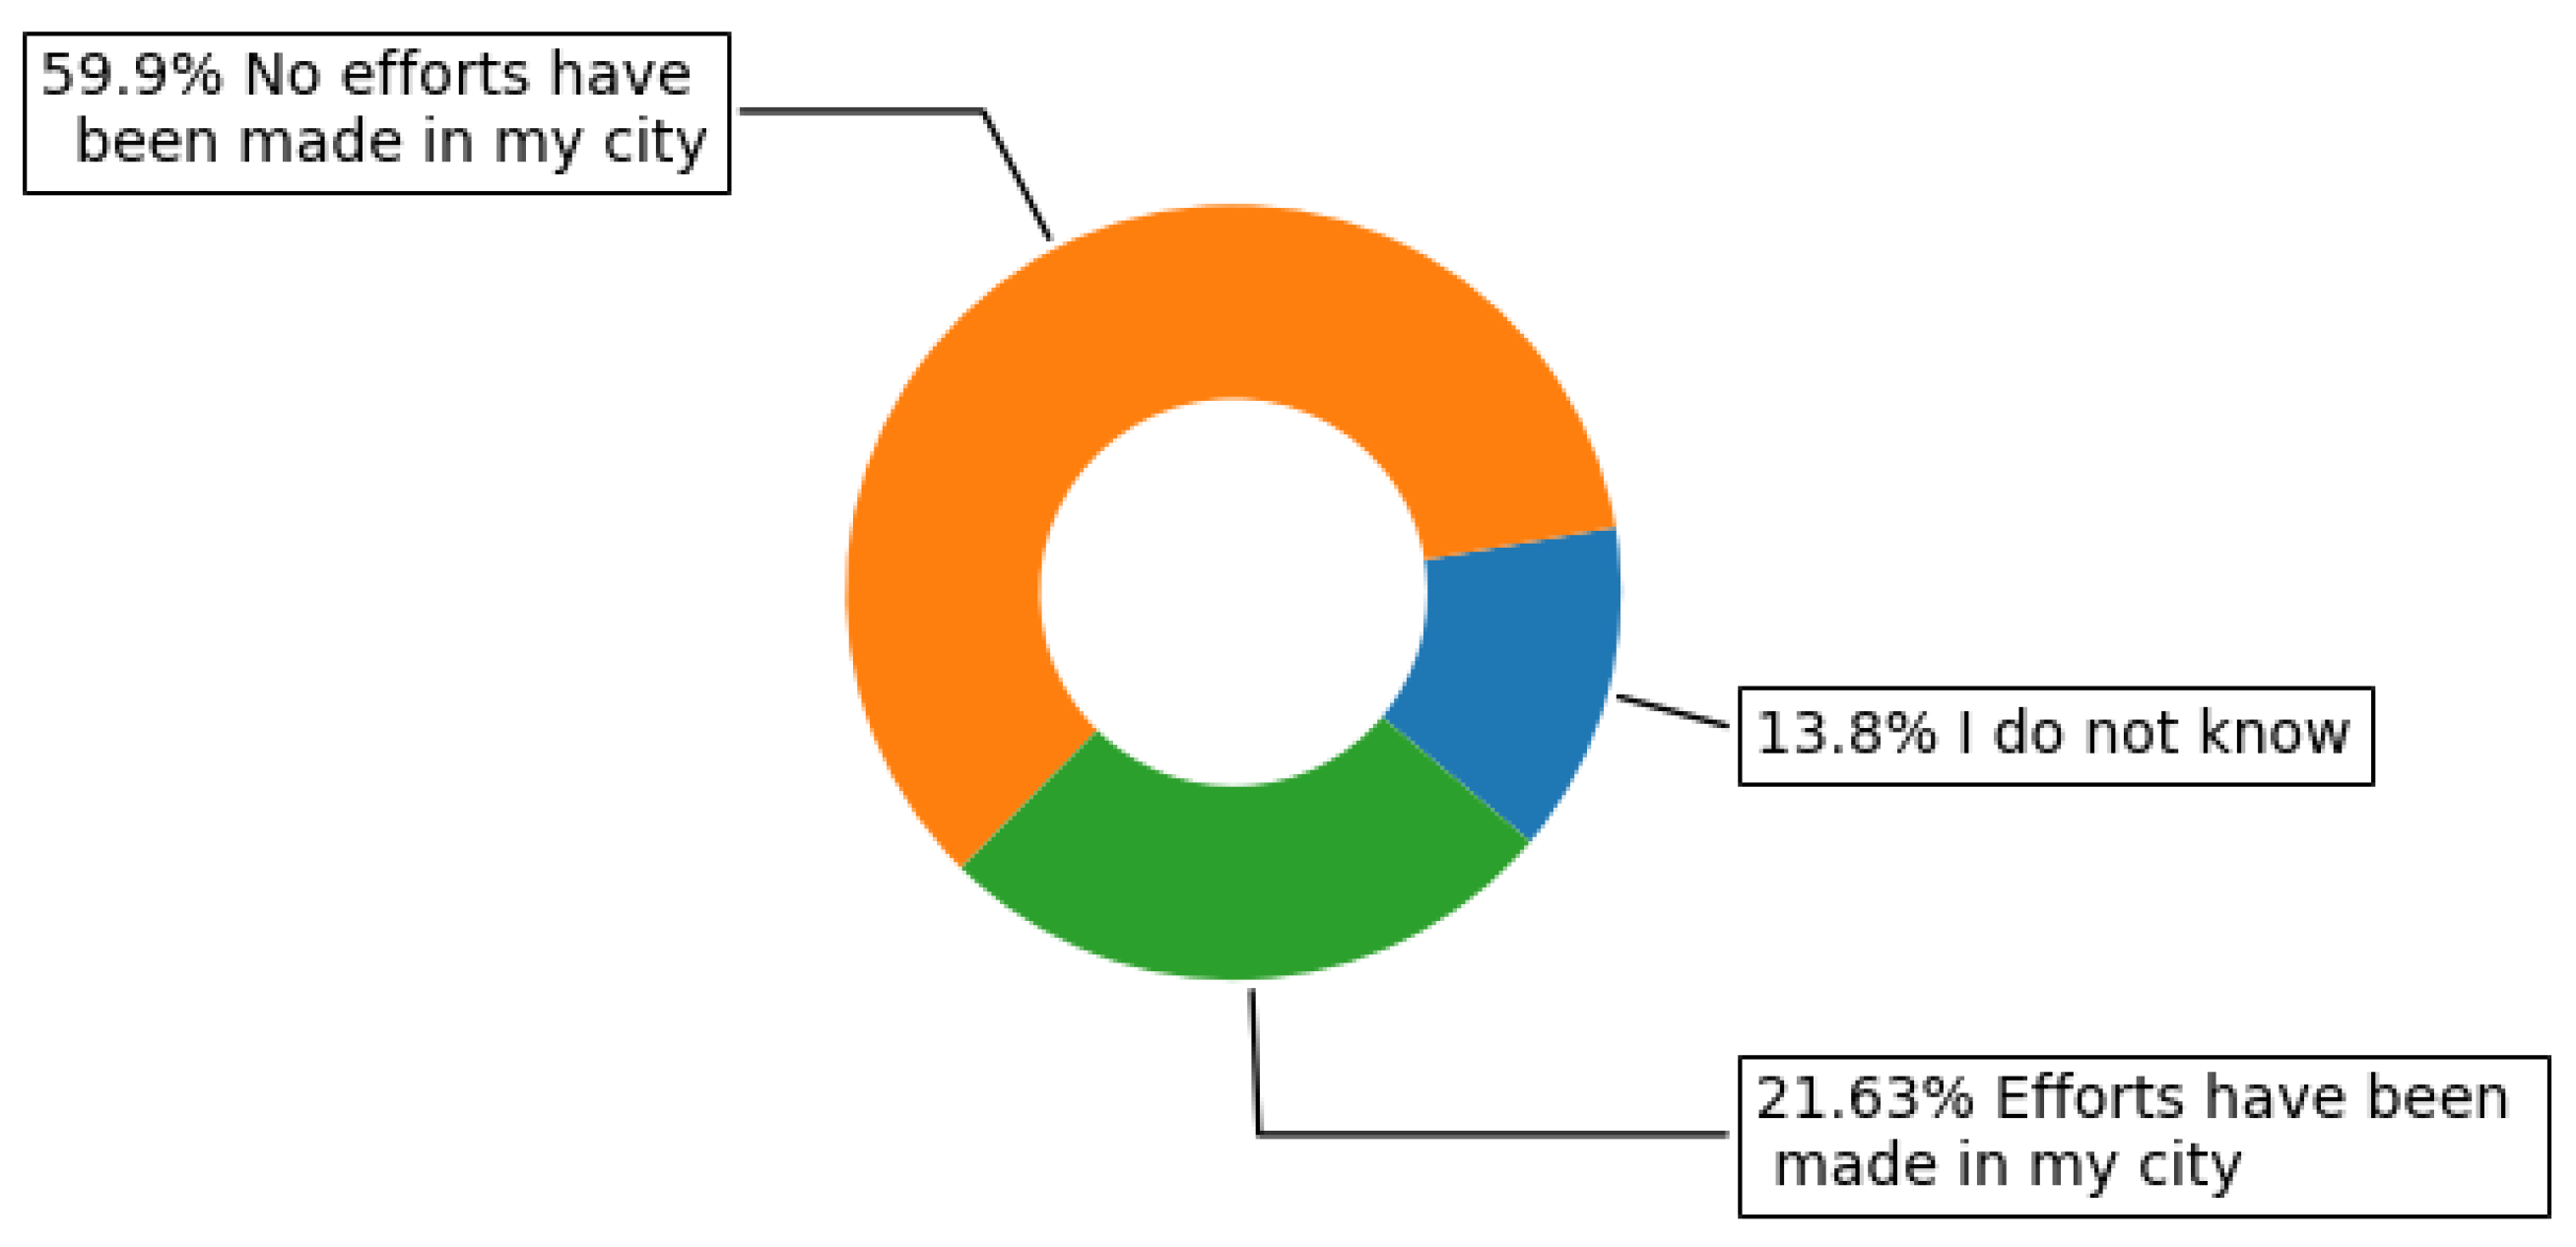
How many of the participants believe that actions have been made in their city so that it can be transformed into a smart city in a holistic way? How is the result formed when the city factor is taken into account?
4.
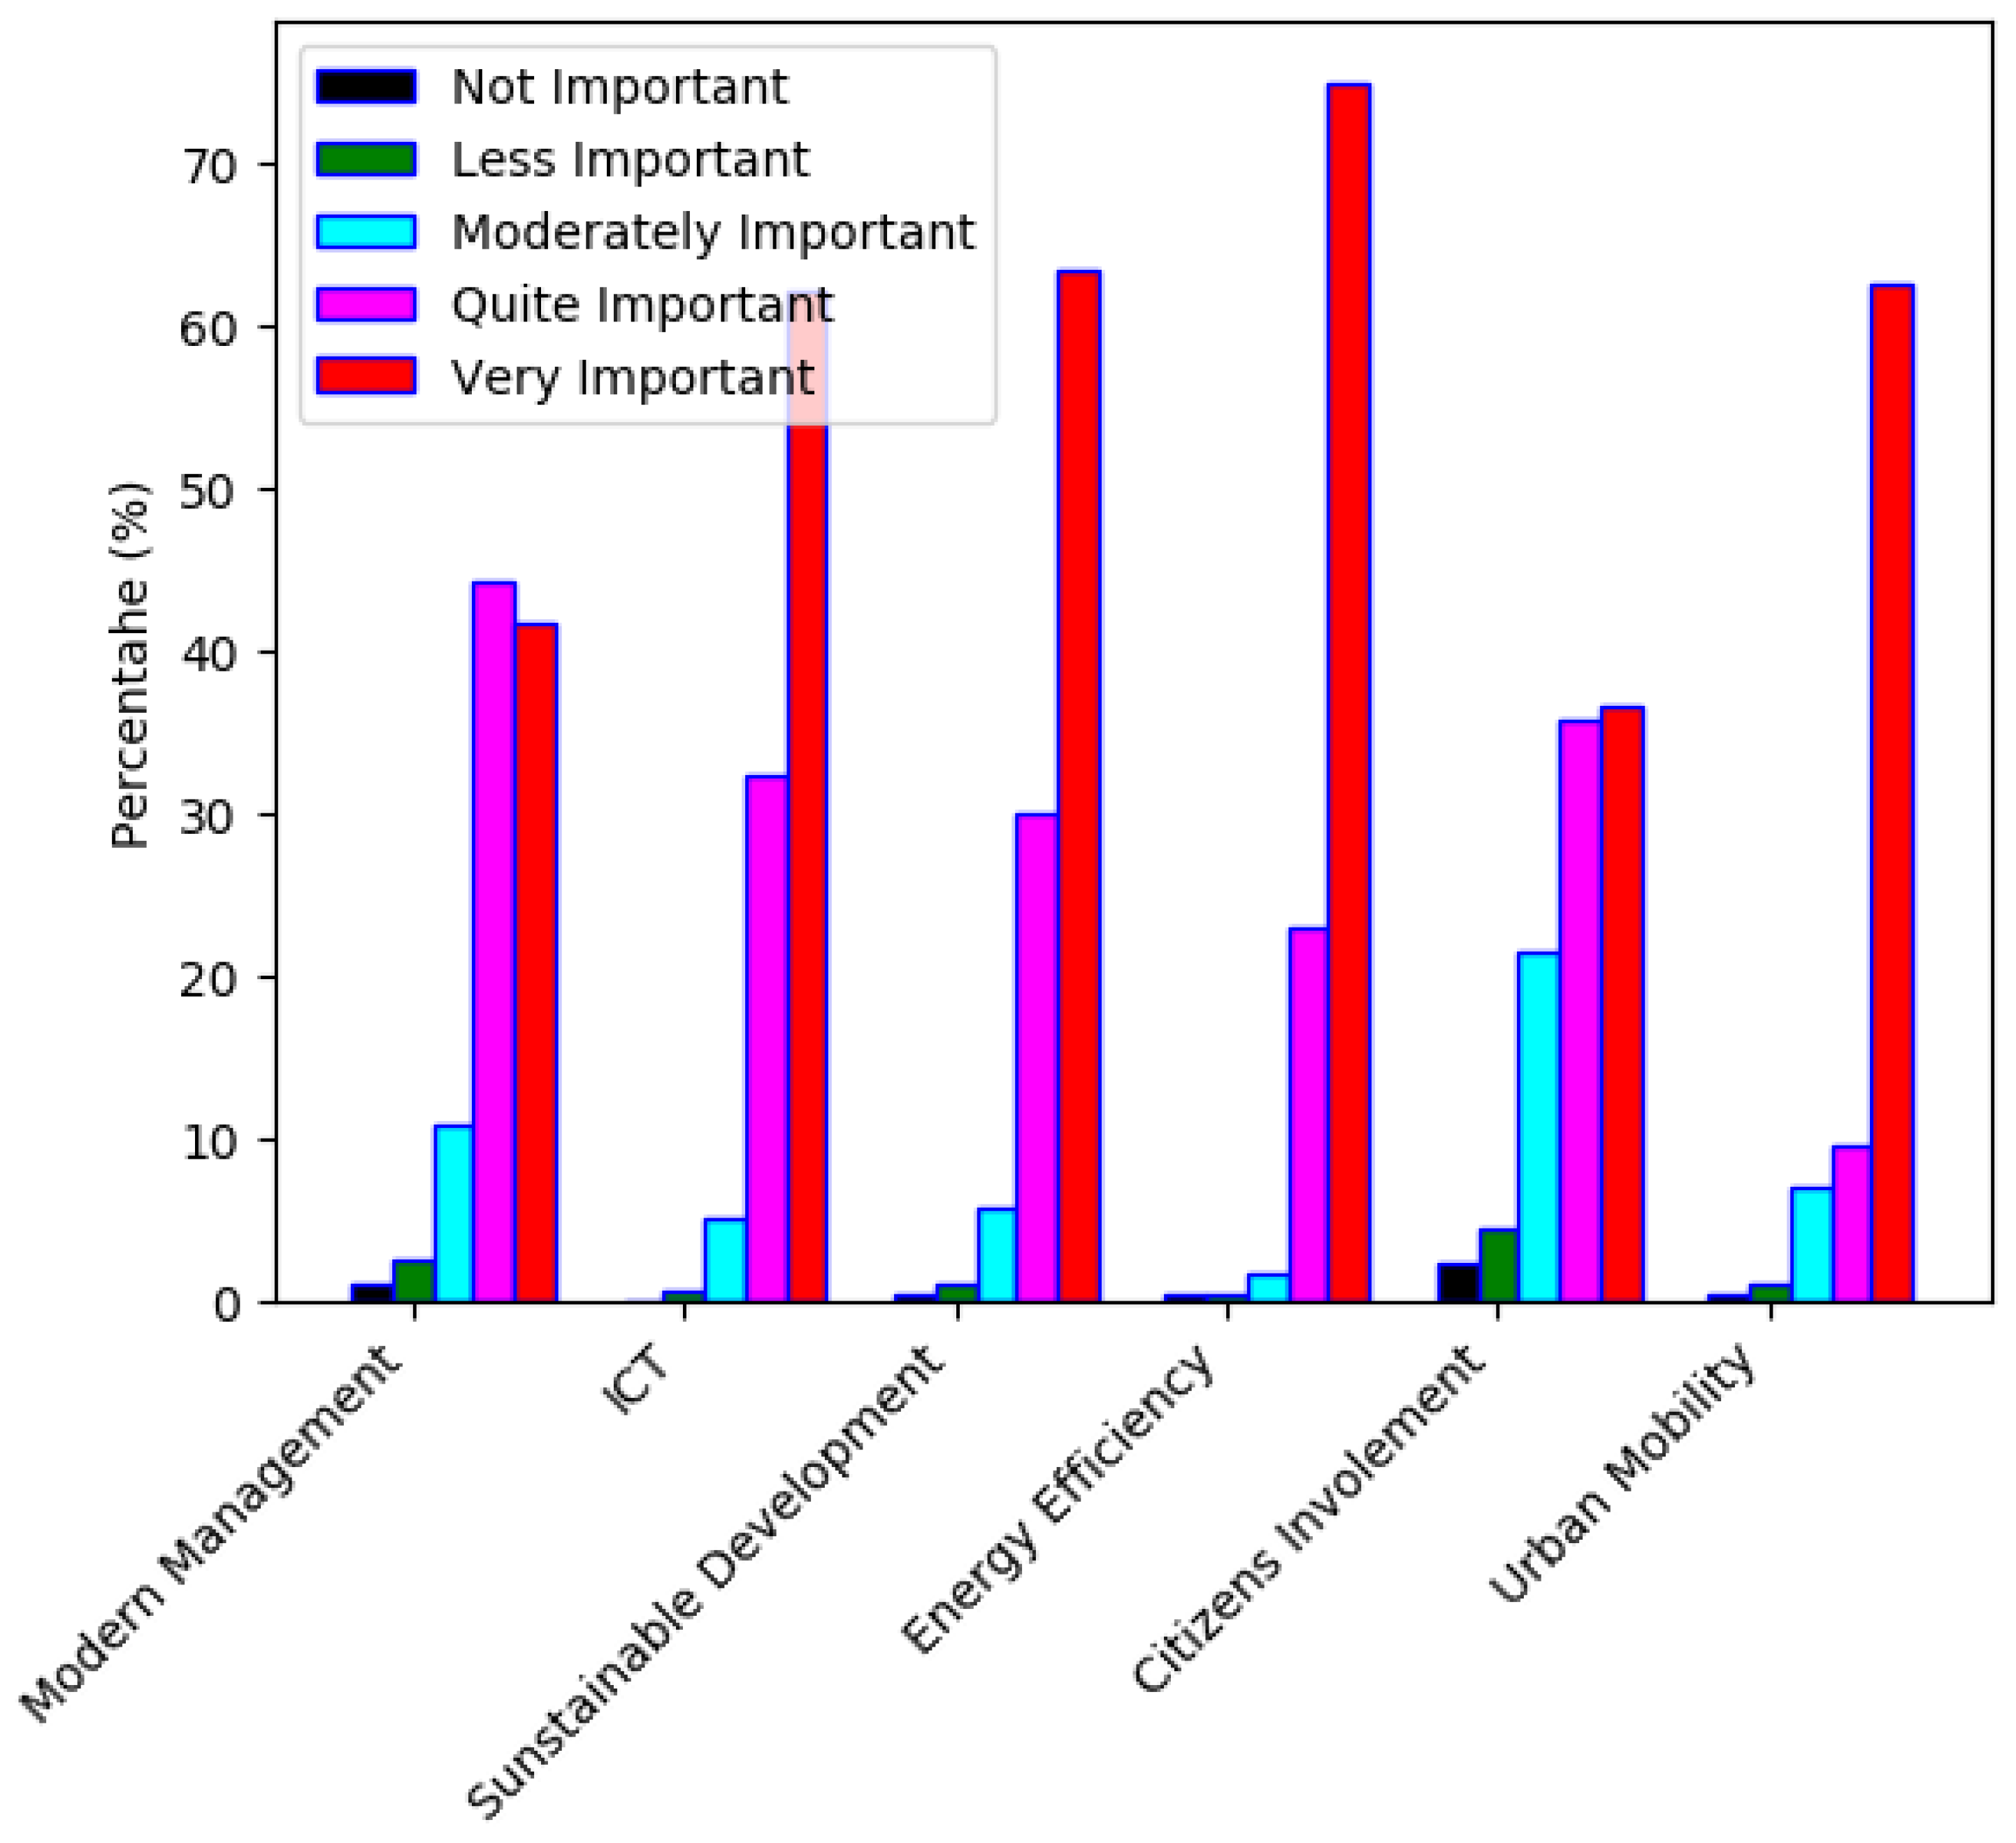
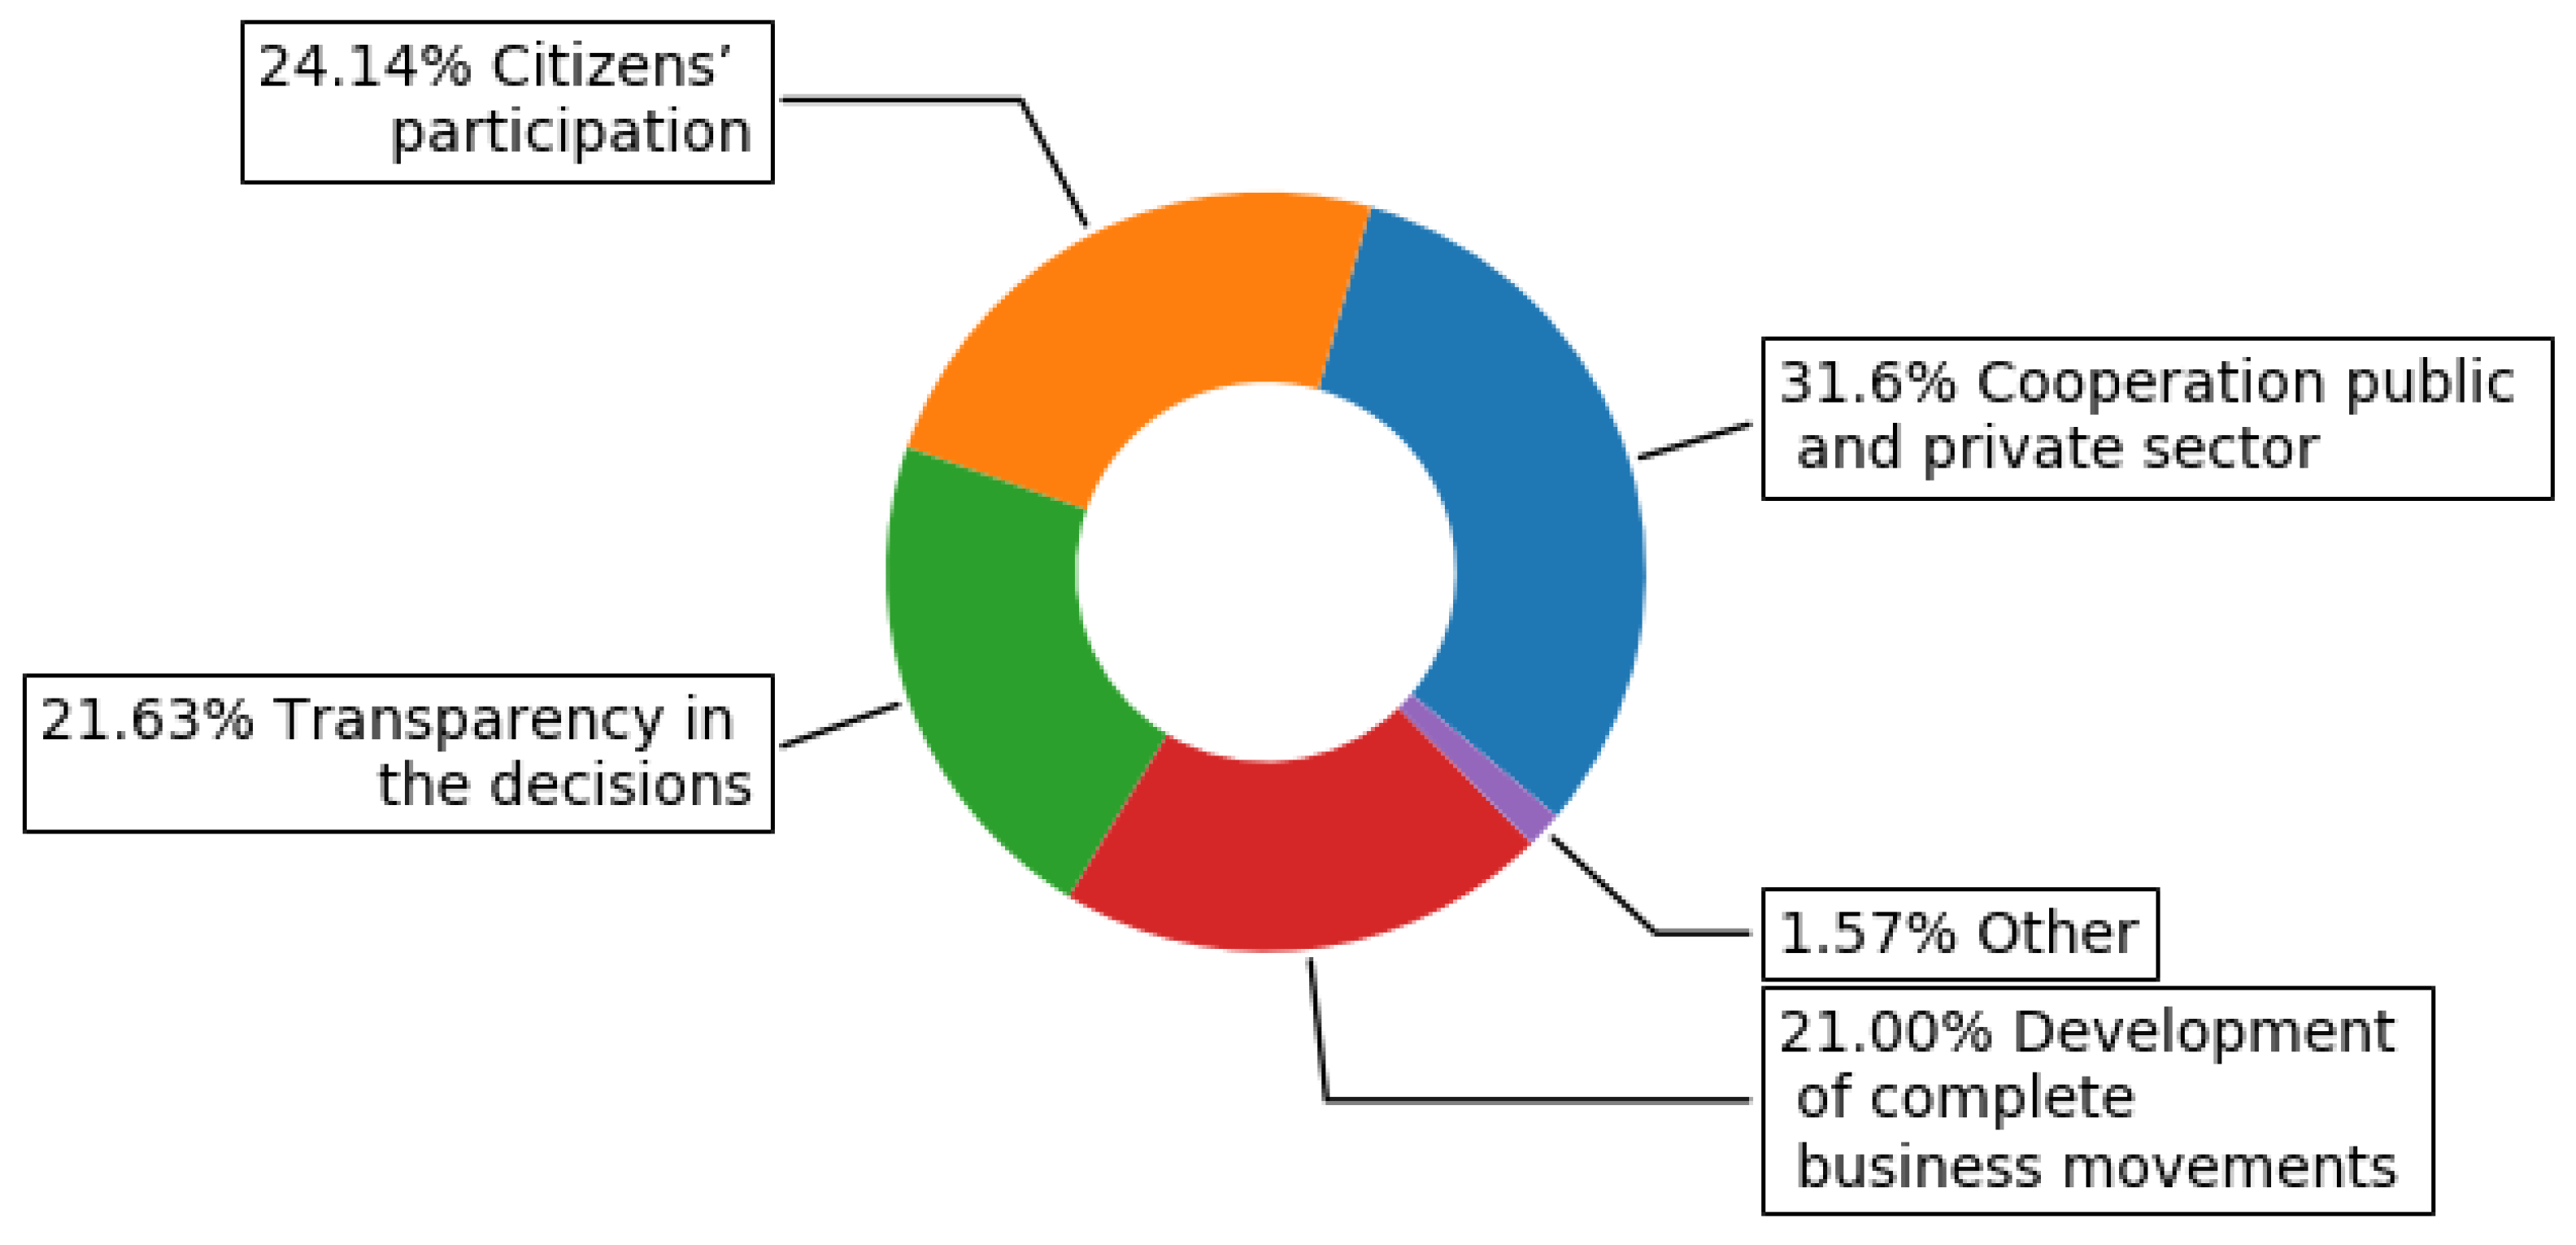
According to the participants, Which challenges are considered as the most important for the development of a smart city? How do these results form when the city factor is taken into account?
The research questions that correspond to the second category of participants (the “non-familiar with the smart city term” ones) are listed below:
1.
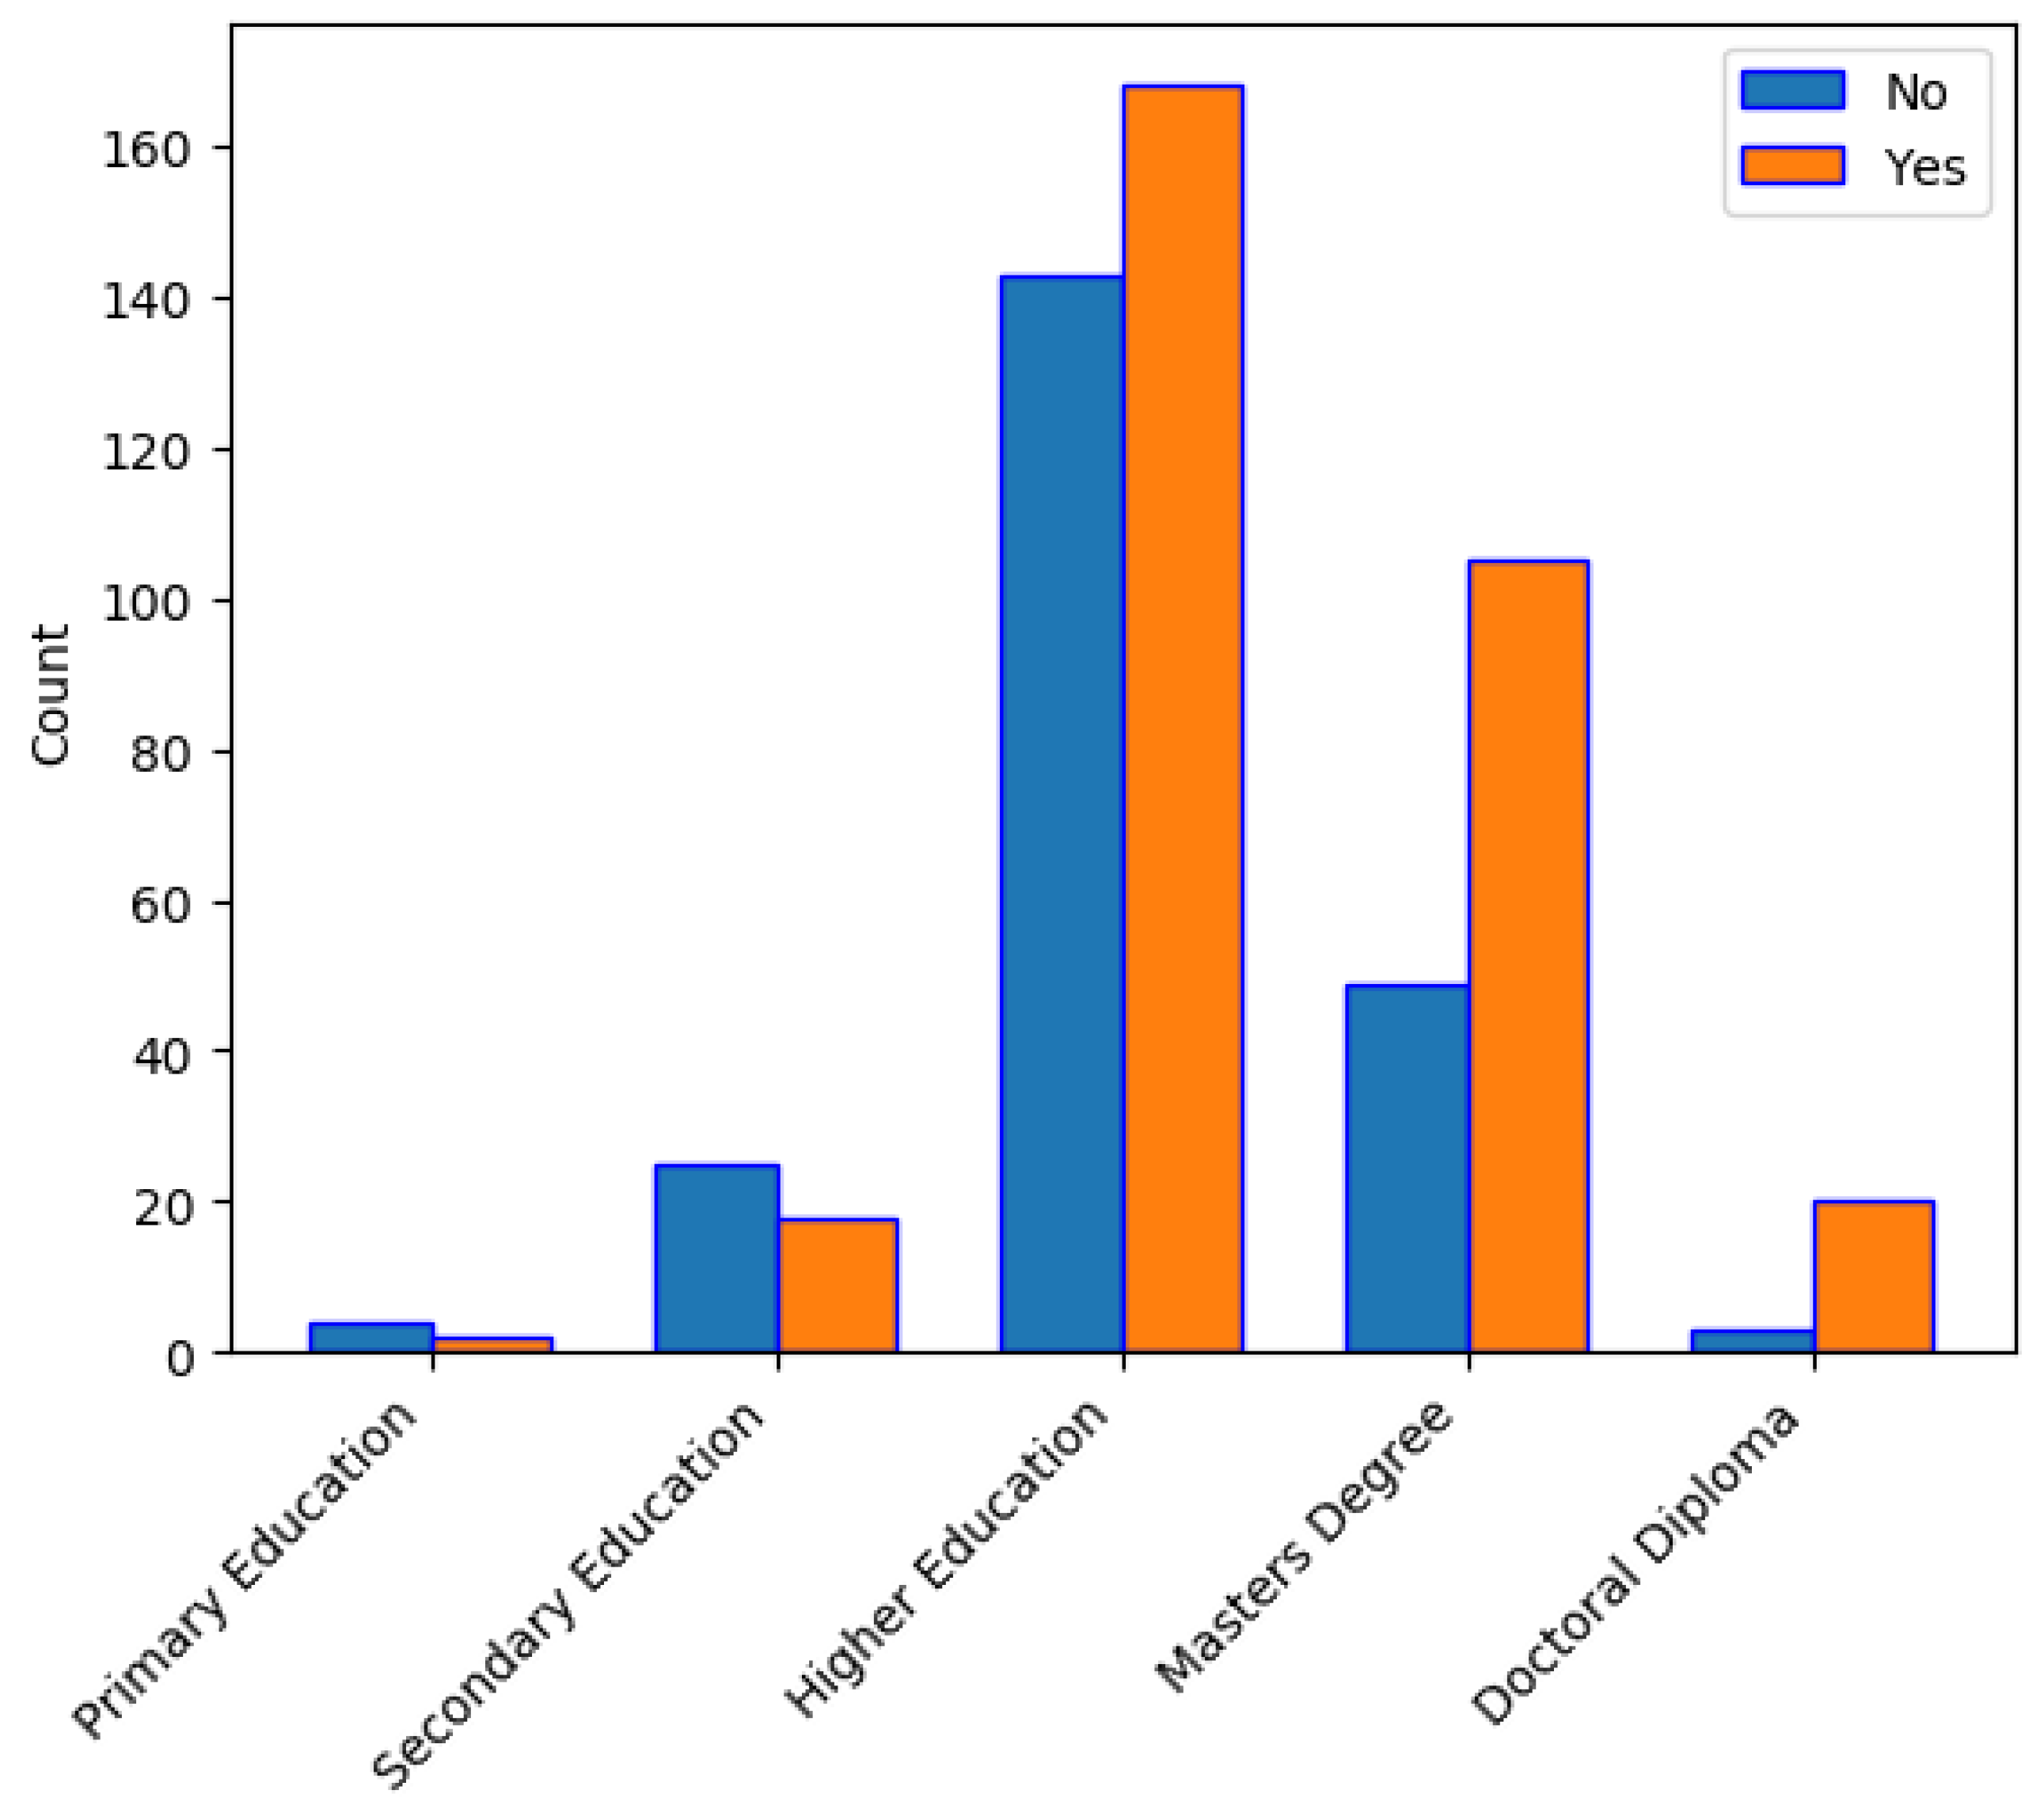
Does the “Education level” factor play a significant role in how the number of non-familiar participants is formed?
2.
Are the non-familiar participants interested in acquiring further information about the smart city concept in the future? How is their opinion affected by their age and city?

4.2. Questionnaire Composure

For the conduction of this quantitative research, we have opted for a questionnaire as a tool for collecting data. The data were collected from the 3rd until the 17th of December, in 2020.
Participants before filling in the questionnaire were introduced to the objectives and the purpose of it. The Greek language was used in the questionnaire as the questionnaire was referring only to Greek-speaking people who live in Greece and Cyprus and also to a small number of Greeks who live in other European countries. Specifically, the questionnaire was filled in by a total of 545 adult respondents from which 415 live in Greece, and 108 in Cyprus. From the Greece respondents, 74 are citizens of Athens, 181 are living in Thessaloniki and 160 of them live in other Greek cities. As of Cyprus, 79 of the respondents live in Paphos, whereas 29 live in other Cypriot cities. Lastly, 22 of the participants are Greeks who live in other European countries.

4.3. Analysis

Internal consistency refers to the general agreement between multiple Likert-scale items that make-up a composite score of a survey measurement of a given construct. This agreement is generally measured by the correlation between items. In order to assess the internal consistency of the questionnaire, the coefficient alpha (Cronbach’s alpha) was calculated for the number of questions that were formed under the Likert scale. The software program that was used for this calculation was the Statistical Package for the Social Sciences (SPSS).
A generally accepted rule is that an alpha coefficient of 0.6–0.7 indicates an acceptable level of reliability whereas a value equal or greater then 0.8 indicates a very good level [35]. For the specific research attempt, the value of Cronbach’s alpha was calculated as 0.935. This fact indicates that, when it comes to the amount of Likert variables, our questionnaire has a very high internal consistency. As a result, the credibility of the present research attempt is certified. The number of “Items” (79 in total) indicates the number of ordinal variables that are included in the questionnaire. The Cronbach’s alpha has also been calculated for the ordinal variables (items) of each of the Likert questions that appear in the research, separately. Each calculation’s result appears in the “Survey Analysis” subchapter, under the statistical analysis of each one of the questions that belong to this specific type.
The Kaiser–Meyer–Olkin (KMO) test as well as Bartlett’s test of Sphericity have also been executed for the number of questions that were formed under the Likert scale. The KMO test is used in research to determine the sampling adequacy of data that will be used for factor analysis [36]. Bartlett’s test of sphericity checks if there is a redundancy between variables that can be summarized with some factors [37]. According to the results, the KMO value (0.854) is considered as meritorious [38], while Bartlett’s test value (Sig. = 0.000) is lower than 0.05. Therefore, the sampling is adequate and the data are suitable for Factor Analysis. All variables are suitable for Factor Analysis, considering the fact that their “Extraction” values are >0.5. More specifically, the extraction values fluctuate from 0.5 to 0.846, as SPSS’s results indicate.
The demographic feature questions formed the questionnaire’s first section. When it comes to the first question (“Gender”), a relative balance seems to appear between the number of men and the number of women that participated in the survey. More specifically, 49% (267 in total) of the participants were women, whereas 51% (278 in total). The second question was about the participants’ age. As already mentioned earlier, only adults participated in this survey. Out of the total respondents, 37.2% (203 in total) were from 18 to 30 years old; 50.03% (274 in total) were from 31 to 40 years old; 9.4% (51 in total) were from 41 to 50 years old; 2.4% (13 in total) were from 51 to 60 years old and, lastly, a small percentage of 0.7% (4 in total) were older than 60 years old. As a result, a total of 87.5% of the citizens that have taken part in the survey were from 18 to 40 years old.
Most of the participants (57.1%, which corresponds to 311 citizens in total) belong to the “Higher Education” category, whereas a quite high percentage of 28.3% of the total participants (154 in total) hold a Master’s degree, 9% of all the participants have a lower educational level (primary and secondary education) than the others, 4.2% of the participants are holders of doctoral diploma, while 1.5% of them have declared “Other” as an answer. In general, based on the results, 91% of the participants appear to be highly educated, whereas a total of 9% appear to have a lower educational level.
Regards to the participants’ occupation, most of the participants (47.7%) work as private employees, while 19.6% of them are freelancers and 15% of them are civil employees. The college students constitute 8.4% of the participants, and the rest 9.2%, are unemployed or retired citizens. The participants that have taken part in this survey are citizens of a total of 61 cities all over Greece, Cyprus and other European countries. In order to analyze the data in a more composed way, we decided to classify the cities into six big categories:
1.
Citizens of Thessaloniki.
2.
Citizens of Athens.
3.
Citizens who live in other cities within Greece (Rest of Greece).
4.
Citizens of Paphos.
5.
Citizens who live in other cities within Cyprus (Rest of Cyprus), such as Larnaca, Limassol, Nicosia.
6.
Greek citizens who live in other European cities, such as London, Liverpool, Manchester Stuttgart, Frankfurt, Copenhagen, Madrid, Bucuresti, Groningen etc.
Specifically, 33.2% of the participants live in Thessaloniki (181 in total number) and 13.4% of them live in Athens (73 in total), while there is a total number of 160 Greek citizens (29.5% in percentage number) who live in other 41 Greek cities than Athens and Thessaloniki. As of Cyprus, 14.5% of the participants live in Paphos, while 5.3% live in other Cypriot cities. The 4% of the participants are Greeks who live in other European cities. Table 1 summarizes the results.
The five first questions (as shown in Table 1) constituted the questionnaire’s first section and were common questions for all participants. The subsequent question was: “Have you ever heard the term “Smart City” before?” and was purpose was to separate the correspondents who were familiar with the smart city term from those who were not. The results showed that 58.5% of the participants answered “Yes”. This means that 319 of the participants stated that they had at least heard the smart city term or had a decent knowledge about it.
Then the 319 participants, were asked to express their opinion by answering the following question: “To what extent do you believe that the following options correlate with the smart city concept?”. Since that question was created by the five-point Likert scale, each of its items constituted an ordinal variable in SPSS software. As a result, the Cronbach’s alpha value was calculated for the amount of the ordinal variables of this question so that the internal consistency of these items could be checked. We notice that the value of Cronbach’s alpha is 0.606, which indicates an acceptable level of reliability. A number of options/items were presented to the participants. They were offered to choose among the following responses for each option: “Not important at all”, “Less important”, “Moderately important”, “Quite important” and “Very important”. Generally, the participants acknowledged the fact that all options given are of high importance for the development of a smart city project; thus, “Not important” and “Less important” options gathered an insignificant percentage amount. The results also showed that the two options that gathered the highest percentages of “Very important” responses were the “Efficient use of energy” option (74.9% of the participants opted for “Very important”) and the “Sustainable development” (63.3% of the participants opted for “Very important”). The results are shown in Figure 2.
Afterwards, the participants were asked the following: “Do you think that efforts have been made in order for your city to be transformed into a “Smart City”? Out of the 319 participants, 84 of them (26.3%) answered “Yes”, 191 (59.9%) answered “No” and 44 (13.8%) answered “I do not know”. The 84 participants that answered Yes in the previous question continued to answer the next question: “In which of the following sectors have you noticed any kind of activity? The options were related to the six fundamental pillars of a smart city and the participants were offered the capability to choose more than one of the given options. Based on the replies, all options were chosen, in a quite sufficient percentage; the most popular choices were the “Environment” (chosen by 50 out of the 84 participants, a number which corresponds to 59.5%) and the “Mobility” (chosen by 47 out of the 84 participants, a number which corresponds to 56%). The less popular options were the “Living” option (33.3%) and the “Human Capital” option (33.3%). The results are shown in Figure 3.
Question 11 (“In which of the following areas do you think improvements need to be made in the city where you live?”) was also a multiple-choice question, which again offered the six smart city fundamental pillars as choices. The results revealed that, in general, each option has been chosen by the participants in a relatively high percentage; in fact, each option’s choice exceeded the 55 percentage board. This reveals that each one of the options provided was highly chosen by the participants. Typically, the most popular options chosen by the participants were the “Environment” (chosen by 254 out of 319 participants) and “Living” (chosen by 237 out of 319 participants). The results are shown in Figure 4.
Question 12 asked the participants to evaluate the six smart city pillars based on their importance. Since this question was created by the five-point Likert scale, each one of its items constituted an ordinal variable in SPSS software. As a result, the Cronbach’s alpha value was calculated for the number of the ordinal variables of this question so that the internal consistency of these items could be checked. The value of Cronbach’s alpha appears to be 0.701, which indicates an acceptable level of reliability. In question 12, the participants were offered to choose among the following responses for each option: “Not important at all”, “Less important”, “Moderately important”, “Quite important” and “Very important”. The results revealed once again that the participants are generally aware of each one of the pillars’ high importance. This is shown by the fact that the “Quite important” and “Very important” choices (combined) exceeded the 75% percentage board for each of the six pillars provided, whereas “Not important” and “Less important” choices could not even exceed the 5% percentage board for each of them. Table 2 shows the results.

4.3.1. Research Questions Analysis—First Category

In this subsection, the analysis of the research questions that are mentioned in Section 4.1 is presented. In addition, statistical tests are applied to check if there is any kind of dependency between the categorical variables that are related to each research question.
For the first research question, the Chi-Square statistic test was used to test if there is any relationship or dependence between gender and the fact that a participant has heard the term “Smart City”. The p-value < 0.001 is less than 0.05 which means that the result is statistically significant, and that the independence hypothesis is rejected. In other words, there is a dependency between the variables and this means that gender is indeed related to the fact that the participant has heard the term. Figure 5 shows the results.
The above results show that 66.9% of men (186 out of 278 in total) claimed that they had heard the term, whereas 49.8% of women claimed the same (133 out of 267 in total). This indicates that, based on the research, men are more familiar with the term “Smart City” than women.
Furthermore, in order to investigate the relationship of dependence between age and the fact that a participant has heard the term “Smart City” we used the Chi-Square statistic test for these variables. The p-value is 0.066 > 0.05. This means that the independence hypothesis cannot be rejected. In other words, the variables are not likely to be associated, thus age is not a significant factor for a person that has heard the term before.
Finally, we run the Chi-square’s test to investigate if a city is a determinant factor for the fact that a participant has heard the term. The p-value is 0.012 < 0.05 which means that the result is statistically significant, and that the independence hypothesis is rejected. In other words, there is a dependency between the variables and this means that city is indeed related to the fact that the participant has heard the term.
In the second research question, we wanted to investigate if age, gender and city are determinant factors for a better knowledge of what a smart city is. From the 319 participants that have heard the smart city term, 262 of them have a decent or even broader knowledge about it, whereas the rest of them (57 participants) have not, and have just heard the term.
For the three factors, we run the Chi-square’s test and the results are summarized below:
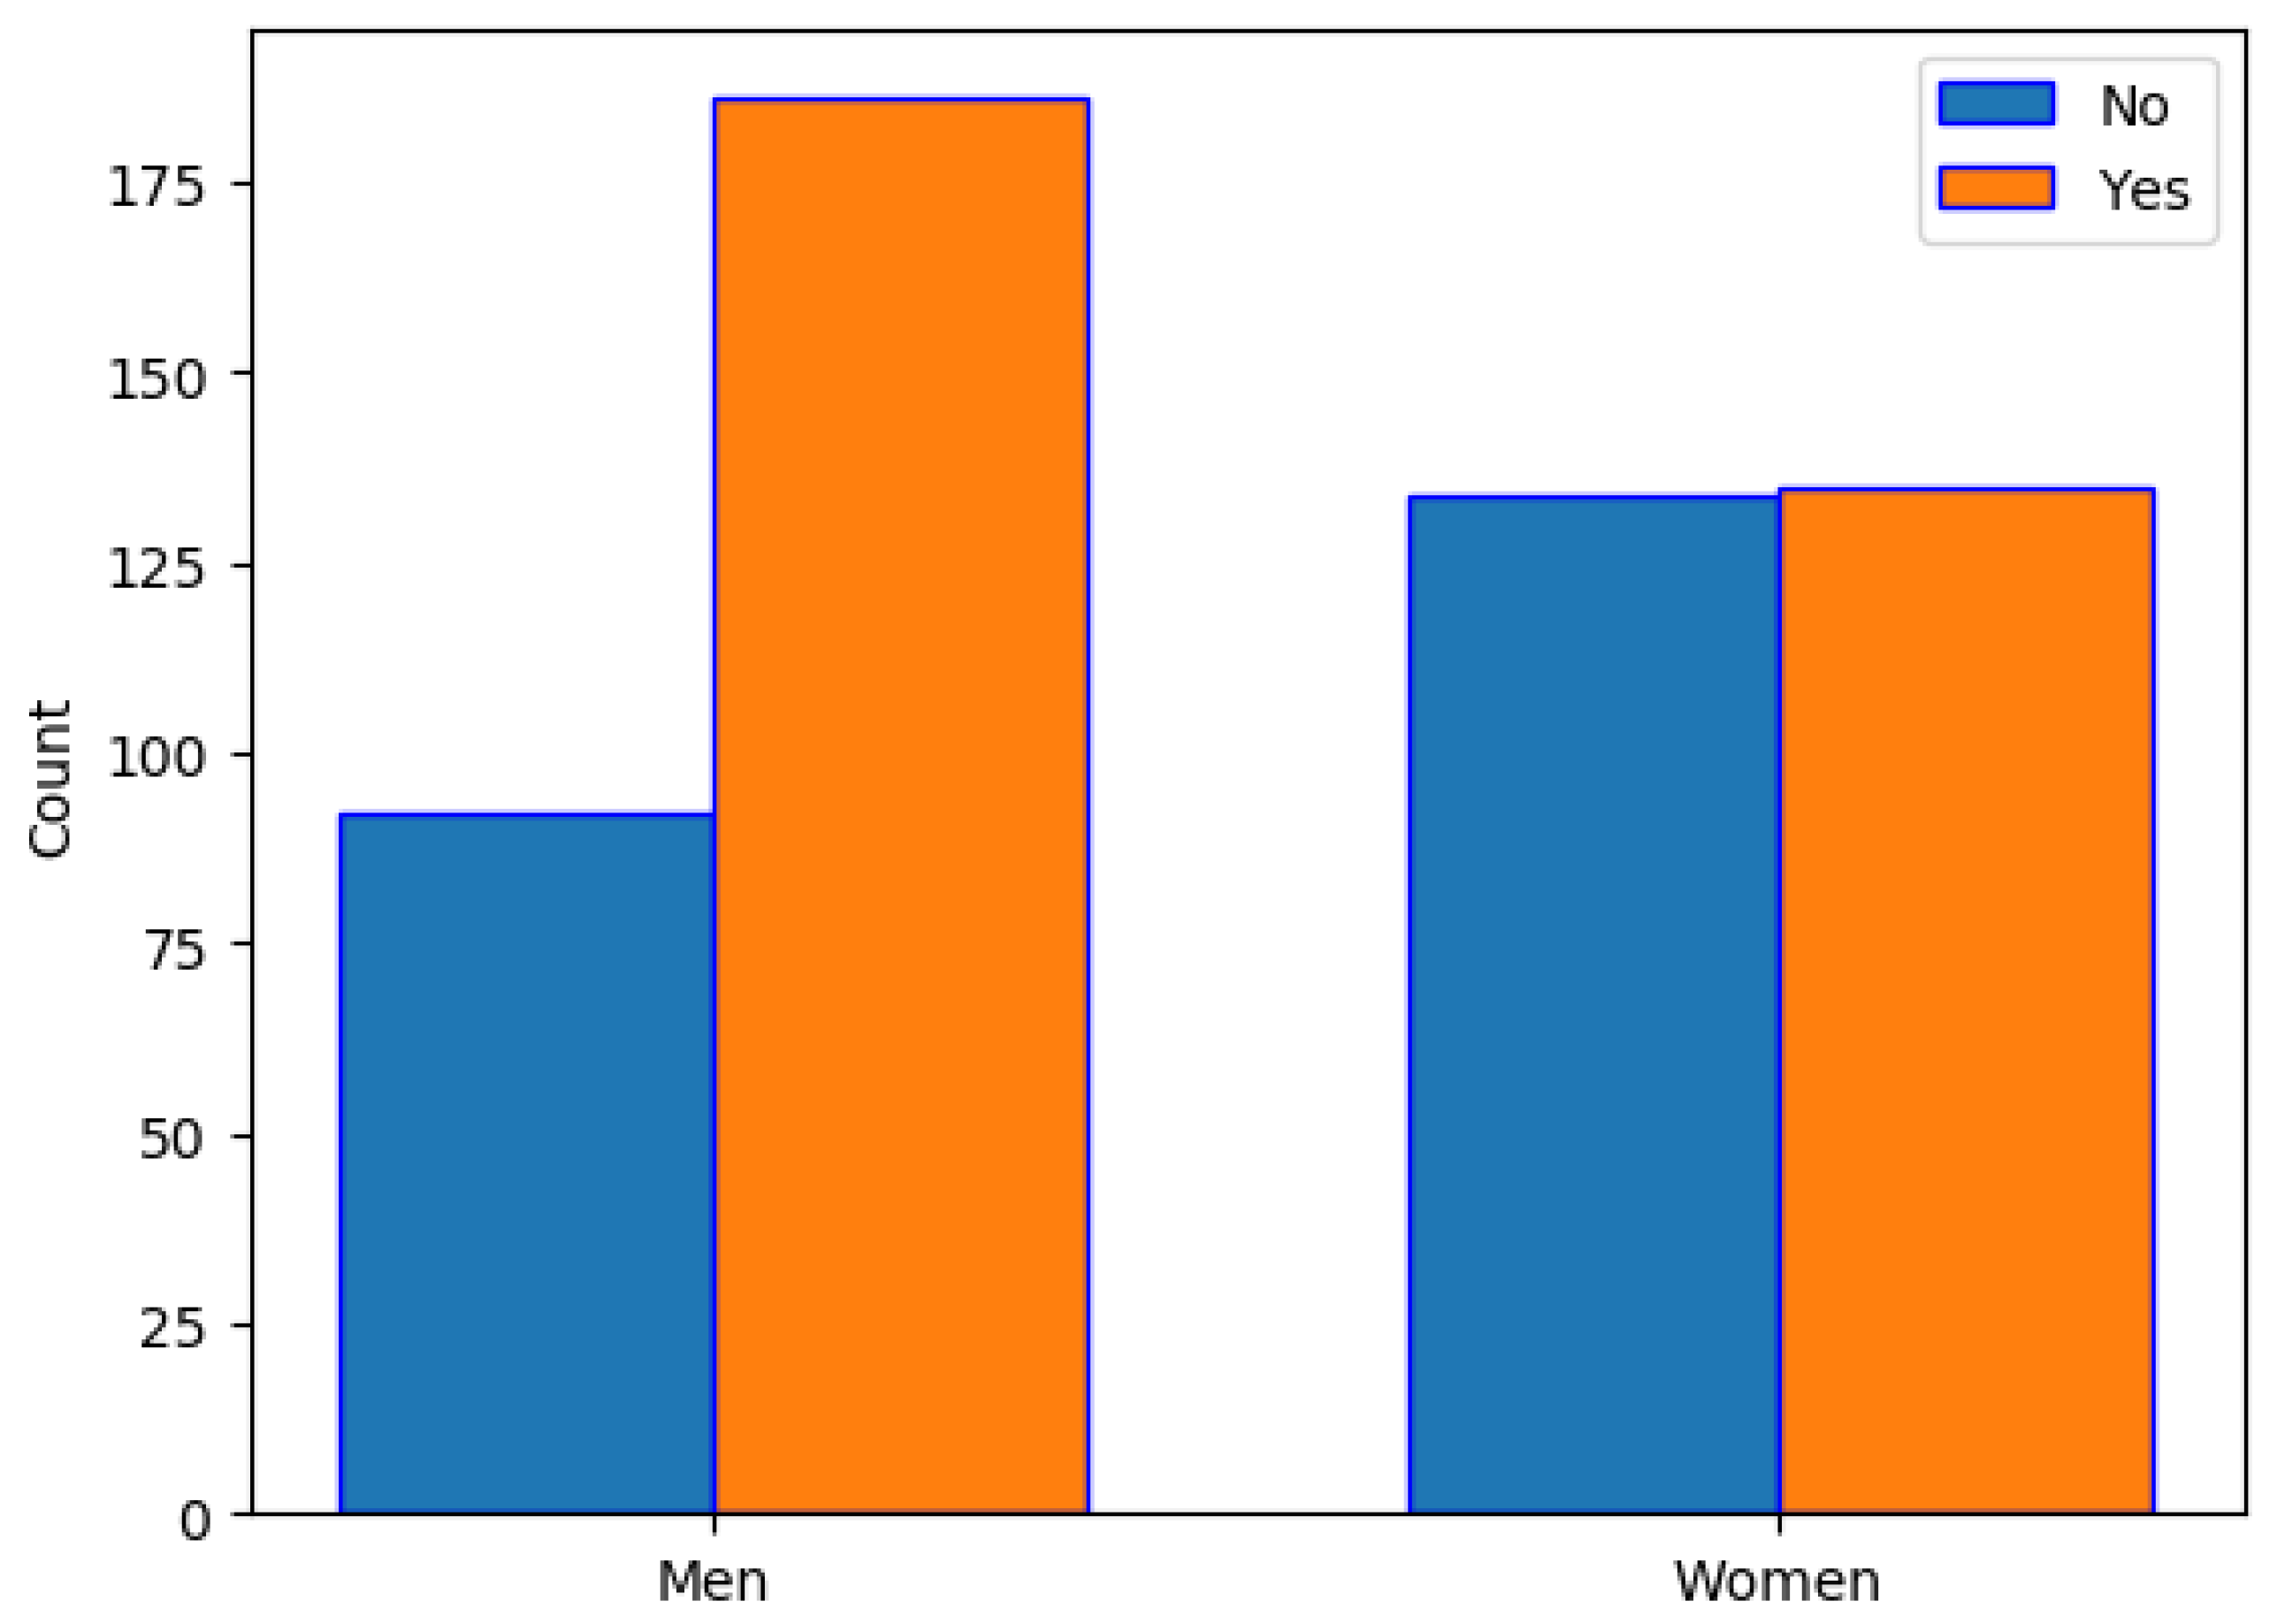
  • Gender: The p-value is 0.121 and bigger than 0.05, thus, the independence hypothesis cannot be rejected. In other words, the variables are not likely to be associated, thus gender is not a significant factor for a person that has a decent or broader knowledge of the term.
  • Age: In this case, we check the Fisher–Freeman–Halton Exact Test value. This value is taken into consideration, instead of the p-value when over 20% of the cells have expected counts less than 5, in order to test if there is any relationship or dependence between the variables [39]. If this value is >0.05, then there is no kind of dependence between the variables that were examined. Otherwise, the variables are associated with each other. In our case, the Fisher–Freeman–Halton value is 0.511 > 0.05, thus, the independence hypothesis cannot be rejected. In other words, the variables are not likely to be associated, thus age is not a significant factor for a person that has a decent or broader knowledge of the term.
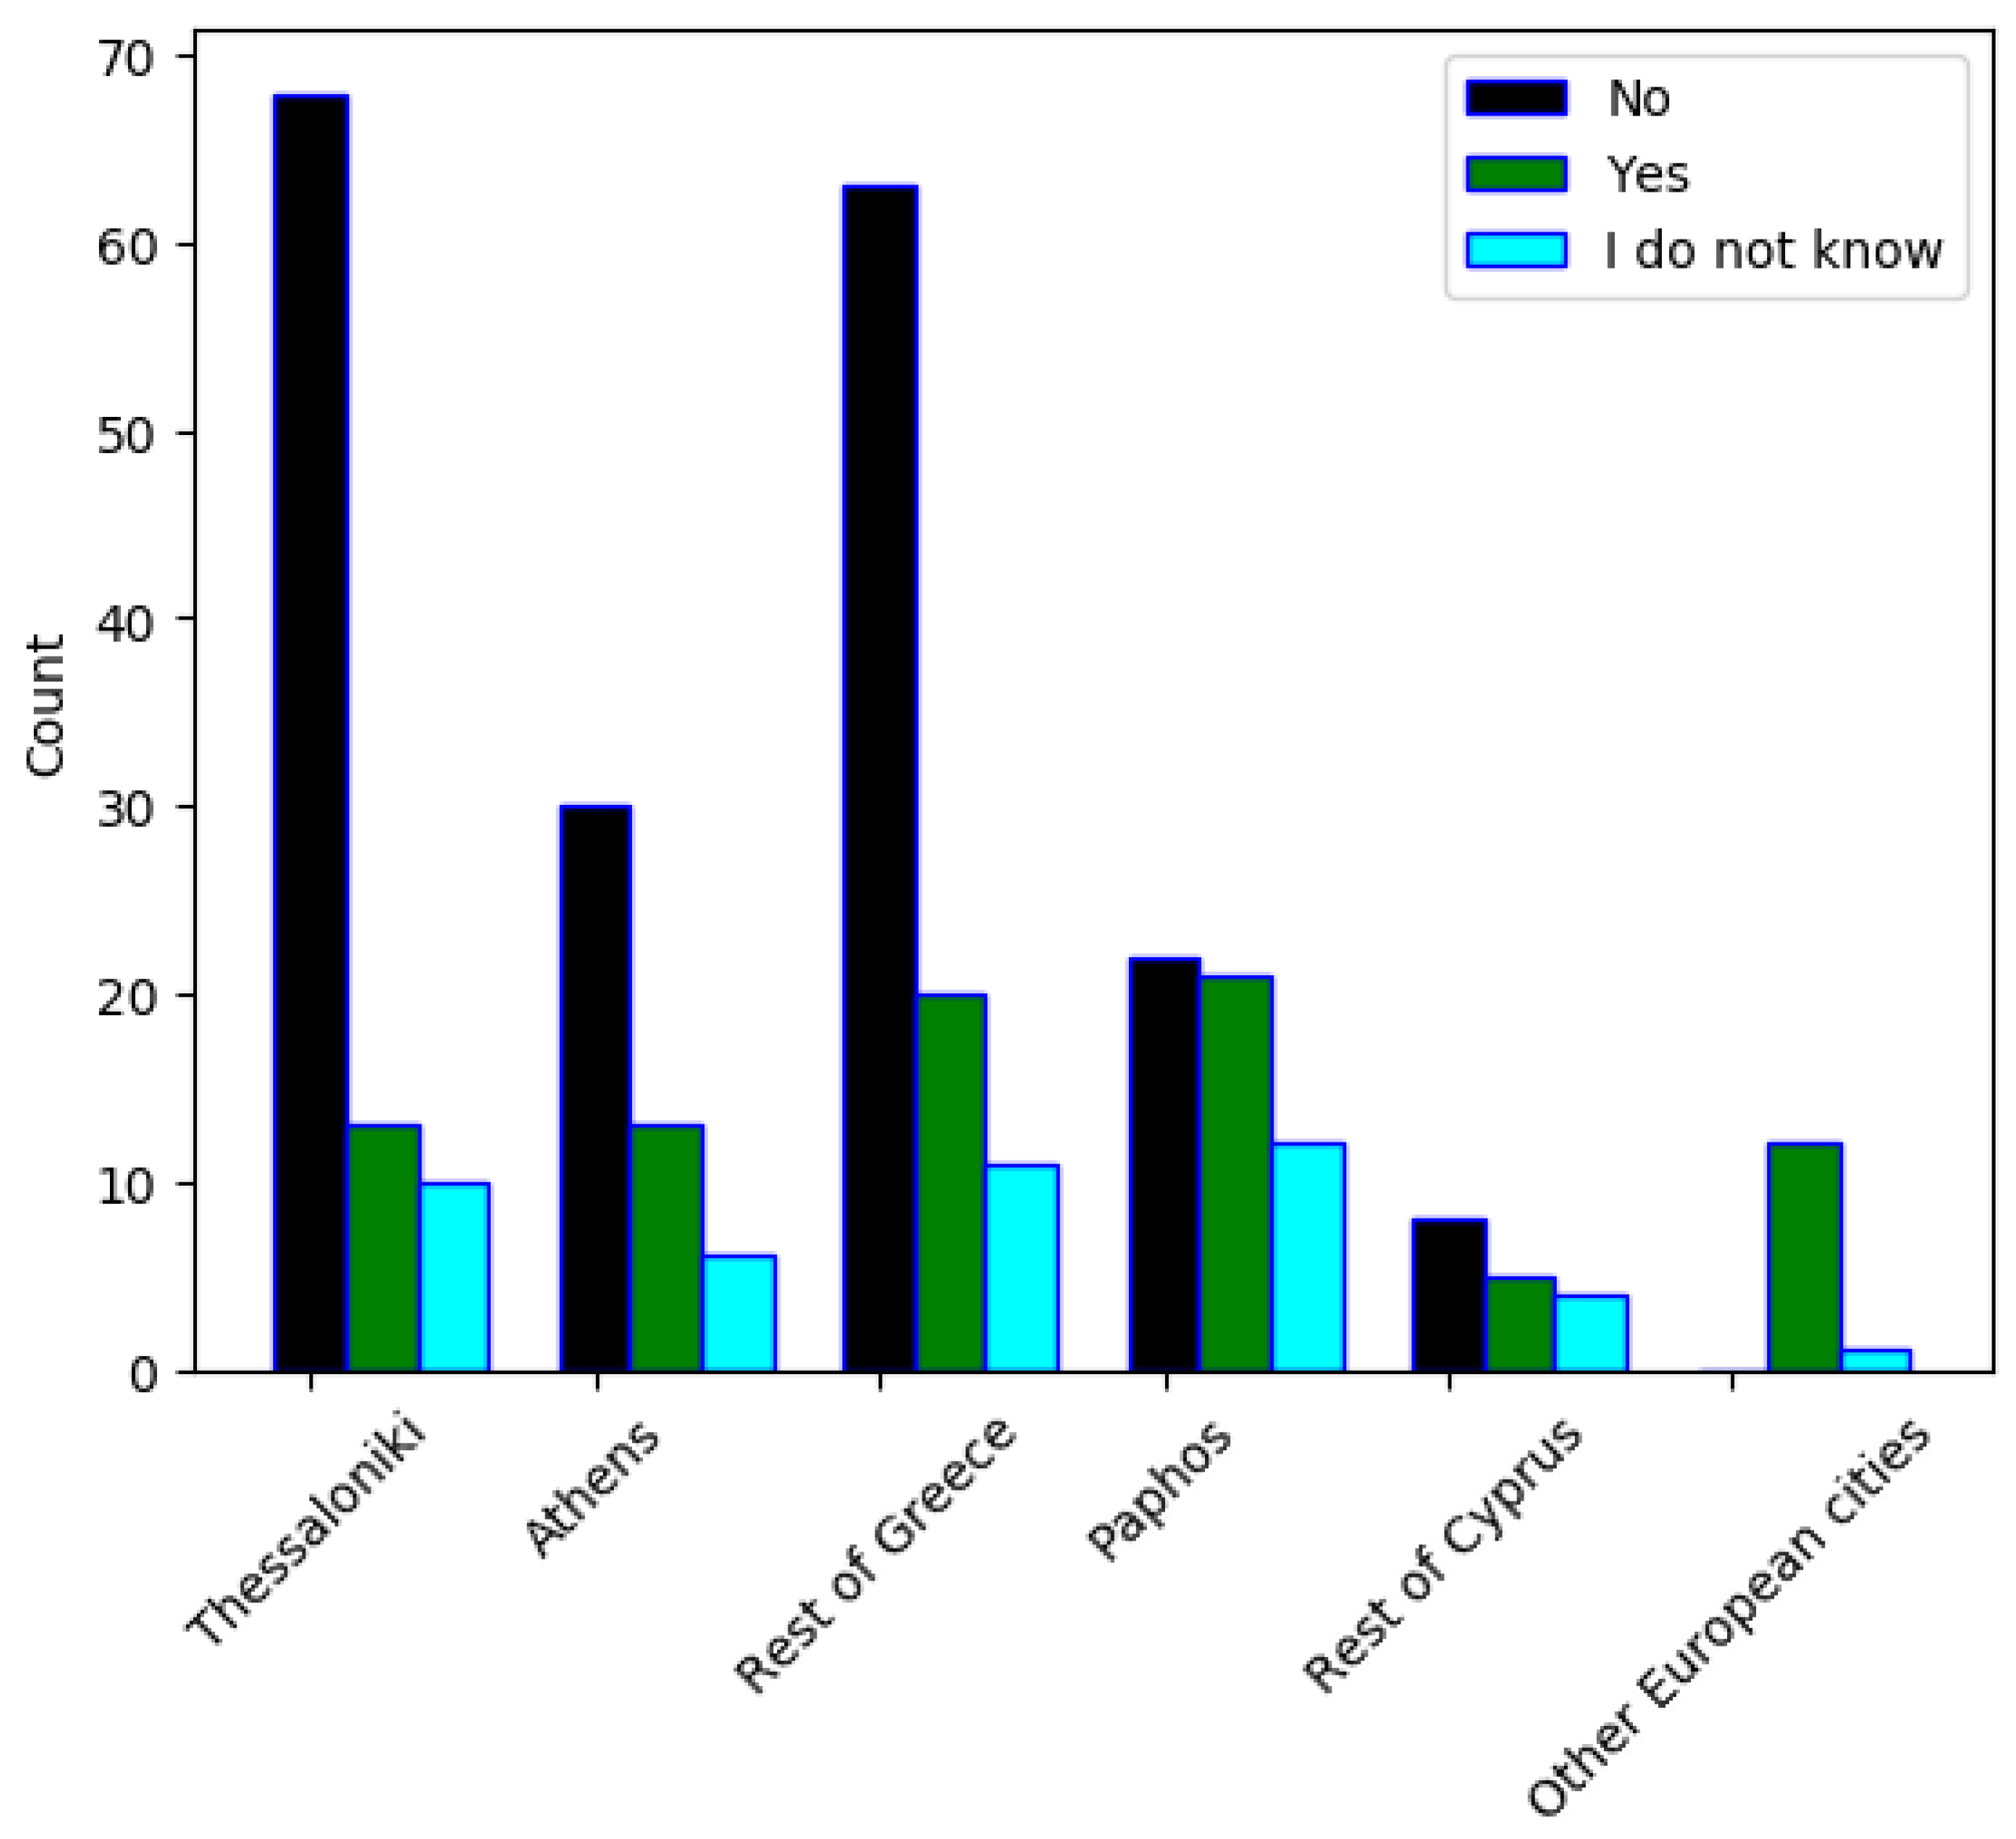
  • City: The p-value is 0.057 > 0.05 which means that the independence hypothesis cannot be rejected. In other words, the variables are not likely to be associated, thus the city is not a significant factor for a person that knows what “smart city” means.
The next hypothesis’ question is the following: Is the city factor related to the fact that a participant’s belief is that actions have been made to their city, so that it can be transformed into a smart city? In this case, we check the Fisher–Freeman–Halton value. However, when using the Exact Method, the results for Fisher–Freeman–Halton test cannot be obtained (“Cannot be computed because there is insufficient memory”). Therefore, the Chi-Square tests have been calculated again, by using the Monte Carlo method. This method is used when we cannot obtain the results using the Exact Method [40]. The Monte Carlo estimation of 0.000 for the Fisher–Freeman–Halton p-value is based on 10.000 random samples from the reference set, using a specific starting seed [40]. According to the Monte Carlo method, there is an estimation of 99% that the p-value is within the confidence interval (Lower Bound, Upper Bound). Fisher–Freeman–Halton p-value is 0.000 < 0.05 as the Significance column indicates. This means that the result is statistically significant, and that the independence hypothesis is rejected. In other words, there is a dependency between the variables which means that city is indeed related to the belief of a participant that actions have been made to their city, so that it can be transformed into a “smart” one.
It is clear based on Figure 6 that the “Yes” answers that were given by the citizens of Greece are relatively low in percentages (14.3% from Thessaloniki’s citizens, 26.5% from Athenians and 21.3% from citizens that live in other cities of Greece). However, the correspondent answer has been chosen from a bigger proportion of the citizens of Paphos (38.2% answered “Yes”) and from an even bigger proportion of citizens of other European countries (92.3%). This shows that citizens in Paphos generally appear to believe that efforts have been made in their city in order to become smart in a proportionally higher percentage than citizens living in Greece. A great percentage of citizens that live in other countries who have heard the term, seem that the local authorities of the city have made efforts for their city to develop into a smart one.
The final hypothesis’ question is the following: Is the city a determinant factor for a participant’s belief about the biggest challenge for the development of a smart city?
The respondents were offered to choose among five options about what is the biggest challenge for the development of a smart city. The results showed that 31.7% of the participants (101 out of 319) think that the cooperation between the public and private sectors is the biggest challenge. The Citizens’ participation, the transparency in the decisions of municipal authorities and the development of complete business movements, also gathered a significant percentage. The results are shown in Figure 7.
We run the Chi-square’s test and the p-value was 0.268 > 0.05. This means that the independence hypothesis cannot be rejected. In other words, the variables are not likely to be associated, thus the city is not a determinant factor for a participant’s belief about the biggest challenge for the development of a smart city.

4.3.2. Research Questions Analysis—Second Category

In this section, we present the responses from participants that declared themselves as non-familiar with the smart city term. An amount of 226 (41.5% of the total participants) were declared as non-familiar with the smart city term.
At the beginning, the participants were asked if they are willing to learn more things about the smart city concept in the future so that they can understand the term better. A vast amount of them (89.8%) answered “Yes”.
Then the participants were asked about whether the local authorities in their city have taken initiatives to inform them about the Smart City concept or not. The results have shown that over half of the respondents claimed that they don’t think that this kind of initiative has been taken in their city, by answering “No” (50.4%). The 43.4% of the participants showed unawareness on the subject while only 6.2% (which corresponds to only 14 out of 226 respondents) answered “Yes”.
Subsequently, the “non-familiar” participants were asked whether they would be willing to participate in the decision-making for the development of their city via a digital platform or not. The vast majority of them (71.2%) answered “Yes”, while 27.4% did not appear to be sure. Only 1.4% showed no interest in taking part in decisions for projects related to their city.
Afterwards, to investigate if the education level factor determines the way that the number of non-familiar participants is formed we run the Chi-square test and we noticed that 33.3% of the cells have expected count less than 5. In this case, we check the “Fisher-Freeman-Halton” p-value. Since it is lower than 0.05 (p-value < 0.001), the result is statistically significant, and the independence hypothesis is rejected. In other words, there is a dependency between the variables and this means that education is indeed related to the fact that a participant is or is not familiar with the term.
Based on Figure 8, it is clearly concluded that most of those who have a lower educational level (secondary education and below) tend to be non-familiar with the smart city term, whereas most of those who have a high educational level (“Higher education” and above) tend to be more familiar with it, by even just having heard of it.
The next hypothesis’ question is the following: Is age a determinant factor regarding the participants’ interest for further learning about “Smart Cities” in the future?
We notice that 40% of the cells have an expected count less than 5. In this case, we check the “Fisher-Freeman-Halton”-value. Since 0.562 > 0.05, the independence hypothesis cannot be rejected. In other words, the variables are not likely to be associated, thus age is not a determinant factor regarding the participants’ interest for further learning about “Smart Cities” in the future.
The final hypothesis’ question is: Is the city a determinant factor regarding the participants’ interest for further learning about “Smart Cities” in the future?
We notice that 33.3% of the cells have an expected count of less than 5. In this case, we check the “Fisher-Freeman-Halton” p-value. Since 0.779 > 0.05, the independence hypothesis cannot be rejected. In other words, the variables are not likely to be associated, thus the city is not a determinant factor regarding the participants’ interest for further learning about “Smart Cities” in the future. To sum up, the results have shown that most of the participants are interested in learning new things reagrds to the smart city concept in the future, regardless of their age and the city in which they live.

5. Discussion

Most of the respondents had a high educational level, meaning that most of them are University graduates. Although the Greek respondents appeared to live in places all over Europe, most of them who filled in the questionnaire live in Greece and Cyprus (90.7% in total, combined). Only a total of 22 Greek citizens were inhabitants of other European countries. Thus, for a major part of the review, we considered the number of Greek citizens that live in foreign countries insignificant. Generally, we focused on four city categories: Thessaloniki, Athens, the Rest of Greece, and Paphos.
Regarding the “Smart City” term, 319 out of 545 participants (58.5%) stated that they have already heard it. The 48.1% (262 out of the total 545) of the Greek participants stated that not only have they heard the “Smart City” term before, but they also have a decent (or broader) knowledge of what “Smart City” stands for. This is quite encouraging, especially for the citizens of Greece, where there is not a “pure” Smart City till today. The conclusions that accrued from the above results show that most of the people who have heard the term are men; thus, gender is a contributory factor for those who have heard the term. Overall, the Cypriot citizens in Paphos seem to know better what a “Smart City” is than the citizens of Thessaloniki, the Athenians, and those who live in other cities in Greece. When isolating the participants that live in Greece, the Athenians seem to have a broader knowledge of the term than citizens of Thessaloniki and those who live in other cities of Greece, proportionately. This happened because Athens is the capital of Greece and its citizens probably have better information from the local authorities about the Smart City concept. It is also worth mentioning that, according to the survey analysis and results, most of those who have a lower educational level (secondary education and below) tend to be non-familiar with the smart city term, whereas most of those who have a high educational level (“Higher education” and above) tend to be more familiar with it, by even just having heard of it.
Consequently, the survey’s results revealed that most of the participants consider “Efficient use of energy” and “Sustainable development” as the factors that correlate the most with the smart city concept.
Generally, a large number of participants indicated that they do not believe that any efforts have been made in their city in order to become smart. Of those who indeed believe that there has been some action, most of them stated that they had noticed actions in environment and mobility categories. Another conclusion that emerged from the analysis is that citizens in Paphos generally appear to believe that efforts have been made in their city in order to become smart in a proportionally higher percentage than citizens living in Greece. This can be explained by the initiatives taken by the municipality of Paphos recently to offer smart city applications to its citizens.
About the most important challenges for the development of a smart city, the survey revealed that the cooperation of the private and public sectors is the biggest of them, according to the participants. The city factor does not appear to be determinant for this result. For the participants that do not appear to be familiar with the smart city term, a number of conclusions also accrue. The fact that almost 90% of the non-familiar participants claimed that they are interested in acquiring further information about Smart Cities in the future is very promising. The age and city factors do not appear to be determinant for this result.
Another interesting conclusion is that none of the “non-familiar with the smart city term” citizens of both Thessaloniki and Athens thinks that initiatives have been taken for their information about the “smart city” concept. A very small number of the citizens that live in other cities in Greece, as well as in Paphos, believes the opposite. In general, negativity and ignorance prevail for all the city categories regarding the initiatives that the local authorities have taken for informing the citizens about smart cities.
The purpose of the smart city is not the technological upgrade of the services but the commitment to improving the living conditions of the citizens. It is a citizens-centric vision with implications that include quality of life, way of life, sustainable development, and citizens’ smooth coexistence. A “smart city” should consider the needs and problems of its residents, businesses, and the various organizations that operate in it. Technology is the means to achieve economic and social goals.
It is obvious that each of the six pillars contributes specially and substantially to the development of a universally smart city. Every city that envisions becoming smart must choose the pillars of development that will invest in having the citizens’ real needs as their main priority. Regardless of the pillars or applications chosen to be implemented, it is essential to have already implemented some preconditions that will enhance the efforts to transform a city into a “smart city”. These conditions include investment in technological infrastructure and the constant interaction with the citizens and the city’s businesses.
An essential role in the effort to develop “smart cities” plays the technological infrastructure. Smart cities without universal connectivity do not exist. Connectivity is based on three main actors: infrastructure providers, service providers, and local authorities that will define the operating framework. Institutions must work together to ensure the city’s telecommunications coverage. Device-human communication is the key to turning a conventional city into a smart one. Undoubtedly, the cities of the future are interconnected with Wi-Fi and 5G technologies. Soon, people’s confidence in these technologies becomes a given, and the benefits of digital urban transformation are more than visible. The proper infrastructure allows devices to interact efficiently. At the same time, a key element of smart cities’ infrastructure is the centers for the collection and storage of the data generated by the interconnected devices. Big data is now a gold that enhances the quality of services that the city can offer. Proper utilization of this data can provide elements of the utmost importance for the development of the city.
A city can only be improved when there is perfect harmony between a city’s local authorities and its citizens. Active citizen participation is a vital part of developing a smart city. City authorities must adopt new methods that inspire and encourage the active involvement of citizens. Citizen engagement is essential, and improving their engagement by providing incentives is a huge challenge for local authorities. There are many reasons why citizens may be reluctant to participate in a city’s public actions. Reluctance is often associated with dissatisfaction with people representing local authorities or a lack of confidence in their commitments. With a vision of the smart city, local authorities should implement new innovative ideas to enhance citizen involvement and overcome barriers that limit their active participation in the community. Local authorities and city citizens should work closely together to solve local problems. Furthermore, direct communication between citizens and officials seems to be of utmost importance.
Our research shows that the citizens of the two countries, although they do not have daily experience with the activities and applications of a smart city, showed a great interest in how a smart city could improve their quality of life. Based on this, we intend in our next research to examine, in more detail, how citizen engagement can be increased and also study various areas in which citizens have shown great interest, such as smart living.

6. Conclusions

The purpose of this paper was mainly to examine the perception that the Greek and Cypriot citizens have, regarding the Smart City concept, as well as to reveal their beliefs about the current level of “smartness” that appears in the city they live in. Since Greek cities have not delved into the smart city concept and applications at an advanced and holistic level, we decided to examine the standpoints of Greek and Cypriot citizens in regards to the implementation of smart city elements into Greek and Cypriot cities through quantitative research. Since the questionnaire that was used for this research as a tool for collecting data was provided in an e-version, we are aware of the limitation that accrues: only citizens with internet access were able to participate. Another limitation comes from the fact that the choice of the participants was totally random; since we addressed to an audience that has generally a small experience regarding the Smart City concept and we did not focus on experts to fill in the questionnaire. We proceeded by this way in order to get the opinion and perception of random Greek and Cypriot adult citizens about the subject. It is worth mentioning here that 87.5% of the participants who opted for filling the questionnaire were from 18 to 40 years old. This result reveals that younger people are probably more interested in indulging in the Smart City concept. The smart city concept is becoming a mega-trend and appears to emerge globally. The development of smart cities seems to have become mandatory, as it allows cities all over the world to cope with the challenges that are derived from increasing urbanization and population growth. The smart city concept already holds the potential to address aspects of the sustainability challenge by promoting citizen participation, developing innovative and smart solutions for sustainability, and adopting a transparent governance system.

Author Contributions

Conceptualization, A.G. and Z.Z.; methodology, A.G.; validation, A.G. and Z.Z.; formal analysis, A.G.; investigation, A.G.; writing—original draft preparation, A.G.; writing—review and editing, Z.Z. and P.C.; visualization, Z.Z.; supervision, Z.Z. and A.G. All authors have read and agreed to the published version of the manuscript.

Funding

This research received no external funding.

Institutional Review Board Statement

The study was conducted according to the guidelines of the Declaration of Helsinki, and approved by the Institutional Review Board of Neapolis University Pafos (12/11/2020).

Informed Consent Statement

Informed consent was obtained from all subjects involved in the study.

Data Availability Statement

The data presented in this study are available on request from the corresponding author.

Conflicts of Interest

The authors declare no conflict of interest.

References

  1. Venkatachalam, S. Re-Thinking the Role of Citizens in Evaluating Quality of Life in the Smart City. Master’s Thesis, Delft University of Technology, Delft, The Netherland, 2020. [Google Scholar]
  2. Albino, V.; Berardi, U.; Dangelico, R.M. Smart cities: Definitions, dimensions, performance, and initiatives. J. Urban Technol. 2015, 22, 3–21. [Google Scholar] [CrossRef]
  3. Zinonos, Z.; Christodoulou, P.; Andreou, A.; Chatzichristofis, S. Parkchain: An iot parking service based on blockchain. In Proceedings of the 2019 15th International Conference on Distributed Computing in Sensor Systems (DCOSS), Santorini, Greece, 31 May 2019; pp. 687–693. [Google Scholar]
  4. Christodoulou, P.; Christodoulou, K.; Andreou, A. A decentralized application for logistics: Using blockchain in real-world applications. Cyprus Rev. 2018, 30, 181–193. [Google Scholar]
  5. Christodoulou, K.; Christodoulou, P.; Zinonos, Z.; Carayannis, E.G.; Chatzichristofis, S.A. Health information exchange with blockchain amid COVID-19-like pandemics. In Proceedings of the IEEE 2020 16th International Conference on Distributed Computing in Sensor Systems (DCOSS), Marina del Rey, CA, USA, 25–27 May 2020; pp. 412–417. [Google Scholar]
  6. Anastasiou, A.; Christodoulou, P.; Christodoulou, K.; Vassiliou, V.; Zinonos, Z. Iot device firmware update over lora: The blockchain solution. In Proceedings of the IEEE 2020 16th International Conference on Distributed Computing in Sensor Systems (DCOSS), Marina del Rey, CA, USA, 25–27 May 2020; pp. 404–411. [Google Scholar]
  7. Berntzen, L.; Johannessen, M.R. The role of citizens in “smart cities”. In Proceedings of the Management International Conference, Pula, Croatia, 1–4 June 2016. [Google Scholar]
  8. Capdevila, I.; Zarlenga, M.I. Smart city or smart citizens? The Barcelona case. J. Strategy Manag. 2015, 8, 266–282. [Google Scholar] [CrossRef]
  9. Tadili, J.; Fasly, H. Citizen participation in smart cities: A survey. In Proceedings of the 4th International Conference on Smart City Applications, Casablanca, Morocco, 2–4 October 2019; pp. 1–6. [Google Scholar]
  10. Yeh, H. The effects of successful ICT-based smart city services: From citizens’ perspectives. Gov. Inf. Q. 2017, 34, 556–565. [Google Scholar] [CrossRef]
  11. Belanche, D.; Casaló, L.V.; Orús, C. City attachment and use of urban services: Benefits for smart cities. Cities 2016, 50, 75–81. [Google Scholar] [CrossRef]
  12. Zenker, S.; Rütter, N. Is satisfaction the key? The role of citizen satisfaction, place attachment and place brand attitude on positive citizenship behavior. Cities 2014, 38, 11–17. [Google Scholar] [CrossRef]
  13. Mattingly, K.; Morrissey, J. Housing and transport expenditure: Socio-spatial indicators of affordability in Auckland. Cities 2014, 38, 69–83. [Google Scholar] [CrossRef]
  14. Tiwari, R.; Cervero, R.; Schipper, L. Driving CO2 reduction by integrating transport and urban design strategies. Cities 2011, 28, 394–405. [Google Scholar] [CrossRef]
  15. Castelnovo, W. Co-production makes cities smarter: Citizens’ participation in smart city initiatives. In Co-Production in the Public Sector; Springer: Cham, Switzerland, 2016; pp. 97–117. [Google Scholar]
  16. Bovaird, T.; Loeffler, E. From engagement to co-production: The contribution of users and communities to outcomes and public value. Volunt. Int. J. Volunt. Nonprofit Organ. 2012, 23, 1119–1138. [Google Scholar] [CrossRef]
  17. Gupta, K.; Hall, R.P. The Indian perspective of smart cities. In Proceedings of the IEEE 2017 Smart City Symposium Prague (SCSP), Prague, Czech Republic, 25–26 May 2017; pp. 1–6. [Google Scholar]
  18. Berntzen, L.; Karamagioli, E. Regulatory measures to support eDemocracy. In Proceedings of the IEEE 2010 Fourth International Conference on Digital Society, Saint Maarten, Netherlands Antilles, 10–16 February 2010; pp. 311–316. [Google Scholar]
  19. Hollands, R.G. Will the real smart city please stand up? Intelligent, progressive or entrepreneurial? City 2008, 12, 303–320. [Google Scholar] [CrossRef]
  20. Carrillo, F.J.; Yigitcanlar, T.; García, B.; Lönnqvist, A. Knowledge and the City: Concepts, Applications and Trends of Knowledge-Based Urban Development; Routledge: Oxfordshire, UK, 2014. [Google Scholar]
  21. Hardoy, J.E.; Mitlin, D.; Satterthwaite, D. Environmental Problems in an Urbanizing World: Finding Solutions in Cities in Africa, Asia and Latin America; Routledge: Oxfordshire, UK, 2013. [Google Scholar]
  22. Vanolo, A. Smartmentality: The smart city as disciplinary strategy. Urban Stud. 2014, 51, 883–898. [Google Scholar] [CrossRef]
  23. Angelidou, M.; Psaltoglou, A.; Komninos, N.; Kakderi, C.; Tsarchopoulos, P.; Panori, A. Enhancing sustainable urban development through smart city applications. J. Sci. Technol. Policy Manag. 2018, 9, 146–169. [Google Scholar] [CrossRef]
  24. Molnar, D.; Morgan, A. Defining Sustainability, Sustainable Development and Sustainable Communities: A Working Paper for the Sustainable Toronto Project. Sustainability 2001, 829. [Google Scholar]
  25. Brundtland, G.H. What is sustainable development. In Our Common Future; Oxford University Press: Oxford, UK, 1987; pp. 8–15. [Google Scholar]
  26. Atkinson, A. Cities after oil—1: ‘Sustainable development’and energy futures. City 2007, 11, 201–213. [Google Scholar] [CrossRef] [Green Version]
  27. Desa, U. Transforming Our World: The 2030 Agenda for Sustainable Development; United Nations: Geneva, Switzerland, 2016. [Google Scholar]
  28. Bibri, S.E.; Krogstie, J. Smart sustainable cities of the future: An extensive interdisciplinary literature review. Sustain. Cities Soc. 2017, 31, 183–212. [Google Scholar] [CrossRef]
  29. Castells, M. Urban sustainability in the information age. City 2000, 4, 118–122. [Google Scholar] [CrossRef]
  30. Giffinger, R.; Fertner, C.; Kramar, H.; Meijers, E. City-Ranking of European Medium-Sized Cities; Vienna University of Technology: Vienna, Austria, 2007; pp. 1–12. [Google Scholar]
  31. Giffinger, R.; Gudrun, H. Smart cities ranking: An effective instrument for the positioning of the cities? ACE Arch. City Environ. 2010, 4, 7–26. [Google Scholar]
  32. Shapiro, J.M. Smart cities: Quality of life, productivity, and the growth effects of human capital. Rev. Econ. Stat. 2006, 88, 324–335. [Google Scholar] [CrossRef]
  33. Colldahl, C.; Frey, S.; Kelemen, J.E. Smart Cities: Strategic Sustainable Development for an Urban World. Master’s Thesis, School of Engineering Blekinge Institute of Technology, Karlskrona, Sweden, 2013. [Google Scholar]
  34. Zubizarreta, I.; Seravalli, A.; Arrizabalaga, S. Smart city concept: What it is and what it should be. J. Urban Plan. Dev. 2016, 142, 04015005. [Google Scholar] [CrossRef]
  35. Ursachi, G.; Horodnic, I.A.; Zait, A. How reliable are measurement scales? External factors with indirect influence on reliability estimators. Procedia Econ. Financ. 2015, 20, 679–686. [Google Scholar] [CrossRef] [Green Version]
  36. How-to Guide for IBM® SPSS® Statistics Software. Available online: https://methods.sagepub.com/dataset/howtoguide/kmo-nilt-2012 (accessed on 21 November 2020).
  37. Bartlett’s Test: Definition and Examples. Available online: https://www.statisticshowto.com/bartletts-test/ (accessed on 8 November 2020).
  38. Kaiser-Meyer-Olkin (KMO) Test for Sampling Adequacy. Available online: https://www.statisticshowto.com/kaiser-meyer-olkin/ (accessed on 15 November 2020).
  39. How to Use SPSS-Fisher’s Exact Test. Available online: https://www.youtube.com/watch?v=LynasIsG0xI&feature=youtu.be (accessed on 13 November 2020).
  40. Mehta, C.R.; Patel, N.R. IBM SPSS Exact Tests; IBM Corporation: Armonk, NY, USA, 2011. [Google Scholar]
Figure 1. Smart city pillars and applications.
Applsci 11 02517 g001
Figure 2. Importance of sectors.
Applsci 11 02517 g002
Figure 3. Efforts to transform your city to a smart city.
Applsci 11 02517 g003
Figure 4. Areas for improvements in your city.
Applsci 11 02517 g004
Figure 5. Gender.
Figure 5. Gender.
Applsci 11 02517 g005
Figure 6. Participant’s belief for actions transforming their city into a smart city.
Applsci 11 02517 g006
Figure 7. Challenges based on participant’s belief.
Applsci 11 02517 g007
Figure 8. Education level for non-familiar citizens
Applsci 11 02517 g008
Table 1. Characteristics of participants.
ClassificationOptionsValues
Male278 (51%)
GenderFemale267 (49%)
Sum545
18–30203 (37.2%)
31–40274 (50.03%)
Age41–5051 (9.4%)
51–6013 (2.4%)
Over 604 (0.7%)
Primary Education6 (1.1%)
Secondary Education43 (7.9%)
EducationHigher Education311 (57.1%)
Master’s Degree154 (28.3%)
Doctoral Diploma23 (4.2%)
Other8 (1.5%)
Civil Employee82 (15%)
Private Employee260 (47.7%)
Self-Employed/Freelancer107 (19.6%)
OccupationCollege Student46 (8.4%)
Retired4 (0.6%)
Unemployed37 (6.8%)
Other9 (1.8%)
Thessaloniki181 (33.2%)
Athens73 (13.4%)
Paphos79 (14.5%)
CityRest of Greece160 (29.5%)
Rest of Cyprus29 (5.3%)
Other European Countries22 (4%)
Table 2. Importance of smart city pillars.
SmartSmartSmartSmartSmartSmart
GovernanceEnviromentLivingMobilityPeopleEconomy
Not Important0.3%0.0%0.0%0.0%0.3%0.0%
Less Important4.1%0.3%0.3%0.9%2.2%0.9%
Moderately19.4%1.6%2.5%4.1%8.2%8.2%
Important
Quite Important41.7%26.3%19.4%25.4%34.8%37.3%
Very Important34.5%71.8%77.7%69.6%54.5%53.6%
Publisher’s Note: MDPI stays neutral with regard to jurisdictional claims in published maps and institutional affiliations.

