1. Introduction
The evolution of communication systems in recent decades has tremendously impacted the way people communicate, allowing almost instantaneous interactions. We live in an interconnected world sustained by technology, assisting most of our daily activities and being an essential economic growth aspect. The development of new technologies in recent years has allowed the creation of a wide variety of web platforms, enabling the definition of new features and functionalities in web ecosystems. These advances are especially relevant in the era of big data and artificial intelligence, serving as a bridge between users and cloud computing environments. Based on the versatility of these technologies, web ecosystems have been developed for an enormous range of scenarios, where eHealth environments are very promising for their positive impact on patients’ health. In this context, the concept of telemedicine has been defined as a way of treating patients’ conditions remotely, reducing the visits to the doctor. Within this approach, web services are one of the most implemented technologies, where the focus of the present publication lies on the cardiovascular scenario.
Cardiovascular diseases are the leading cause of death and medical resource expenditure globally, being high blood pressure (HBP, also known as hypertension), a significant risk factor for cardiovascular diseases. Although resources have been invested in reducing the impact of this condition, hypertension remains a direct cause of mortality, loss of quality of life, and consumption of healthcare resources. A study of the hypertension situation between 1980 and 2015 [
1] showed that the number of individuals with high blood pressure increased from 442 to 874 million people in this period. From the age of 69 onward, this percentage augmented to 60%. It is expected that the incidence of this disease will increase by 2025, with an estimation of around 1.5 billion people affected worldwide. Additionally, deaths associated with HBP have increased by 1.6% per year during this period, from 7.2 to 10.7 million people. In 2015, 14% of all deaths were associated with hypertension, related firstly to ischemic heart disease and, secondly, to cerebrovascular accident. This has placed blood pressure as a risk factor in an increasing number of diseases and events such as dementia or the risk of cognitive impairment, applying to all age and ethnic groups. Leal et al. [
2] reported that individuals with hypertension are much less productive, highlighting the enormous benefits that a better identification, treatment, and control of the disease could have.
Most cases of hypertension appear to be caused by reversible environmental factors, being the most critical weight gain leading to obesity, insufficient physical activity, inadequate sodium and potassium intake, and alcohol abuse [
3]. Based on that, the main strategy to control HBP is implementing lifestyle changes before or during drug treatment, as long-term control of the disease has been achieved in these cases [
3,
4,
5]. Additionally, blood pressure measurements at home are essential to control the status of the disease actively. Nevertheless, only a small percentage of patients follow these recommendations since implementing effective strategies leading to sustained lifestyle changes is difficult [
6]. The goal to stabilize this condition is to bring most patients to a scenario where all these lifestyle deficiencies are addressed.
Considering the inefficiency of traditional methods to control HBP, the literature has defined and implemented web-based systems aiming to support clinical monitoring of hypertension patients [
7]. These platforms also introduce relevant functionality for the treatment, such as medication reminders or online consultations with the doctor. Moreover, the literature has proposed using smartphone applications to ease the acquisition of blood pressure measurements [
8]. These applications have the advantage of directly acquiring the measurements by pairing the blood pressure device, in contrast to traditional web pages where the data is introduced manually. Nevertheless, web ecosystems are complementary to these applications since web services are also needed in these approaches. Additionally, there are solutions using machine learning (ML) and deep learning (DL) techniques to predict hypertension, increasing the complexity in the development of the system. Including these approaches in the development of web platforms would be greatly beneficial to assist hypertensive patients.
In this context, the development of intelligent web ecosystems able to predict hypertension presents several challenges. First, there is a lack of web platforms able to acquire patients’ data in real-time, using monitoring devices able to send automatically blood pressure measurements. Furthermore, there is a lack of technological solutions considering the impact that environmental dimensions have over hypertension. Finally, there is an absence of web platforms integrating ML and DL approaches to offer real-time blood pressure predictions.
To improve the previous challenges, this manuscript presents SENIOR, a web ecosystem to predict hypertensive crises in a early phase. The main contributions of this work are the following:
The design of SENIOR, consisting of three main elements: a wearable providing heart blood pressure measures, a smartphone application used to acquire data, and a web platform to process the data and perform predictions. This ecosystem provides predictions in real-time and it is able to identify blood pressure values within the next 8, 16, and 24 h, notifying the user about potentially dangerous values.
The identification of new environmental features to predict hypertensive crises: weather and pollution. Furthermore, the mobile application implements several surveys that patients have to complete periodically, providing information about the location, weight, physical activity, diet, medication, social support, stress, depression, and alcohol and tobacco consumption.
The implementation of a proof of concept with seven volunteers and different ML algorithms such as Bayesian Ridge, Support Vector Regression, and Random Forest. The obtained results demonstrated the feasibility of SENIOR as a real-time ecosystem, showing similar results to the offline solutions existing in the literature.
The remainder of the paper is structured as follows.
Section 2 introduces the related work existing in the literature. After that,
Section 3 presents the methodology followed and the architecture of the solution.
Section 4 presents the results obtained in a proof of concept with different volunteers and machine learning algorithms. Finally,
Section 5 highlights conclusions and future work.
2. Related Work
This section first performs a review of the state of the art concerning the application of web platforms to treat hypertension based on a telemedicine approach. After that, it presents relevant works that use machine learning and deep learning techniques to either analyze the importance of domain-specific features or predict of blood pressure measurements.
2.1. Web Ecosystems for the Treatment of Hypertension
Telemedicine research applied to hypertension started focusing on the use of web platforms. Thiboutot et al. [
9] implemented a web-based hypertension platform where patients can introduce self-reported health variables, and doctors can provide feedback about the treatment. This platform presented reminders of medical appointments to the patients, who could also ask predefined questions that the platform solved. This work represented an incipient approach to include web ecosystems for the control of HBP. However, the measurements were not required to be provided frequently since the platform notified the user only when data was not introduced during a consecutive period of one month. Research in this direction has allowed the development of web platforms with more functionality. Zhou et al. [
7] implemented a cloud-based system for managing hypertension, offering a web platform capable of managing blood pressure data uploaded by patients, offering diagnoses services, and instant messenger service with the doctors.
Omboni et al. [
10] reviewed the state of the art concerning the application of web ecosystems over hypertension. The authors highlighted that these platforms allow the registration of patients’ clinical data and blood pressure measurements and their communication with doctors. These systems usually introduce educational support, medication reminders, and online consultations with doctors. This work highlighted that web ecosystems used as a support technology for hypertension could improve patients’ adherence to the treatment, generating a reduction of blood pressure values, thus improving patients’ quality of life. These advantages may also reduce healthcare costs, especially in chronic treatments.
Although these web platforms are interesting to bring patients closer to doctors, most of their features are reduced to the transmission of relevant information and communication with the doctors. Additionally, one of the main disadvantages of these platforms is on usability, where users need to access the website to register the measurements. To improve this situation, in recent years, these ecosystems have included the use of smartphone applications. Smartphones are continually increasing their computational capabilities, and they can also be linked to blood pressure monitors to register the measurements automatically [
8]. Although the usage of these applications has proven to help reduce blood pressure values [
11], there is nowadays a lack of clinical trials in this field. Moreover, the diversity of monitoring devices complicates the development of applications, also introducing issues regarding the accuracy of the measurement and a lack of standardization of technologies used in nowadays wearables.
2.2. Application of Learning Techniques for HBP
To improve the management of hypertensive patients, the literature has focused in recent years on the application of learning techniques. One relevant scenario has been the identification of features that can negatively impact this disease. In this sense, Lacson et al. [
12] studied the Systolic Blood Pressure Intervention Trial (SPRINT) dataset containing electronic health records, including a wide variety of characteristics in categories such as demographics, medication, or laboratory parameters.
Other works in the literature have focused on the prediction of the disease in the future. Ye et al. [
13] used the XGBoost algorithm over data from electronic health records to predict the risk of developing hypertension in the next year. These data contained features from categories such as medication history or socioeconomic features. They highlighted the enormous impact that the presence of other chronic conditions has over the appearance of HBP. In addition, in this line, Nimmala et al. [
14] determined if a person was prone to develop HBP in the future, considering the following features: age, anger, anxiety, obesity, and cholesterol level. For that, they used multiple machine learning (ML) algorithms, where Random Forest obtained the best results. Moreover, LaFreniere et al. [
15] applied neural networks over a medical dataset to predict the risk of developing HBP, using features such as age, blood pressure values, laboratory analysis, and smoking and exercise habits. Finally, López-Martínez et al. [
16] applied logistic regression considering as features the gender, race, BMI, age, smoking habits, and previous diseases such as kidney disease and diabetes.
Other works have also studied how to predict blood pressure values. Li et al. [
17] implemented a smartphone application able to pair with a wireless blood pressure monitor, using multiple ML algorithms to predict the value of the blood pressure. They highlighted that the literature only focused on medical data to perform the predictions, not using contextual features. Because of that, they included features such as the altitude or geographical coordinates. This work documented a Root Mean Squared Error (RMSE) between 4 and 5.5 points for the diastolic pressure and between 7 and 9 for the diastolic pressure. The differences between the algorithms tested were not significant.
Chiang et al. [
18] defined the first work using a wearable to acquire domain-relevant data, combined with a Bluetooth pressure monitor. This work performed predictions of blood pressure one day ahead using features extracted from the exercise and sleep data captured by the wearable. This work used multiple ML algorithms to calculate the predictions, Random Forest being the method offering better results. The Mean Absolute Error (MAE) ranged between 5 and 9 points among the different algorithms tested.
Finally,
Table 1 presents a summary of the features used by each publication studied in this section. It also indicates that the present work partially studies health records. Although we do not have access to users’ health records, we do acquire data concerning their current physical and mental status using surveys.
3. Materials and Methods
This section first presents the methodology followed to implement and validate the proposed web ecosystem. After that, we present the design and implementation of SENIOR, highlighting its different modules.
3.1. Followed Methodology
The first aspect to consider in this work was the selection of the most suitable device used for acquiring blood pressure measurements. For that, the main requirement was to use a wearable device allowing a wireless interconnection with the smartphone without manually introducing the values. After analyzing the alternatives, we decided to use the Omron HeartGuide [
19] due to its accuracy. Once having the device, we implemented a smartphone application to acquire the data from the wearable and self-assessed by the via surveys.
We then implemented a web platform to communicate with the smartphone application in a bidirectional way. It allowed the transmission of the required data from the application to the web platform and its storage in a database. Additionally, it included the functionality to send notifications to the application. This platform was also capable of acquiring environmental data from the location transmitted by the application and, particularly, about the weather and pollution status at that instant in the users’ location.
After finishing the implementation of SENIOR, we created a proof of concept and tested it with seven users. The data acquisition was performed during a month, having three measurements per day: before breakfast, after lunch, and before going to bed. The application automatically and frequently gathered the geographical coordinates, and the surveys were completed according to the particular periodicity of each type of survey. Surveys that do not require a frequent update, such as the specification of chronic medicine consumption or corporal weight, were only completed at the beginning of the experiment and after changing the values. On the contrary, periodical surveys were completed every week, where each survey had assigned a particular day of the week to be user friendly. The user also completed those surveys representing particular events at the moment of the consumption, such as alcohol, tobacco, or nonchronic medicines. Additionally, notifications were presented to the users indicating the moment to complete a recurrent survey. If the user delayed it, the application periodically showed a reminder aiming to gather all needed data. More information concerning these surveys is presented in
Section 3.2.
When the acquisition period was completed, we studied the collected data and generated a dataset for each user to implement a personalized machine learning (ML) model. Additionally, we decided to generate a dataset including all users’ data and compare its results with the individual approach results. After organizing the data, we started exploring the creation of ML models to predict blood pressure values, testing multiple algorithms. Once we tested the suitability of these models, we extended the capabilities of SENIOR, including functionality to send personalized notifications to the users with predicted measures within hypertensive ranges. Remarkably, the predictive mechanisms implemented offer both real-time and future predictions. In terms of real-time calculations, the SENIOR framework determines the estimated blood pressure associated with the features gathered by the platform in that instant. Moreover, the framework offers blood pressure predictions within 8, 16, and 24 h temporal windows.
3.2. Web Ecosystem Design and Proof of Concept Implementation
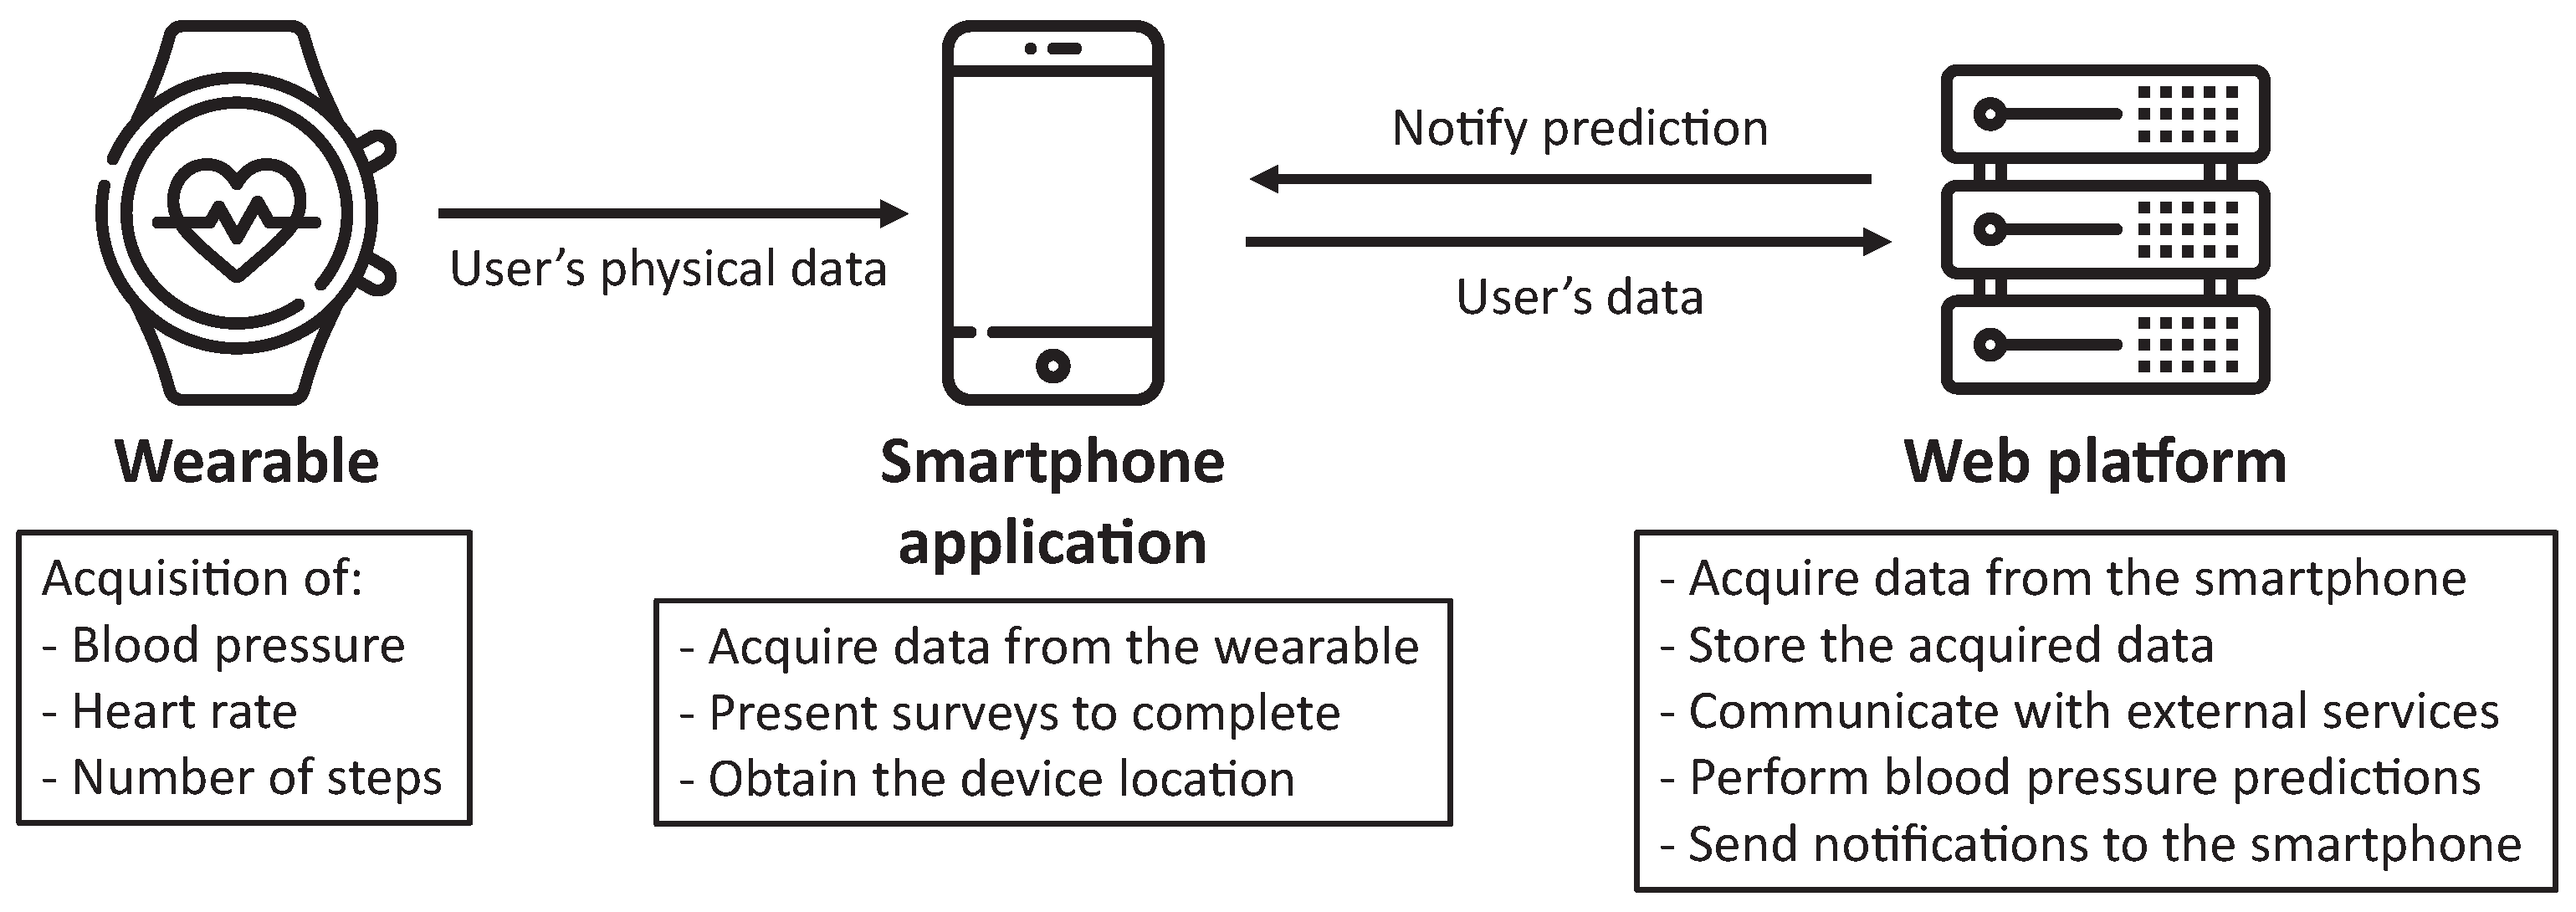
This work presents a web ecosystem, called SENIOR, whose architecture is composed of three main elements, as represented in
Figure 1. The particularities of each entity are subsequently described:
Wearable: device able to measure physical characteristics of patients. The device has the requirement of being capable of connecting with the smartphone application to communicate the data. Furthermore, this device must be worn by the user at any moment (except for charging).
Smartphone application: the user installs and utilizes the application developed in this project. This software gathers the data acquired by the wearable, personal data provided by the user and information based on completing surveys analyzing different health variables. Moreover, it obtains the geographical coordinates of the smartphone. All these data are sent to the web platform using encryption to preserve the confidentiality of the data.
Web platform: this element is the main entity of the architecture. On the one hand, it receives the data compiled by the smartphone application, storing them in a database system. On the other hand, it uses these data to generate a prediction of future blood pressure values, transmitting these results to the application. Additionally, this platform offers a categorization of the pressure value, notifying the user if the predicted value would be within normal ranges or represent an hypertensive crisis. Finally, this element queries weather and pollution external services to provide contextual data to users’ measurements.
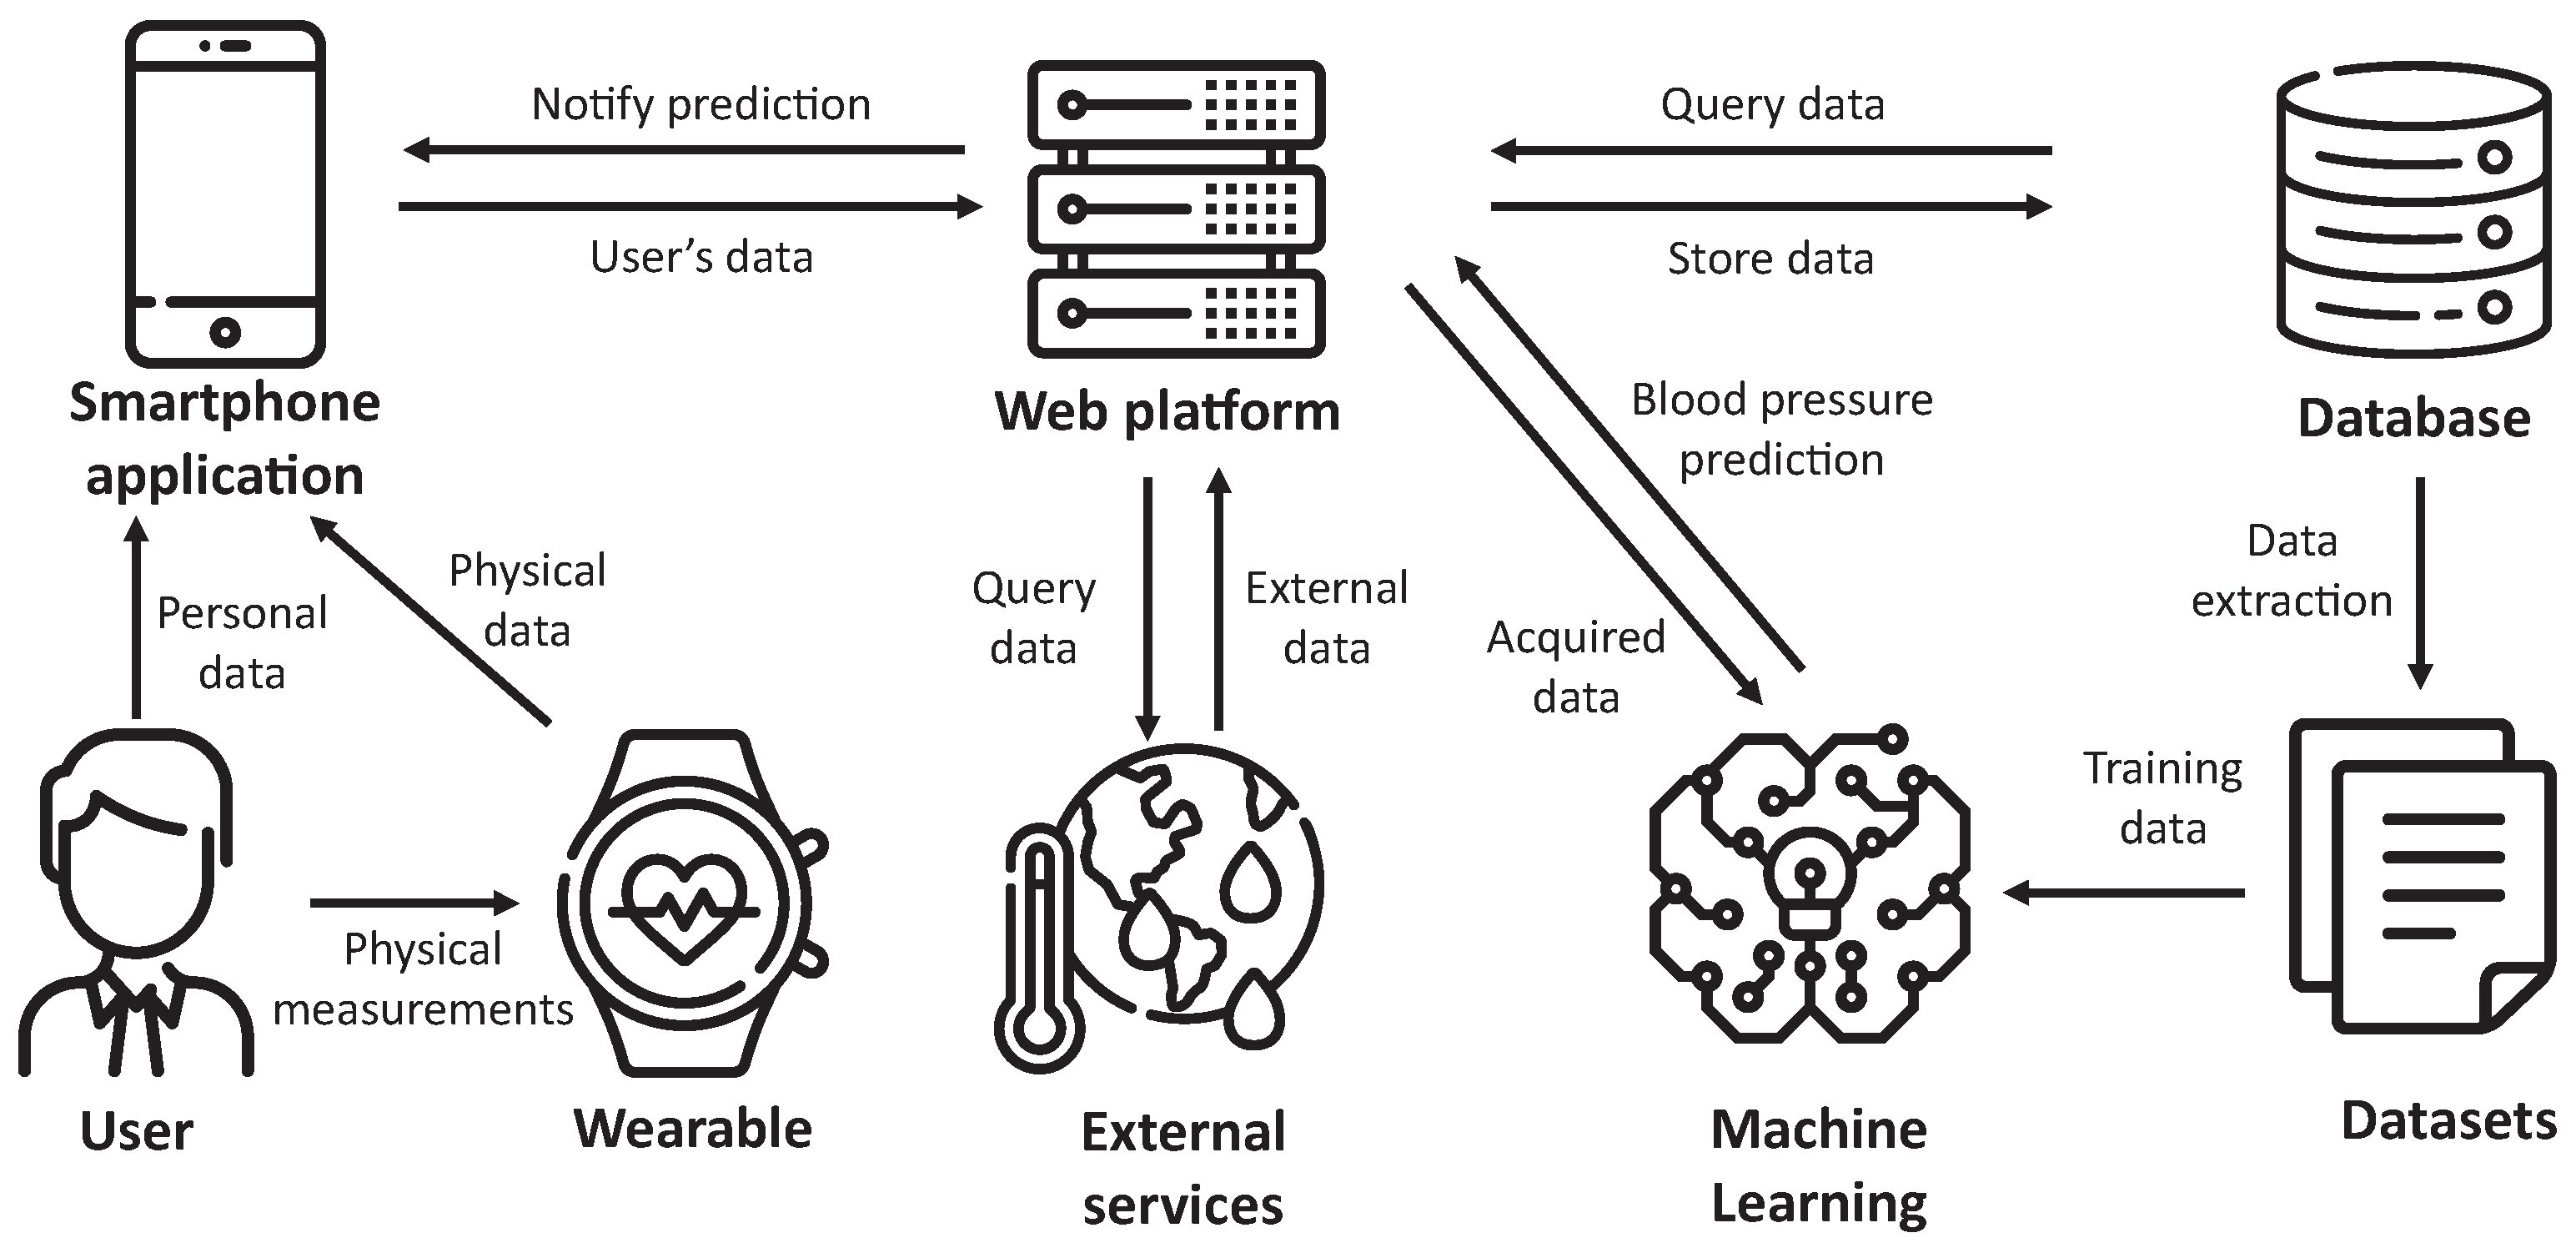
This main architecture is extended in
Figure 2, presenting the whole architecture of SENIOR. We can first observe that the user provides data to the application, both directly and from the wearable. These data, in addition to environmental data obtained from external services, are stored by the web platform into the database system. After that, datasets are generated, used to train machine learning algorithms to produce models. Once the models are available, the user can request blood pressure prediction based on current data provided by the application.
3.2.1. Wearable
The Omron Heart Guide [
19] is a wearable able to measure blood pressure using a small component placed under the wristband. This wearable can also acquire data about the heart rate, the number of steps, and the quality of sleep. The cuff of this device is similar to those used in traditional blood pressure monitors. Because of that, this device has been certified by the FDA as a way to measure blood pressure in a portable and precise way. Nevertheless, the user must be relaxed and stay in a particular position for the measurement, initiating it using a button available in the wearable. This functioning, together with the limitation of eight measurements per day imposed by its SDK, prevented us from acquiring blood pressure measurements from the user continuously.
3.2.2. Smartphone Application
The second main element of SENIOR is the Android application installed in the smartphone. This application is compatible with Android smartphones with version 6 or higher. Additionally, it asks the user for permissions about execution in the background, network access, Bluetooth connections and location. In terms of storage, it uses the private space of the application, increasing the confidentiality of the temporal data stored.
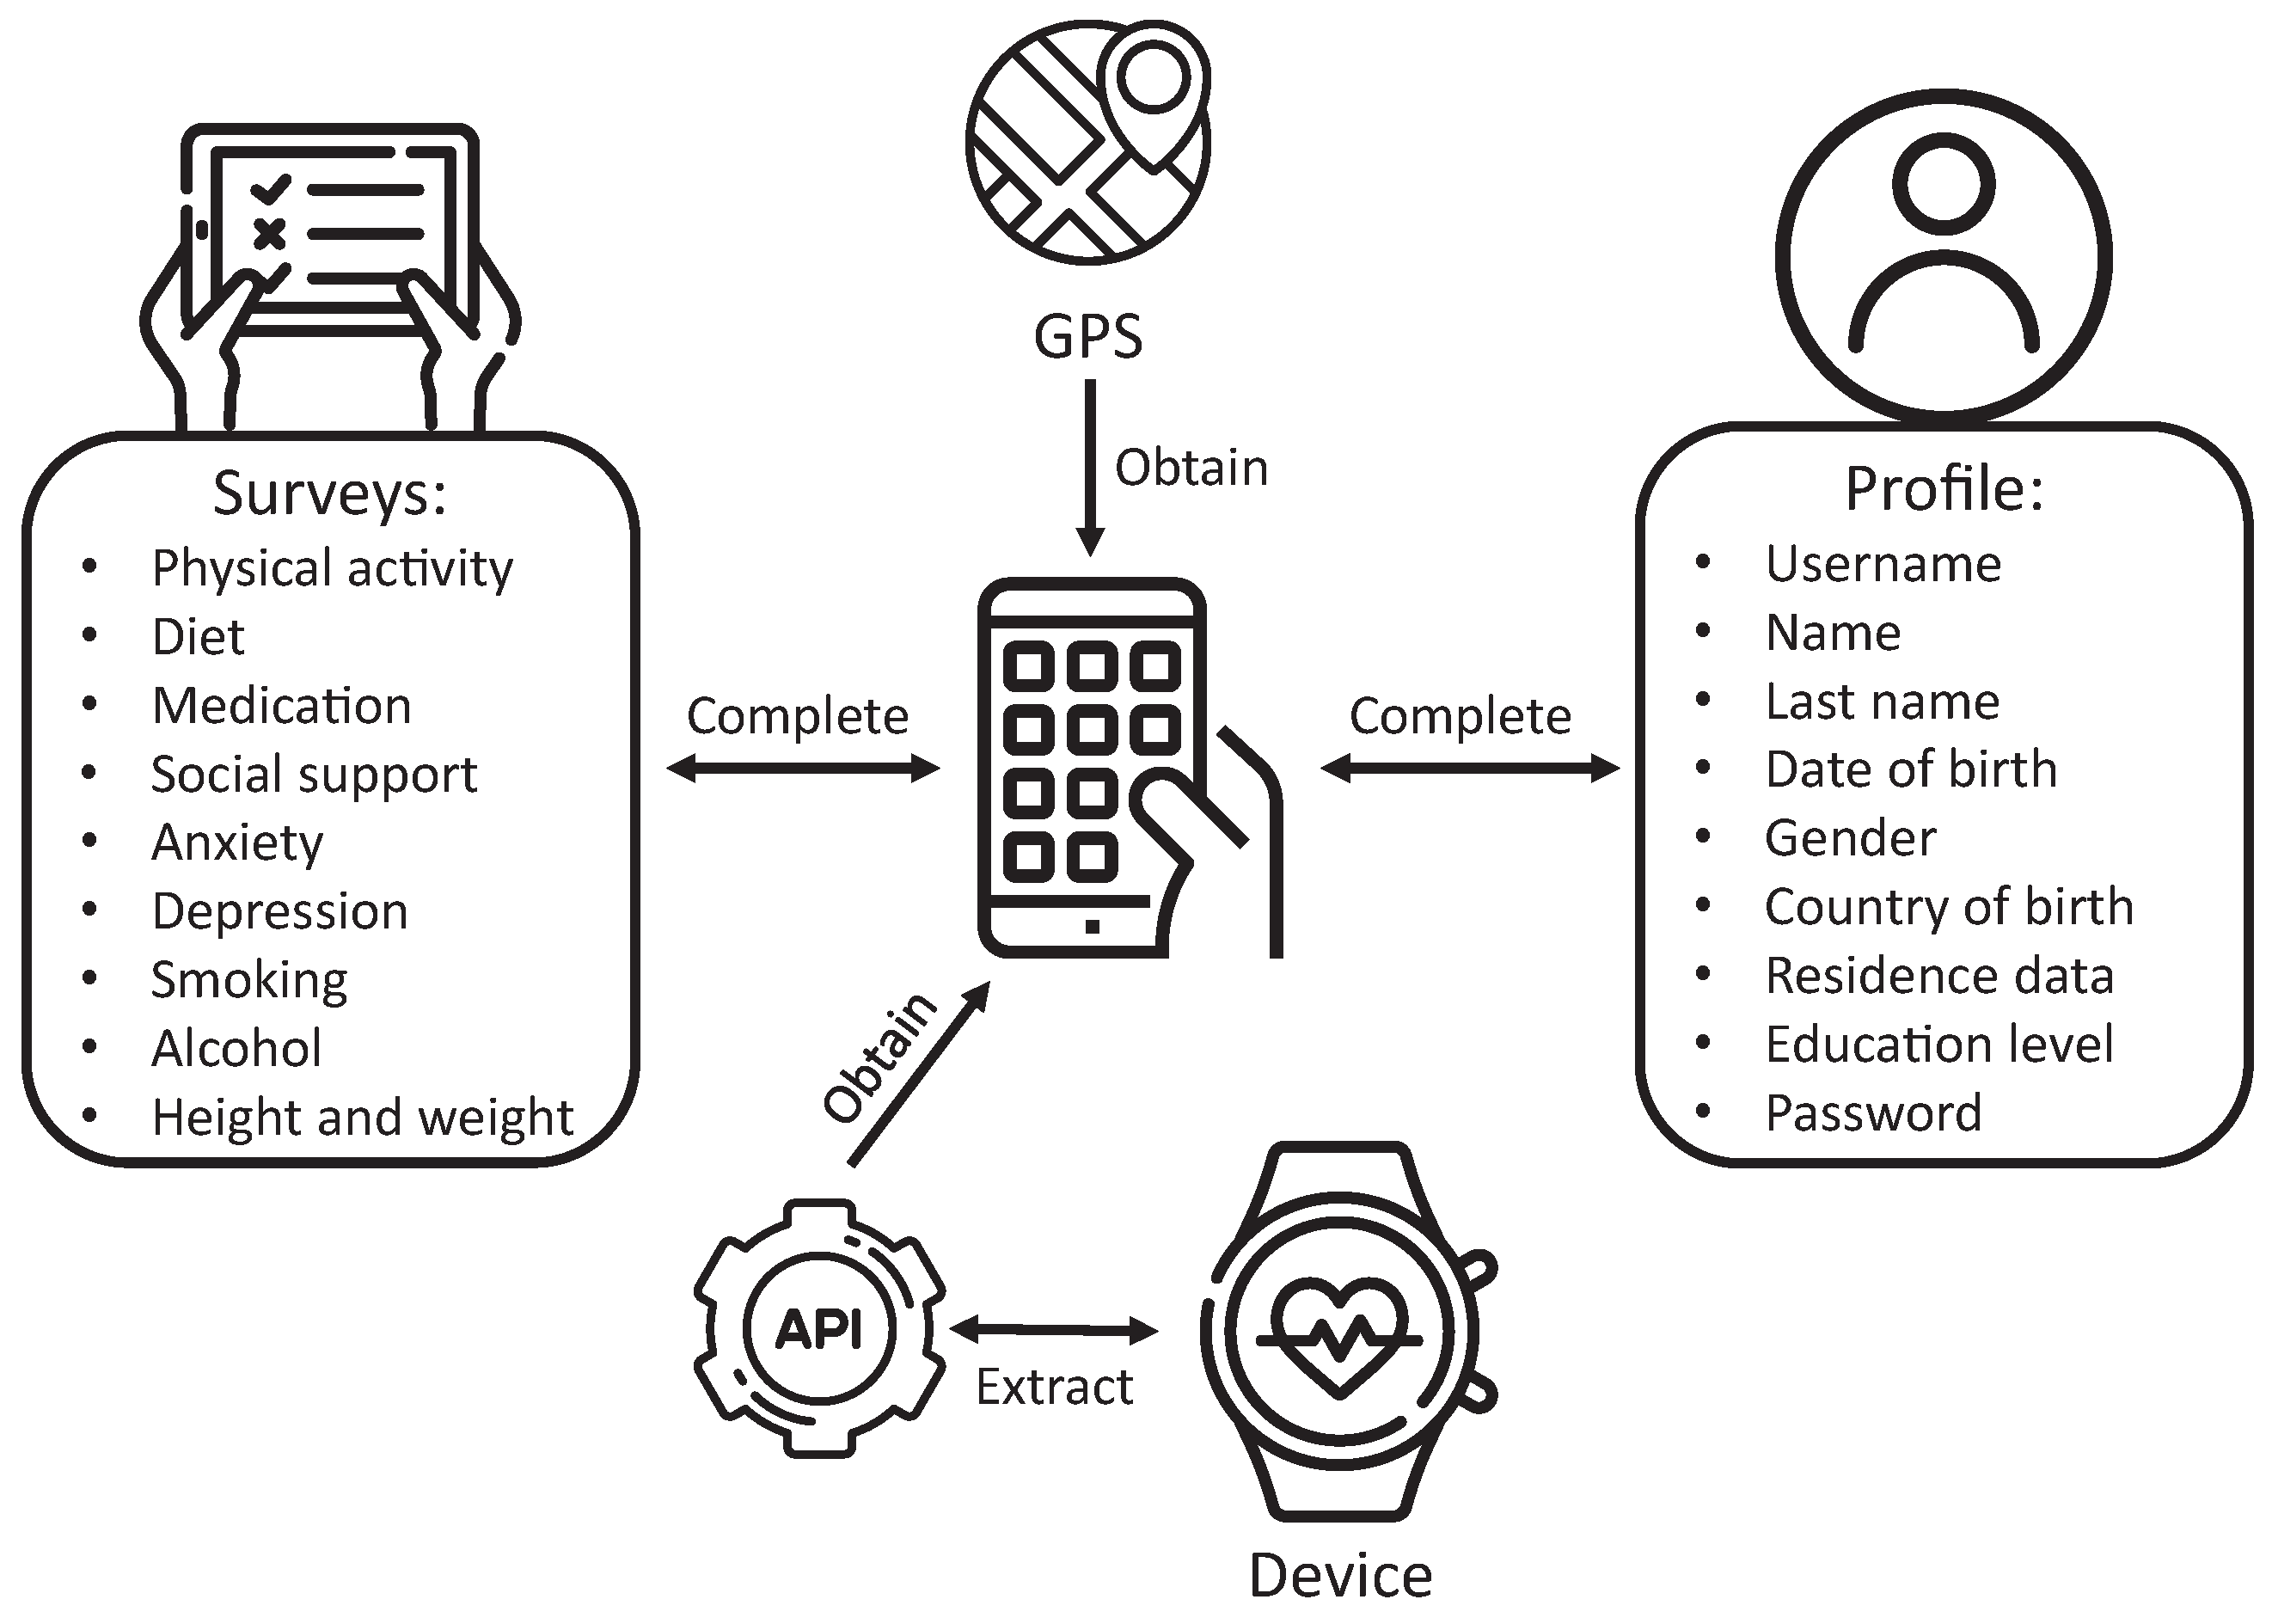
The functionality of this element of the SENIOR ecosystem is presented in
Figure 3. The application acquires information related to users’ physical data using the Omron device via the provided SDK and, particularly, blood pressure values, heart rate, and the number of steps. After each blood pressure measurement, it sends these three datapoints to the web platform. Furthermore, the application presents multiple types of surveys to cover different mental and sociological aspects, including healthy habits of the users concerning physical activity, diet, and consumption of harmful substances such as alcohol or tobacco. On the other hand, each user must register to create a profile, also used for authentication. Some of these fields represent features that are later considered by the ML models. Finally, the application gathers the user’s geographical coordinates using the GPS, essential to consult the weather and pollution values of the environment.
After presenting the architecture of the application, we describe the SDK provided by Omron to link the wearable to the application. The device is controlled by three processes subsequently presented:
Scanning: the application uses the Bluetooth of the smartphone to search for devices compatible with the SDK, returning a list of objects representing these devices. This kind of object allows the connection with the wearable and filters for a specific model during the search.
Connection: with the selected object, we need to complete the configuration of the wearable, specifying the weight, height, and stride of the user. On the other hand, we can configure alarms, date format, and temporal windows to collect sleep data. When we initiate the connection process, the communication between the devices starts, returning an object representing the linked device. With this resulting object, we will be able to start data transfers.
Transfer: with the previously indicated object, we can access blood pressure, steps, and sleep data stored in the application, including timestamps of the measurements.
After introducing the connection between the wearable and the application, we present the functioning of the different views and services defining the application.
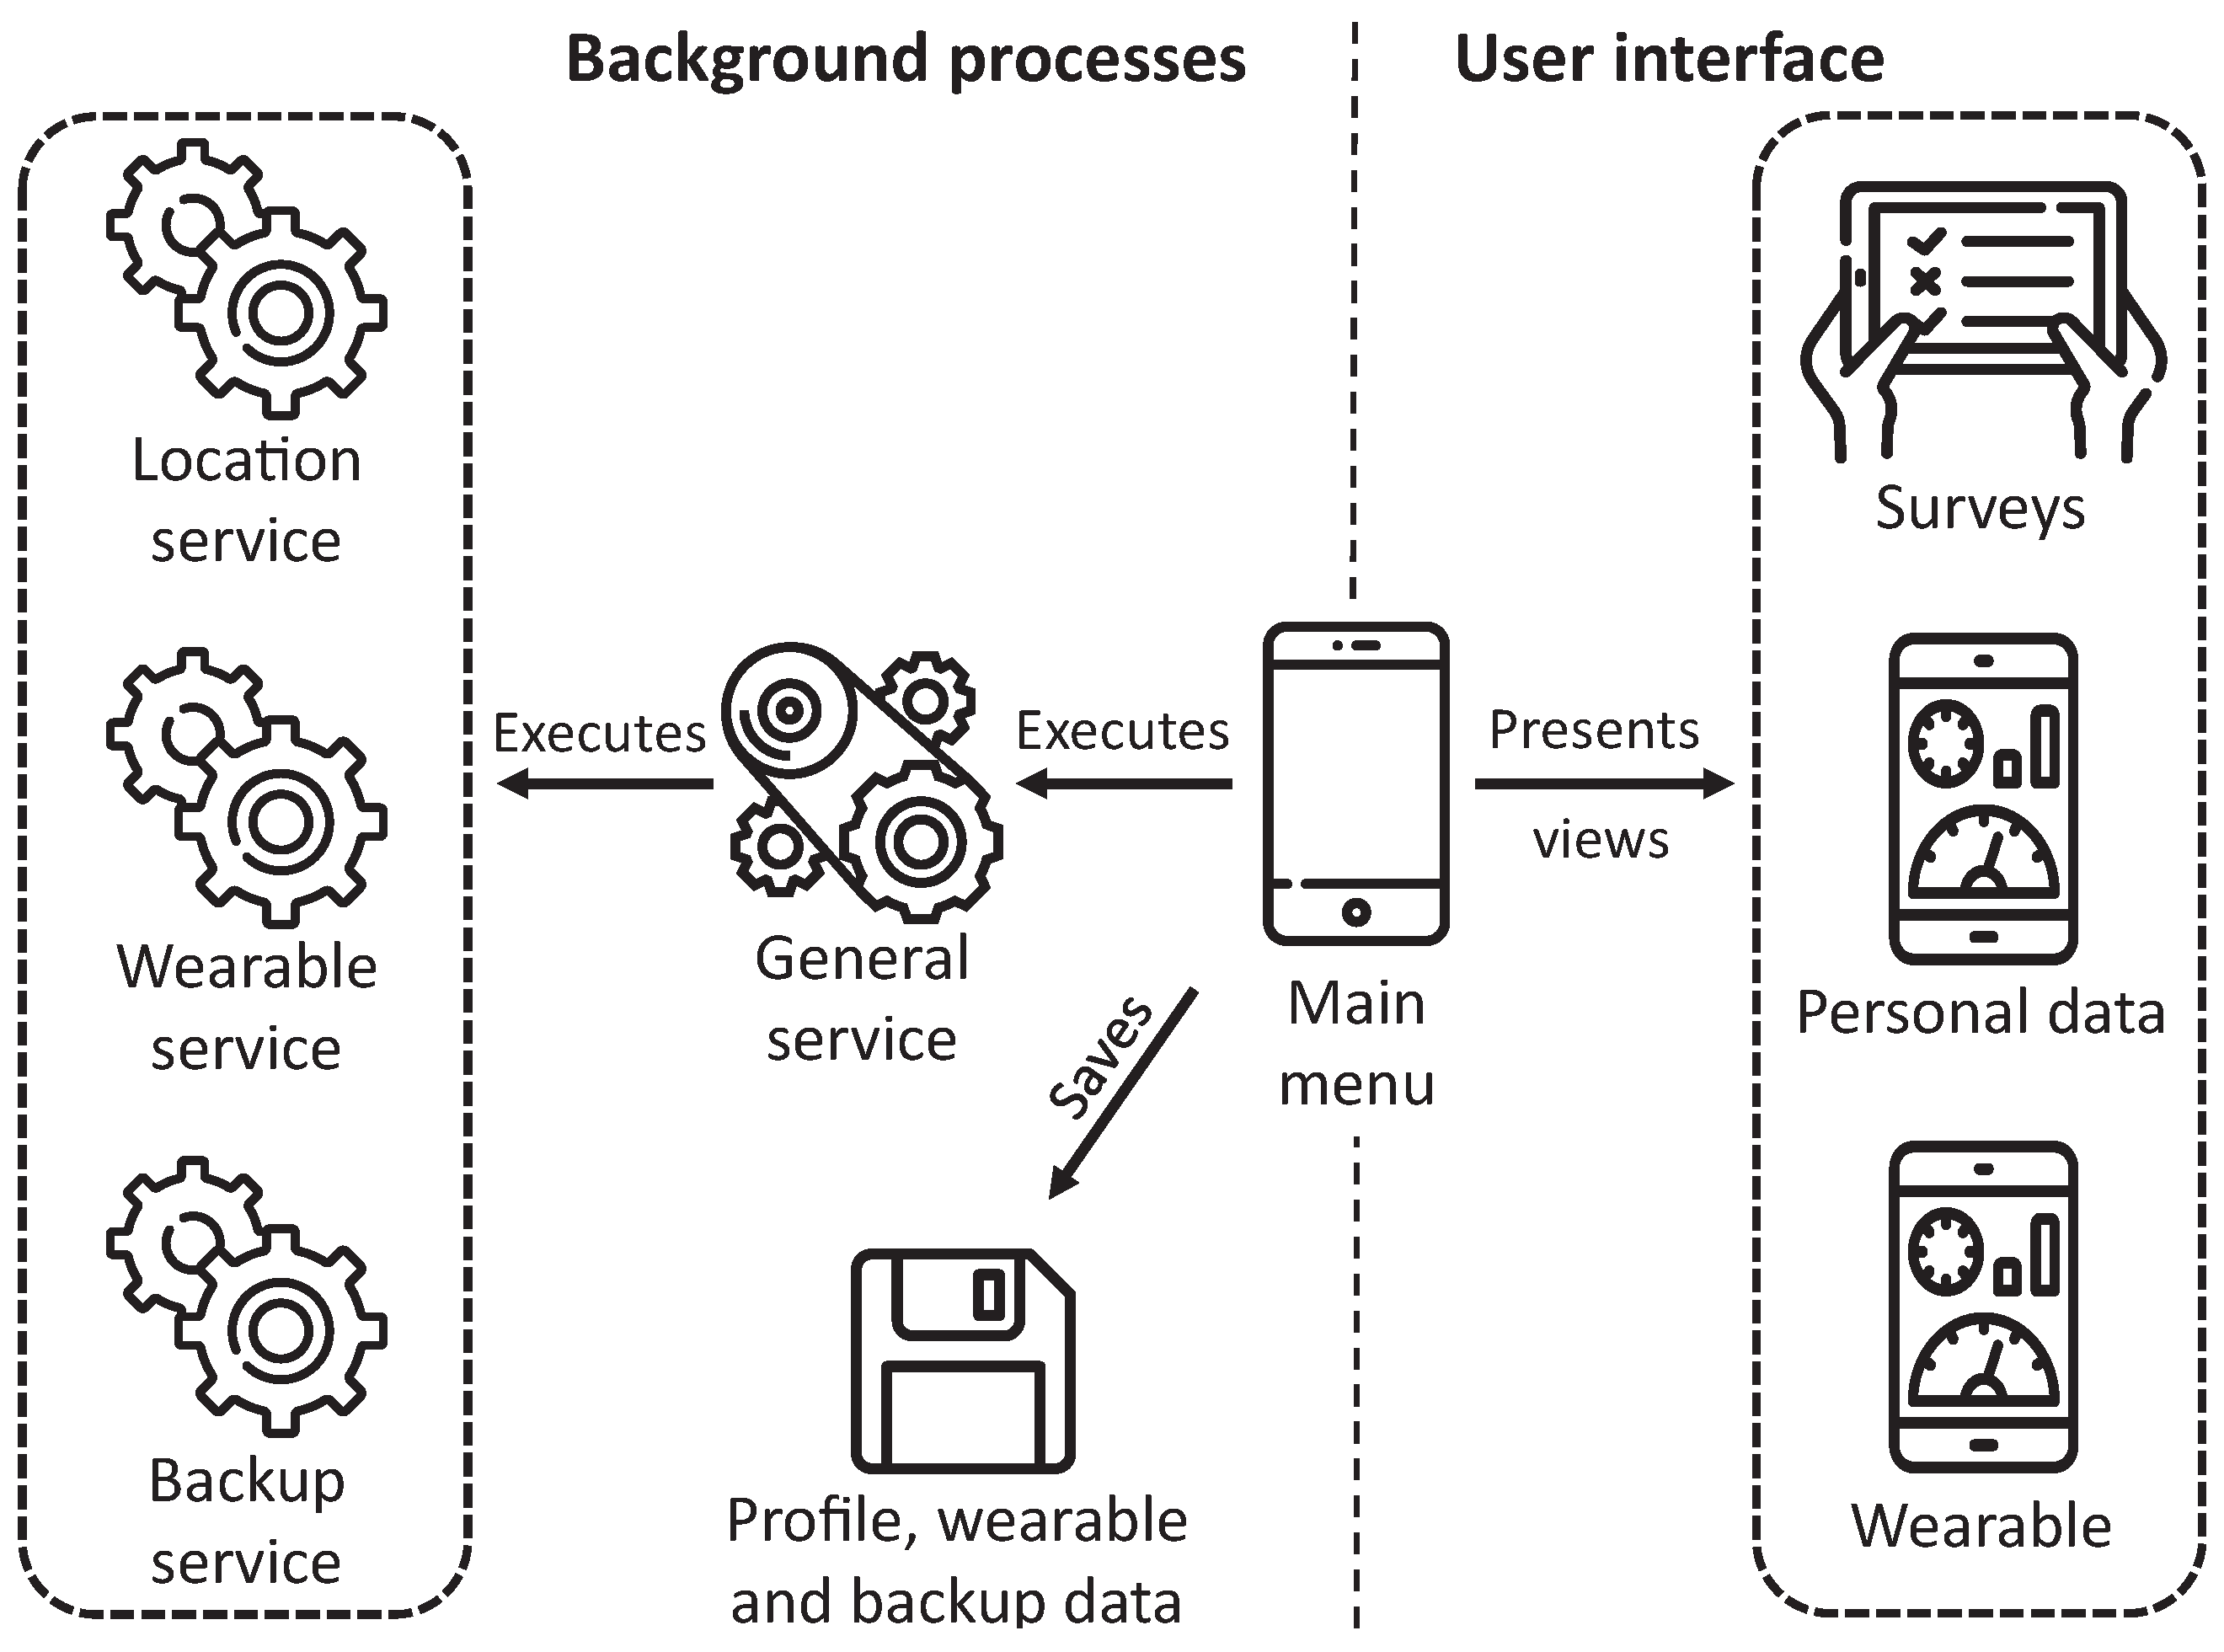
Figure 4 describes the architecture of the proposed application differentiating two main categories of elements, those representing background processes and those managing the views shown to the user. The application is designed for working in the background, gathering data automatically without requiring interaction from the user, except for completing surveys. If these data cannot be sent to the web platform due to connection issues, the application backups this data and tries to send them afterward.
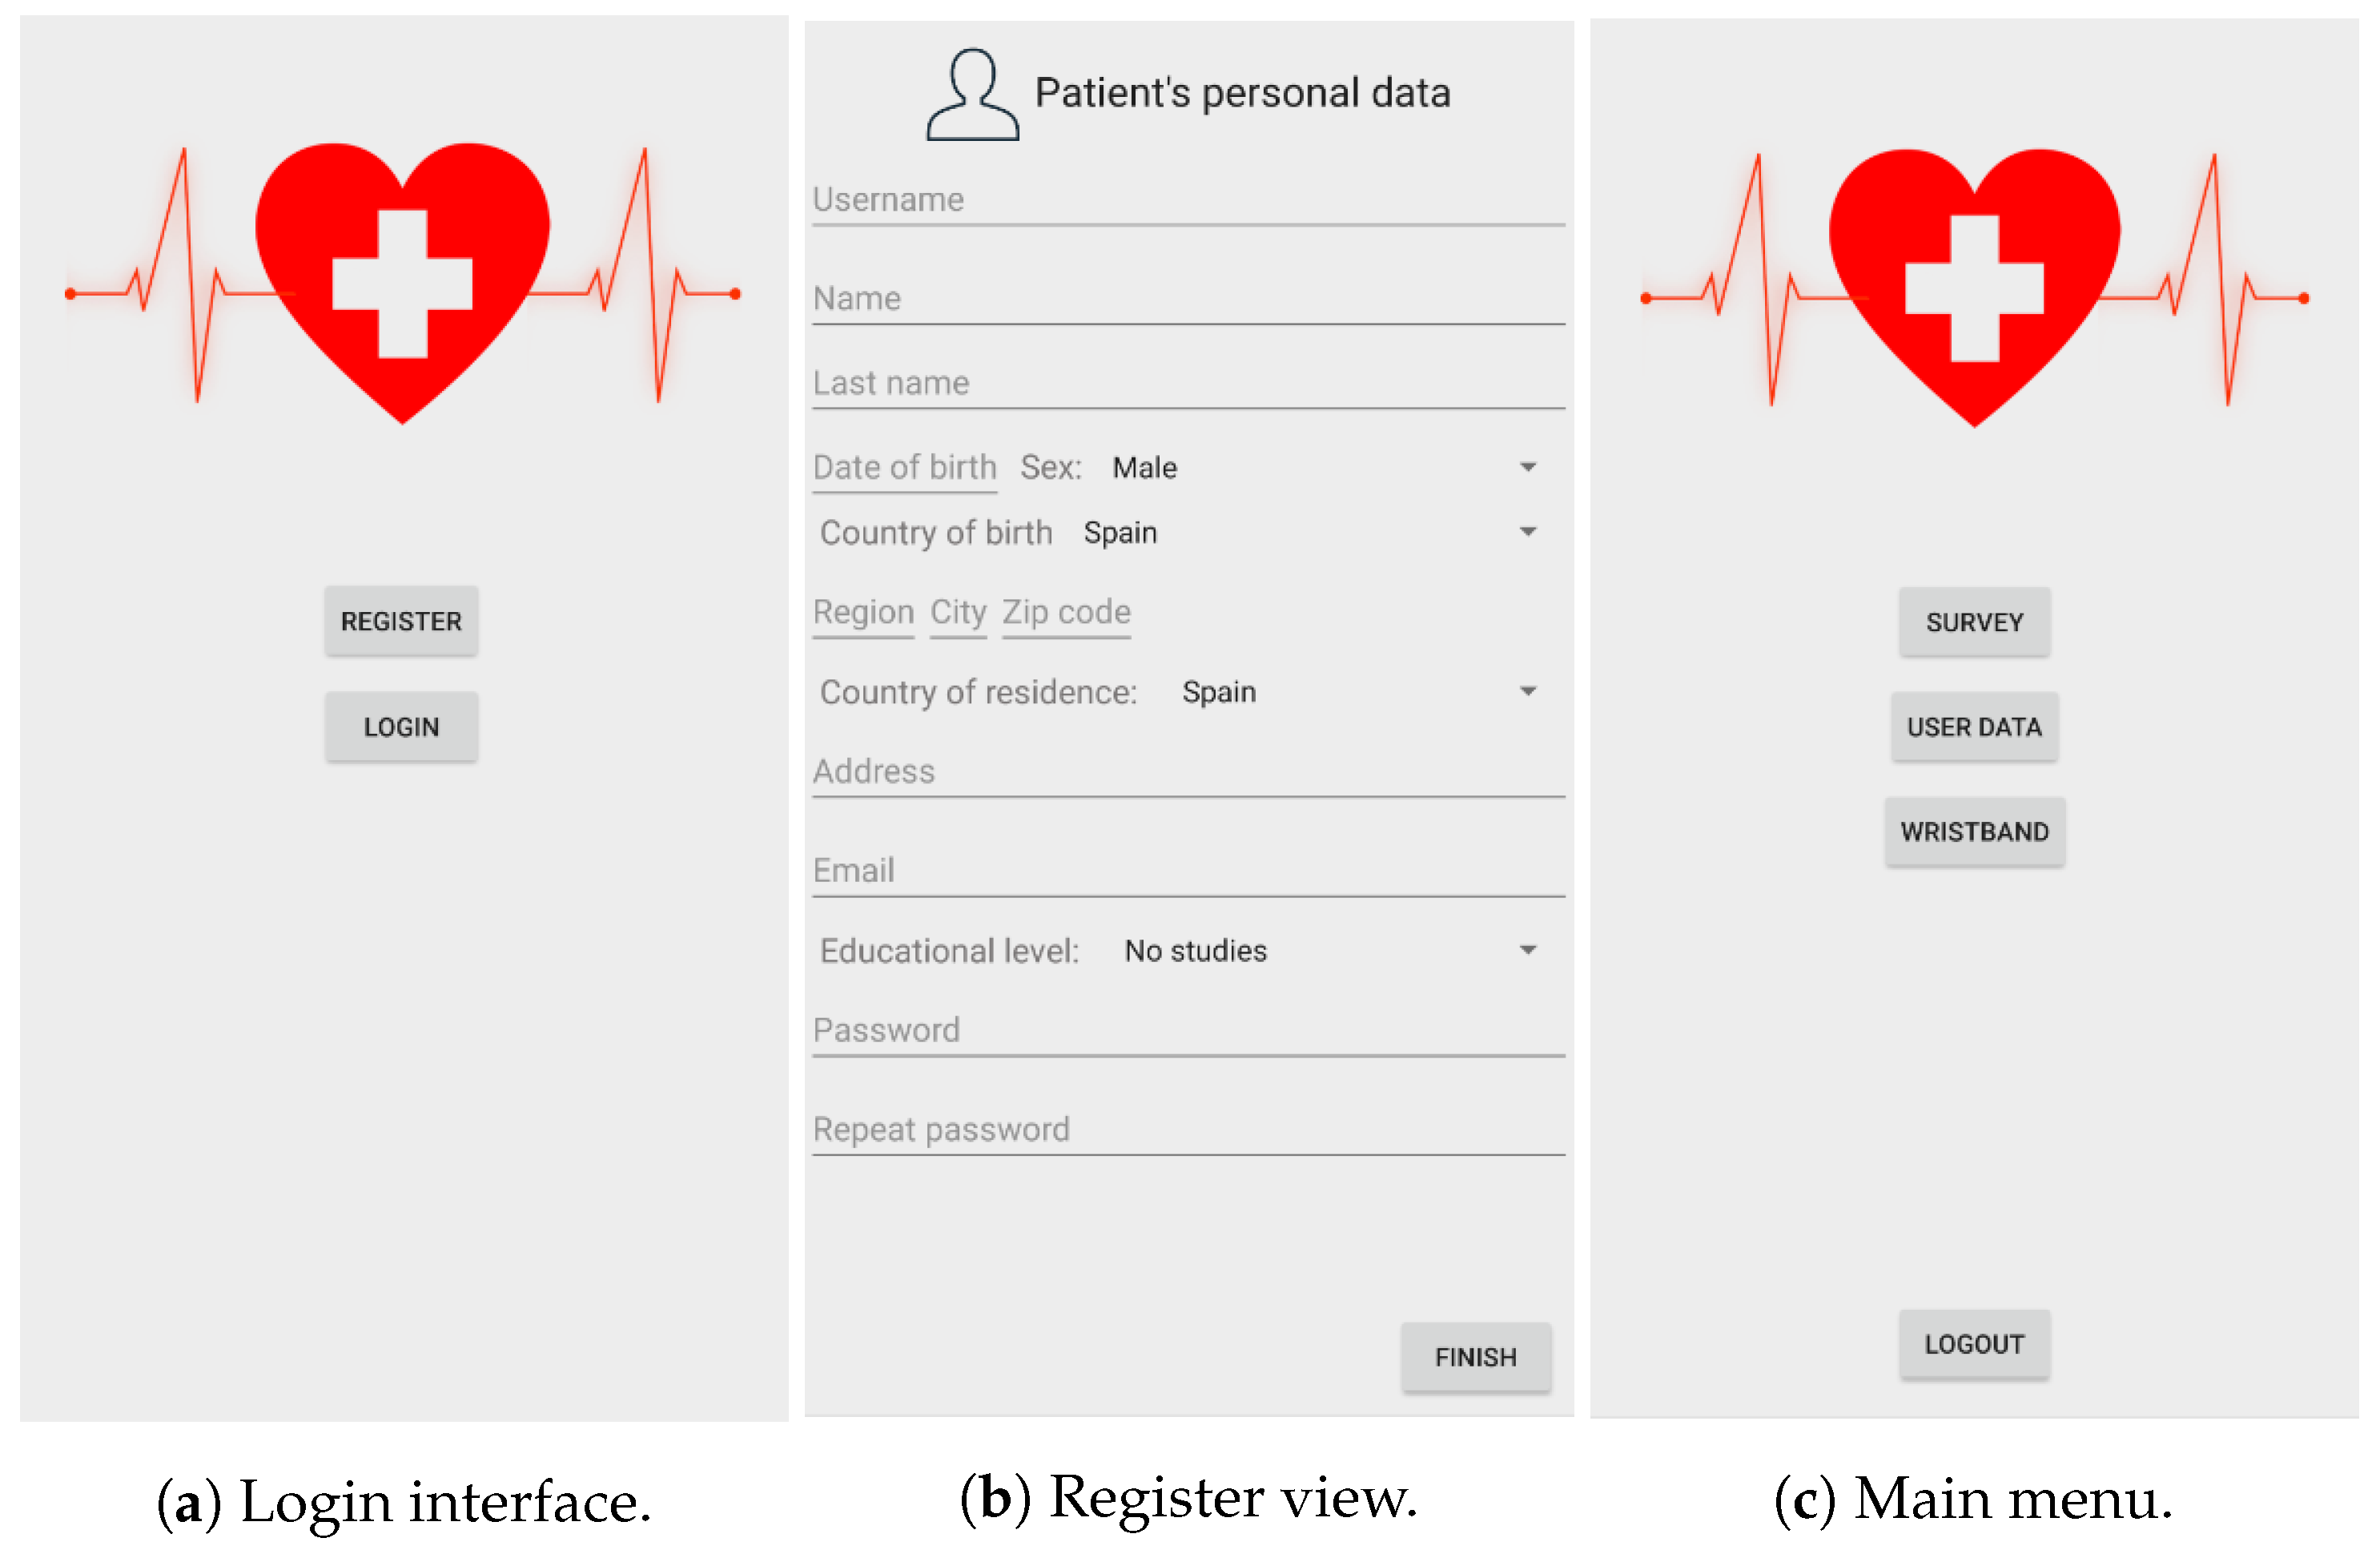
First, we will introduce the user’s interface since some of the background services depend on them. The user’s first view is the login interface (
Figure 5a), where the user can register or log in if already registered. In the case of a login operation, the smartphone sends the information to the server to verify if the user already exists. If the provided credentials were correct, the user accesses the main menu of the application (
Figure 5c). However, if it is the case of a new user, the register button will present the register process (
Figure 5b), asking to provide the required user data. Once the registration process is completed, the user will access the main menu view. Once identified, the user can access all functions defined in the application, and the background services start running. The application stores the status of the session, not requiring a new login if the user accesses the application.
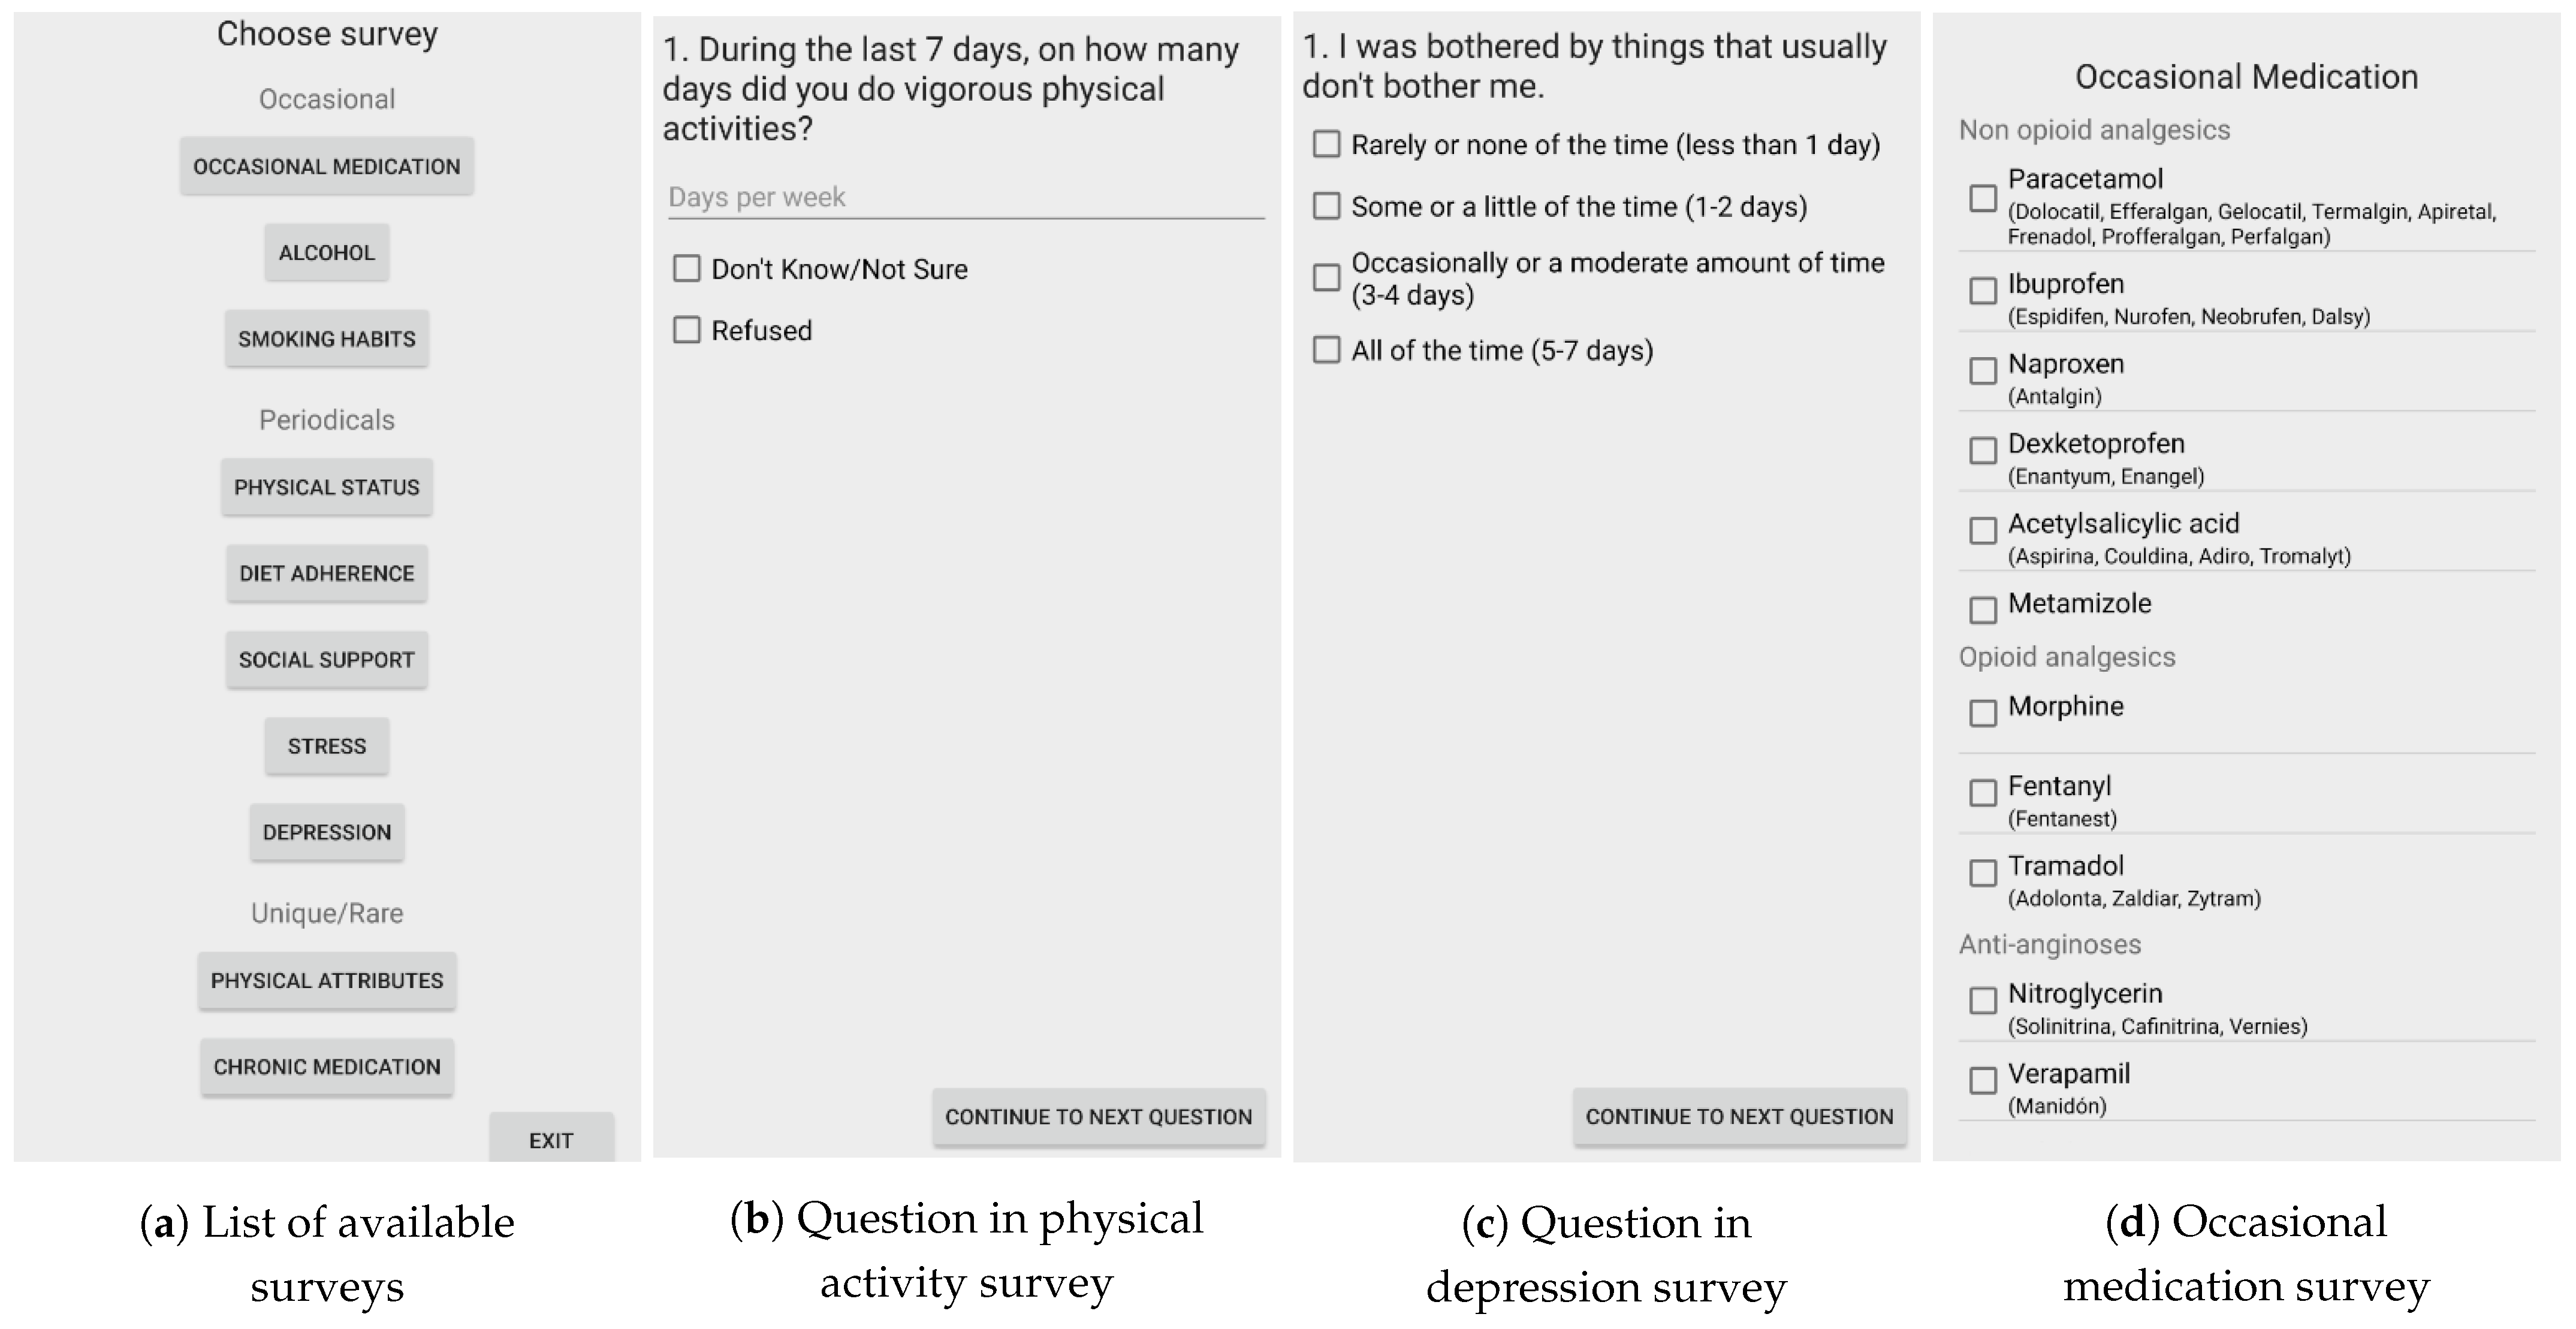
From the main menu, the user can access the list of available surveys (
Figure 6a). In particular,
Figure 6b represents a question from the physical activity survey, while
Figure 6c represents an example of the depression survey. These recurrent surveys defined in the application can contain predefined questions and free text fields to introduce a numeric value. Finally,
Figure 6d presents the survey of the consumption of occasional medication, which presents a list of different categories of medicines, including examples of common pharmacological brands. Once any survey is completed, the user must push the finish button. In that instant, the application codes the responses in JSON representation and sends them to the web platform. Despite medicine surveys, the rest of the surveys are designed not to allow multiple responses, and those fields asking for a number force the introduction of only numbers.
After introducing the user interface of the application, we subsequently present the services developed in the application to offer its essential functionality. As previously depicted in
Figure 4, the application has a general service always active, which is in charge of launching and managing other subservices focusing on particular tasks. These subservices are alive until they accomplish their purpose.
In particular, this main service must surpass the restrictions imposed by recent Android versions over background services, which can kill services even if they have priority. We have implemented a pinned notification to force Android to believe that our application is in the foreground. This notification is also useful for the user, which can verify if the application is correctly running. Next, we present a description of the tasks performed by each subservice:
Location service: this subservice is executed by the general service every 30 min. It focuses on acquiring the location of the smartphone using the GPS and transmit it to the web platform aiming to obtain weather and pollution data. Due to this service, the application must ask for location permissions.
Wearable service: it is executed every 15 min, and its tasks are to verify if the wearable has information to transmit to the application. If there is data available, it starts a transfer process for its acquisition.
Backup service: it is executed every 30 min, and it is in charge of verifying if there are data not sent to the web platform due to a connection problem. It is essential to note that this service does not store the location data since the external services do not implement queries over past instants.
3.2.3. Web Platform
Figure 7 presents the architecture of the implemented web platform, where we can observe three central modules with different functions. First, it contains a module in charge of data formatting, used to send and receive data in JSON format, since the data exchanged between the smartphone and the server have been coded in JSON format due to its broad usage and compatibility with most programming languages. It is also worthy to note that the JSON data have been encrypted and transmitted by HTTPS.
This web platform has a second module to communicate with external services to acquire weather and pollution environmental data, masking the particularities of each service. Additionally, it has been developed, considering the possible addition of new services and data types in the future. Additionally, the web platform has a module focused on the communication with the database, allowing modular and transparent management of the data, permitting its storage and consultation. Finally, there is a module in charge of executing predictions based on machine learning models previously trained. This module encapsulates the complexity of performing the prediction and managing the results of multiple ML algorithms.
This element of the SENIOR ecosystem has been implemented using Flask [
20], following a REST architecture. This web platform presents several REST endpoints to operate with the smartphone:
/register: the web platform receives the data introduced by the user in the smartphone and sent by the application. It must verify that the user does not exist, creating a new database for the user. The users’ password is represented in SHA512 to prevent its transmission and storage in plain text.
/login: it receives the identification of the user. The web platform must access the database to verify that the username and password match the data already registered in the platform. If the user exists, the platform sends the profile data to the application.
/device: this endpoint receives the data concerning new measurements acquired by the wearable and stores them into the user’s database.
/weather: it obtains the location and city in which the user currently is. The platform then emits a query to the external services and stores the response in the general database containing weather and pollution data. Additionally, it must also update the user’s database with a new entry to link these data with the environmental status. These particular implementation aspects are explained in Management of the Database System Section.
/surveys: this endpoint acquires the results of the surveys completed by the user, updating the user’s database.
/predict: it receives data concerning the patient’s current status evaluated from the different dimensions considered in the present study. These data are provided to the ML models previously trained to predict future blood pressure values using multiple ML algorithms. The platform returns a real-time prediction followed by near-future predictions for the next 8, 16, and 24 h.
Apart from these three modules, the platform includes three additional components, presented in subsequent sections. The first one is in charge of acquiring environmental data from external services, while the second communicates with the database system to store and retrieve data. Finally, the third component consists of the prediction of blood pressure values using ML algorithms.
Communication with External Services
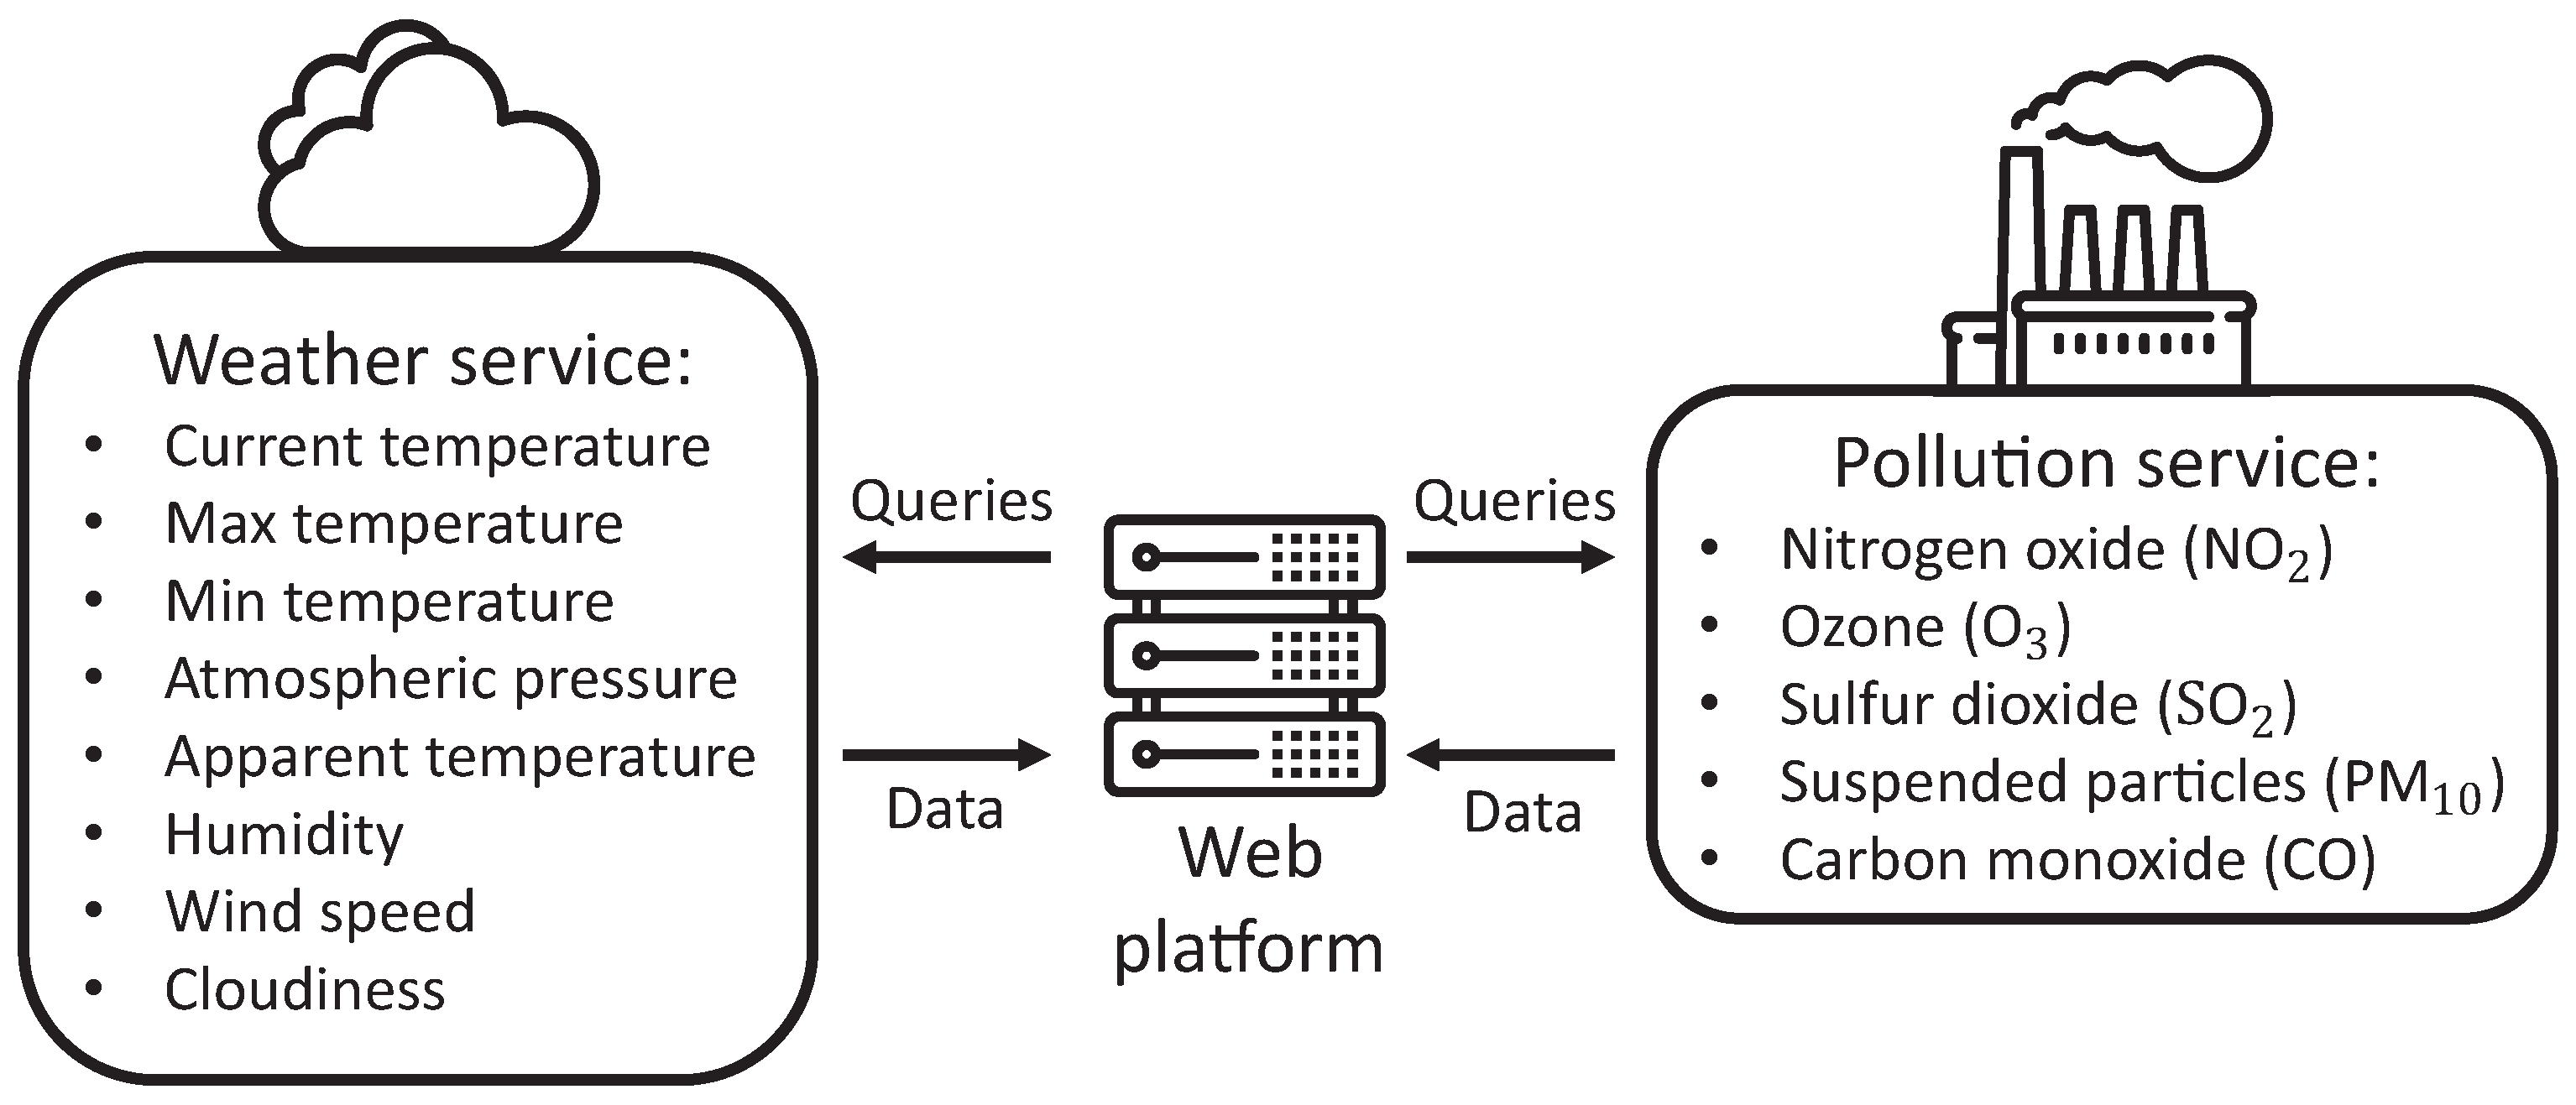
Focusing on these external services, we used OpenWeatherMap [
21] as the provider of weather data, a service allowing 60 requests per minute in its free plan, enough for our scenario. Regarding the acquisition of pollution data, we used The World Air Quality service [
22], which provides information about the air quality worldwide. We opted to unify these queries from the webserver instead of the smartphone application due to privacy concerns. Thus, the web platform sends to these external services the coordinates of each user, without any further identification data from the user. All data requested from these external services are presented in
Figure 8.
Management of the Database System
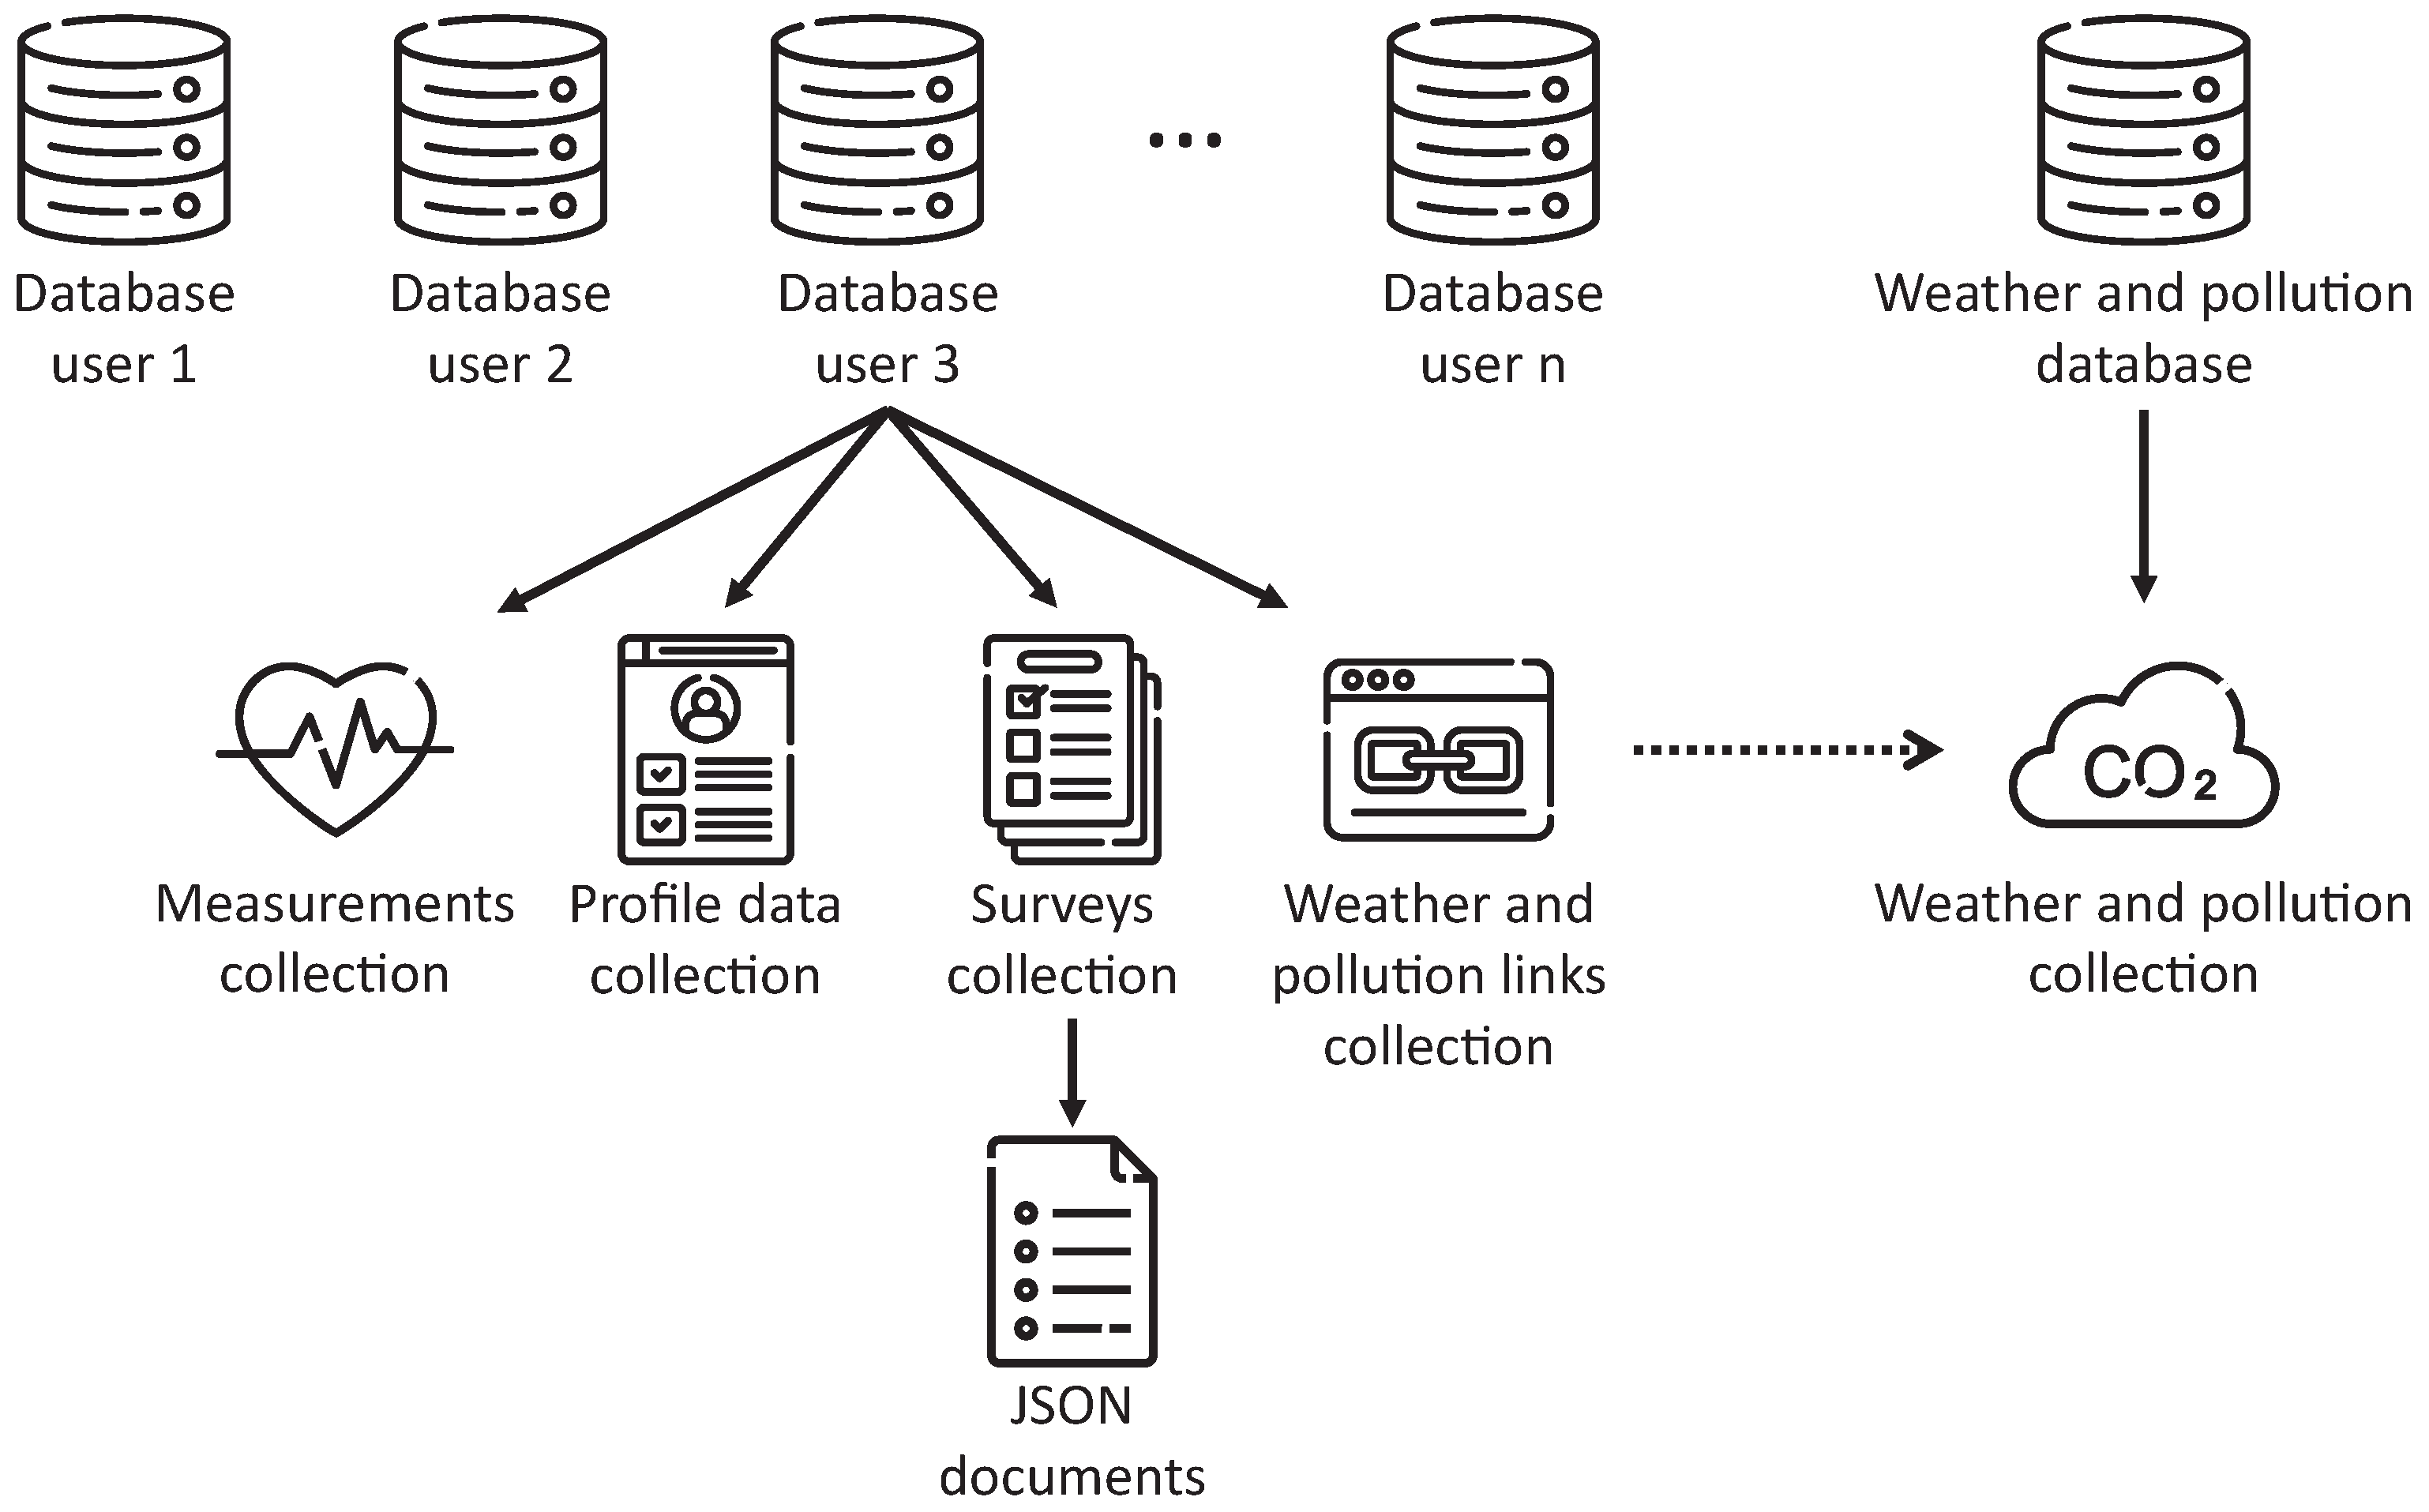
Once a new user registers on the platform, the web platform creates an individual database for the user, aiming to preserve the confidentiality of the information stored by not mixing data from multiple uses. Within each of these databases, multiple collections are created, defining different data categories.
Figure 9 presents this structure to easily understand its modeling, where we can observe particular collections for physical measurements, users’ profile data, and data concerning the results of the completed surveys. Additionally, we can identify a general database containing weather and pollution data, shared by all users’ databases. This approach was motivated by multiple users using the application in the same city, generating duplicate environmental data that could be unified to improve the efficiency of the platform.
In terms of its implementation, we followed a nonrelational approach for our storage, using MongoDB [
23] and implementing the communication with the web platform using PyMongo [
24]. We made this decision considering that the volume of the stored data would considerably increase when using the web ecosystem in comprehensive clinical trials with thousands of patients and larger acquisition temporal windows. Additionally, the acquired data coded in JSON was compatible with nonrelational data structures, easing the implementation.
Prediction of Blood Pressure Values
This last component focuses on the application of machine learning techniques to predict real-time and future blood pressure values. For that, the first step in this process is to extract datasets from the database. These datasets are essential since they are structured following a format compatible with ML algorithms. In particular, each tuple of the dataset contains all the relevant data associated with a blood pressure measurement. Additionally, it ensures a plain representation of the data, removing the complexity and particularities of the database design and implementation.
In this sense, we consider essential to indicate how the datasets have been created. First, we have defined a dataset per user, extracting the data stored in each individual database. Additionally, we were interested in having a global dataset including the acquired data from all users studied to identify differences in subsequent results. This general dataset contains an additional field indicating the identifier of the user. It is essential to highlight that each tuple of any dataset corresponds to a blood pressure measurement, completing the rest of the data based on the following criteria:
Measurements: additionally to the blood pressure value included in the tuple, we also store the heart rate and the number of steps registered at the moment of the blood pressure verification.
Periodic surveys: for each survey of this category, we select the closer data after each given blood pressure measurement, storing them in the tuple. We select future data because these surveys contain questions regarding the previous week.
Alcohol and smoking habits: we obtain those entries from the database whose registration is within the 24 h previous to the pressure measurement. We consider this temporal window to contemplate the elimination of alcohol in the blood.
Medicine surveys: for occasional medicines, we include in the tuple the name of those medicines consumed in the 24 h previous to the measurement. For chronic treatments, we always consider the closest past survey since the doctor can change chronic medication.
Height and weight survey: as before, we acquire the closest data to the pressure measurement.
Weather and pollution data: the data regarding these dimensions are directly included in the tuple since each blood pressure measurement has associated a request to the external services.
Focusing on the content of the datasets generated,
Table 2 presents the complete list of features studied by the framework, divided by categories. Additionally, we include the data type of each characteristic, where
represents the domain of natural numbers,
the set of real numbers, and
the domain of strings. It is essential to highlight that, for each survey completed by the user, we indicate in the dataset each response as an individual feature. For example, the stress survey contains 14 features, each one corresponding to a question of the survey. Moreover, and to better understand the dataset,
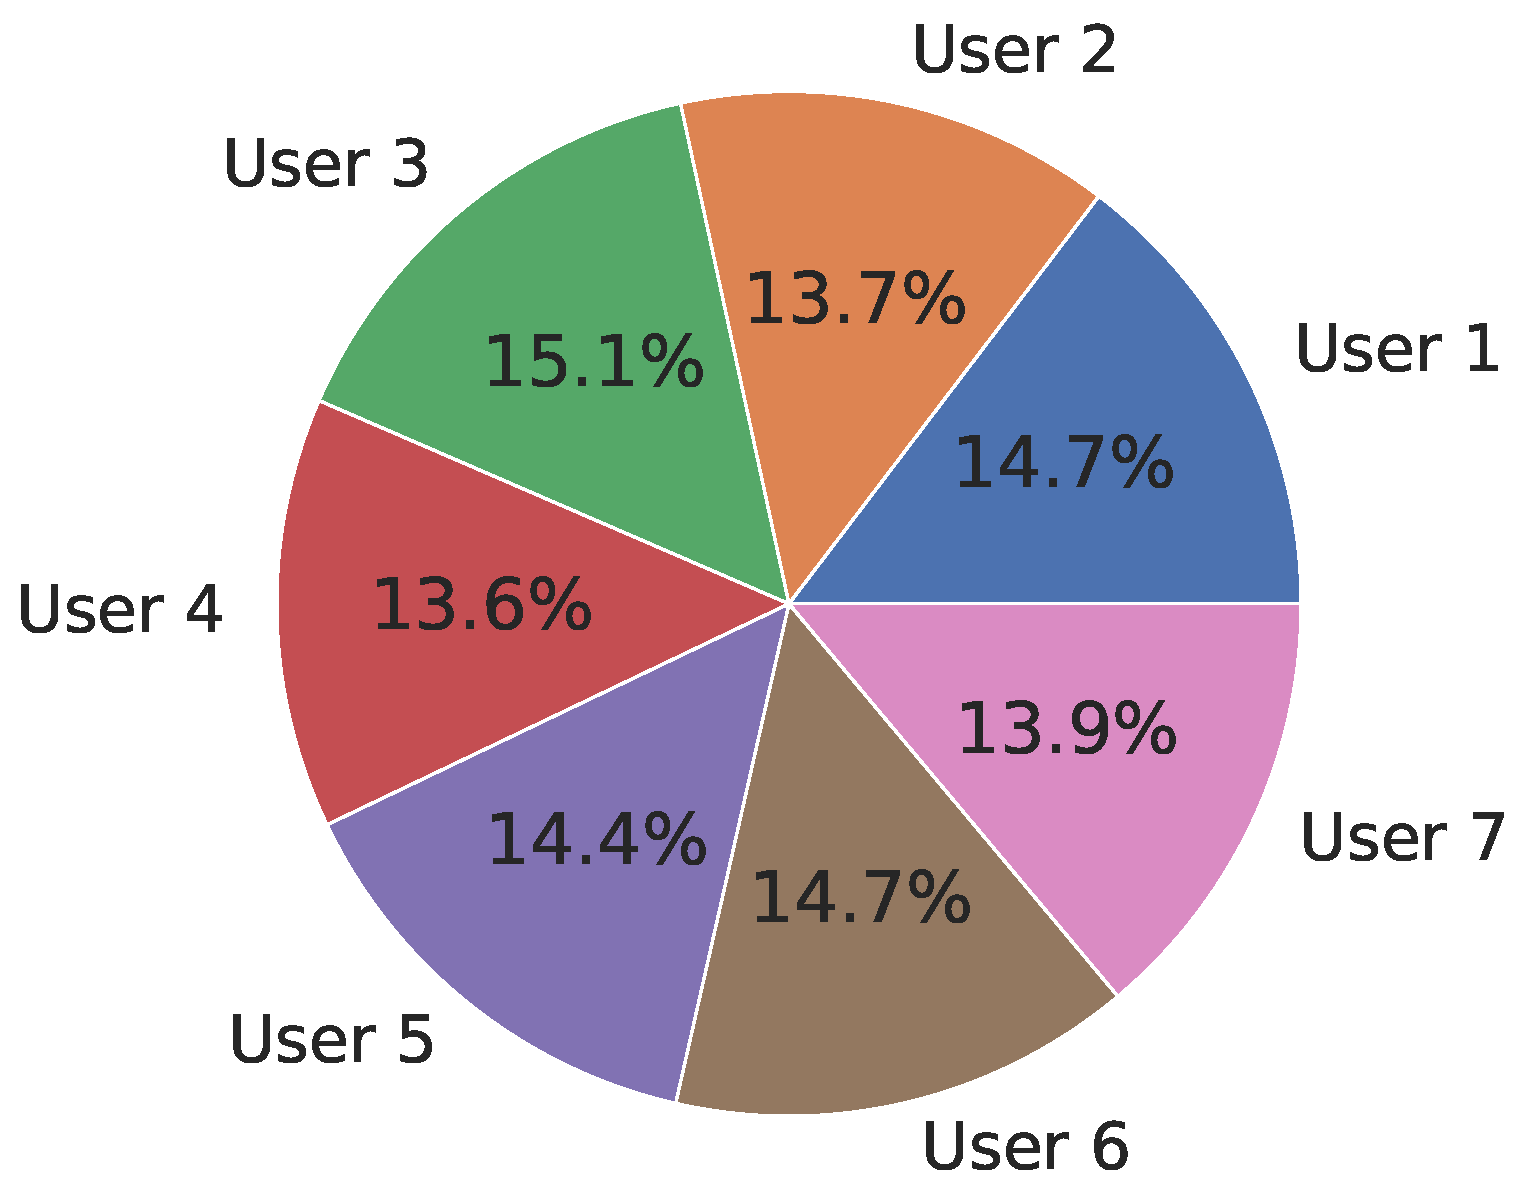
Figure 10 presents the distribution of vectors per user in the general dataset, indicated as the percentage of vectors over the complete dataset. We can observe that the number of vectors per user is quite balanced. These differences depend on the number of occasional surveys completed, such as smoking, alcohol, or nonchronic medication consumption.
Once introduced the procedure followed to generate datasets and the structure of these datasets, we present the process followed for training ML models able to predict blood pressure values. We used Python and, particularly, the
Scikit-learn library [
25] for the implementation of the training processes. First, we divided the data into two subsets, where the first one represented the 80% of the data and was used to train the ML models. The second subset, containing the remaining 20% of the datasets, was necessary for calculating the prediction error of the models. These data were normalized and adapted to be compatible with ML algorithms, such as treating corrupt and missing values or encoding categorical features. After that, we performed a feature filtering process, removing those features from each dataset highly correlated with the label. We also removed features whose variance was equal to zero, indicating a lack of variability. Most of these features were related to medicine surveys without data or questions from surveys always registering the same response.
Before providing these data to the ML algorithms, they must be separated from the data defining the labels to predict. In our scenario, these labels are the systolic and diastolic pressure values. They are grouped both ensemble and individually since some tested algorithms cannot be trained with more than one label. To train the ML models, we have tested the most common algorithms in the literature, namely Random Forest (RF), Decision Tree (DT), Support Vector Regression (SVR), Bayesian Ridge (BR), Linear Regression (LR), and Polynomial Regression (PR). For them, we have applied the
RamdomizedSearchCV from
Scikit-learn to automatically obtain a range of parameters offering the best combinations for each algorithm, returning the trained model. In particular,
Table 3 presents the optimal values selected for most relevant parameters used for each algorithm. The optimal number of iterations to search for the best combination is 100, selecting between these models the one offering best results.
During the training process, we have used cross-validation with k = 10 to detect overfitting. The only exception was polynomial regression due to incompatibilities with the library. After the training phase, we have used the Root Mean Square Error (RMSE) and the R-squared correlation coefficient to determine the error obtained by the prediction using the testing subset of the dataset.
4. Results
This section presents the results obtained from the evaluation of the trained machine learning (ML) models, using the Root Mean Square Error (RMSE) and the R-squared correlation coefficient metrics to measure the quality of the predictions. First, we address the quality of real-time predictions, presenting a comparison between algorithms and datasets. Additionally, we present the most relevant features used by the ML algorithm offering the best predictions. Moreover, we compare these real-time predictions with future ones based on 8, 16, and 24 h temporal windows.
Regarding real-time predictions,
Figure 11 presents a plot per trained model, indicating the RMSE associated with each dataset over both individual and aggregated approaches. We can observe two bars per user, corresponding to diastolic (lighter color) and systolic (darker color) predictions. It is interesting to note that Random Forest and Decision Tree present the same error for diastolic and systolic predictions since these algorithms are the only ones allowing multi-label training. The other requires training independent models for each blood pressure value. Focusing on the results, we can observe that the RMSE dramatically grows for users 2, 3 and 6 in SVR, BR, LR and PR algorithms. This situation is motivated by
underfitting during the training process, where the quality of the data was not enough to allow those algorithms to converge. Without considering these particular situations, the ML algorithms offer good results.
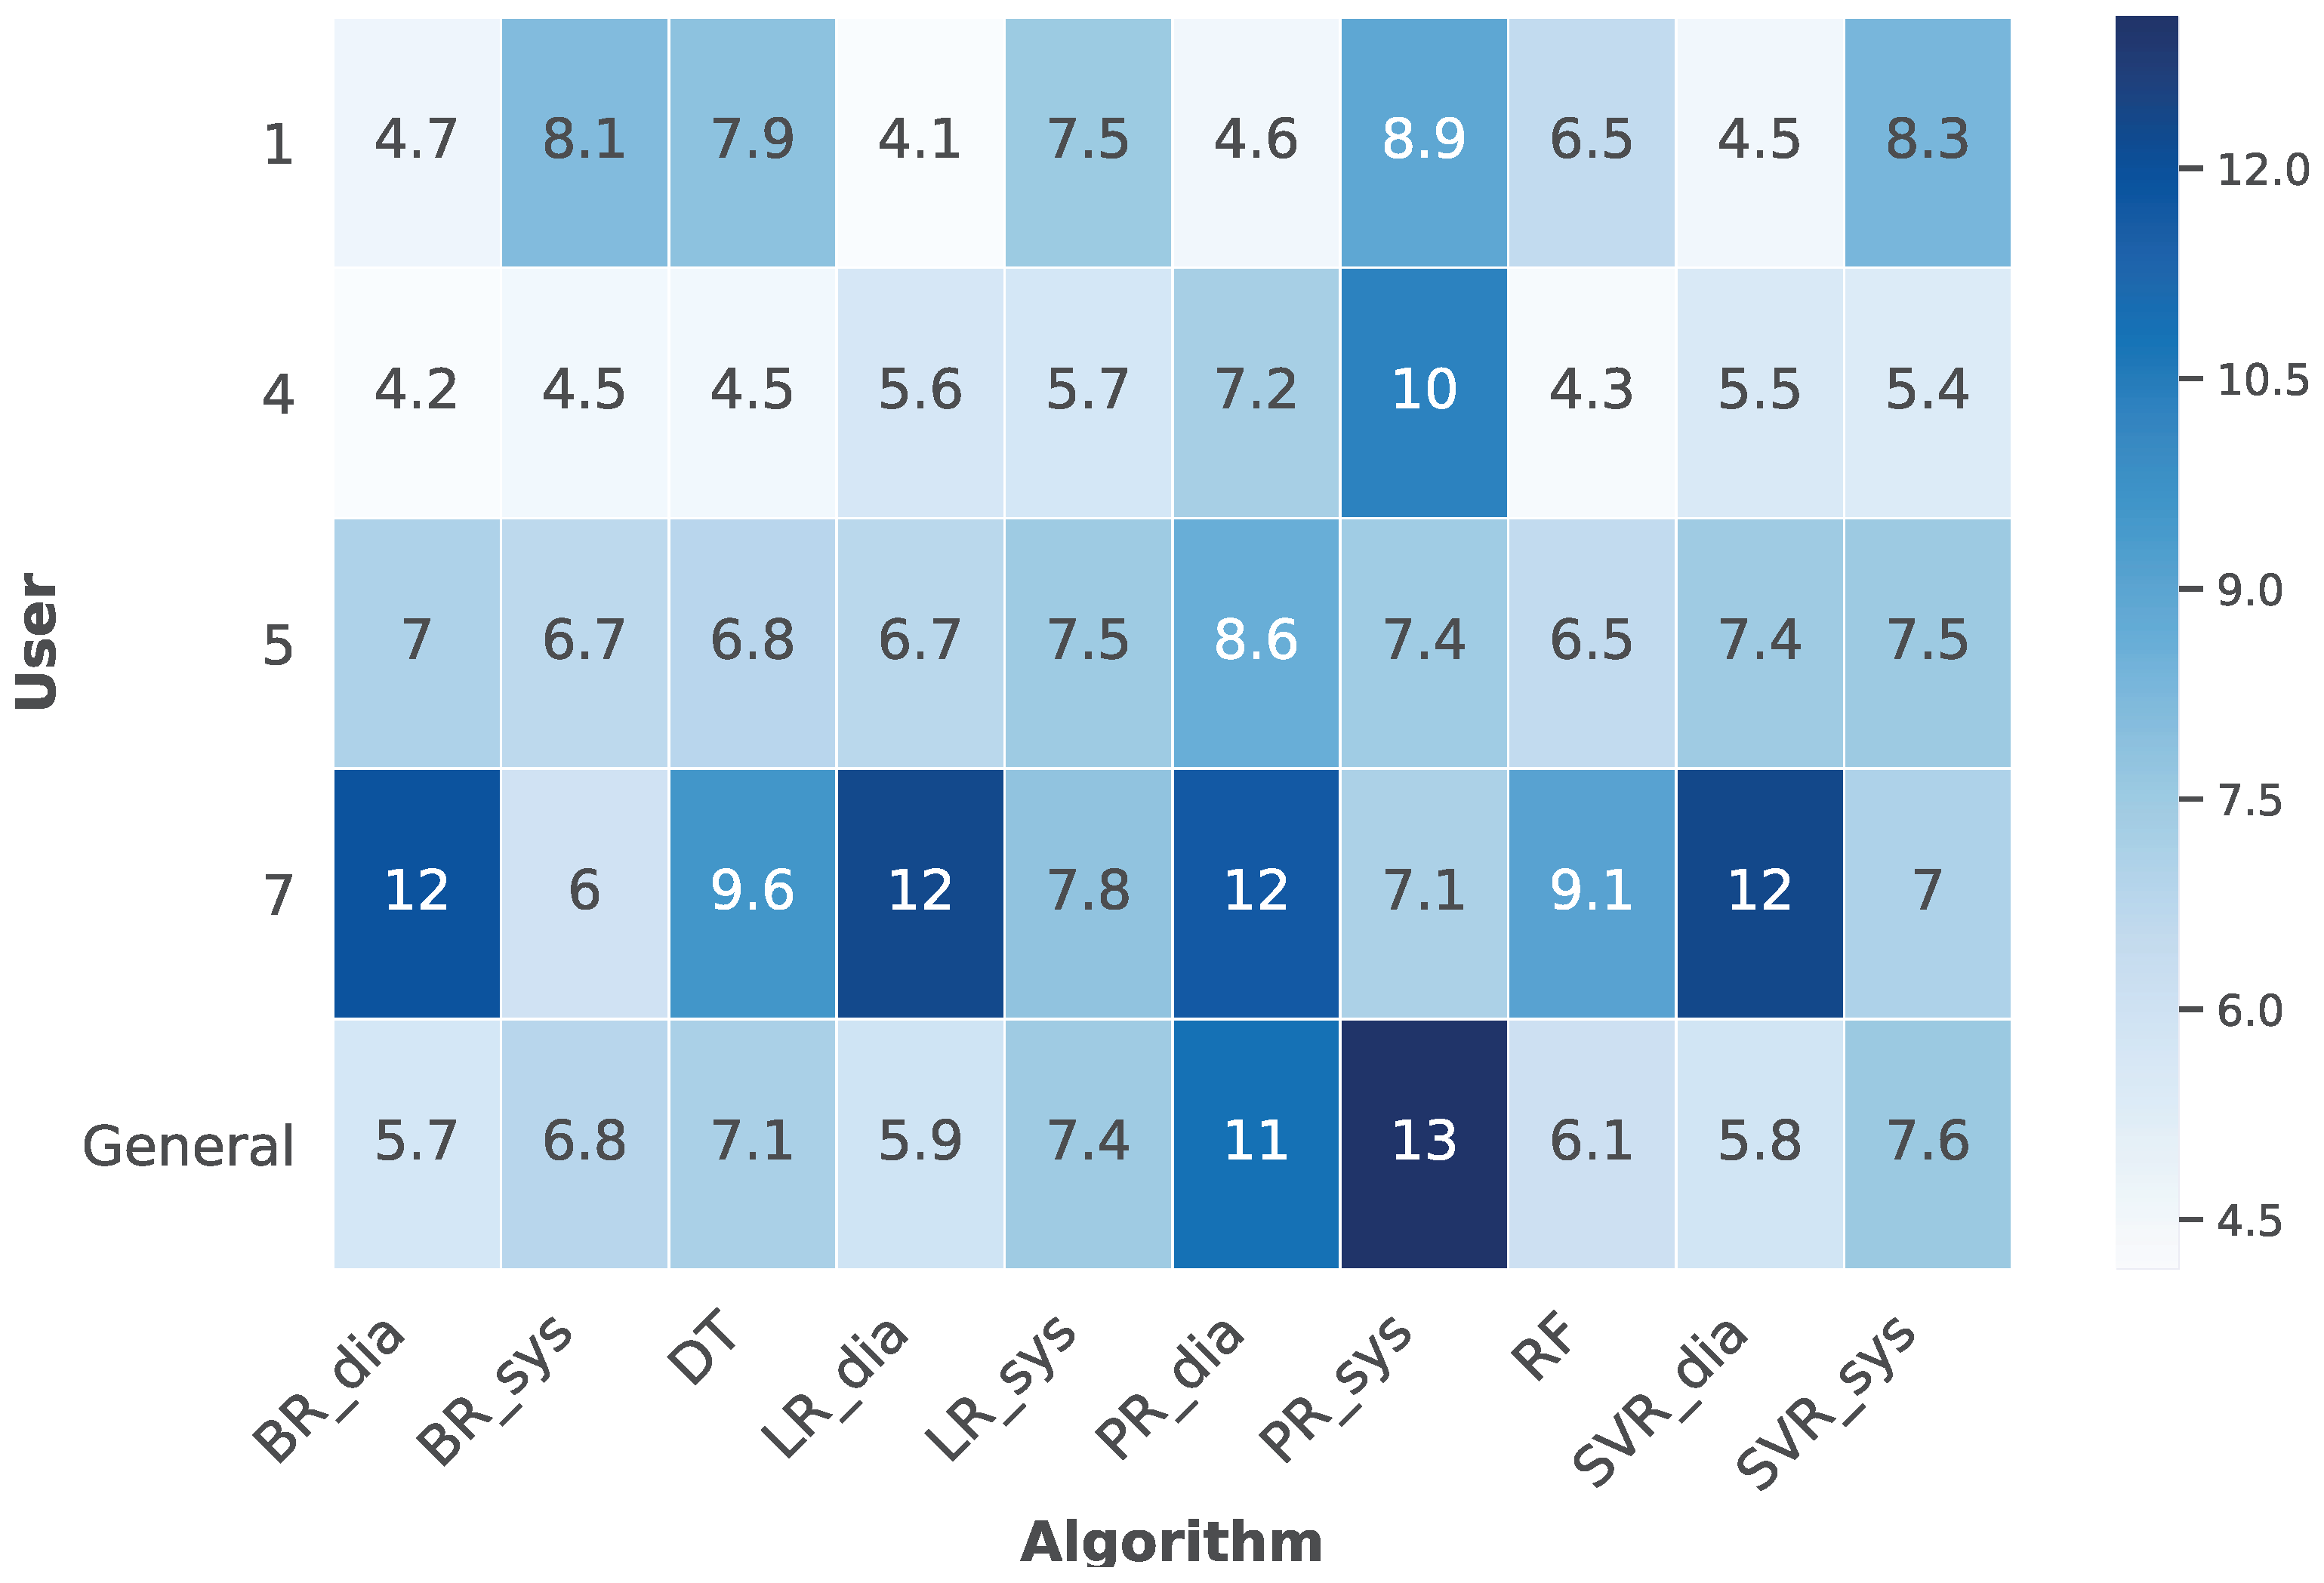
Figure 12 presents a heat map containing those users who did not suffer underfitting during the training process, thus excluding users 2, 3, and 6 to visualize better the data previously introduced by
Figure 11. This heat map indicates that users 1, 4, and 5 present better RMSE values than user seven and the general dataset. Additionally, Random Forest presents the best results in predicting both systolic and diastolic blood pressure values. Nevertheless, particular algorithms can independently predict either systolic or diastolic values better than Random Forest, offering the possibility to select which algorithms are more suitable for each user.
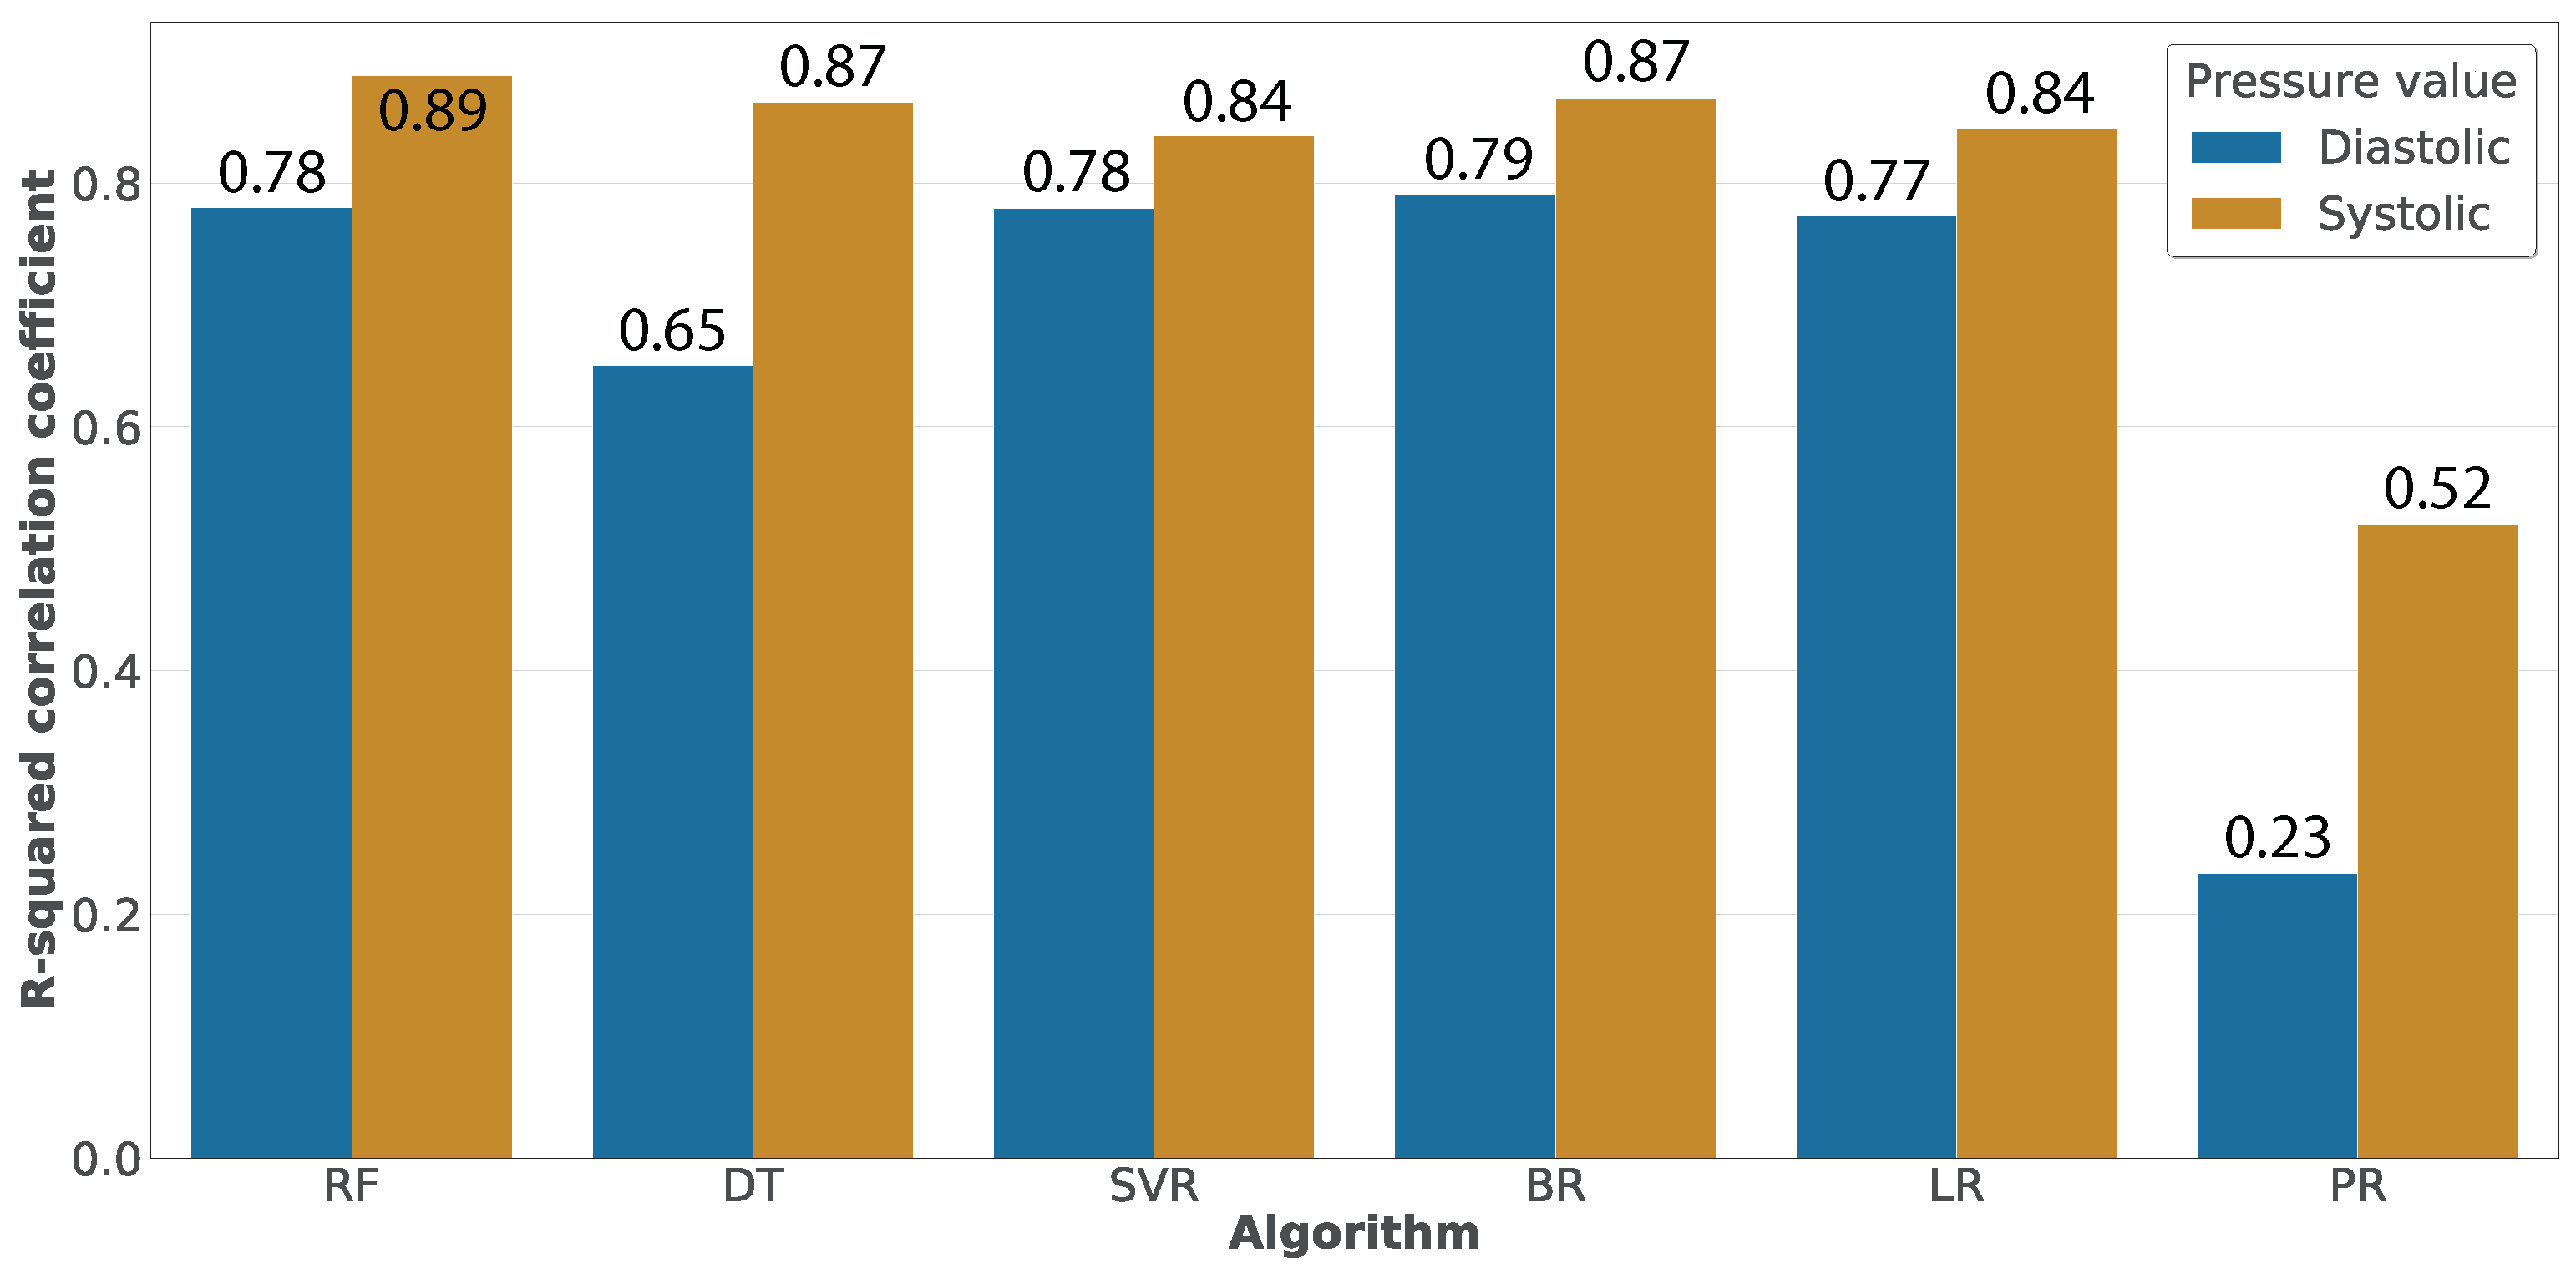
Once evaluated the algorithms in terms of the RMSE,
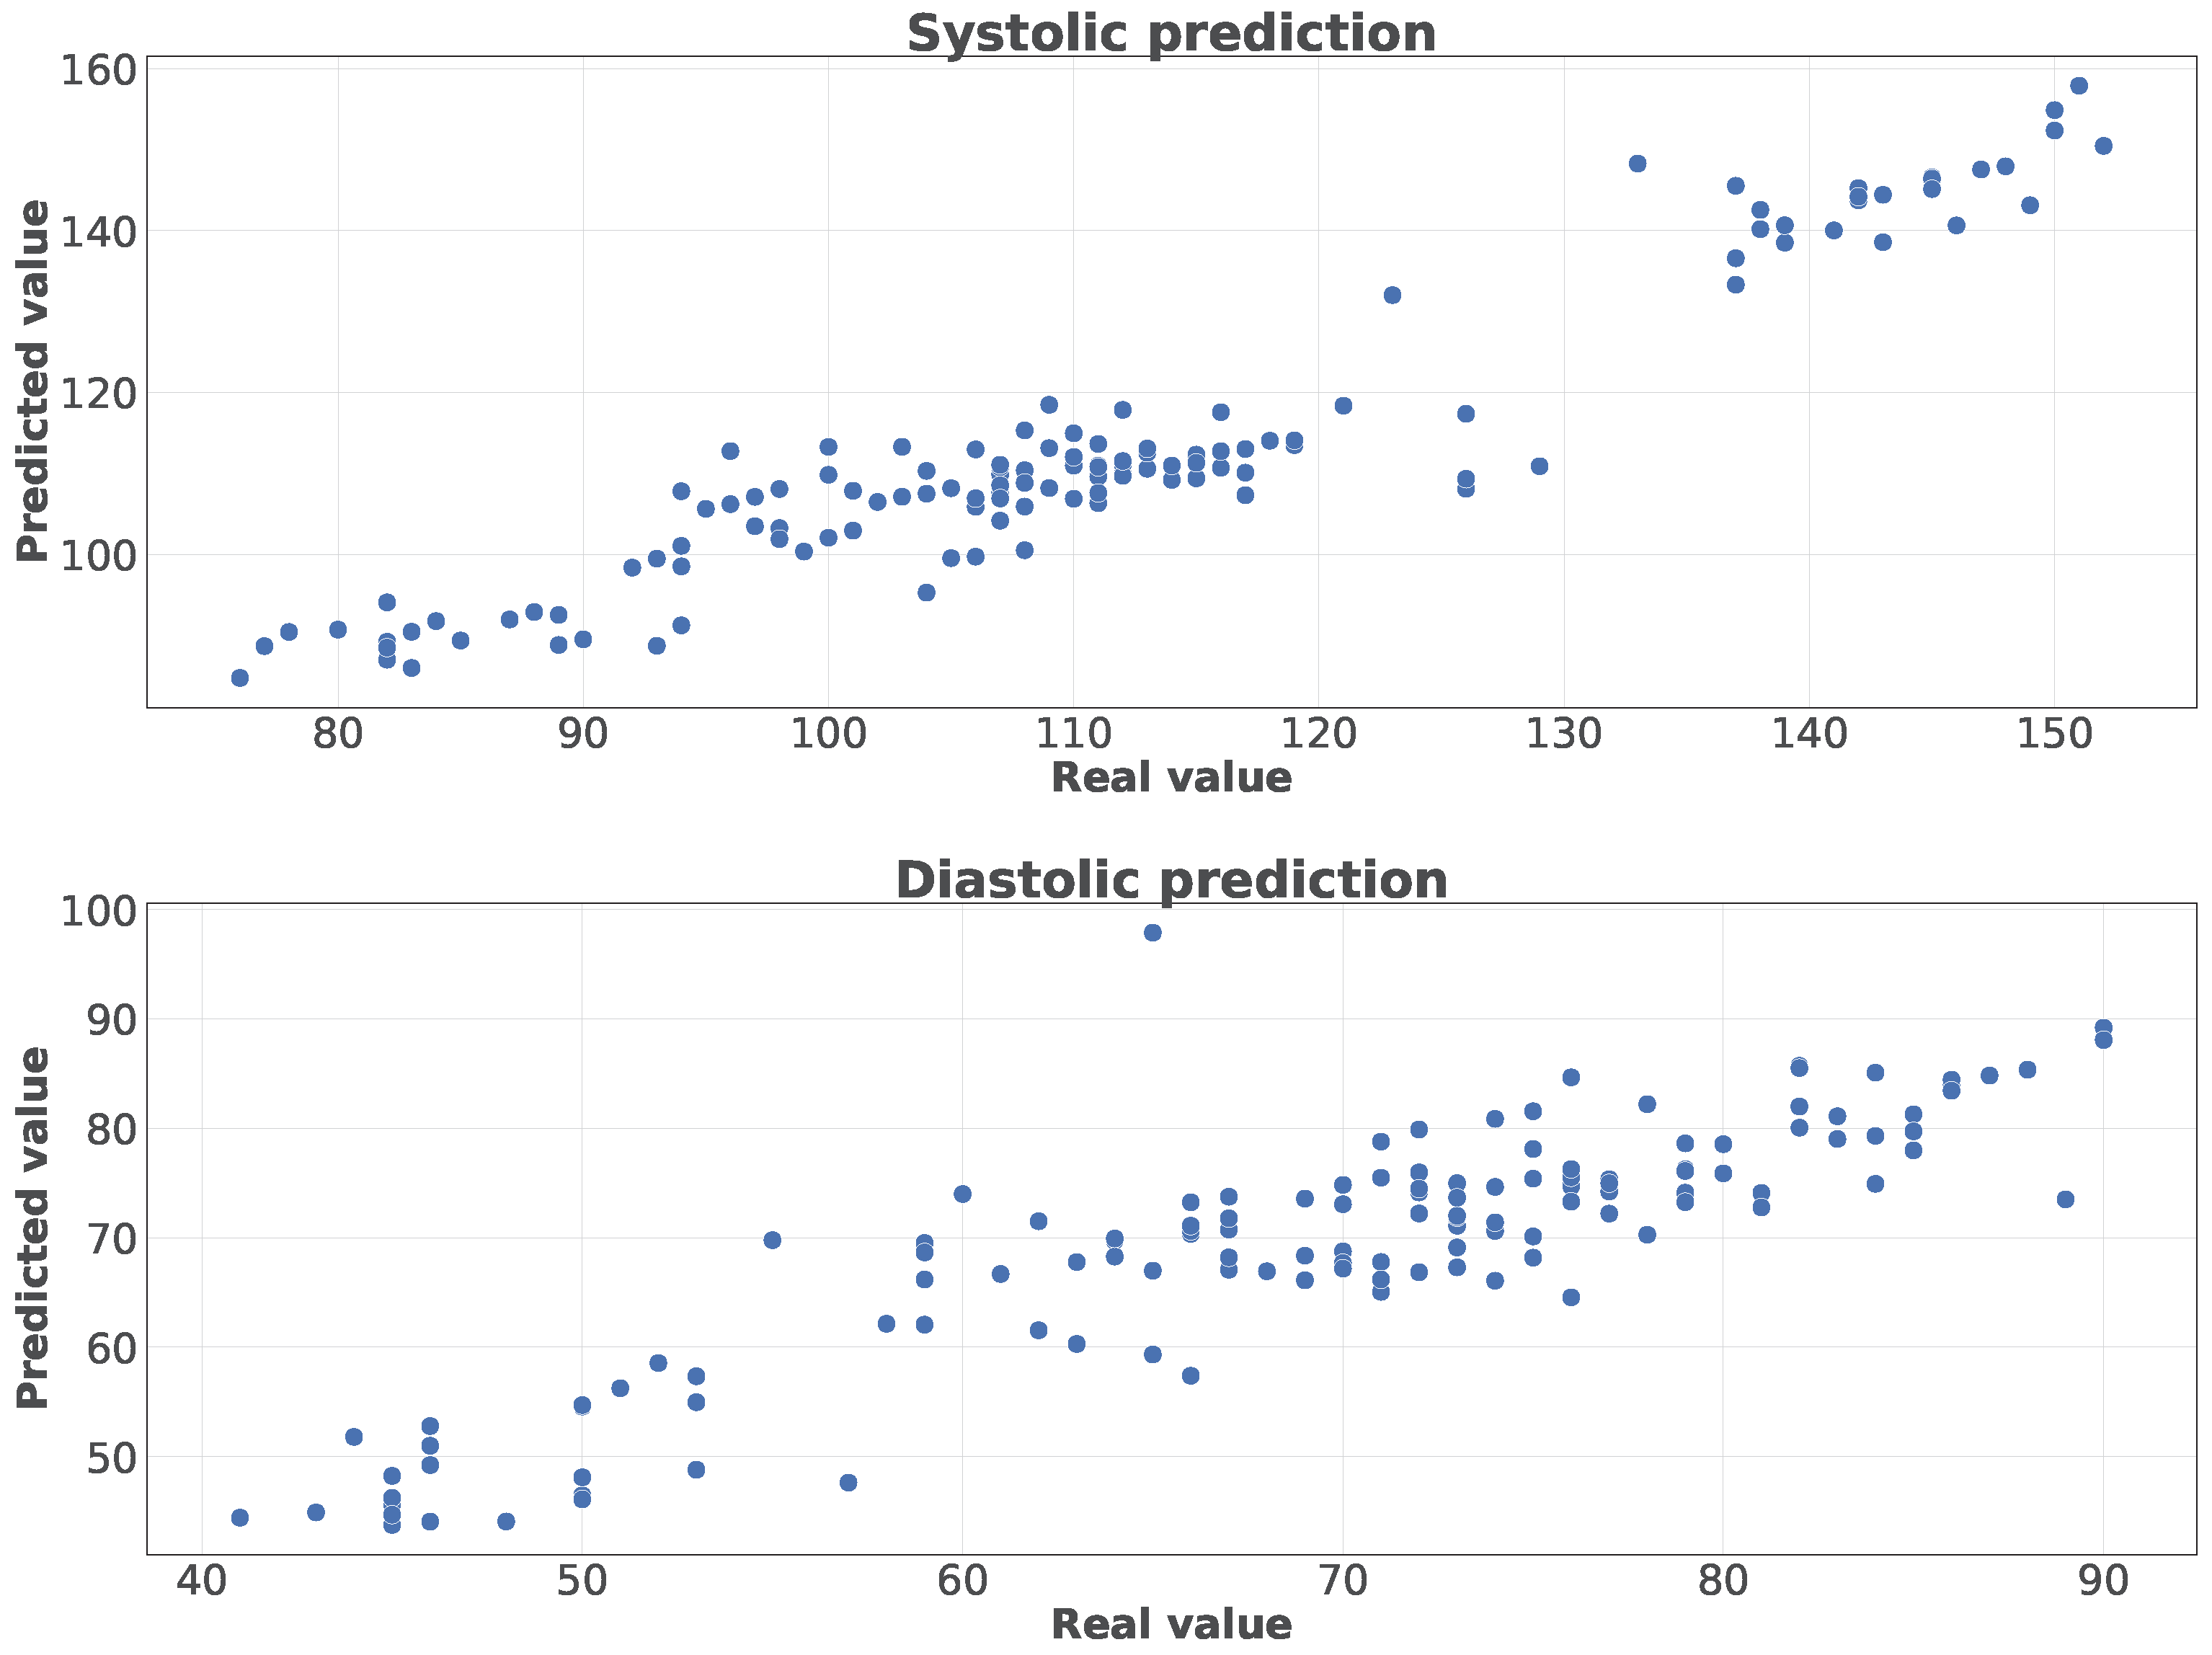
Figure 13 presents their evaluation using the R-squared correlation coefficient. We can observe that several algorithms have similar correlations, being Random Forest the algorithm having the best results. The correlation values presented in this figure are calculated based on the relationship between the real blood pressure values and those predicted by the algorithms. This relationship is represented in
Figure 14 for predictions using Random Forest over the general dataset and differentiating between systolic and diastolic values. We can observe that the trend of the dots is almost linear in the systolic predictions, while the diastolic predictions are a little sparser.
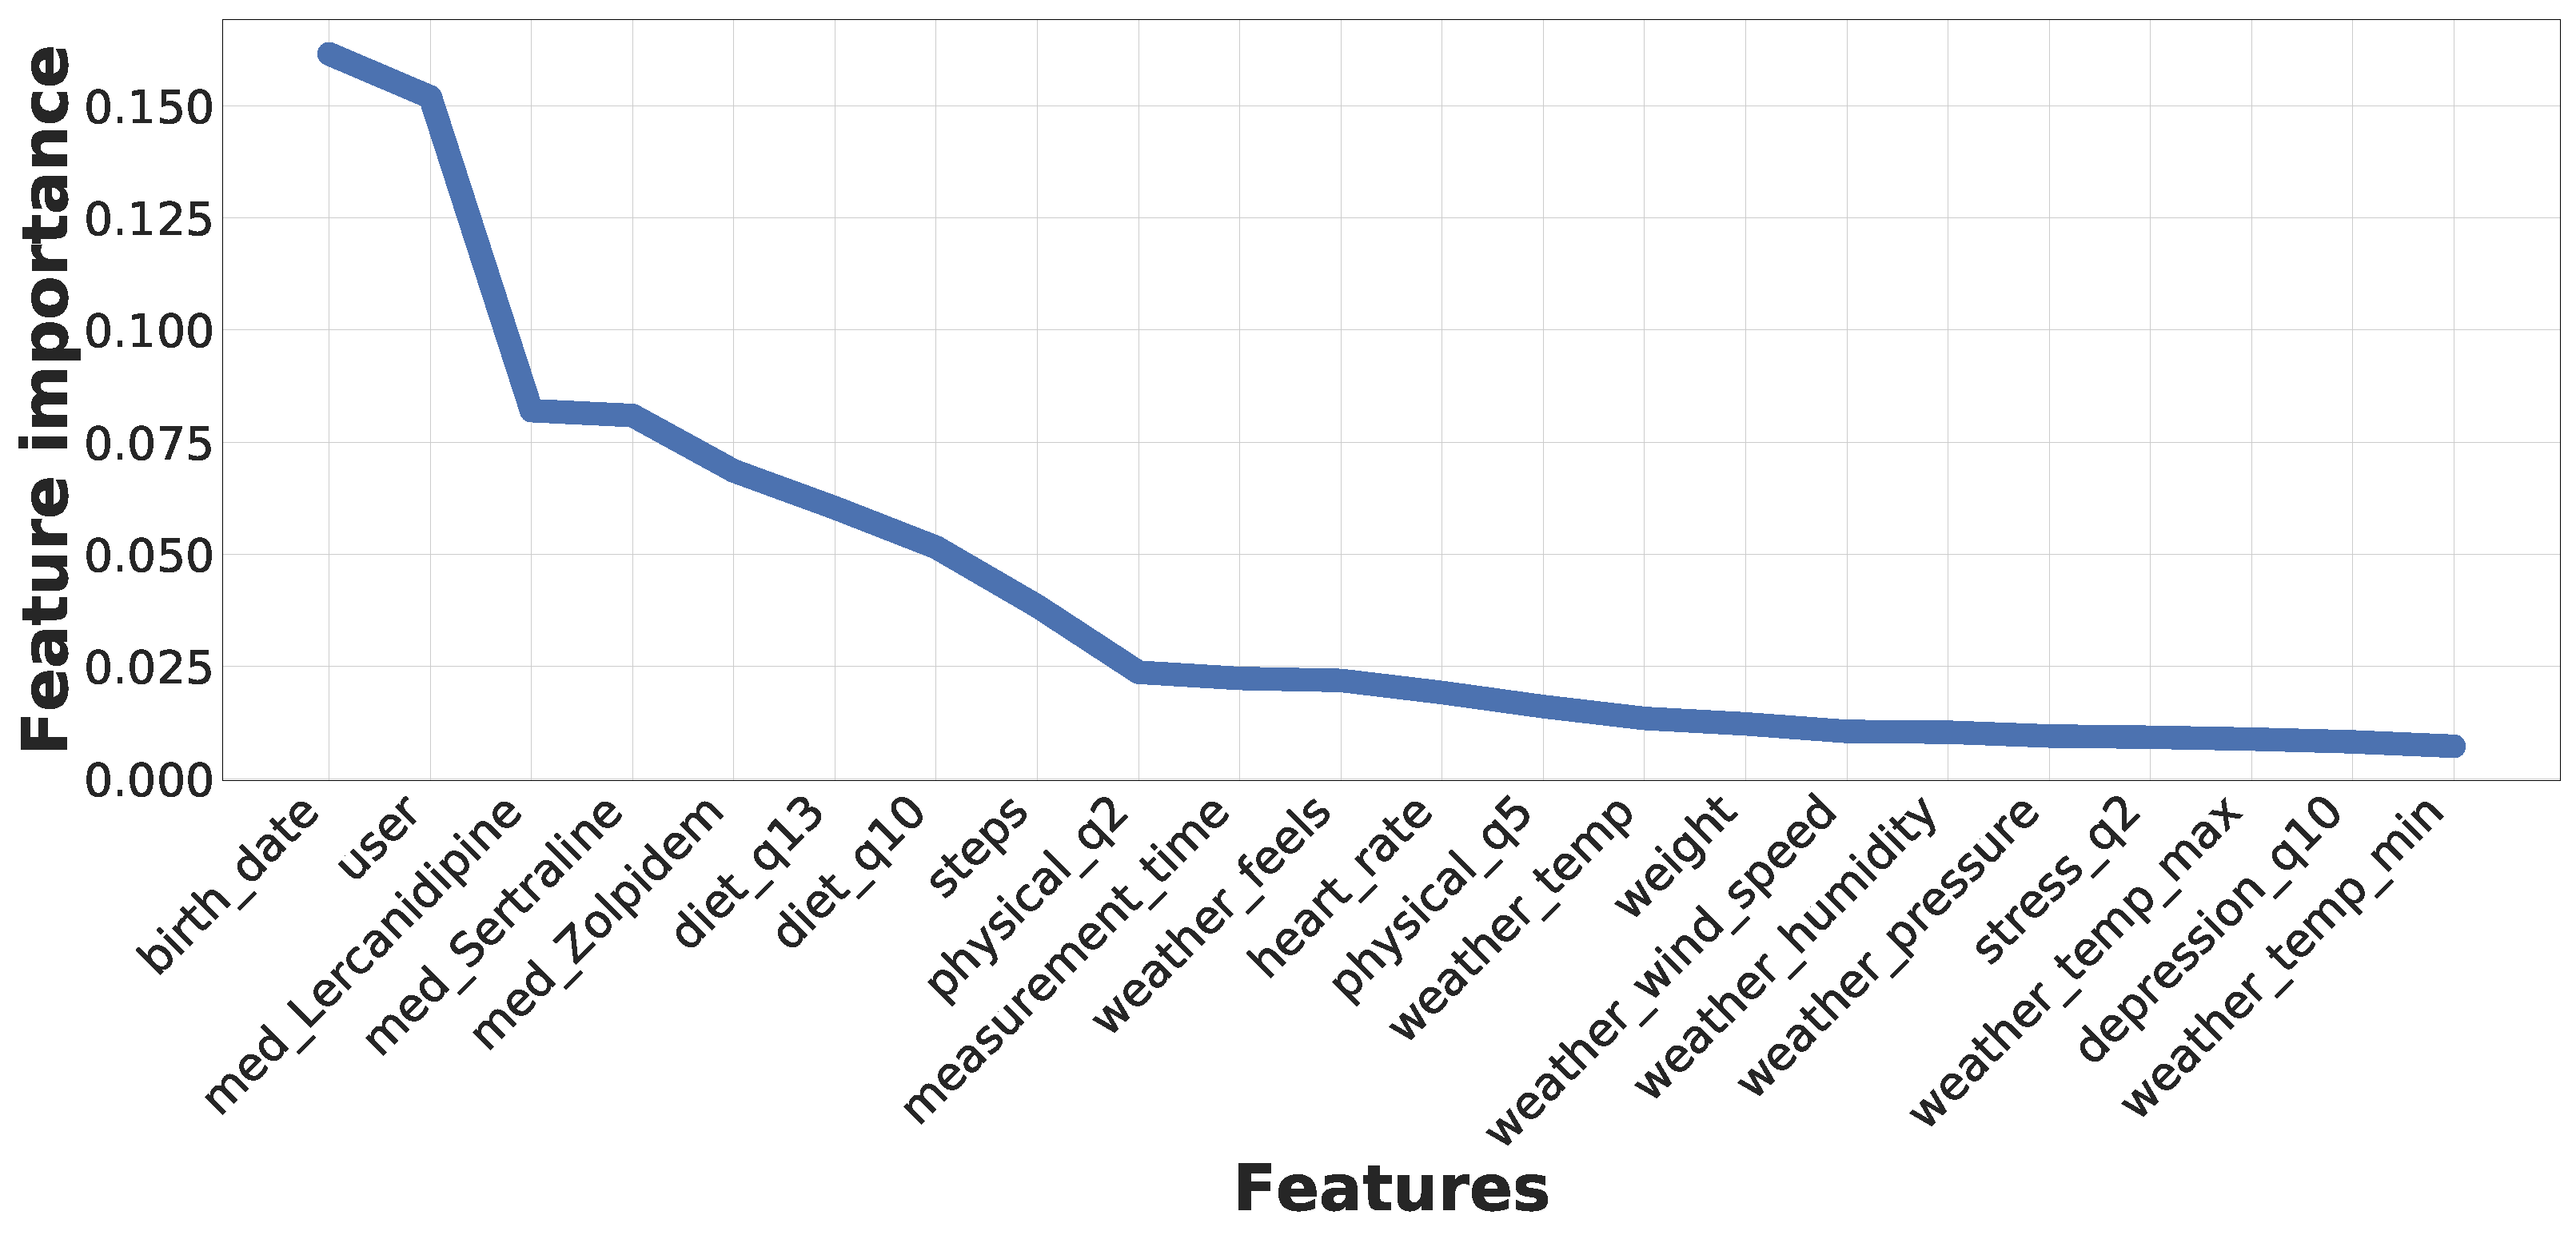
To better understand the relevance that individual features have over the predictive process,
Figure 15 presents the list of the most important features considered by the RF classifier, corresponding to the algorithm presenting better results for real-time predictions. This representation results from the evaluation of the general dataset containing data from all seven subjects. As can be seen, the training process has determined that the most relevant feature corresponds to the users’ age. In this regard, the risk of suffering high blood pressure increases when people get older. Additionally, the second most relevant feature is the user identifier, which is evident considering that we have a hypertensive patient between the subjects. Following these features, we can see three medicines, where Lercanidipine is an antihypertensive drug, Sertraline is an antidepressant, and Zolpidem is used to treat sleeping problems. Nevertheless, these medicines were consumed by the hypertensive subject, thus increasing the relevancy of these features.
Furthermore, this figure highlights two diet survey questions, which correspond to the type of meat (or the absence of meat consumption), and the number of fish and seafood consumed by the subject per week. It is relevant to note that a transition from red meat to white meat or fish has proven to reduce high blood pressure. Additionally, people following plant-based diets tend to have lower blood pressure. After these features, we can observe the importance of physical activity, where the number of daily steps, the duration of vigorous physical activity, and the number of days per week going out for a walk impact tension values. Moreover, the measurement instant during the day is also relevant since blood pressure increases during the day until the afternoon, decreasing in the evening and night. The heart rate is also related to blood pressure (a high heart rate presents a risk for hypertension), while people with an elevated weight have a higher risk of suffering hypertension. Finally, we can observe multiple features regarding the weather. Although these features do not have a high impact on the system, they are interesting to consider. Finally, pollution features have not substantially impacted this analysis since the users tended to remain in the same cities, not generating variability in the collected data. Nevertheless, these features may intervene in longer temporal acquisition windows and with the use of different users or algorithms.
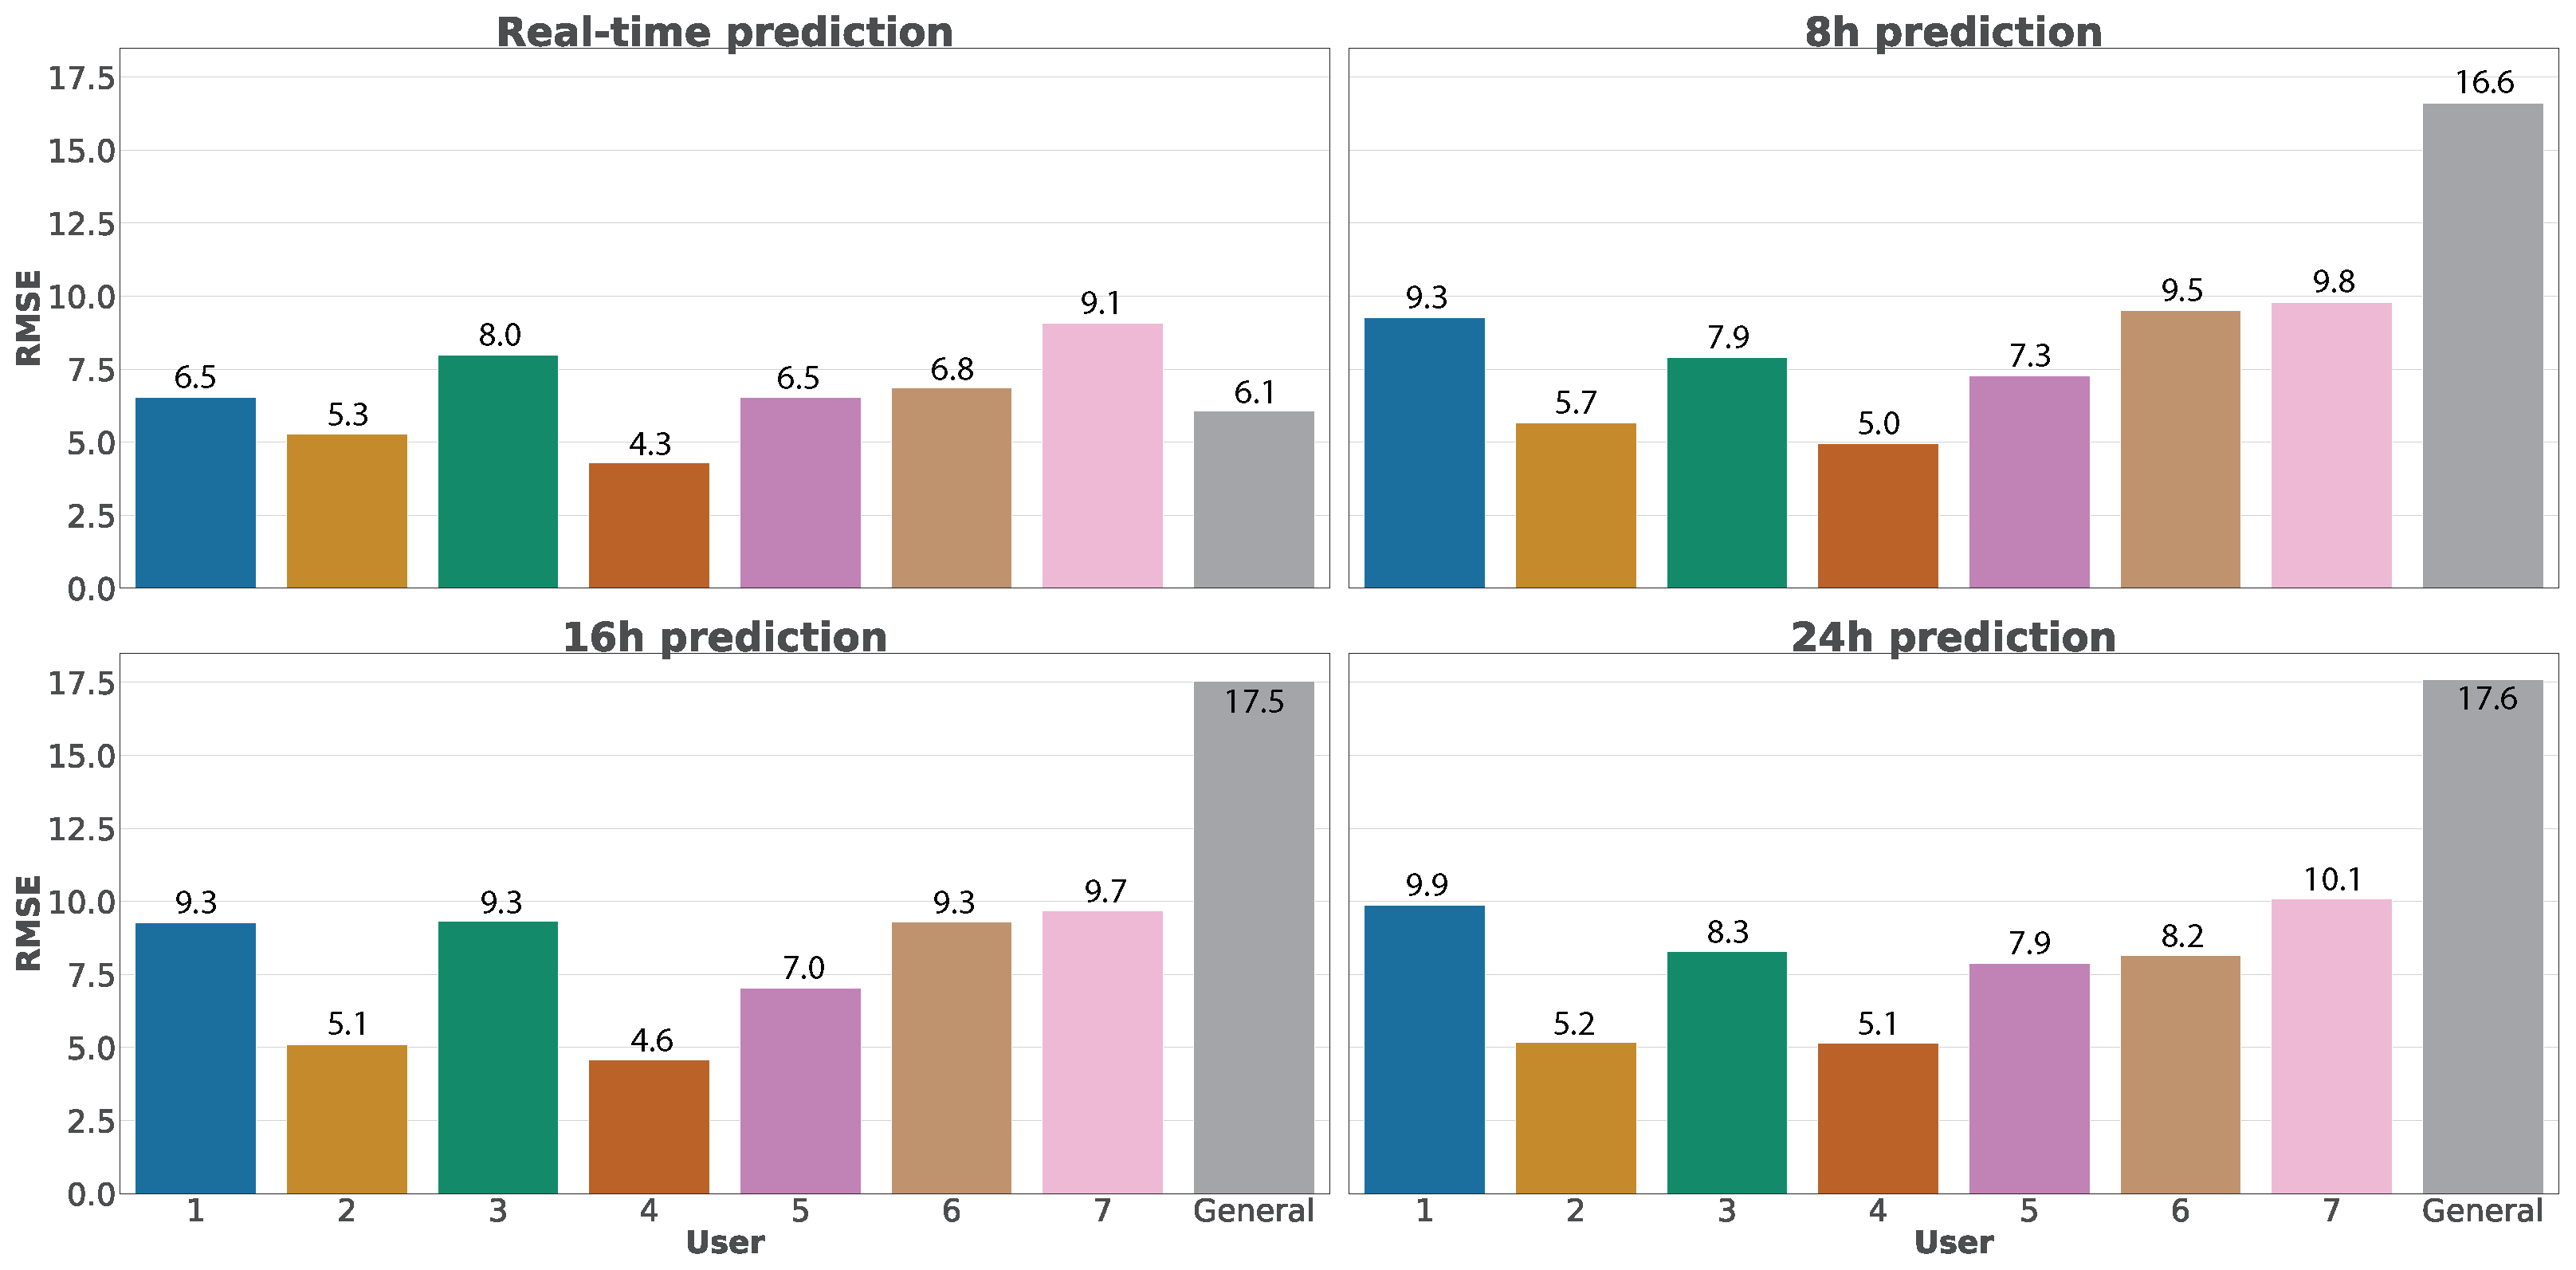
After introducing the results of real-time predictions, we compare in
Figure 16 the RMSE error between real-time and future predictions using Random Forest, considering future temporal windows of 8 h, 16 h, and 24 h. We have selected Random Forest for the comparison since it is the algorithm that offers the best results in real-time predictions. We can observe that the errors in the predictions generally increase when we use greater temporal windows, although the differences are acceptable. However, it highlights a considerable increase in the error when evaluating the general dataset. This situation is motivated by the great variability of data contained in this dataset, impacted by the uncertainty and future variations.
5. Conclusions
This work presents SENIOR, a web ecosystem able to perform predictions of blood pressure values and composed of three main elements, which represents the first contribution of this work. The first element of the ecosystem is a wearable that acquires physical data from the user, such as blood pressure or heart rate. A smartphone application represents the second element, automatically acquiring data from the wearable, asking the user to complete surveys with relevant health information. In addition to the user’s location, these data are sent to a web platform integrated into SENIOR, corresponding to the third element, which processes and stores them, acquiring environmental data from external services. These environmental data represent the second contribution of the manuscript, where we present novel features based on weather and pollution data. The last contribution is a proof of concept to evaluate SENIOR, where these data are used to generate machine learning models that can predict blood pressure values and, consequently, infer if a user will suffer a hypertensive crisis. These predictions can be performed in real-time or considering a future temporal window of 8, 16, or 24 h. Finally, this platform has been tested with seven users, presenting promising results aligned with the current literature.
Nevertheless, more work in the future is needed, requiring a higher volume of users and longer acquisition temporal periods to improve the intelligent models.For that, we aim to evaluate SENIOR in a larger trial once the risk of the COVID-19 pandemic reduces, having users from different countries with different cultures, allowing us to study scenarios with different weather and pollution. Moreover, it would be interesting to personalize the predictions, only returning results from the algorithms that have better results for each user. Additionally, we consider it relevant to make the smartphone application compatible with more wearables in the future, as well as improving the web service to accept a higher volume of users since Flask is just recommended for experimentation and not production services.
Author Contributions
Conceptualization, S.L.B. and J.M.V.; methodology, S.L.B.; software, J.M.V.; validation, S.L.B., J.M.V., and A.H.C.; formal analysis, J.M.V.; investigation, S.L.B. and J.M.V.; resources, A.H.C. and G.M.P.; data curation, J.M.V.; writing—original draft preparation, S.L.B.; writing—review and editing, J.M.V., A.H.C. and G.M.P.; visualization, S.L.B. and J.M.V.; supervision, A.H.C. and G.M.P.; project administration, G.M.P.; funding acquisition, A.H.C. and G.M.P. All authors have read and agreed to the published version of the manuscript.
Funding
This work has been partially supported by Armasuisse S+T with project CYD-C-2020003.
Institutional Review Board Statement
Not applicable.
Informed Consent Statement
Not applicable.
Data Availability Statement
Not applicable.
Acknowledgments
We are thankful for the help provided by Domingo A. Pascual-Figal and Carmen Sánchez from the Laboratory of Biosanitary Research (LAIB) in the identification of novel dimensions used to predict blood pressure values. Additionally, we thank the volunteer users of the SENIOR ecosystem: Ángel Luis Perales Gómez, Eduardo López Bernal, Manuel Gil Pérez, Mariví Bernal Fernández, Pedro Miguel Sánchez Sánchez, and Soledad Valverde Díaz.
Conflicts of Interest
The authors declare no conflict of interest. The funders had no role in the design of the study; in the collection, analyses, or interpretation of data; in the writing of the manuscript, or in the decision to publish the results.
References
- Forouzanfar, M.H.; Liu, P.; Roth, G.A.; Ng, M.; Biryukov, S.; Marczak, L.; Alexander, L.; Estep, K.; Hassen Abate, K.; Akinyemiju, T.F.; et al. Global Burden of Hypertension and Systolic Blood Pressure of at Least 110 to 115 mm Hg, 1990–2015. JAMA 2017, 317, 165–182. [Google Scholar] [CrossRef] [PubMed]
- Leal, J.; Luengo-Fernández, R.; Gray, A.; Petersen, S.; Rayner, M. Economic burden of cardiovascular diseases in the enlarged European Union. Eur. Heart J. 2006, 27, 1610–1619. [Google Scholar] [CrossRef] [PubMed]
- Whelton, P.K.; Carey, R.M.; Aronow, W.S.; Casey, D.E.; Collins, K.J.; Dennison Himmelfarb, C.; DePalma, S.M.; Gidding, S.; Jamerson, K.A.; Jones, D.W.; et al. 2017 ACC/AHA/AAPA/ABC/ACPM/AGS/APhA/ASH/ASPC/NMA/PCNA Guideline for the Prevention, Detection, Evaluation, and Management of High Blood Pressure in Adults: A Report of the American College of Cardiology/American Heart Association Task Force on Clinical Practice Guidelines. J. Am. Coll. Cardiol. 2018, 71, e127–e248. [Google Scholar] [CrossRef] [PubMed]
- Williams, B.; Mancia, G.; Spiering, W.; Agabiti Rosei, E.; Azizi, M.; Burnier, M.; Clement, D.L.; Coca, A.; de Simone, G.; Dominiczak, A.; et al. 2018 ESC/ESH Guidelines for the management of arterial hypertension: The Task Force for the management of arterial hypertension of the European Society of Cardiology (ESC) and the European Society of Hypertension (ESH). Eur. Heart J. 2018, 39, 3021–3104. [Google Scholar] [CrossRef] [PubMed]
- Mills, K.T.; Obst, K.M.; Shen, W.; Molina, S.; Zhang, H.J.; He, H.; Cooper, L.A.; He, J. Comparative Effectiveness of Implementation Strategies for Blood Pressure Control in Hypertensive Patients. Ann. Intern. Med. 2017, 168, 110. [Google Scholar] [CrossRef] [PubMed]
- Neutel, C.I.; Campbell, N.R. Changes in lifestyle after hypertension diagnosis in Canada. Can. J. Cardiol. 2008, 24, 199–204. [Google Scholar] [CrossRef]
- Zhou, R.; Cao, Y.; Zhao, R.; Zhou, Q.; Shen, J.; Zhou, Q.; Zhang, H. A novel cloud based auxiliary medical system for hypertension management. Appl. Comput. Inform. 2019, 15, 114–119. [Google Scholar] [CrossRef]
- Parati, G.; Torlasco, C.; Omboni, S.; Pellegrini, D. Smartphone Applications for Hypertension Management: A Potential Game-Changer That Needs More Control. Curr. Hypertens. Rep. 2017, 19, 48. [Google Scholar] [CrossRef] [PubMed]
- Thiboutot, J.; Stuckey, H.; Binette, A.; Kephart, D.; Curry, W.; Falkner, B.; Sciamanna, C. A web-based patient activation intervention to improve hypertension care: Study design and baseline characteristics in the web hypertension study. Contemp. Clin. Trials 2010, 31, 634–646. [Google Scholar] [CrossRef][Green Version]
- Omboni, S. Connected Health in Hypertension Management. Front. Cardiovasc. Med. 2019, 6, 76. [Google Scholar] [CrossRef] [PubMed]
- Thangada, N.D.; Garg, N.; Pandey, A.; Kumar, N. The Emerging Role of Mobile-Health Applications in the Management of Hypertension. Curr. Cardiol. Rep. 2018, 20, 78. [Google Scholar] [CrossRef] [PubMed]
- Lacson, R.C.; Baker, B.; Suresh, H.; Andriole, K.; Szolovits, P.; Lacson, E., Jr. Use of machine-learning algorithms to determine features of systolic blood pressure variability that predict poor outcomes in hypertensive patients. Clin. Kidney J. 2018, 12, 206–212. [Google Scholar] [CrossRef] [PubMed]
- Ye, C.; Fu, T.; Hao, S.; Zhang, Y.; Wang, O.; Jin, B.; Xia, M.; Liu, M.; Zhou, X.; Wu, Q.; et al. Prediction of Incident Hypertension Within the Next Year: Prospective Study Using Statewide Electronic Health Records and Machine Learning. J. Med. Internet Res. 2018, 20, e22. [Google Scholar] [CrossRef] [PubMed]
- Nimmala, S.; Ramadevi, Y.; Sahith, R.; Cheruku, R. High blood pressure prediction based on AAA++ using machine-learning algorithms. Cogent Eng. 2018, 5, 1497114. [Google Scholar] [CrossRef]
- LaFreniere, D.; Zulkernine, F.; Barber, D.; Martin, K. Using machine learning to predict hypertension from a clinical dataset. In Proceedings of the IEEE Symposium Series on Computational Intelligence (SSCI), Athens, Greece, 6–9 December 2016; pp. 1–7. [Google Scholar] [CrossRef]
- López-Martínez, F.; Schwarcz.MD, A.; Núñez-Valdez, E.R.; García-Díaz, V. Machine learning classification analysis for a hypertensive population as a function of several risk factors. Expert Syst. Appl. 2018, 110, 206–215. [Google Scholar] [CrossRef]
- Li, X.; Wu, S.; Wang, L. Blood Pressure Prediction via Recurrent Models with Contextual Layer. In Proceedings of the 26th International Conference on World Wide Web, Perth, Australia, 3–7 April 2017; pp. 685–693. [Google Scholar] [CrossRef]
- Chiang, P.; Dey, S. Personalized Effect of Health Behavior on Blood Pressure: Machine Learning Based Prediction and Recommendation. In Proceedings of the IEEE 20th International Conference on e-Health Networking, Applications and Services (Healthcom), Ostrava, Czech Republic, 17–20 September 2018; pp. 1–6. [Google Scholar] [CrossRef]
- Omron HeartGuide. Available online: https://omronhealthcare.com/products/heartguide-wearable-blood-pressure-monitor-bp8000m/ (accessed on 5 March 2021).
- Flask. Available online: https://palletsprojects.com/p/flask/ (accessed on 5 March 2021).
- Openweathermap. Available online: https://openweathermap.org/ (accessed on 5 March 2021).
- The World Air Quality Project. Available online: https://waqi.info (accessed on 5 March 2021).
- MongoDB. Available online: https://www.mongodb.com/ (accessed on 5 March 2021).
- Pymongo. Available online: https://pypi.org/project/pymongo/ (accessed on 5 March 2021).
- Pedregosa, F.; Varoquaux, G.; Gramfort, A.; Michel, V.; Thirion, B.; Grisel, O.; Blondel, M.; Prettenhofer, P.; Weiss, R.; Dubourg, V.; et al. Scikit-learn: Machine Learning in Python. J. Mach. Learn. Res. 2011, 12, 2825–2830. [Google Scholar]
Figure 1.
Main elements of the SENIOR web ecosystem.
Figure 1.
Main elements of the SENIOR web ecosystem.
Figure 2.
Complete architecture of SENIOR, including all communication flow between elements.
Figure 2.
Complete architecture of SENIOR, including all communication flow between elements.
Figure 3.
Data dimensions acquired by the smartphone application.
Figure 3.
Data dimensions acquired by the smartphone application.
Figure 4.
Architecture of the smartphone application designed.
Figure 4.
Architecture of the smartphone application designed.
Figure 5.
Views representing the access to the application, including register and login operations.
Figure 5.
Views representing the access to the application, including register and login operations.
Figure 6.
Examples of the user interface related to surveys.
Figure 6.
Examples of the user interface related to surveys.
Figure 7.
Elements integrating the implemented web platform.
Figure 7.
Elements integrating the implemented web platform.
Figure 8.
Data obtained from each external service.
Figure 8.
Data obtained from each external service.
Figure 9.
Structure of the database system implemented in the proposed web ecosystem.
Figure 9.
Structure of the database system implemented in the proposed web ecosystem.
Figure 10.
Distribution of vectors per user in the general dataset.
Figure 10.
Distribution of vectors per user in the general dataset.
Figure 11.
Histograms indicating the Root Mean Square Error (RMSE) of each trained model for the real-time approach. Lighter colors represent the diastolic blood pressure while darker bars indicate systolic values.
Figure 11.
Histograms indicating the Root Mean Square Error (RMSE) of each trained model for the real-time approach. Lighter colors represent the diastolic blood pressure while darker bars indicate systolic values.
Figure 12.
Heatmap indicating the RMSE error for each trained model.
Figure 12.
Heatmap indicating the RMSE error for each trained model.
Figure 13.
R-squared correlation coefficient for real-time predictions.
Figure 13.
R-squared correlation coefficient for real-time predictions.
Figure 14.
Comparison between real and predicted values for systolic and diastolic predictions using Random Forest over the general dataset.
Figure 14.
Comparison between real and predicted values for systolic and diastolic predictions using Random Forest over the general dataset.
Figure 15.
Feature importance after the application of Random Forest over the general dataset.
Figure 15.
Feature importance after the application of Random Forest over the general dataset.
Figure 16.
Comparison between real-time and future predictions using Random Forest.
Figure 16.
Comparison between real-time and future predictions using Random Forest.
Table 1.
List of features considered in the publications analyzed in the literature. A green tick (✓) indicates that a publication has considered a particular feature, while a red mark (✗) highlights that the work did not consider it.
Table 1.
List of features considered in the publications analyzed in the literature. A green tick (✓) indicates that a publication has considered a particular feature, while a red mark (✗) highlights that the work did not consider it.
| | Lacson
et al. [12] | Ye et al.
[13] | Nimmala
et al. [14] | LaFreniere
et al. [15] | López-Martínez
et al. [16] | Li et al.
[17] | Chiang
et al. [18] | This Work |
|---|
Blood
pressure | ✓ | ✓ | ✓ | ✓ | ✓ | ✓ | ✓ | ✓ |
| Age | ✓ | ✓ | ✓ | ✓ | ✓ | ✓ | ✗ | ✓ |
| Gender | ✓ | ✓ | ✗ | ✗ | ✓ | ✓ | ✗ | ✓ |
| BMI/Weight | ✓ | ✗ | ✗ | ✓ | ✓ | ✓ | ✗ | ✓ |
Measurement
instant | ✗ | ✗ | ✗ | ✗ | ✗ | ✓ | ✗ | ✓ |
| Smoke | ✓ | ✗ | ✗ | ✓ | ✓ | ✗ | ✗ | ✓ |
| Alcohol | ✗ | ✗ | ✗ | ✗ | ✗ | ✗ | ✗ | ✓ |
| Heart rate | ✓ | ✗ | ✗ | ✓ | ✗ | ✓ | ✓ | ✓ |
| Location | ✗ | ✗ | ✗ | ✗ | ✗ | ✓ | ✗ | ✓ |
Laboratory
analysis | ✓ | ✓ | ✗ | ✓ | ✗ | ✗ | ✗ | ✗ |
| Medication | ✓ | ✓ | ✗ | ✗ | ✗ | ✓ | ✗ | ✓ |
Health
record | ✓ | ✓ | ✗ | ✗ | ✓ | ✗ | ✗ | Partially |
| Height | ✗ | ✗ | ✗ | ✗ | ✗ | ✗ | ✗ | ✓ |
Physical
activity | ✗ | ✗ | ✗ | ✓ | ✗ | ✗ | ✓ | ✓ |
| Diet | ✗ | ✗ | ✗ | ✗ | ✗ | ✗ | ✗ | ✓ |
| Social support | ✗ | ✗ | ✗ | ✗ | ✗ | ✗ | ✗ | ✓ |
| Anxiety/Stress | ✗ | ✗ | ✓ | ✗ | ✗ | ✗ | ✗ | ✓ |
| Depression | ✗ | ✗ | ✗ | ✗ | ✗ | ✗ | ✗ | ✓ |
| Weather | ✗ | ✗ | ✗ | ✗ | ✗ | ✗ | ✗ | ✓ |
| Pollution | ✗ | ✗ | ✗ | ✗ | ✗ | ✗ | ✗ | ✓ |
| Use of ML/DL | ✓ | ✓ | ✓ | ✓ | ✓ | ✓ | ✓ | ✓ |
Table 2.
List of features considered by SENIOR grouped by category.
Table 2.
List of features considered by SENIOR grouped by category.
| Category | Type | Feature | Category | Type | Feature |
|---|
| 1. Medication |
| med_Acenocoumarol
med_Acetylsalicylic_acid
med_Adenosine
med_Alprazolam
med_Amiodarone
med_Atenolol
med_Cetirizine
med_Clorazepate
med_Dexketoprofen
med_Diazepam
med_Diphenhydramine
med_Digoxin
med_Dimenhydrinate
med_Doxylamine
med_Fentanyl
med_Glucagon
med_Hydrochlorothiazide
med_Hydroxyzine
med_Ibuprofen
med_Insulin
med_Labetalol
med_Lercanidipine
med_Lidocaine
med_Lorazepam
med_Lormetazepam
med_Metamizole
med_Midazolam
med_Morphine
med_Naproxen
med_Nifedipine
med_Nitroglycerin
med_Paracetamol
med_Propranolol
med_Sertraline
med_Magnesium_sulfate
med_Tramadol
med_Verapamil
med_Zolpidem | 5. Alcohol |
| alcohol_beer
alcohol_destiled_mix
alcohol_other
alcohol_other_fermented
alcohol_wine
alcohol_wine_mix |
6. Stress
survey |
| stress_q1
stress_q2
stress_q3
stress_q4
stress_q5
stress_q6
stress_q7
stress_q8
stress_q9
stress_q10
stress_q11
stress_q12
stress_q13
stress_q14 |
| 7. Smoke |
| smoke_cigarettes
smoke_electronic
smoke_other |
8. Personal
data |
| birth_country
birth_date
education_level
gender
home_country |
9. Physical
dimension |
| diastolic
systolic
heart_rate
height
measurement_time
steps
weight |
10. Physical
activity
survey |
| physical_q1
physical_q2
physical_q3
physical_q4
physical_q5
physical_q6
physical_q7 |
2. Depression
survey |
| depression_q1
depression_q2
depression_q3
depression_q4
depression_q5
depression_q6
depression_q7
depression_q8
depression_q9
depression_q10 | 11. Diet
survey |
| diet_q1
diet_q2
diet_q3
diet_q4
diet_q5
diet_q6
diet_q7
diet_q8
diet_q9
diet_q10
diet_q11
diet_q12
diet_q13
diet_q14 |
3. Social
support |
| social_q1
social_q2
social_q3
social_q4
social_q5
social_q6
social_q7 | 12. Weather |
| weather_clouds
weather_feels
weather_humidity
weather_pressure
weather_temp
weather_temp_max
weather_temp_min
weather_wind_speed |
| 4. Pollution |
| pollution_co
pollution_no2
pollution_o3
pollution_pm10
pollution_so2 | | | |
Table 3.
List of the optimal values for the automatically selected parameters for each implemented machine learning (ML) algorithm.
Table 3.
List of the optimal values for the automatically selected parameters for each implemented machine learning (ML) algorithm.
| Model | Parameter | Value | Description |
|---|
| Random Forest | max_features | 72 | Number of features considered |
| | min_samples_split | No limit | Minimum number of samples to split a node |
| | max_depth | No limit | Max depth in the tree |
| | n_estimators | 189 | Number of trees in the forest |
| Decision Tree | max_features | 46 | Number of features considered |
| | min_samples_split | 54 | Minimum number of samples to split a node |
| | max_depth | 25 | Maximum depth of the tree |
| | splitter | 189 | Strategy used to split a node |
| Support Vector Regression | Kernel | Lineal | Type of kernel used by the algorithm |
| | C | 1 | Regularization parameter |
| | gamma | 2027 | Coefficient of the kernel |
| Bayesian Ridge | n_iter | 152 | Maximum number of iterations |
| Linear regression | n_jobs | 122 | Number of jobs used for the computation |
| Polynomial regression | grade | 4 | Grade of the polynomial |
| Publisher’s Note: MDPI stays neutral with regard to jurisdictional claims in published maps and institutional affiliations. |
© 2021 by the authors. Licensee MDPI, Basel, Switzerland. This article is an open access article distributed under the terms and conditions of the Creative Commons Attribution (CC BY) license (http://creativecommons.org/licenses/by/4.0/).
