1. Introduction
State-of-the-art aerial vehicles such as personal air vehicles, flying cars, drones, and micro/nano air vehicles do have their unique shapes creating a fully three-dimensional flow. The exceptional maneuverability required for the vehicles, e.g., vertical takeoff/landing, stable hovering, and smooth transition to forward flight, also provokes separated flows with a complicated interaction in shed vortices at low Reynolds number. These severely affect the aerodynamic performance overall; a thorough investigation of the separated flows is a crucial step for the appropriate development.
A separated flow has often been studied using low-aspect-ratio (LAR) wings at high angles of attack where interaction in shed vortices is pretty intense, thus, conventional aerodynamic descriptions are hard to cover. Torres and Mueller [
1], for example, measured the aerodynamic lift and drag of various LAR wings and showed that a classical description—Prandtl’s lifting line theory—is not appropriate for the LAR wings due to nonlinear characteristics in the aerodynamic coefficients. They rather presented that the leading-edge suction analogy, which had been originally developed for a vortex lift force caused by a leading-edge vortex (LEV) attachment on delta wings [
2], provides better estimations than the lifting line theory. This was in line with the study of Shields and Mohseni [
3], which revealed the drastic decrement in drag coefficient as a result of tip vortex (TiV) detachment. Ananda et al. [
4] also investigated the aerodynamic characteristics of LAR wings, and obtained Oswald’s efficiency factors, approximately 0.39, 0.34, and 0.22 for the aspect ratios (ARs) of 2, 3, and 6, which are much lower than that of a typical higher AR.
Recent studies focused more on the underlying physics of the flow such as the formation, behavior, and interaction of the shed wakes and vortices. Taira and Colonius [
5] analyzed aerodynamic characteristics of impulsively translated flat plates at low Reynolds number via direct numerical simulations (DNS). They found periodic/aperiodic sheddings depending on an AR, angle of attack, and Reynolds number, which were mainly due to a strong engagement of TiVs into the midspan region. DeVoria and Mohseni [
6] investigated much lower aspect ratio (AR) plates including one and below. They revealed that a massive downwash induced by the TiVs of the LAR wings is the key to augmenting the lift production at a high angle of attack; the downwash depressed the vortex shedding at the trailing edge, thereby sustaining the Kutta condition at the midspan, where a periodic vortex shedding such as a Karman vortex street emerges at a typical higher AR. Zhang et al. [
7] analyzed the formation of vortices over the wings of ARs of 1 to 6. They found that the effect of TiVs, which evokes a strong downwash and additional lift, can be extended to the midspan where an LEV exists at a low AR, resulting in full three-dimensionality of the shed vortices. This suggests that an LEV would be one solution for separated flows of the state-of-the-art aerial vehicles.
In terms of flapping-wing aerodynamics, an LEV has been seriously investigated as biological flyers employ an LEV to stabilize a flow around the wing, thereby boosting a lift force [
8]. Comprehensive studies such as establishing appropriate Navier–Stokes equations, extracting dimensionless numbers [
9,
10], and several parametric studies on the dimensionless numbers (refer to Bhat et al. [
11] for an aspect ratio; Harbig et al. [
12] and Han et al. [
13] for an advance ratio; Jardin [
14] for dimensionless numbers), have successfully revealed the stabilization mechanism of the LEV–the spanwise flow running to the wingtip in the core of the LEV, which is driven by the radial pressure gradient along the span with appropriate centripetal and Coriolis forces, stabilizes the LEV. Here, the AR of the wings of biological flyers has been seriously dealt with as it governs the Coriolis force and consequent stabilization mechanism of the LEV. Kruyt et al. [
15] examined revolving wings for various ARs from 2 to 10 and observed that an LEV remained stable only up to the spanwise location of four times the chord length, i.e., at r/c < 4. Han et al. [
16] examined several AR wings and reported a similar LEV behavior to that of Kruyt et al. [
15]. They further reported that AR ≈ 3 showed an optimal aerodynamic performance, i.e., the maximum aerodynamic lift and reasonable efficiency. Recent studies have considered the AR and the Rossby number concurrently [
17,
18]. These also showed that AR between 3.0 and 4.0 is most favorable for the lift enhancement, at least for flapping-wing flyers adept at hovering (wingroot-based revolving/flapping motion). Jardin and Colonius [
18] further showed that the transition from an inboard quasi-steady region (where the robust LEV attachment exists) to an unsteady wake region appears around r/c ≈ 3 at AR > 4.
We noticed that a sweptback angle is also able to directly supply a spanwise flow on a suction side of LAR wings. This indicates that an LEV, interaction with TiVs and consequent aerodynamic characteristics will be affected by a sweptback angle. A jet-like LEV core flow and relevant aerodynamic performance depending on a sweptback angle of a delta-wing aircraft [
19], which seems identical to an LEV on a revolving/flapping wing, support our inference. A shifted-back stroke plane of biological flyers in forward flight, which is identical to a sweptback angle, might also be related to an LEV [
20,
21,
22]. The effect of a sweptback angle of LAR wings, however, has not yet been sufficiently investigated.
In this study, direct measurements of the aerodynamic forces and moments on LAR flat plates at a Reynolds number of 2.85 × 10
4 were conducted. Three ARs of 2.03, 3.13, and 4.50, which cover the critical AR for the LEV of a revolving/flapping wing [
15,
16,
17,
18], were selected, and a sweptback angle was used to supply a spanwise flow. We found a resemblance in aerodynamic characteristics to that of a revolving/flapping wing, which is presumably due to an analogous behavior of the two LEVs. This suggests the applicability of an LEV of biological flyers for state-of-the-art aerial vehicle design.
2. Materials and Methods
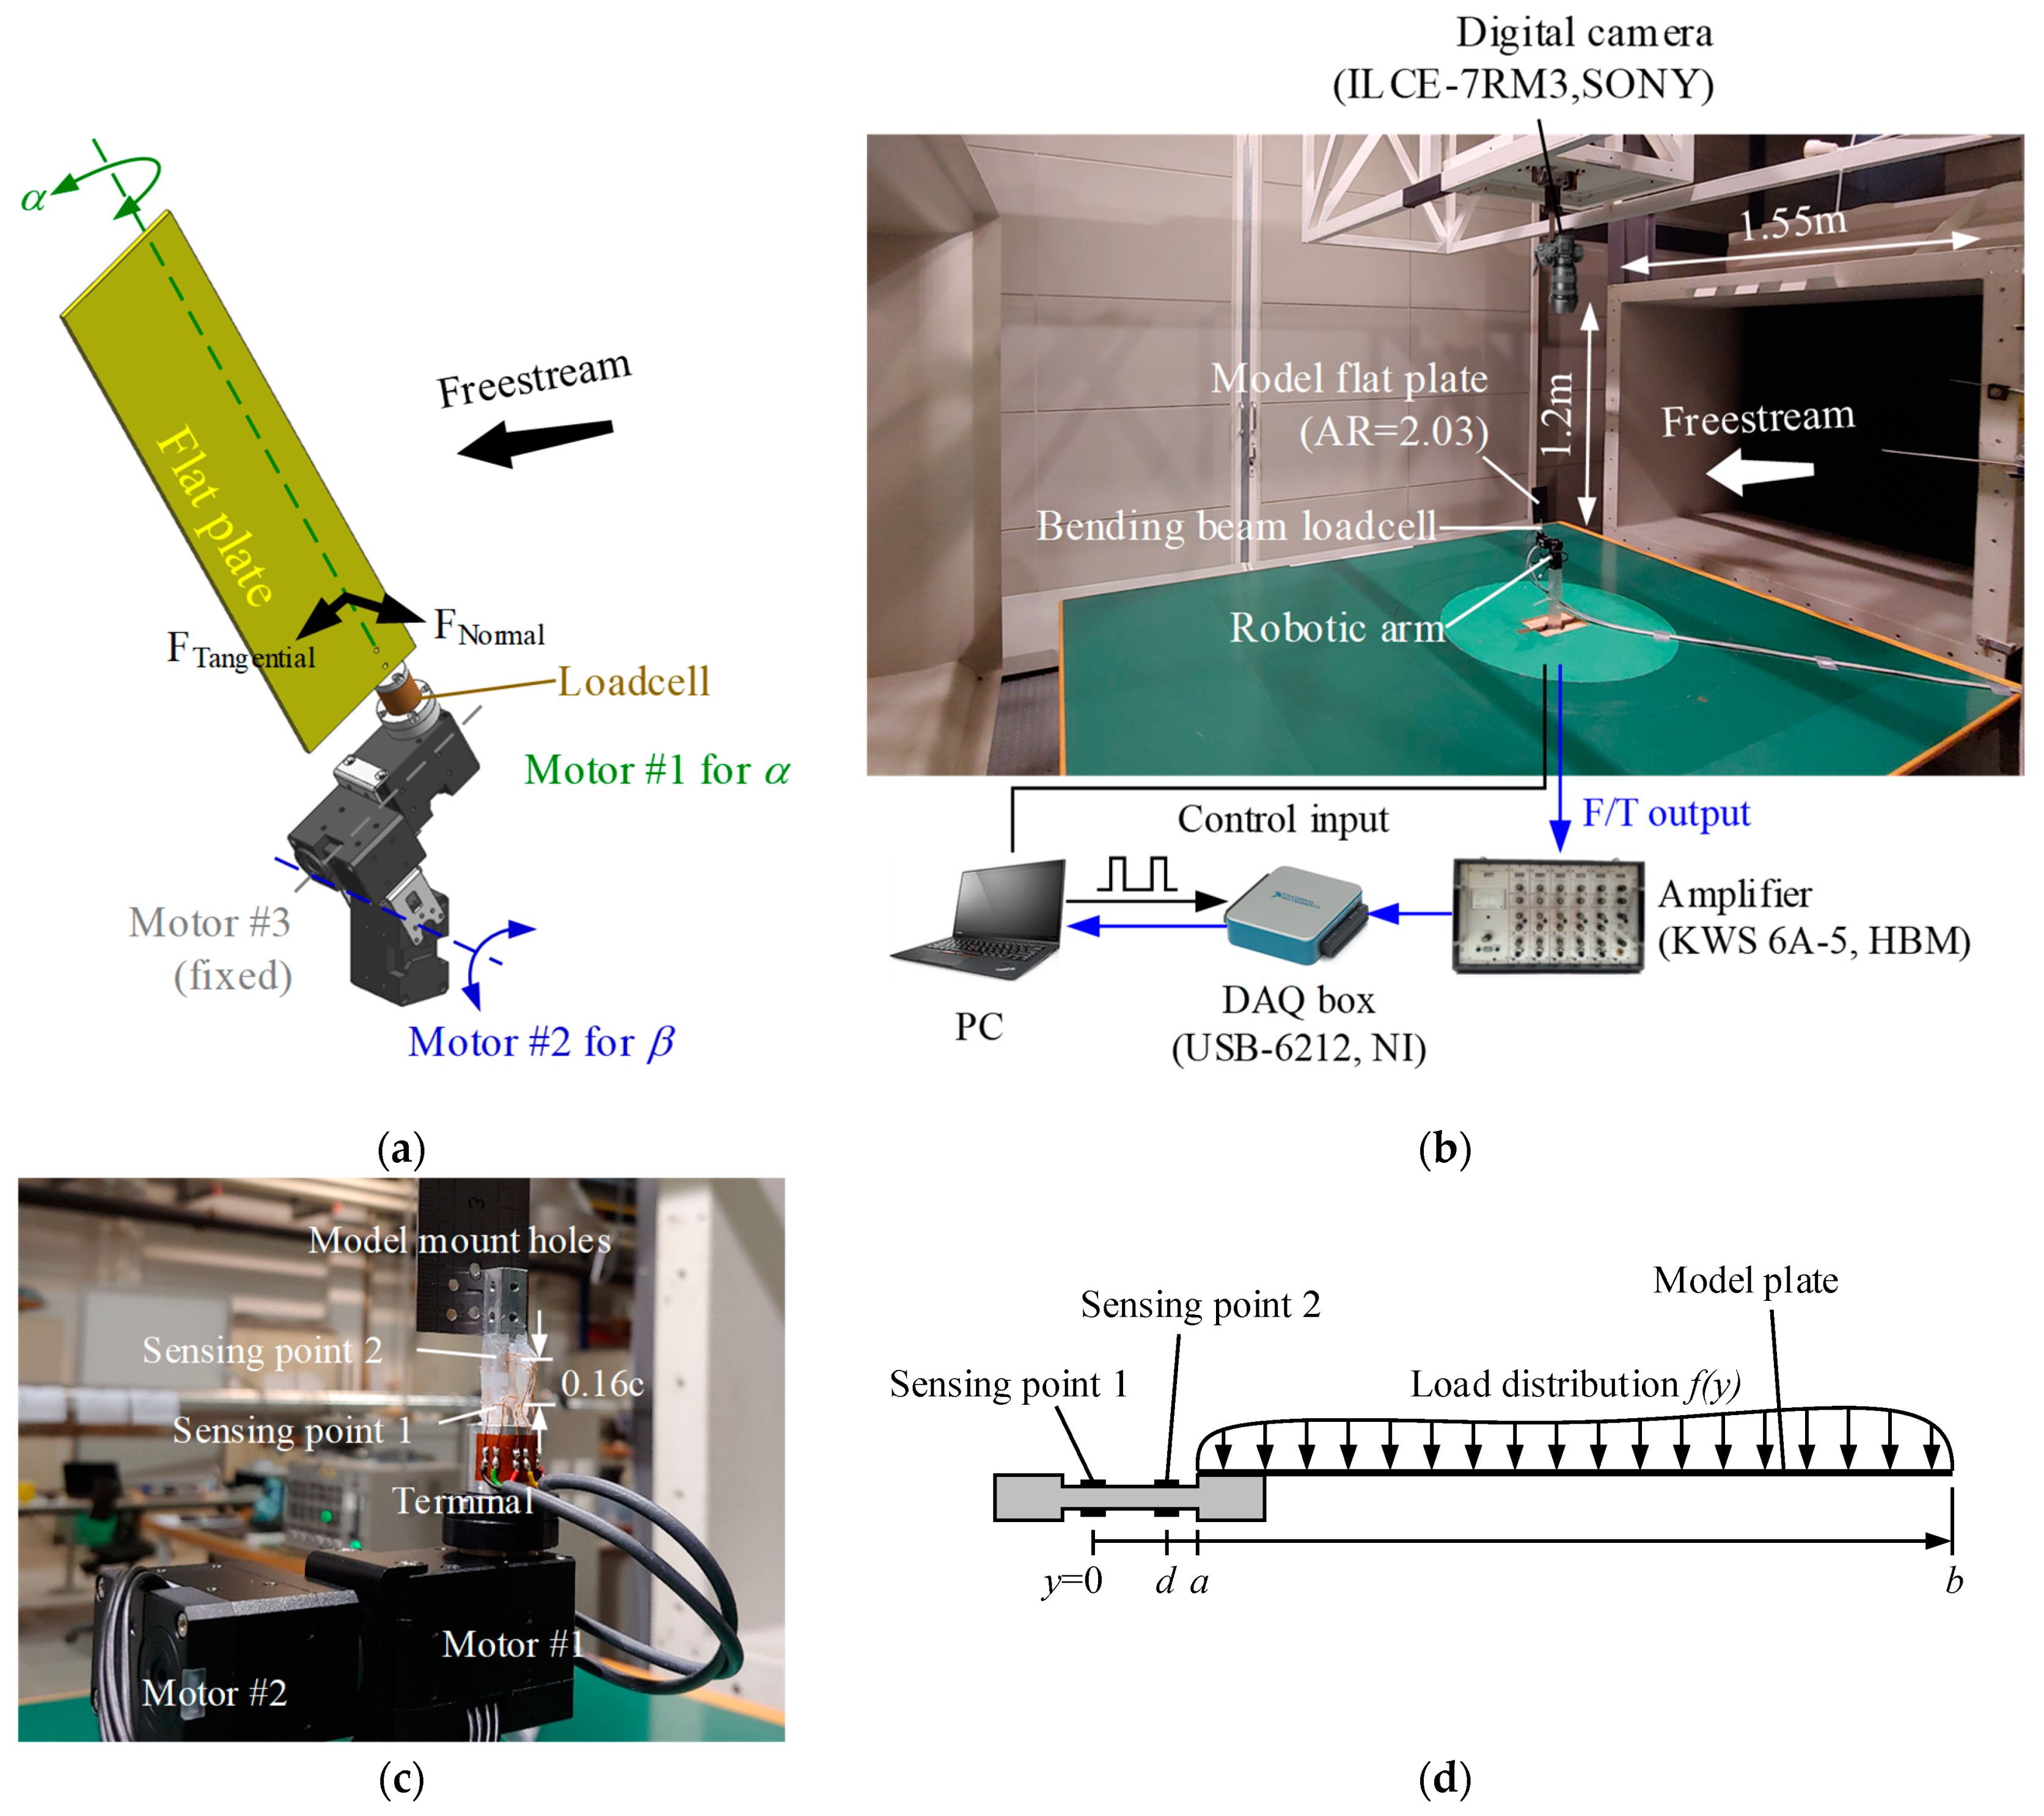
A robotic arm can precisely adjust the sweptback angle
β as well as the angle of attack
α of the model flat plates (
Figure 1a). Three servo motors (XH430, Robotis
®) were mounted on the arm, and each encoder inside the motors provides an angular position with a resolution of 0.088 deg/step. The motors are in charge of the
α,
β, and a sweeping angle (fixed in this study), respectively, and we used two motors, Motor 1 and Motor 2, to adjust the two angles. This robotic arm was connected to a laptop computer, and was controlled by an in-house code written in LabVIEW™ via RS485 protocol. The baud rate was 2 Mbps, which was sufficient for high-speed motor control.
The three model flat plates in this study were made of a 1 mm-thickness carbon fiber sheet. The spanwise lengths of the plates are 130, 200, and 288 mm, while the chord length is fixed as 64 mm. Corresponding ARs are, therefore, 2.03, 3.13, and 4.50, respectively. In order to check the possible deformation during the test, we applied a classical beam theory with a drag coefficient of 1.2, which is known as the value at α = 90 deg. It was estimated as 0.144 mm at the aspect ratio of 4.50, which corresponds to 0.22% of the chord length.
Figure 1b shows the open test section of the wind tunnel B at the Technical University of Munich. The rectangular nozzle has a size of 1.20 × 1.55 m. The turbulent intensity of the test section freestream is less than 0.4% in all directions, and the angle divergence of the freestream is below 0.5 deg. The maximum blockage of the model plate (at AR = 4.5,
α = 90 deg, and
β = 0 deg) is less than 1.0%.
The atmospheric pressure was 95.4 ± 0.35 kPa and the temperature was maintained within 19.7 ± 0.9 °C during the test; the ranges of the density and kinematic viscosity were then 1.135 ± 0.01 kg/m3 and 1.53 ± 0.9 × 10⁻⁵ m2/s, respectively. The dynamic pressure was settled in the range of 26.4 ± 0.4 Pa, the freestream velocity was yielded as 6.82 ± 0.07 m/s; stall flutter appeared at AR = 4.50 beyond this speed. The corresponding Reynolds number based on the chord length is Re ≈ 2.85 × 10⁴.
One issue in this study was that most commercial force/moment sensors are not adoptable to such a low Reynolds number due to an excessively low aerodynamic load (e.g., the maximum aerodynamic load on the AR = 2.03 plate only reaches ~0.2 N). In order to tackle this issue, we fabricated a customized gram-scale force/moment bending-beam loadcell (
Figure 1c). This loadcell was composed of two pairs of tandem straingauges (1-LY93-3/350E, HBM), and gives us two bending moments at two different positions where the two pairs of straingauges were attached. We then computed the normal force using the two bending moments and the distance between the two.
Figure 1d explains the relation between the two moments and the normal force (refer to [
23,
24] for more details).
Two bending moments M
1 and M
2 collected by each set of the straingauges can be expressed as:
The normal force is then obtained with the relation of the two moments, that is,
During the calibration test, voltage outputs for the bending moments showed clear linearity; the root-mean-square errors were less than 1.6 × 10
−4. Based on the maximum input voltages of the DAQ of ±5 V, the maximum range of the force and moment are ±4 N and ±120 N-mm, respectively. The loadcell was then mounted in between the end of the robotic arm and the model plates, and was connected to a straingauge amplifier (KWS 6A-5, HBM), a DAQ board (USB-6212, NI), and a PC (
Figure 1b).
We selected 61 different angles of attack α from −5 to 96 deg, 10 different sweptback angles β from 0 to 54 deg at an interval of 6 deg, and the three different ARs; a total of 1830 individual points were examined. Here, the parameters in each case were automatically adjusted by the aforementioned in-house code. A sampling frequency was fixed as 1000 Hz and each point took 12 s for collecting the data. Thus, each α-β-AR setting includes a time series of 12,000 data points. This single run for each AR was repeated one time more without the freestream to measure the tare weight. Here, we applied 2.5 s for each point. Then the shear forces on the model plates were measured by rotating the loadcell 90 deg.
As a way of observing the LEV and other flow structures, surface oil-flow visualization was adopted. A mixture of baby oil and fluorescent color pigment was applied on the upper surface of the model plates (refer to [
25] for detail). The pigment/oil mass ratio was less than 10%, giving adequate viscosity to conform to each flow path. Gravitational influence appeared in every initial state with a relatively thick layer of the mixture, but a sufficient test duration longer than 30 min in each case eventually blew the most of the mixture and only left an appropriately thin layer giving negligible gravitational influence (the initial gravitational influence was observable up to ~3 min from the beginning). The oil flow patterns were then taken by a digital camera (ILCE-7RM3, SONY) with a lens of a focal length of 55 mm (SEL55F18Z, SONY).
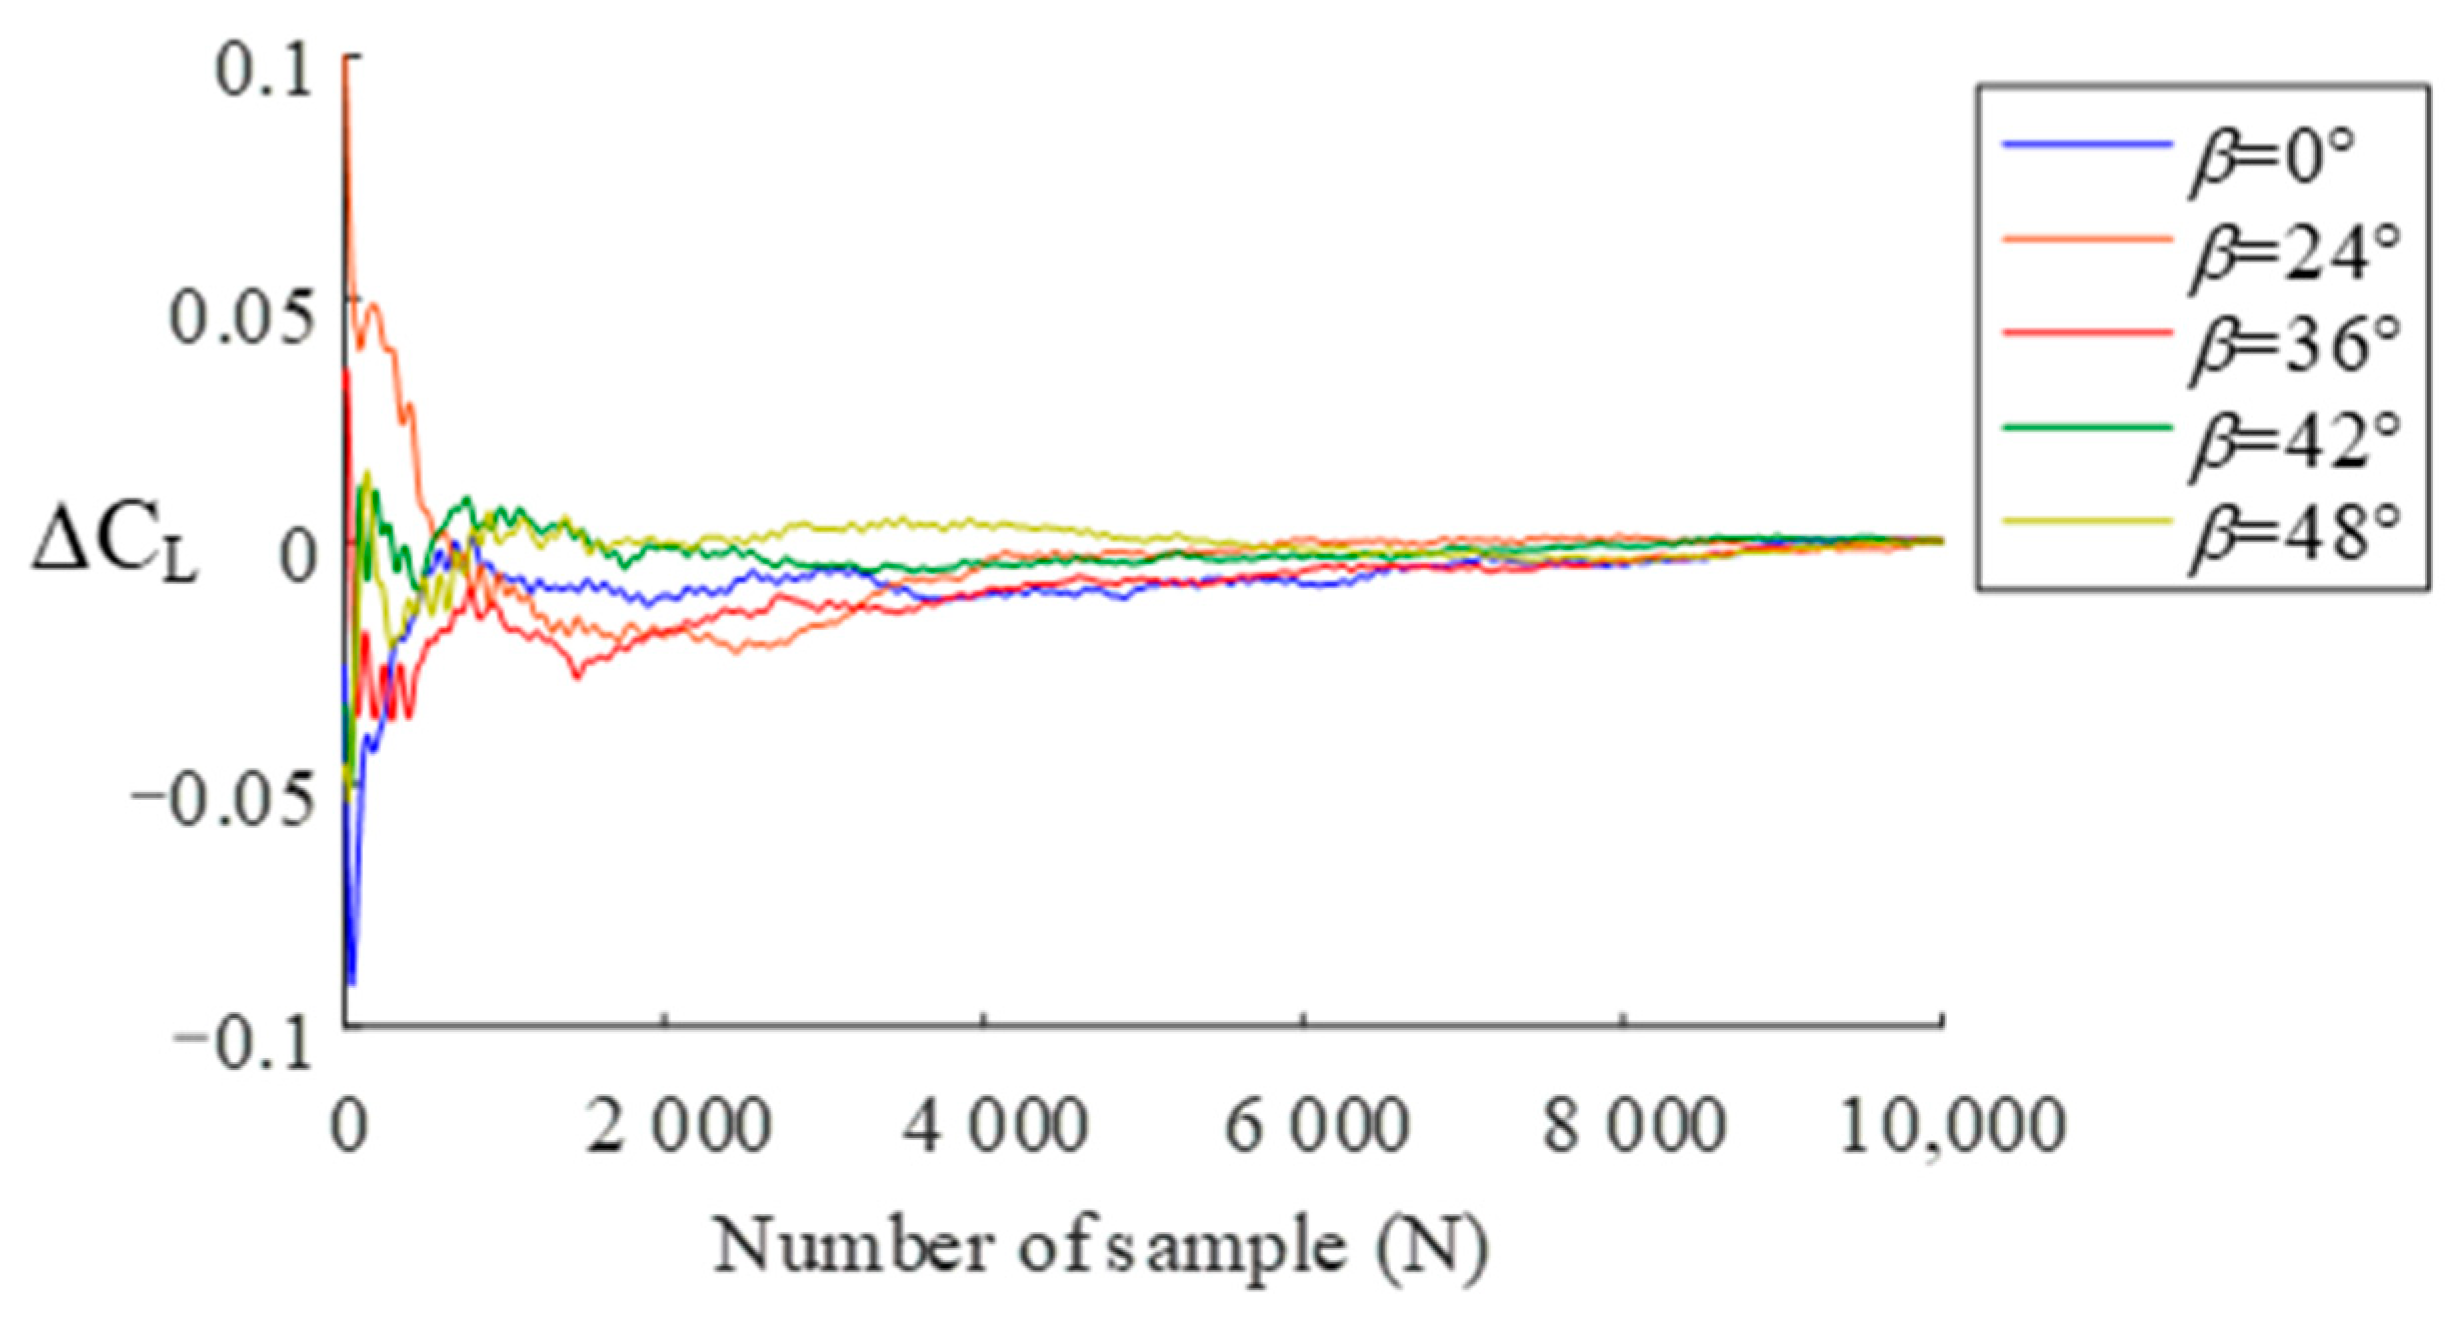
Figure 2 shows ensemble-averaged values for the five different
β of the model plate of AR = 4.50 at
α = 30 deg, i.e., near a stall angle. The ΔC
L here is based on the mean C
L in each case. The ΔC
L was sufficiently converged over 7000 samples in all cases.
3. Results and Discussion
We first investigated effect of AR to understand basic aerodynamic characteristics at the targeted Reynolds number of 2.85 × 10
4.
Figure 3 shows lift and drag coefficients C
L and C
D for the three different ARs at
β = 0 deg. One straight line on the left side indicates a theoretical value of a two-dimensional inviscid flow, i.e., C
Lα = 2π. The two dashed lines following the slopes of the C
L–
α curves are the results of the lifting-line theory for a finite wing shown in Equation (4), where a
0 and τ denote the C
Lα and shape factor, respectively (refer to [
26] for detail). It was found that τ ≈ 0.5, which is pretty larger than the typical range of 0.05 to 0.25, showed a sufficient agreement with the C
Lα in this study. This is one typical characteristic for low Reynolds number flow [
27].
Overall characteristics in the C
L–
α curves, such as linear increments in the pre-stall region and gradual reductions after the stall angles, are completely in line with the previous study on LAR wings at low Reynolds number [
5]. No stall peaks in the C
L–
α curves also imply a laminar-dominant flow, which was insufficient to overcome the adverse pressure on the suction side of the model plates (refer to [
27] for the disappearance of the stall peak as Re decreases). Decreasing AR relieved the C
Lα in the pre-stall region (arrow (1) in
Figure 3), further suggesting a gradual growth in an encroachment of the TiVs into the inboard region as the previous studies have shown [
1,
3].
At higher
α, decreasing AR slightly increased the C
L (arrow (2) in
Figure 3; 15 <
α < 25 deg). This is in line with one recent study [
6], which revealed that TiVs of a lower AR wing suppress the vortex shedding and assist in establishing the Kutta condition around the midspan, thereby enhancing the lift. This also explains the slight bump in the C
D at AR = 2.03 (
α ≈ 20 deg), because such TiV effect would practically augment the net force acting on the surface. No boost or bump in the C
D at AR = 4.5 further suggests that such an aerodynamic benefit from the TiV may be only effective at AR < 4.5.
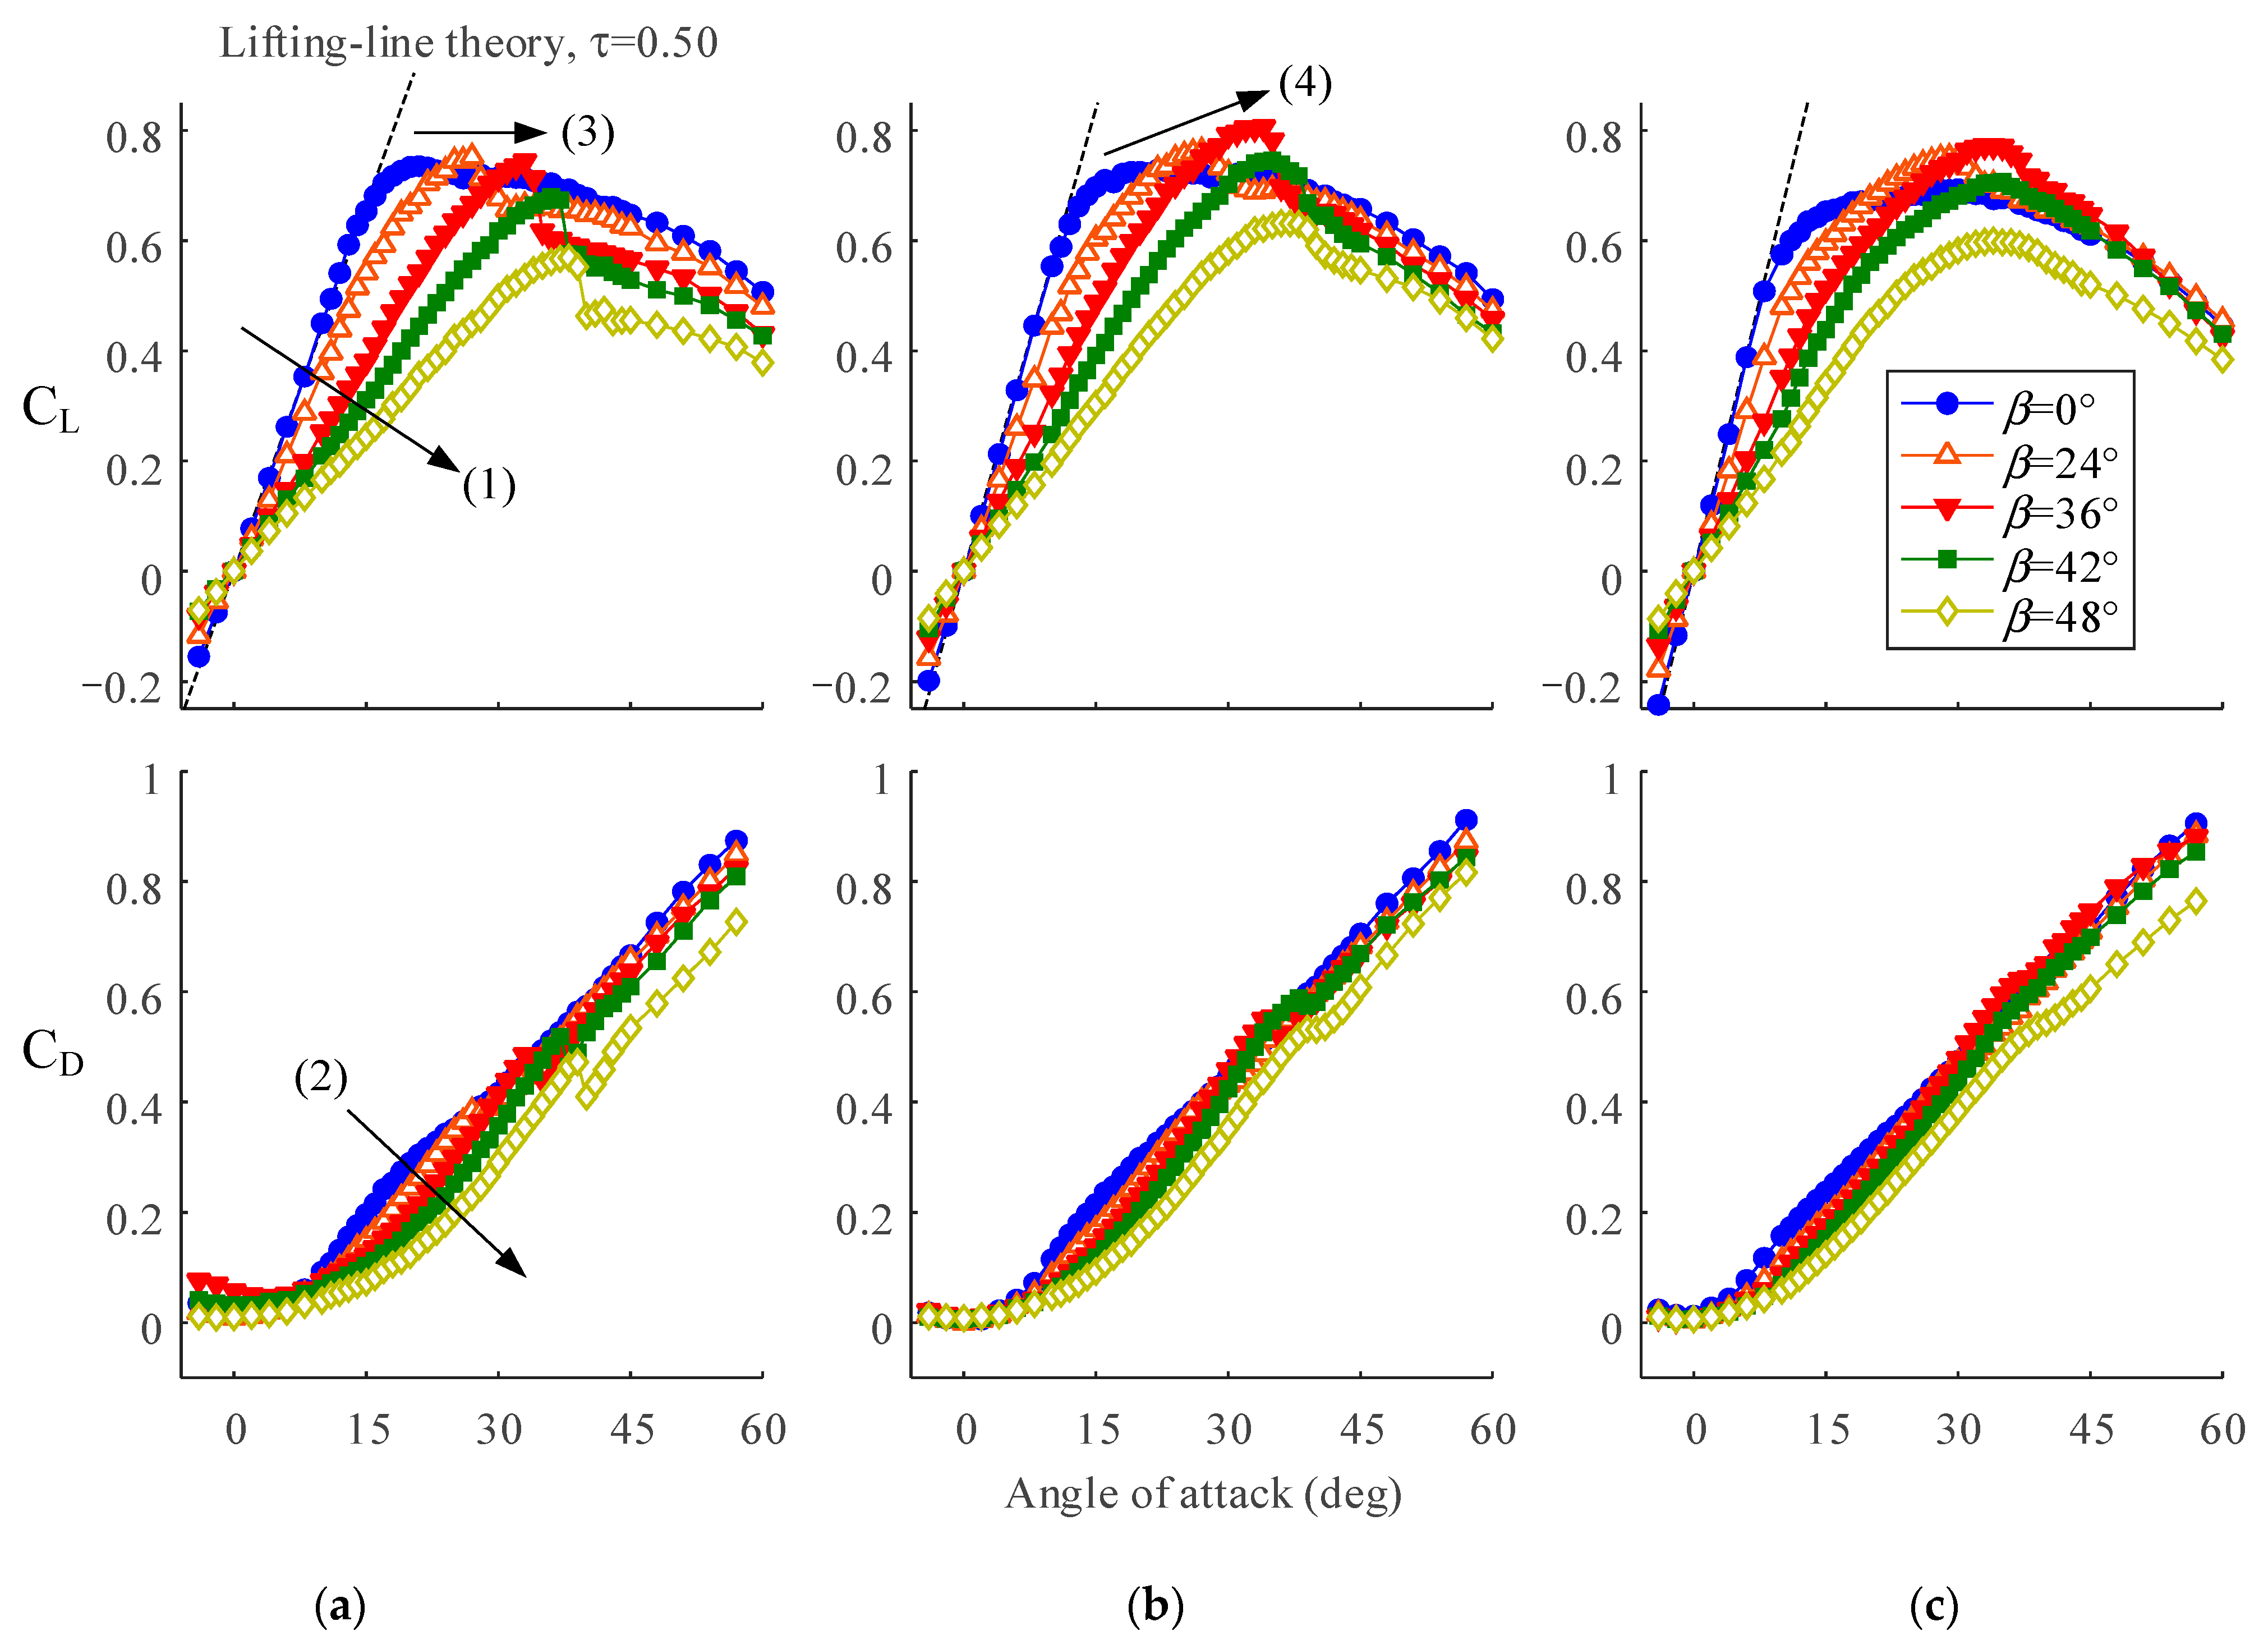
Figure 4a–c show the C
L–
α and C
D–
α curves with respect to
β. The dashed straight lines in each graph are the results of the lifting-line theory with τ = 0.5. In all cases, increasing
β delayed growth of C
L and C
D (arrows (1) and (2) in
Figure 4a). This is a typical feature of a sweptback plate as an increase in
β gradually reduces the inflow velocity perpendicular to the wingspan as U
inflow = U
∞cos
β (as discussed later). The stall angles were gradually delayed (arrow (3) in
Figure 4), also in line with previous studies on a sweptback angle (refer to [
2] as an example).
We noticed that the C
L at AR = 2.03 shows the prominent peaks at each stall
α (
Figure 4a). This feature, usually appears at a sufficiently high Reynolds number [
27], is only found at this AR at
β ≥ 24 deg. The maximum lift coefficient C
L,max depending on
β was also noticeable. At AR = 2.03, the C
L,max was obtained at
β = 0 deg already (arrow (3) in
Figure 4a). This implies that supplying a spanwise flow and developing an LEV by using
β may not be effective to enhance a lift force, at least for this AR. In other words, wings/plates with an AR of approximately two or below may be not able to produce an additional lift force supported by an LEV. At AR = 3.13 and 4.50, on the other hand, the C
L,max was gradually improved with increasing
β (arrow (4) in
Figure 4b). The maximum value of C
L,max appeared at
β ≈ 30 deg for both cases. The rate of growth in C
L,max was more conspicuous at AR = 3.13, implying that C
L,max does not have simple monotonic relation with AR. This is similar to previous studies on a revolving/flapping wing (refer to [
11] as an example).
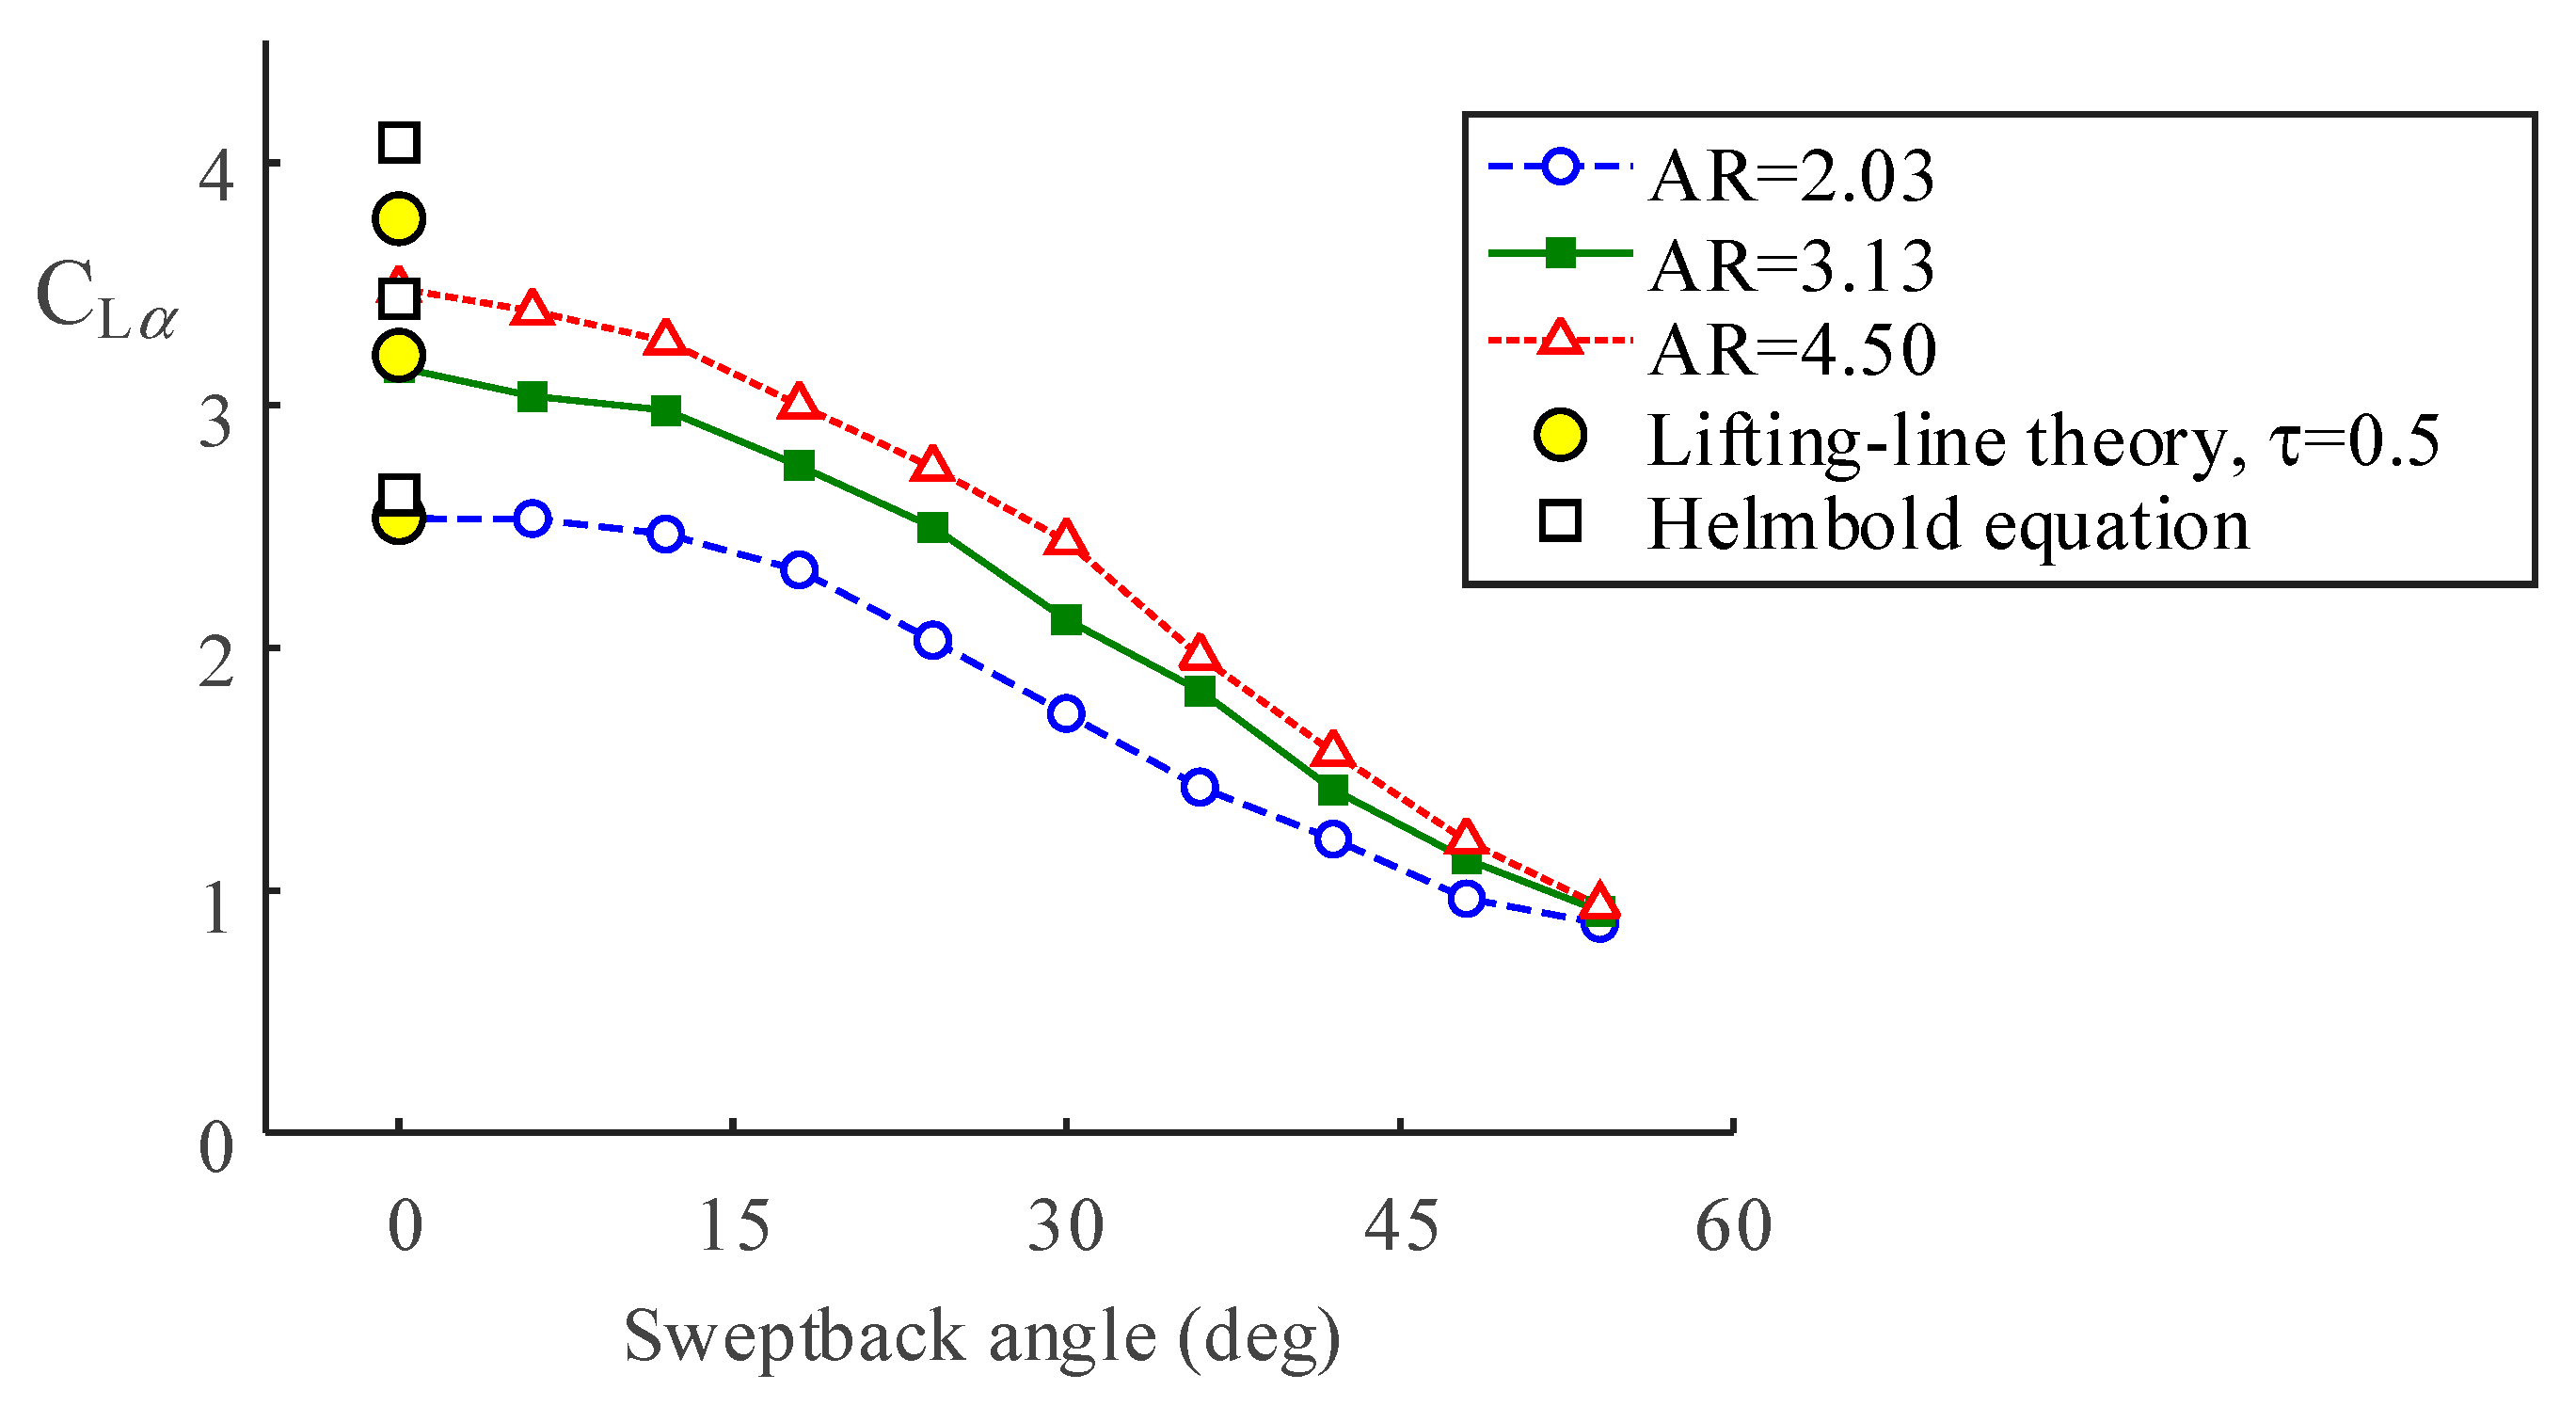
Figure 5 represents slopes of the C
L–
α curves in the pre-stall region, i.e., C
Lα. These were extracted at
α < 9 deg where the curves have a linear slope. The Helmbold equation, which is known to provide a closer fit at AR < 4 [
26], are also added in
Figure 5. The Helmbold equation is,
τ = 0.50 is quite larger than the typical range as mentioned before, but the C
Lα of the lifting-line theory is still higher than the measurement. The Helmbold equation gave a better fit than that of the theory with τ = 0.25, but also overestimates the C
Lα. As Pelletier and Mueller [
28] pointed out, these would be stemmed from the lower
a0 at the low Reynolds number, which had been assumed as 2π. The higher AR resulted in higher C
Lα at each
β. Increasing
β resulted in a gradual reduction in C
Lα. These were steadily converged to C
Lα ≈ 1.0 at
β = 54 deg.
Figure 6a represents the maximum lift coefficient C
L,max with respect to
β. In addition, the chordwise component of C
L,max at AR = 2.03, i.e., C
L,max@β=0cos
2β is given as the black dashed line (as discussed later). The C
L,max at AR = 2.03 remained nearly unchanged at
β < 36 deg. At AR = 3.13 and AR = 4.50, on the other hand, increasing
β resulted in a gradual increment in the C
L,max. This effect continued until the
β reached 42 deg. The model plate of AR = 4.50 showed a higher rate of increment in the C
L,max, but the largest C
L,max appeared at AR = 3.13 with
β = 36 deg. The AR = 3.13 also showed superior lift production at
β > 36 deg.
In order to decompose an effect of the spanwise flow and an LEV contribution from the measurement, we assumed that the C
L,max at
β = 0 deg can be the maximum value without support of the LEV, because there is no spanwise flow at
β = 0 deg. The portion of this value in the other
β cases becomes then C
L,max@β=0cos
2β as shown in the black dashed line in
Figure 6a, because a chordwise component of a freestream is U
∞cos
β. This approach, dividing a lift force into two components, obviously cannot decompose effect of TiVs, wake, or their interaction in practice. Other aerodynamic effects at
β = 0 deg, such as the boost and bump of the C
L as shown in
Figure 3, also could be blended in this approach.
Figure 6b shows the LEV contribution C
L,LEV, which is the remaining part of the C
L,max after extracting the C
L,max@β=0cos
2β. At
β < 30 deg, the C
L,LEV showed a rapid increment with increasing
β. The increment in the C
L,LEV even appeared at AR = 2.03, implying that the plateau of the C
L,max at AR = 2.30 at
β < 30 deg in
Figure 6a originally resulted from the LEV that compensated a gradual loss in the lift force with increasing
β (refer to the black dashed line in
Figure 6a for the loss in the lift force). At
β > 36 deg, The C
L,LEV of the AR = 3.13 plate resulted in higher values. This suggests that an LEV would be most effective at an AR of approximately three with a sufficient sweptback angle. All the C
L,LEV then decreased at
β > 45 deg, where the spanwise component of the freestream is larger than the chordwise one. The C
L,LEV gradually reduced from this point; the C
L,LEV will eventually approach zero with increasing
β as the frontal area of the model plates approach zero.
According to DeVoria and Mohseni [
6] and Zhang et al. [
7], two TiVs at a sufficient
α induce massive downwash covering up to the midspan at an AR of approximately two and below. This implies that the flow over the AR = 2.03 plate was stabilized by two TiVs, and the C
L,max at AR = 2.03 was achieved by the two strong TiVs at
β = 0 deg already. Developing an LEV with increasing
β at AR = 2.03, therefore, could not be effective to obtain an additional lift, because the Kutta condition at the trailing edge, which is expected as a result of the LEV attachment, was already achieved by the two TiVs (refer to Kweon and Choi [
29] for the LEV system of a flapping plate in detail). This suggests that from this AR, supplying a spanwise flow using a sweptback angle for a lower AR plate would not be beneficial for lift production.
At AR = 3.13 and AR = 4.50, the TiVs at
β = 0 deg could not cover the midspan region as Zhang et al. [
7] revealed. The flow in the midspan region would show similar behavior to that of a two-dimensional airfoil at higher
α, i.e., unsteady vortex shedding. Here, introducing the spanwise flow by increasing
β would develop an LEV and gradually increase the C
L,max as shown in
Figure 6a. The relatively wider inboard region of the AR = 4.50 plate would result in both the lowest C
L,max at
β = 0 deg and the rapid rate of growth of the C
L,max with the slightly extended LEV (as discussed later). This manner, i.e., increasing
β to develop an LEV and to enhance a lift, however, seems to need at least a certain higher
β because there were also slight losses in the lift at
β = 6 deg at the two higher ARs (
Figure 6a). The C
L,LEV at
β = 6 deg at the two ARs remained near zero (
Figure 6b), also implying an insiginifcant LEV contribution.
Another interesting feature is the superior lift production and the largest LEV contribution of the AR = 3.13 plate at
β > 36 deg. Considering that the LEV system would be fully developed at such a higher
β, it can be interpreted that an AR near three might be an optimal value for the lift enhancement of a sweptback plate. Note that a stable LEV attachment on a revolving/flapping wing solely appeared in an inboard limited region from the wingroot in the previous studies (r/c < 4.0 in ref. [
15]; r/c ≈ 3.0 in ref. [
18]). Note also that a revolving/flapping wing with an AR of around three results in the maximum lift production and reasonable efficiency [
16,
18]. This clearly indicates that there might be identical characteristics in between the two LEVs, even they are created and stabilized by the two distinctive sources, i.e., a part of freestream in a sweptback wing versus a radial pressure gradient in a revolving/flapping wing.
As another way of decomposing the effect of spanwise flow, we replaced the reference velocity U
∞ with the chordwise component of the freestream, i.e., U
∞cos
β. The related lift coefficient C
L,cw is then,
In this concept, it can be seen that the steady spanwise flow of U∞sinβ is added to the model plates that were placed in a freestream of U∞cosβ. Note that in this approach, the CL,cw does not directly reflect the level of the lift force; the CL,cw at higher β would result in a smaller lift.
Figure 7 shows the C
L,cw for the three AR cases. We noticed that the slopes of C
L,cw–
α curves in a pre-stall region eventually show consistency with the other
β cases at each AR. This indicates that the reduction in C
Lα with increasing
β (
Figure 4) was mainly stemmed from the reduction in chordwise inflow speed. Increasing
β enhanced both the maximum C
L,cw and stall
α, implying that the spanwise flow stabilized the LEV and flow over the model plates at the higher
α, as a spanwise flow on a revolving/flapping wing stabilizes an LEV. The identical slopes at each AR further suggest satisfaction of the Kutta condition, as an LEV on a flapping wing does [
16].
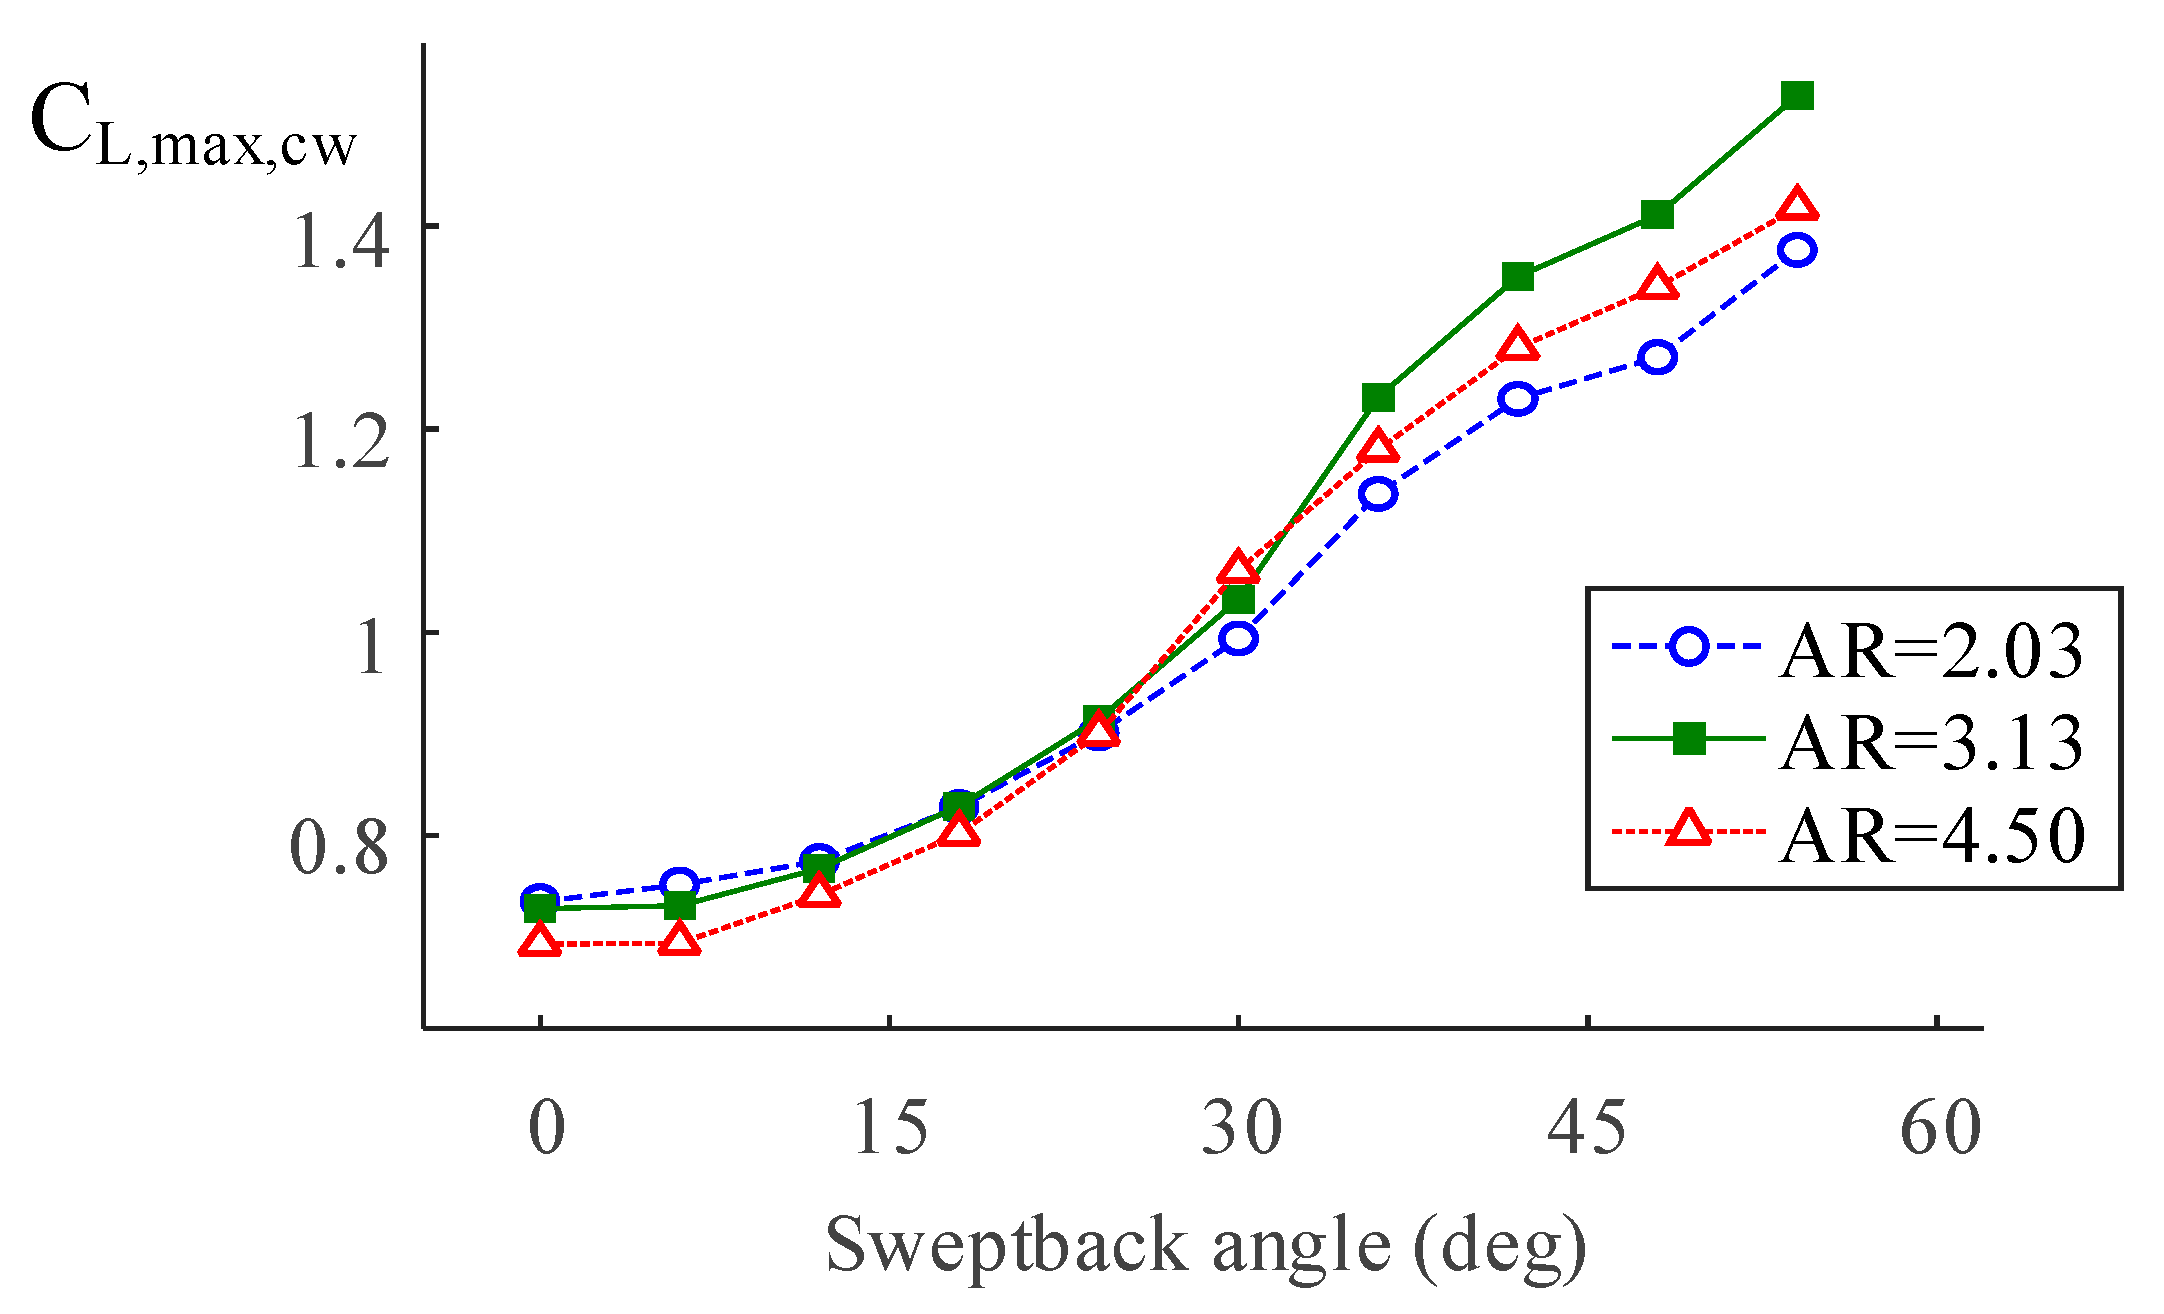
Figure 8 shows the maximum C
L,cw with respect to
β, which is in rough proportion to
β. It was found that the C
L,cw at AR = 3.13 eventually reached the superior lift force at
β > 36 deg. This, once again, suggests that an AR of approximately three would be most effective for the lift enhancement with a sufficient sweptback angle.
Surface oil-flow visualization is one adequate technique to observe an attached flow and/or vortex including an LEV [
25].
Figure 9a–c show surface oil-flow patterns and streamlines on the suction side of the AR = 3.13 plate for three selected
β cases of 0, 24, and 36 deg. Let us see the results at
β = 0 deg first (
Figure 9a). At
α = 2 deg, the flow was separated at the leading edge and reattached near the quarter-chord line. Part of the reattached flow went against the freestream and produced the line of separation beyond the line of reattachment, creating a leading-edge bubble (LEB) in between them. Laminar separation bubble seemed not to appear because the plate does not have streamlined curvature around the leading edge and, thus, cannot provide a favorable pressure gradient region for a laminar attached flow [
30]. At
α = 5 deg, the two lines were stepped back, and TiV traces became prominent. At
α = 10 deg (the stall angle), the TiV was extent reached ~28% from each tip, occupying ~56% of the entire span.
A line of reattachment was also clearly found at
β = 24 deg (
Figure 9b). At
α = 2 deg, the flow over the LEB smoothly flowed out to the trailing edge. The attached flow running in parallel with the freestream here indicated little effect from the LEB. The LEV traces were found at
α = 10 deg. The flow ran toward the leading edge from the line of reattachment, and separated before reaching the leading edge, creating the line of separation. At higher
α, the LEV trace was gradually moved to the left side with increasing
α; a substantial unsteady wake region remained on the right side.
At
β = 36 deg (
Figure 9c), the LEV trace appeared at a smaller
α of 5 deg, meaning that the spanwise flow here would be sufficient to roll up a chordwise inflow. At
α = 10 deg, the line of separation was connected to the bottommost point of the right side; this was maintained until
α = 20 deg. The LEV was gradually developed with increasing
α, encroaching the attached flow region between the LEV and TiV on the left side. This TiV was also grown to the attached flow region. At
α = 30 deg, the LEV and TiV were bonded to each other across the line of reattachment. The LEV covered the model plate across the wingspan, except for a small region where the TiV was placed on the right edge. This structure is quite similar to that on a revolving/flapping wing [
31], as well as that on a non-slender delta wing [
25,
32,
33].
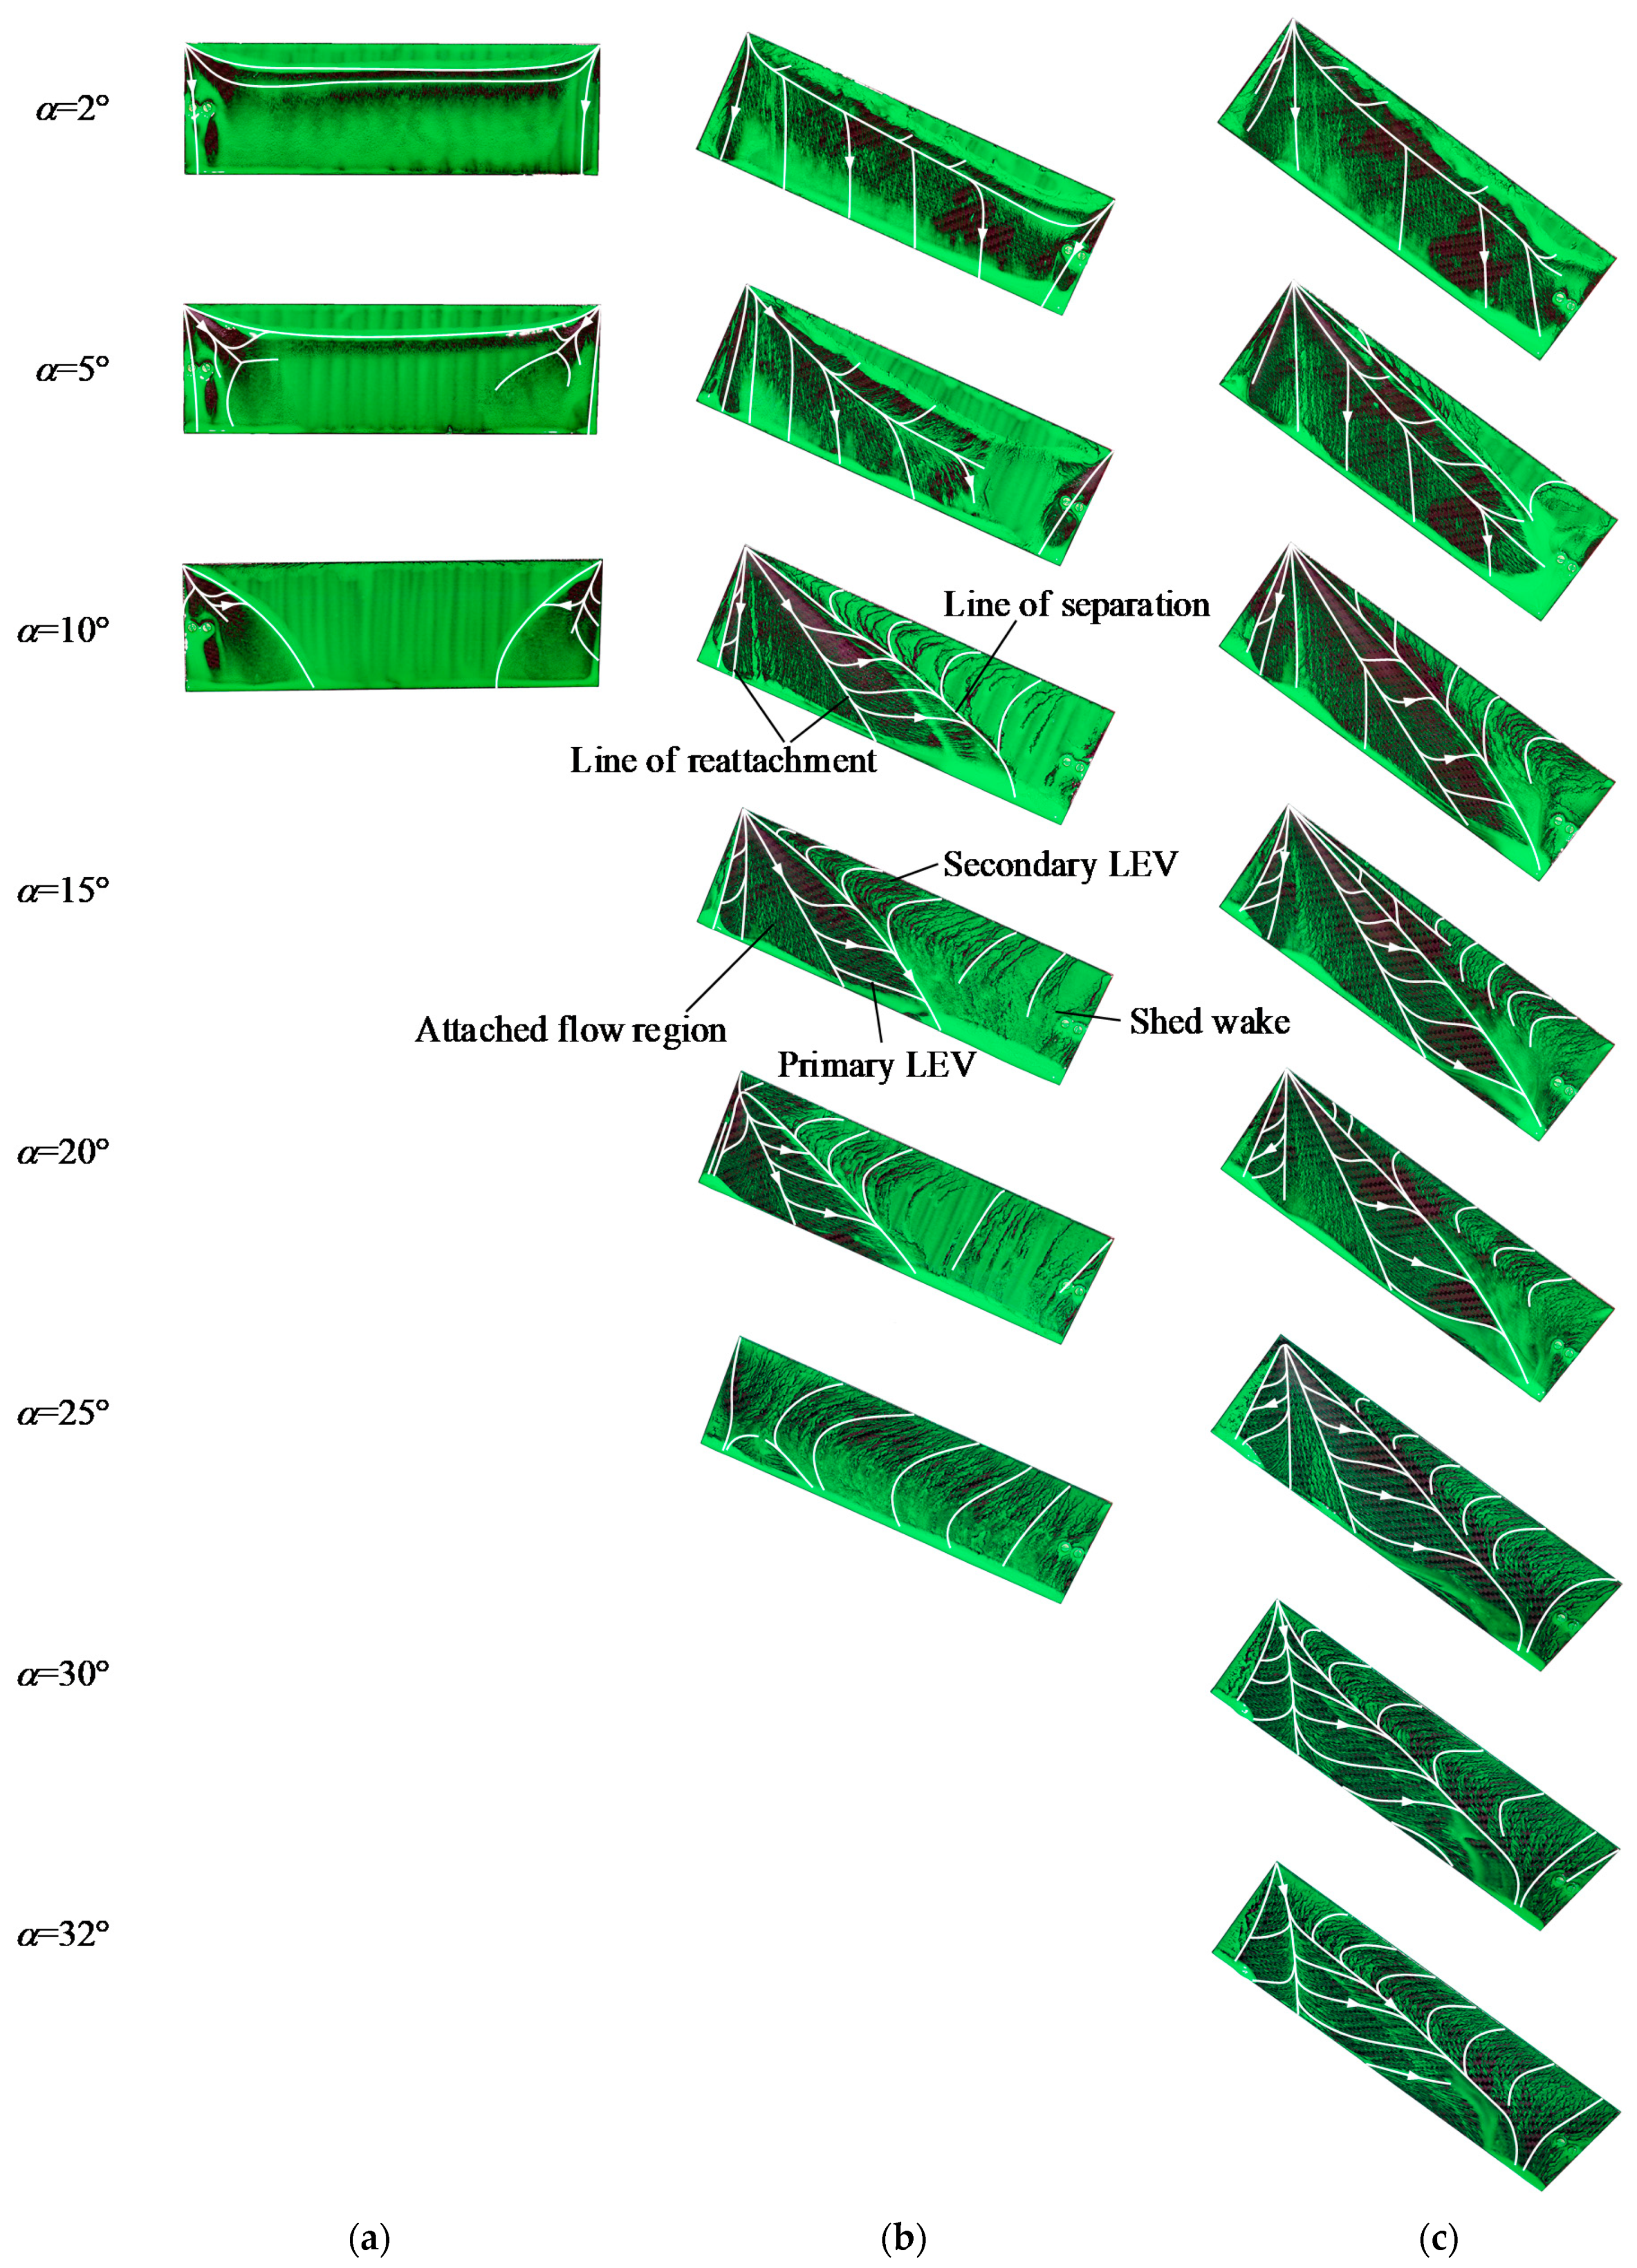
Figure 10 exhibits the surface streamlines near the stall
α at
β = 36 deg. Before the stall (
α = 25 deg), the three AR plates resulted in an identical LEV structure except for the scale along the spanwise direction. TiVs on the left side also had a similar size, and the attached flows settled in between the LEVs and the TiVs. The line of separation on the AR = 2.03 plate was considerably stepped back to the trailing edge at
α = 30 deg (
Figure 10a), reminding us of a lifted-off LEV on a revolving/flapping wing [
15,
16,
17,
18]. At
α = 32 deg, the trace of the LEV was only observed near the trailing edge, but it was still distributed in most of the span. The LEV at AR = 3.13 also covered most of the span at the same
α (the final row in
Figure 10b), but the LEV was less deformed than that of AR = 2.03. The line of separation at
α = 32 deg begun from ~0.4
c at the inboard region, and gradually developed up to ~0.62
c until it was bent by the TiV on the right side. The LEV at AR = 4.50 (
Figure 10c) also left a similar oil-flow pattern. The LEV was shortly extended to the right side so as to give a small region for the attached flow even at
α = 32 deg. However, the relatively short LEV eventually left a considerable outboard region where the unsteady wake shedding appeared.
Note that the LEVs at AR = 2.03 and 3.13 (
Figure 10a,b) fully covered the suction side without an outboard wake region on the right side. Note also that the two LEVs at AR = 3.13 (
Figure 10b) and at AR = 4.50 (
Figure 10c) covered up the surface approximately three times the chord along the wingspan. These characteristics remind us of the previous studies on a revolving/flapping wing, which showed a conical LEV system in an inboard quasi-steady region that takes approximately three chords from the root [
18]. A concept of ‘radial stall limit’ for the LEV on a revolving wing, where the limit found as r/c < 4 [
15], also seems to have consistency with the LEVs in this study. These all do not only indicate identical characteristics between the two different LEVs as mentioned before, but also imply that the similar concept to characterize an LEV will be adoptable to an LEV on a sweptback plate. Based on the line of separation at AR = 4.50, a critical length of the LEV of a sweptback plate could be determined as
b/
c ≈ 3.1, at least at this Reynolds number.
Such a resemblance between the two LEVs further gives us another explanation for stall characteristics at AR = 2.03. Han et al. [
16] found an excessive flux running to the wingtip around an LEV on a flapping wing at AR < 3. Likewise, sufficient
β at AR = 2.03 in this study could result in a relatively superior level of kinetic energy in the flow over the plate. This would bring out the prominent peak and drops at the stall angle at AR = 2.03 (
Figure 4a), similar to an airfoil at a high Reynolds number [
27].
We computed spanwise locations of centers of pressure (CP) as a way of analyzing an LEV behavior. These were obtained by dividing the moment with the normal force (refer to [
13] for more details).
Figure 11 shows the locations of the CPs at
β = 36 deg. At
α < 10, the two CPs at AR = 3.13 and 4.50 gradually moved to the right edge with insufficient LEV development. The CPs were then returned back to the left side at
α > 10, as the LEV increasingly encroached the attached flow region in between the LEV and the TiV on the left side as shown in
Figure 10. These two similar traces of the CP at AR = 3.13 and AR = 4.50 also reflected the similar LEV behavior at the two ARs. The larger wake shedding region near the right edge at AR = 4.5, however, resulted in the locations of CPs closer to the left side.
Such a drastic movement of the CP was not observed at AR = 2.03. Due to the relatively larger TiV on the left side, which already placed almost half of the span [
8], the CP was monotonically moved to the right side with increasing
α. Note the CPs near the stall
α. Comparing to that of AR = 4.50, the CPs at AR = 2.03 and 3.13 were in close proximity. This indirectly explains that the LEV at AR = 3.13 covered most of the suction side of the model plate similar to that of the LEV at AR = 2.03, and suggests that an AR of approximately three would be most beneficial for the lift enhancement.
Swifts are one highly maneuverable flyer, and they directly sweep back their wings, thereby obtaining a triple turning rate [
34]. This led to swift-inspired micro aerial vehicle development [
35], which achieves higher maneuverability via a sweptback angle. Our results indicate that there are an optimal AR and sweptback angle for the wings of the vehicles at least in this range of Re. Further studies with different wing shapes at different Reynolds numbers are necessary.
Some biological flyers, which possess a high degree of maneuverability and, thus, provide a great inspiration about bio-inspired aerial vehicles, shift back their stroke plane in forward flight [
20,
21,
22]. This is comparable to a sweptback angle, and our results could be interpreted that a shifted-back stroke plane helps to maintain the LEVs on their LAR wings at least within a certain level, i.e.,
b/
c ≈ 3.1. Further studies on a shifted-back stroke plane of flapping wings will follow.


