Article

Numerical Optimization of a Microchannel Geometry for Nanofluid Flow and Heat Dissipation Assessment

1
IN+ Center for Innovation, Technology and Policy Research, Instituto Superior Técnico, Universidade de Lisboa, Av. RoviscoPais, 1049-001 Lisboa, Portugal
2
MEtRICs, Mechanical Engineering Department, Campus de Azurém, University of Minho, 4800-058 Guimarães, Portugal
3
CINAMIL—Military Academy Research Center, Portuguese Military Academy, R. Gomes Freire, 203, 1169-203 Lisbon, Portugal
4
CEFT-Tranport Phenomena Research Center, Department of Chemical Engineering, Faculdade de Engenharia da Universidade do Porto (FEUP), R. Dr. Roberto Frias, 4200-465 Porto, Portugal
*
Author to whom correspondence should be addressed.
Appl. Sci. 2021, 11(5), 2440; https://doi.org/10.3390/app11052440
Submission received: 11 February 2021 / Revised: 25 February 2021 / Accepted: 27 February 2021 / Published: 9 March 2021
(This article belongs to the Special Issue Flow and Heat Transfer in Micro and Millifluidic Devices)

Abstract

:
In this study, a numerical approach was carried out to analyze the effects of different geometries of microchannel heat sinks on the forced convective heat transfer in single-phase flow. The simulations were performed using the commercially available software COMSOLMultiphysics 5.6® (Burlington, MA, USA) and its results were compared with those obtained from experimental tests performed in microchannel heat sinks of polydimethylsiloxane (PDMS). Distilled water was used as the working fluid under the laminar fluid flow regime, with a maximum Reynolds number of 293. Three sets of geometries were investigated: rectangular, triangular and circular. The different configurations were characterized based on the flow orientation, type of collector and number of parallel channels. The main results show that the rectangular shaped collector was the one that led to a greater uniformity in the distribution of the heat transfer in the microchannels. Similar results were also obtained for the circular shape. For the triangular geometry, however, a disturbance in the jet impingement was observed, leading to the least uniformity. The increase in the number of channels also enhanced the uniformity of the flow distribution and, consequently, improved the heat transfer performance, which must be considered to optimize new microchannel heat sink designs. The achieved optimized design for a heat sink, with microchannels for nanofluid flow and a higher heat dissipation rate, comprised a rectangular collector with eight microchannels and vertical placement of the inlet and outlet.

1. Introduction

The development of technology in the fields of mechanics, electronics, defense (e.g., in UAVs (unmanned aerial vehicles)) and biomedicine, among others, has been directed towards the miniaturization of their components, which are currently reaching micro- and nano-scales [1,2,3,4]. Their robustness makes them fit to be used in harsh environments, such as to provide basic health care in developing countries and for military applications. Microfluidic devices, such as microchannel heat sinks, have been broadlyexplored for heat removal due to their reduced dimensions [5]. In addition, it should be emphasized that the scaling down from macro to micro leads to several relevant issues in thermal management in several applications, including in micro combustors, pushing the need for the optimization of their geometry [6,7].Besides this miniaturization factor, the heat transfer coefficient in microchannels is comparatively very high because of the effect of the very small hydraulic diameter and the associated latent heat of evaporation. This coefficient is influenced directly by the thermophysical properties of the working fluid, the mass and heat fluxes, and the geometry of the microchannels (geometric configuration shape, internal hydraulic diameter, cross-section shape, area and aspect ratio). It should also be emphasized that it is paramount to avoid instability (malfunctioning of the flow) in micro channeled devices, which worsens the heat transfer performance and may cause troublesome vibration, thermal fatigue, and even surface burnout. The mains sources of instability in microchannels are flow maldistribution, pressure drops, wall temperature gradient and, in some cases, vapor flow reversal, resulting in re-entrant cavities, points of bubble nucleation, throttling points and working fluid superheating. The required number of micro components in a micro channeled device (pump, valve, mixer, reactor, manifold, among others) that is usually assembled in a microchip leads to a high degree of complexity [8], which in turn highlights the pressing need for the evaluation by numerical simulations of the microchannel heat sinks. Registering quantities such as pressure and velocity fields demands complex experimental set-ups and extensive measurement campaigns, the resultsof which should always validate the numerical models.
Over the last few years, different methods and toolboxes have been studied to simulate the heat transfer phenomena that occur in microfluidic devices. Xu et al. [8] developed a mathematical model using the commercial COMSOL Multiphysics 5.6®(Burlington, MA, USA) [9] software to optimize the fabrication of micro nanofluidic devices through photopolymerization. The model expressed the decomposition of the material that would occur due to the manufacture process. Teodori et al. [10] implemented a volume of fluid (VOF)-based model in the Open FOAM ComputationalFluid Dynamics (CFD) toolbox to compare the heat transfer in straight and finned microchannels. The presence of the fins improved the heat exchanges; however, the optimization of the geometry of the fins is still required.
Since conventional heat transfer theories are not sufficient to describe the heat exchange through fluid–solid boundaries, some difficulties can arise when simulating a fluid flow in microchannels [1]. Macroflow regimes can be described by the classic Navier–Stokes equations. The Navier–Stokes method with the no-slip boundary condition is not adequate for describing microflow regimes. Those, in turn, can be described by the Boltzman kinetic model with the aid of numeric simulation methods, such as the Lattice Boltzmann Method (LBM), the Molecular Dynamics (MD) method, the Direct Simulation of Monte Carlo (DSMC) [11,12] and the Computer Fluid Dynamics (CFD) method. The LBM method derives from the Boltzmann equation without the continuum assumption, and is a common tool used in numerical studies [13]. Nevertheless, the Navier–Stokes method with the first-order slip boundary condition can give results consistent with those obtained by numerical simulations based on the Boltzman model for fluids with a Knudsen number between 0.01 and 0.1. So, for this Knudsen number range, the Navier–Stokes method with a slip boundary condition is adequate to model nanofluids’ regimes. Microflow regimes, on the other hand, can present important differences in pressure drop, flow pattern and transition from laminar to turbulence from their macro counterparts.
Several studies have evaluated different geometrical configurations of heat sinks to optimize the flow and the heat transfer phenomena. Di Capua et al. [14], using the commercial COMSOL Multiphysics 5.6® software, analyzed a microchannel heat sink device for use as a cooler in a high-concentration photovoltaic system. The authors tested channels with and without triangular ribs on the inner side of the walls. The microchannels with ribs presented better heat transfer, increasing the Nusselt number1.7 times, on average. On the other hand, the simulation also showed that, for the same configuration, the average friction factor was 3.1 times higher.
Muhammad et al. [15] numerically compared the heat flux, pumping power, pressure drop and thermal resistance in microchannel heat sinks with different channel widths (Wc), heights (H), bases (tb) and wall thicknesses (Ww). Water and liquid metal Galinstan were used as working fluids. The authors reported that, regarding heat transfer performance, a deep and narrow channel would work better than a shallow and wide channel. Alfellag et al. [16] used a conjugate heat transfer model to study the laminar convection heat transfer and fluid flow in an inclined slotted plate-fin minichannel heat sink. The impact of the height of the inclined slot, the angle of the slot and the position of the pin with respect to the slot’s leading edge were investigated. An increase in the thermal and hydraulic performances was reported with the increase in the slot height and an inclination angle of 55 degrees. The addition of triangular pins further improved the performance, the optimal geometry being the one wherein the pins are placed far from the slot’s leading edge. Ong and KuShaari [17] tested microchannel heat sinks with different materials and microchannel ratios, that is, the ratio between the microchannel’s width and the microchannel’s spacing. The materials used for the fabrication of the heat sinks were polymer-based (PDMS, Polytetrafluoroethylene-PTFE, PDMS/Multi-Walled Carbon Nanotubes-MWCNT) and metal-based (aluminum). Due to their low conductivity, the polymer-based materials tended to enhance the heat convection contribution and consequently improved the thermal performance of the heat sink. High values of microchannel ratio corresponded to a higher thermal contact area and a reduced fluid velocity in the microchannel, which improved the overall thermal performance. Freegah et al. [18] evaluated the performance of plate-fin heat sinks through a commercially available Computer Fluid Dymamicssoftware, ANSYS R 16.1 (Canonsburg, Pennsylvania, United States). The plate-fin heat sinks presented four different geometries: standard plate-fin; plate-fin with fillet profile; plate-fin with fillet profile and symmetrical half-round pins in a vertical arrangement; and plate-fin with fillet profile and corrugated half-round pins in a vertical arrangement. The two last designs manifested greater reduction in the base temperature and thermal resistance, and an increase in the Nusselt number, in comparison to the other two designs. Hempijid and Kittichaikarn [19] also used a commercial CFD software, ANSYS-Fluent, to investigate the performance of micropin finned heat sinks with different relative positions and angles of the inlet and outlet. The heat sink with a V-type configuration, micropin finned and positioned at an angle of 75°, and a 2.5 mm distance between the front surface and inlet/outlet centerline, operating under a 2744 Pa pressure drop, showed the best heat transfer performance.
Combined with the microfluidic devices, many studies have used nanofluids as cooling fluids [20]. Consequently, the incorporation of solid nanoparticles (preferably in a concentration less than 1% vol.) into non-dissolving basefluids must be considered in the computational process. Awais and Kim [21] simulated numerically and verified experimentally the thermohydraulic performance of a minichannel heat sink with a standard header and an optimized header using a water basefluid with Al2O3 nanoparticles. The optimized header geometry showed better results in both numerical simulations and experimental tests compared to the conventional geometry. The thermal performance was also enhanced with an increasein the flow rate and volume concentration of nanoparticles, the optimized geometry being more sensitive to those changes. Bahiraei et al. [22] analyzed numerically the heat transfer on heat sinks with circular, triangular and drop-shaped pin fins. In addition, the impact of a nanofluid with functionalized graphene nanoplatelets on the heat transfer process was also investigated. The heat sink with circular pin fins showed the highest thermal efficiency, while the one with triangular pin fins showed the lowest. The increase in velocity or particle fraction reduces the temperature on the heating surface and the thermal resistance, whilst improving the temperature distribution’s uniformity.
HadiNajafabadi et al. [23] applied the standard finite volume method in thecommercially available toolbox OpenFOAM® (Unit 6 The Courtyard, Eastern Road, Bracknell, Berkshire, RG 12 2XB, UK) for the analysis of laminar forced convective heat transfer for Al2O3nanoprticles dispersed in a water base. The results showed a heat transfer enhancement despite the increase in the friction effect. Ganguly et al. [24] also studied the flow of Al2O3 nanoparticles in water through a microchannel, considering the combined effects of externally applied pressure gradient and electroosmosis, by following a semi-analytical approach. The nanoparticles lead to a reduction in the total entropy generation in the microchannel.
With the increasing need to studynanofluids for heat transfer processes, it is also important to improve the geometry of the heat sinks. However, and this is considered as the main existing literature gap, the published works with an in-depth focus on all the conceivableheat transfer-promoting details of the heat sink’s configuration are rather scarce. For instance, only a few studies have compared different inlet and outlet geometries, which have an important role in the distribution of fluid via the different microchannels.
In line with this, the present study addresses a numerical work (experimentally validated)to infer the influence of different heat sink geometries over the flow distribution and, consequently, over the heat distribution throughout the heat sink, and its heat transfer performance. The results are compared to determine the best geometry for heat transfer applications. The main goal is to establish a new set of well-defined configuration guidelines for the optimized construction of the next generation of microchanneled heat sinks with enhanced heat dissipation.

2. Numerical Procedure

The main goal of the present work was to study the flow distribution over the parallel channels of the heat sink. For the numerical simulation, the selected fluid mechanics model of the COMSOL Multiphysics 5.6® software was laminar flow (spf), which enabled the determination of the pressure fields and velocity profiles in a single-phase flow. Initially, the flow was studied by assuming a constant temperature (isothermal) and steady state conditions. The subsequent studies were meant to simulate the heat transfer process. For that purpose, a conjugated heat transfer module was used. This interface simulates the combined solid and fluid heat transfer processes and uses a classical approach for the determination of heat transfer in solids, as determined by the Fourier law given by Equation (5) of the next section, and for the determination of the heat transfer in fluids, given by the governing Equation (4) (also in the next section). We determined the velocity field, the pressure field and the temperature for both solid and liquid domains.

2.1. Numerical Method

The governing equations for a laminar 3D isothermal flow are the mass, momentum and energy conservation equations, given by:
ρ t + × ( ρ V )   = 0
V t + ( V × ) V   =   1 ρ p + v 2 V + f
ρ [ h t + × ( h V ) ]   =   D p D t + × ( k T ) + ϕ
where ρ is the density, t is the time, V is the velocity vector, p isthe pressure, υ isthe constant of kinematic viscosity, f is the body force per unit mass, h isthe enthalpy, k isthe thermal conductivity and T is the temperature. For the fluid, the energy conservation promotes a balance between the different mass transport and heat transfer mechanisms (convection and conduction) due to the effect of viscosity, pressure and density variations [25], represented by Equation (4):
ρ C p T t + ρ C p u T   =   α p T ( p a t + u p a ) + τ : G + × ( k T ) + Q f
where C p is the heat capacity at a constant pressure, u the velocity field, α p is the thermal expansion coefficient, p a the absolute pressure, τ the viscous stress tensor, G the strain rate tensor and Q f the heat source. For the solid, energy conservation leads to the Fourier law:
ρ C p T t   =   × ( k T ) + Q f
It is worth mentioning that, as explained in the Introduction, the Navier–Stokes method with the first-order slip boundary condition can give results consistent with those obtained by numerical simulations based on the Boltzman model for fluids with a Knudsen number between 0.01 and 0.1. So, for this Knudsen number, the Navier–Stokes method with a slip boundary condition is adequate to model the nanofluids’ regimes. As the flow is laminar, this approach is also valid for the characteristic scale of the microchannels addressed here.

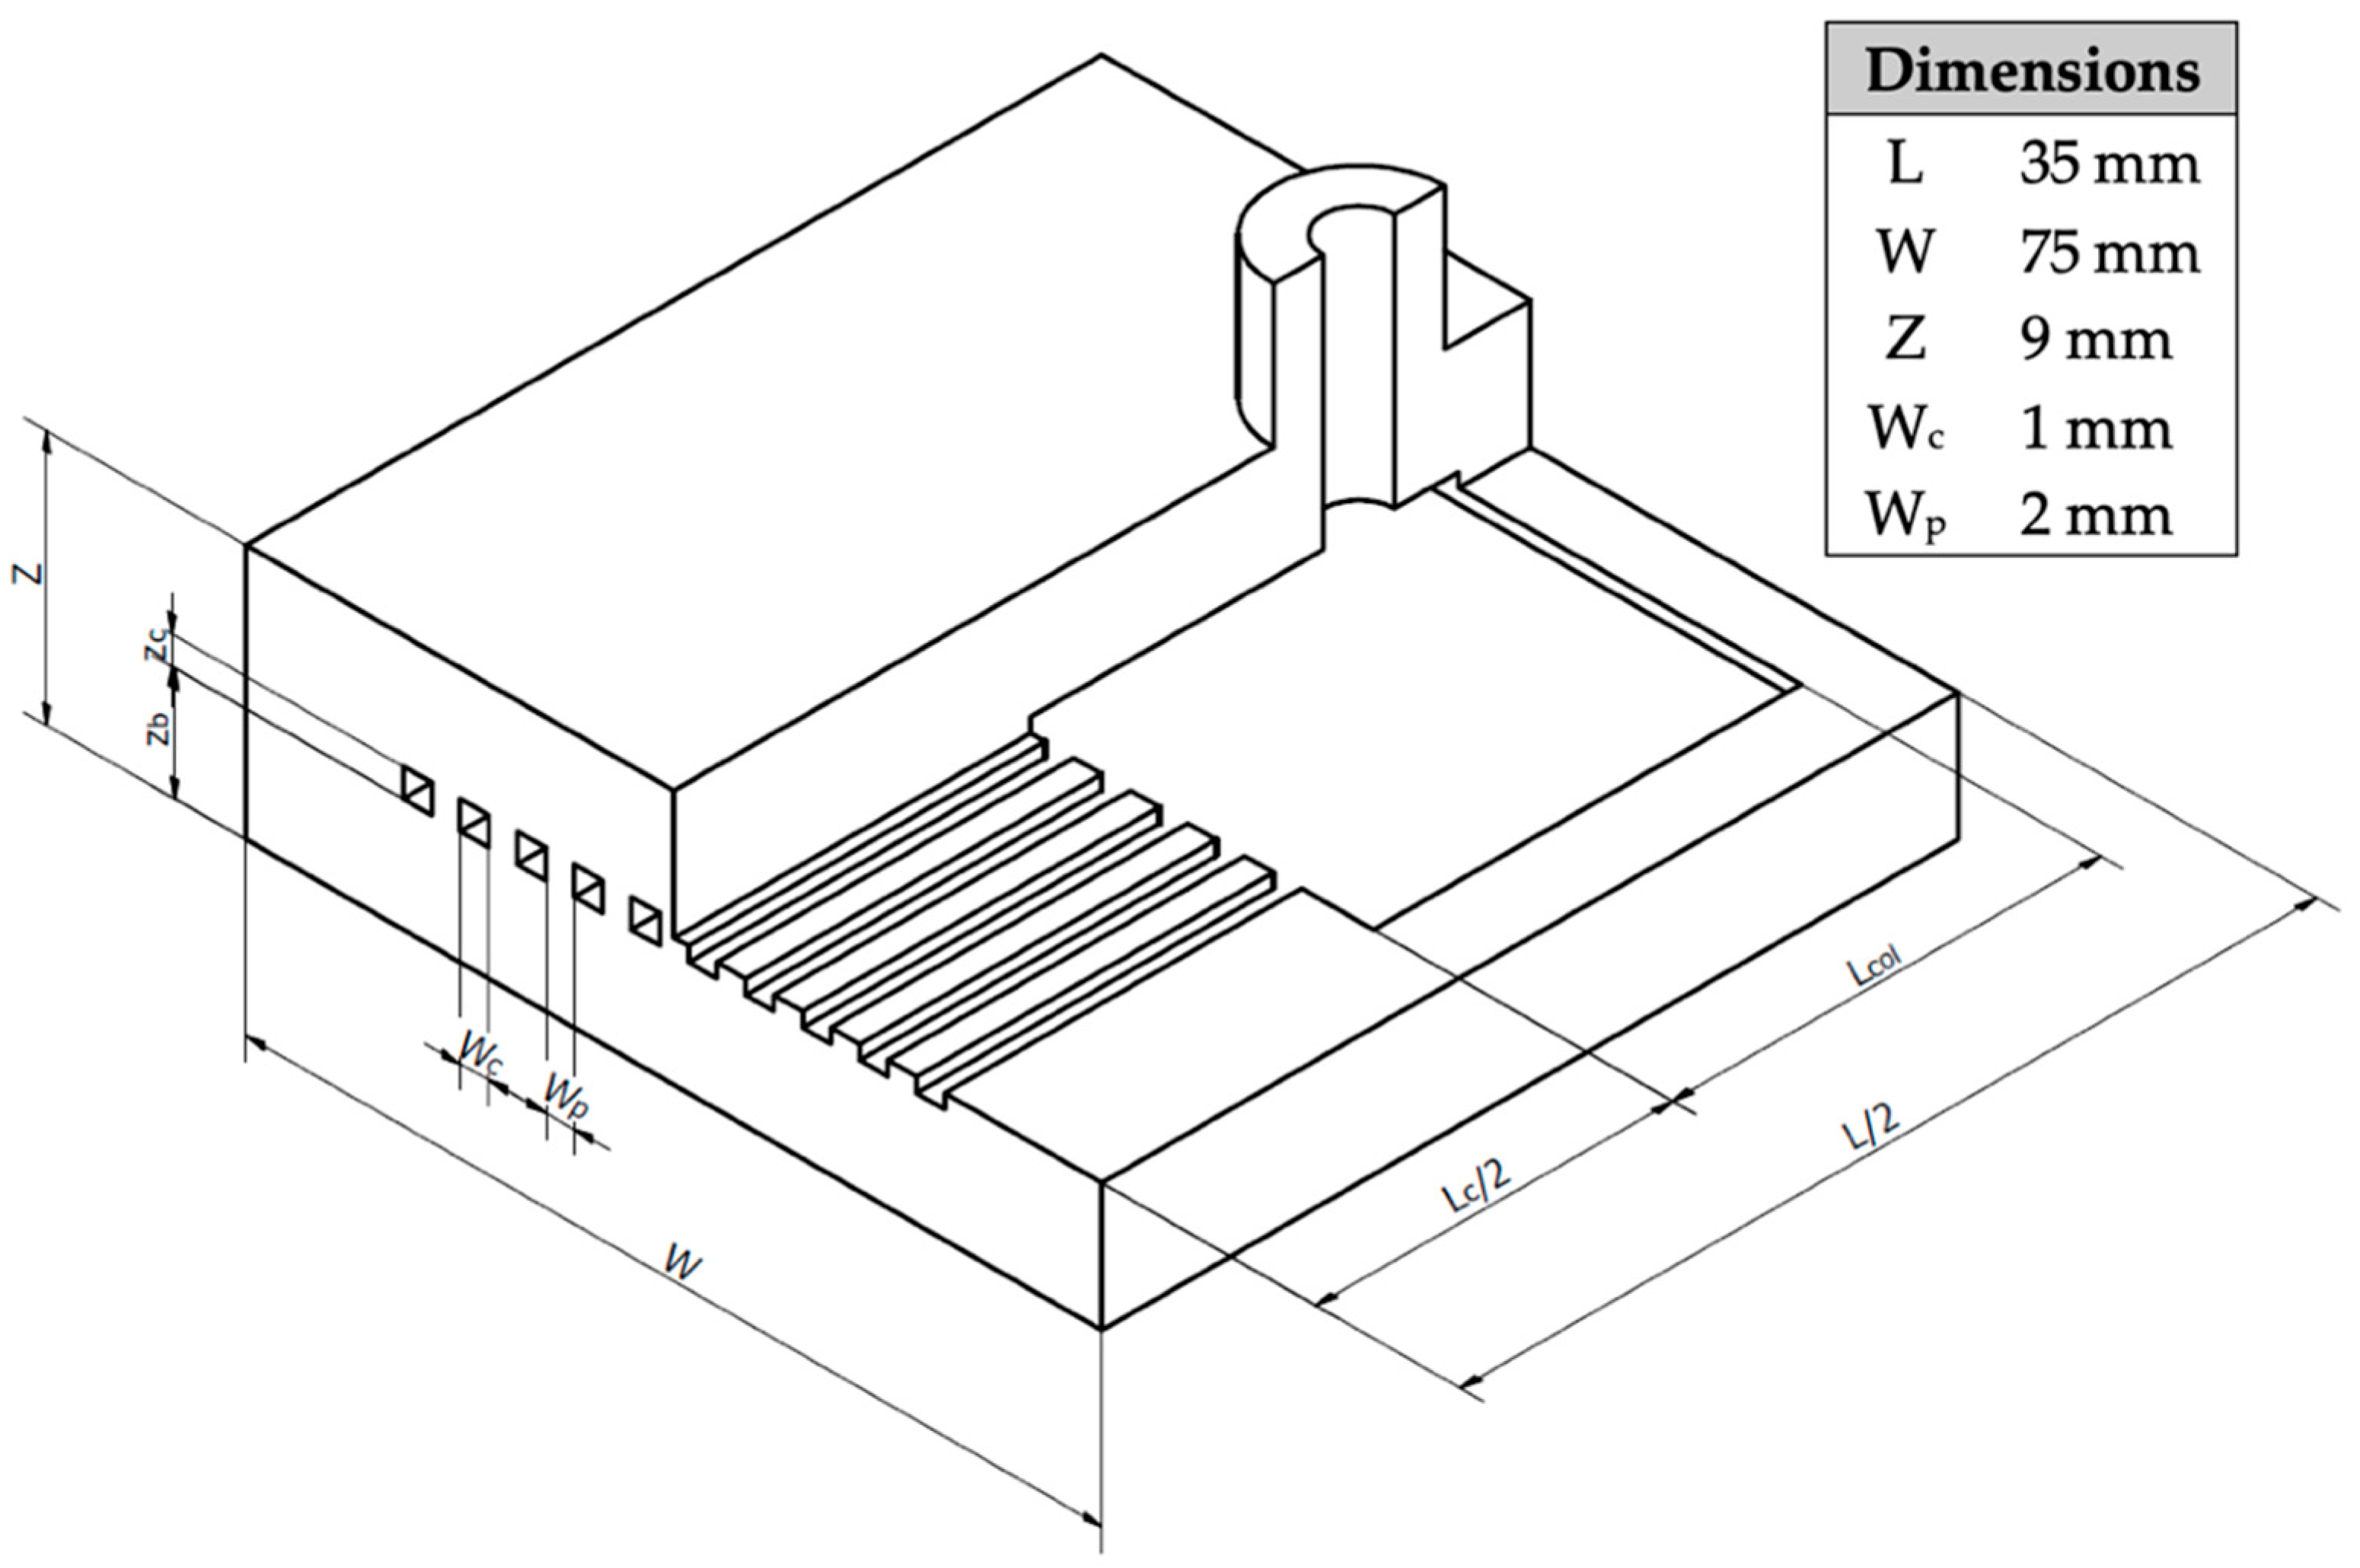
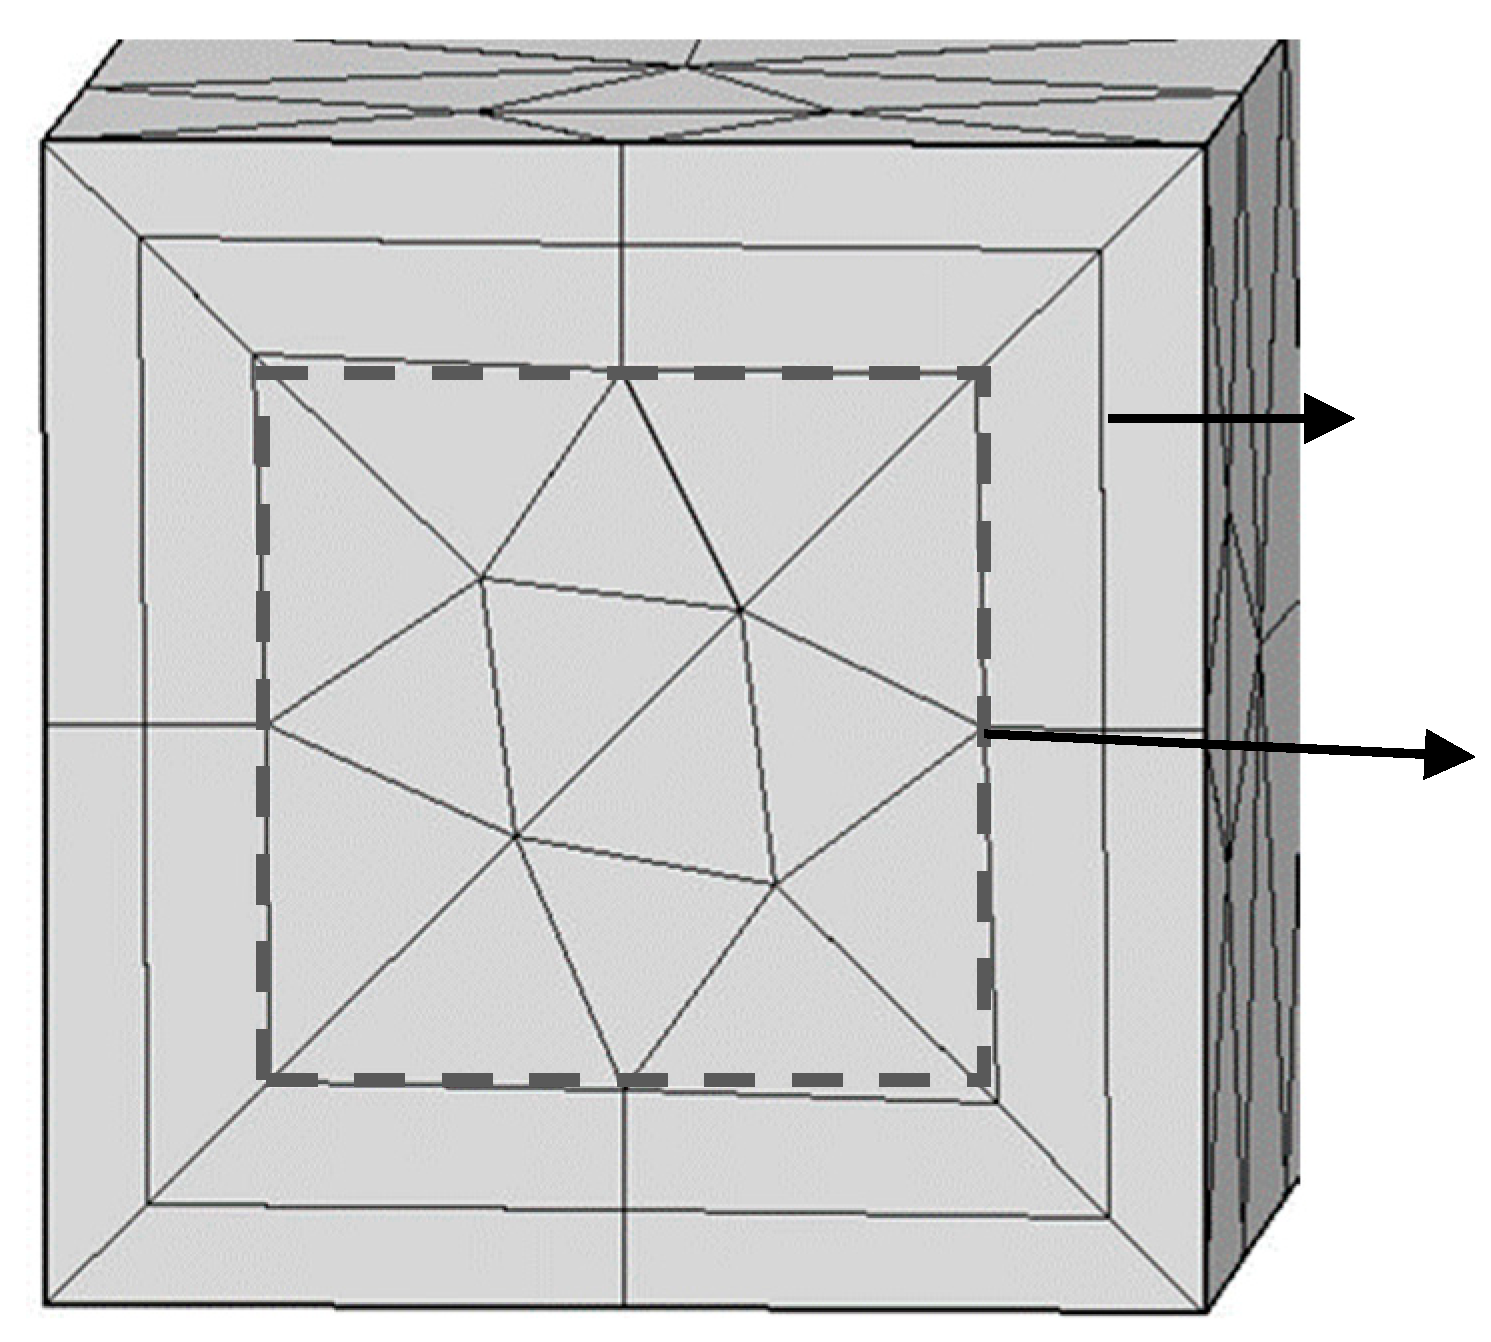
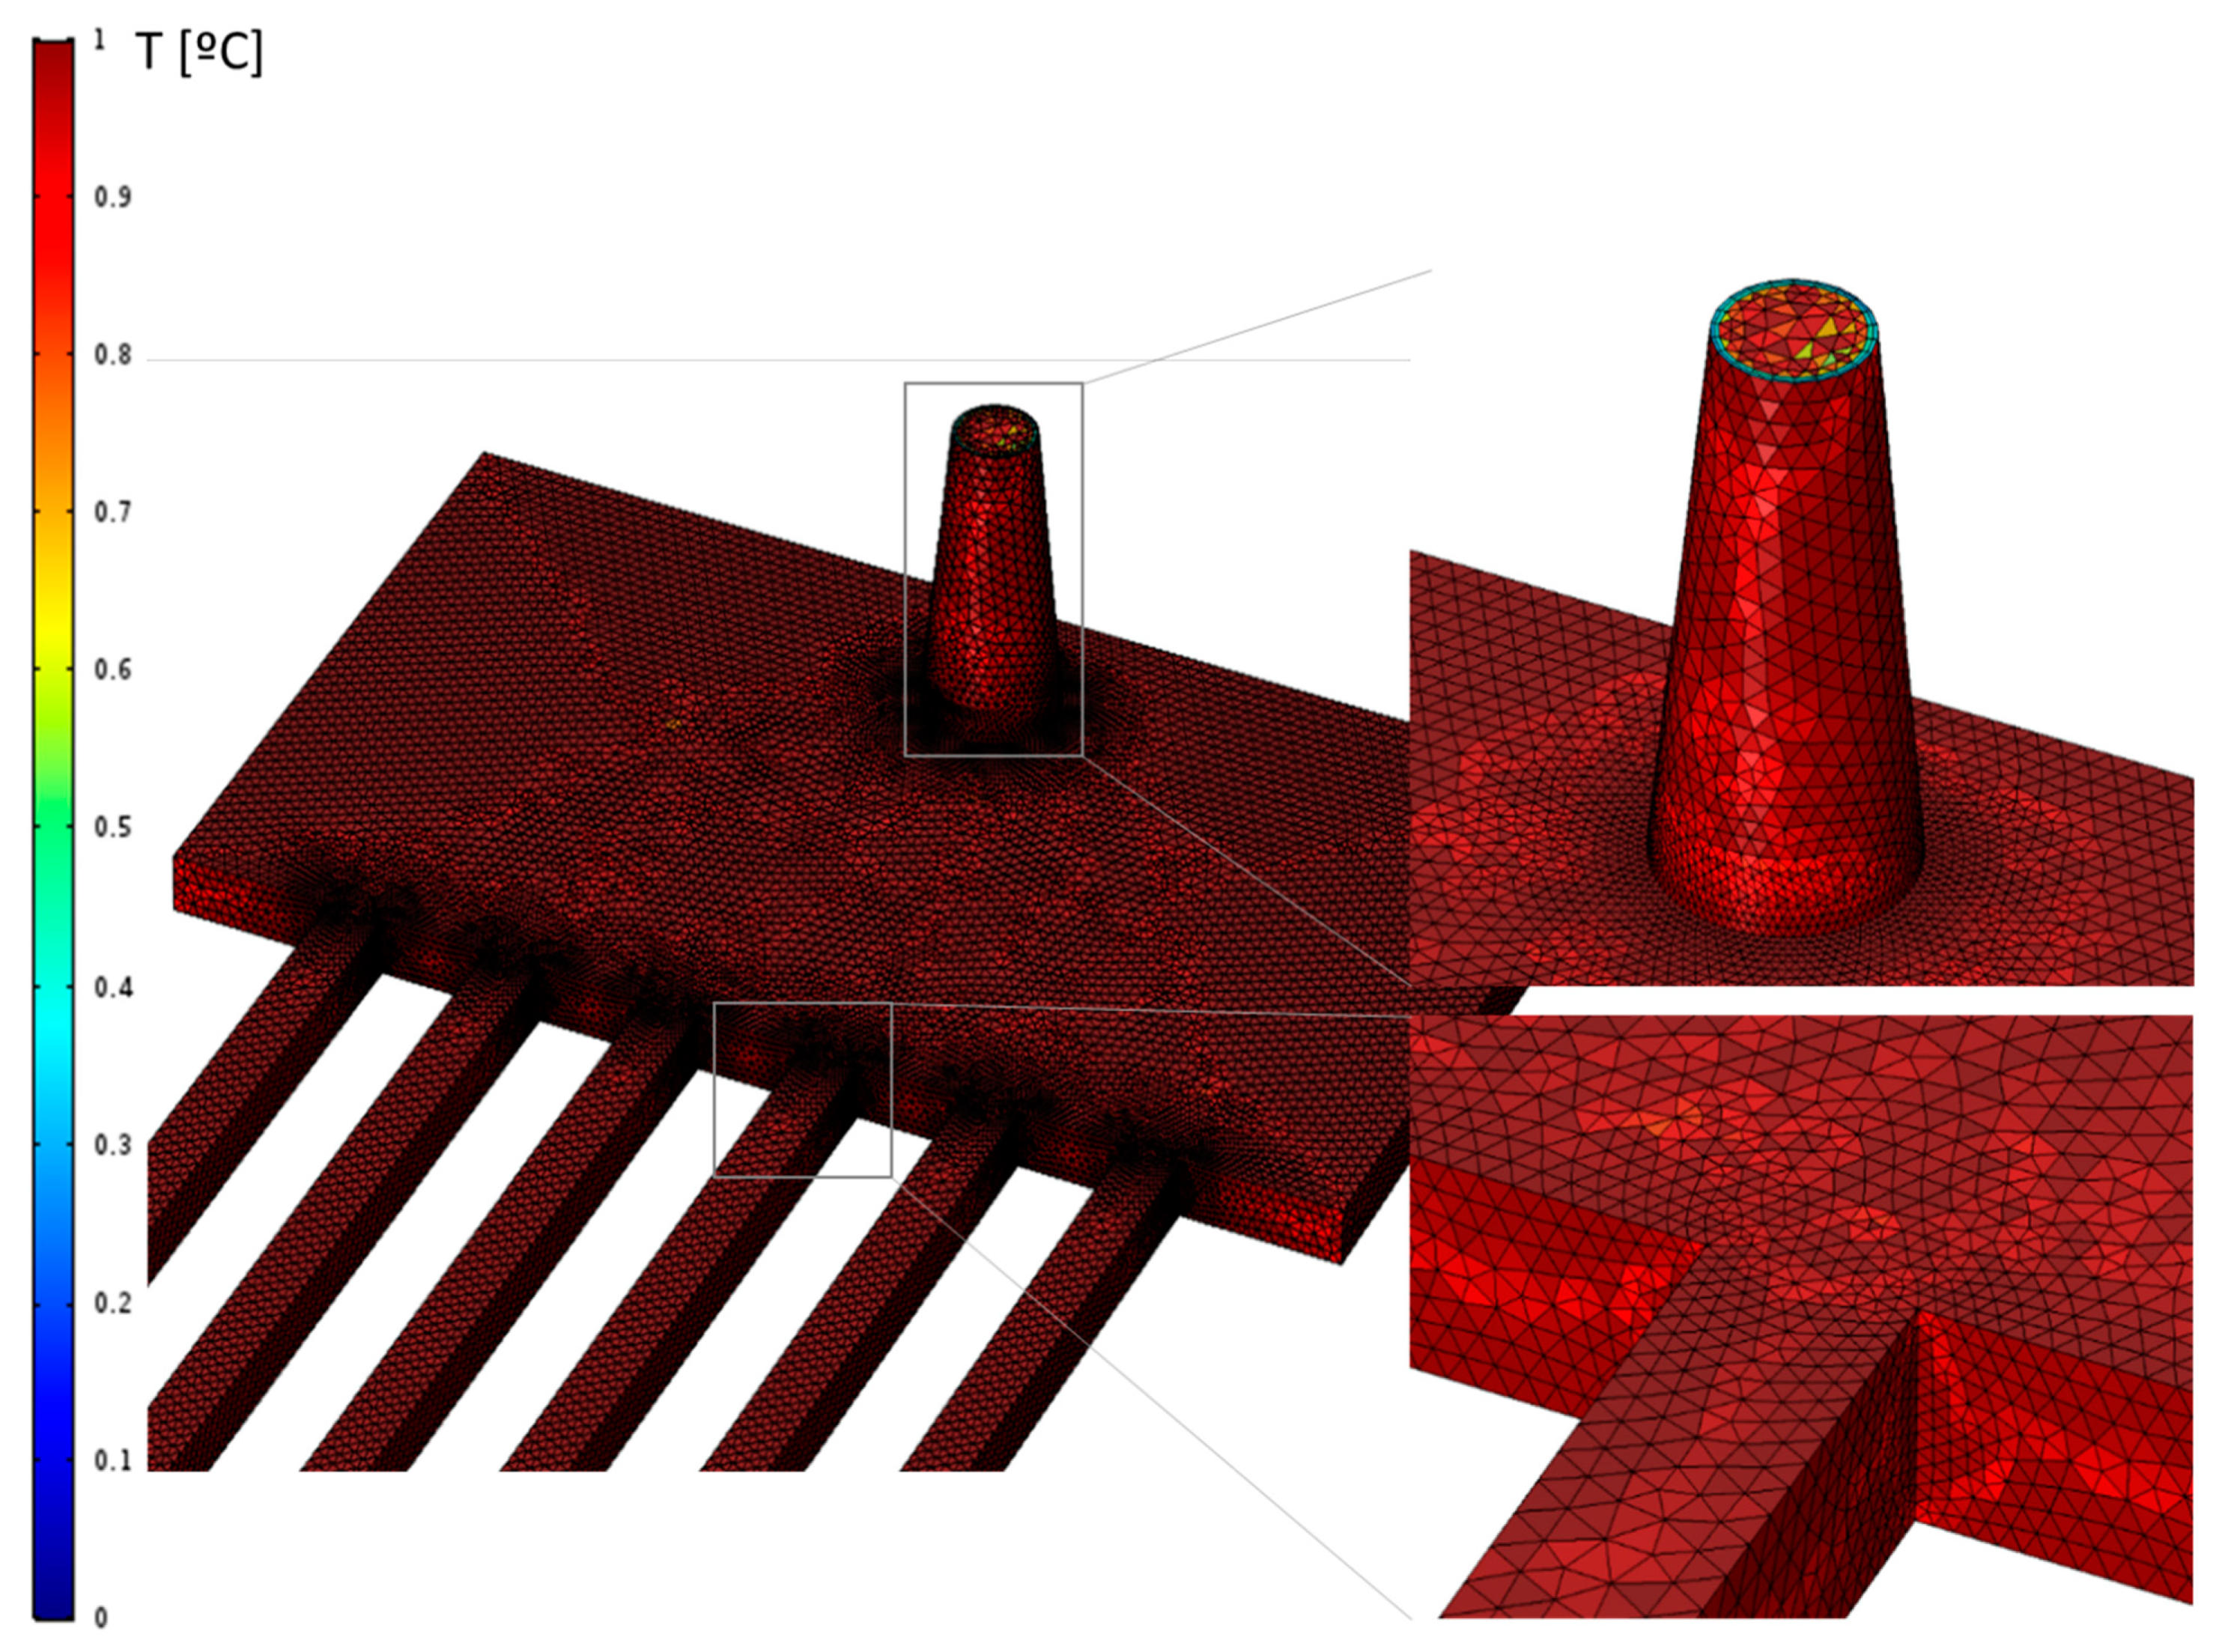
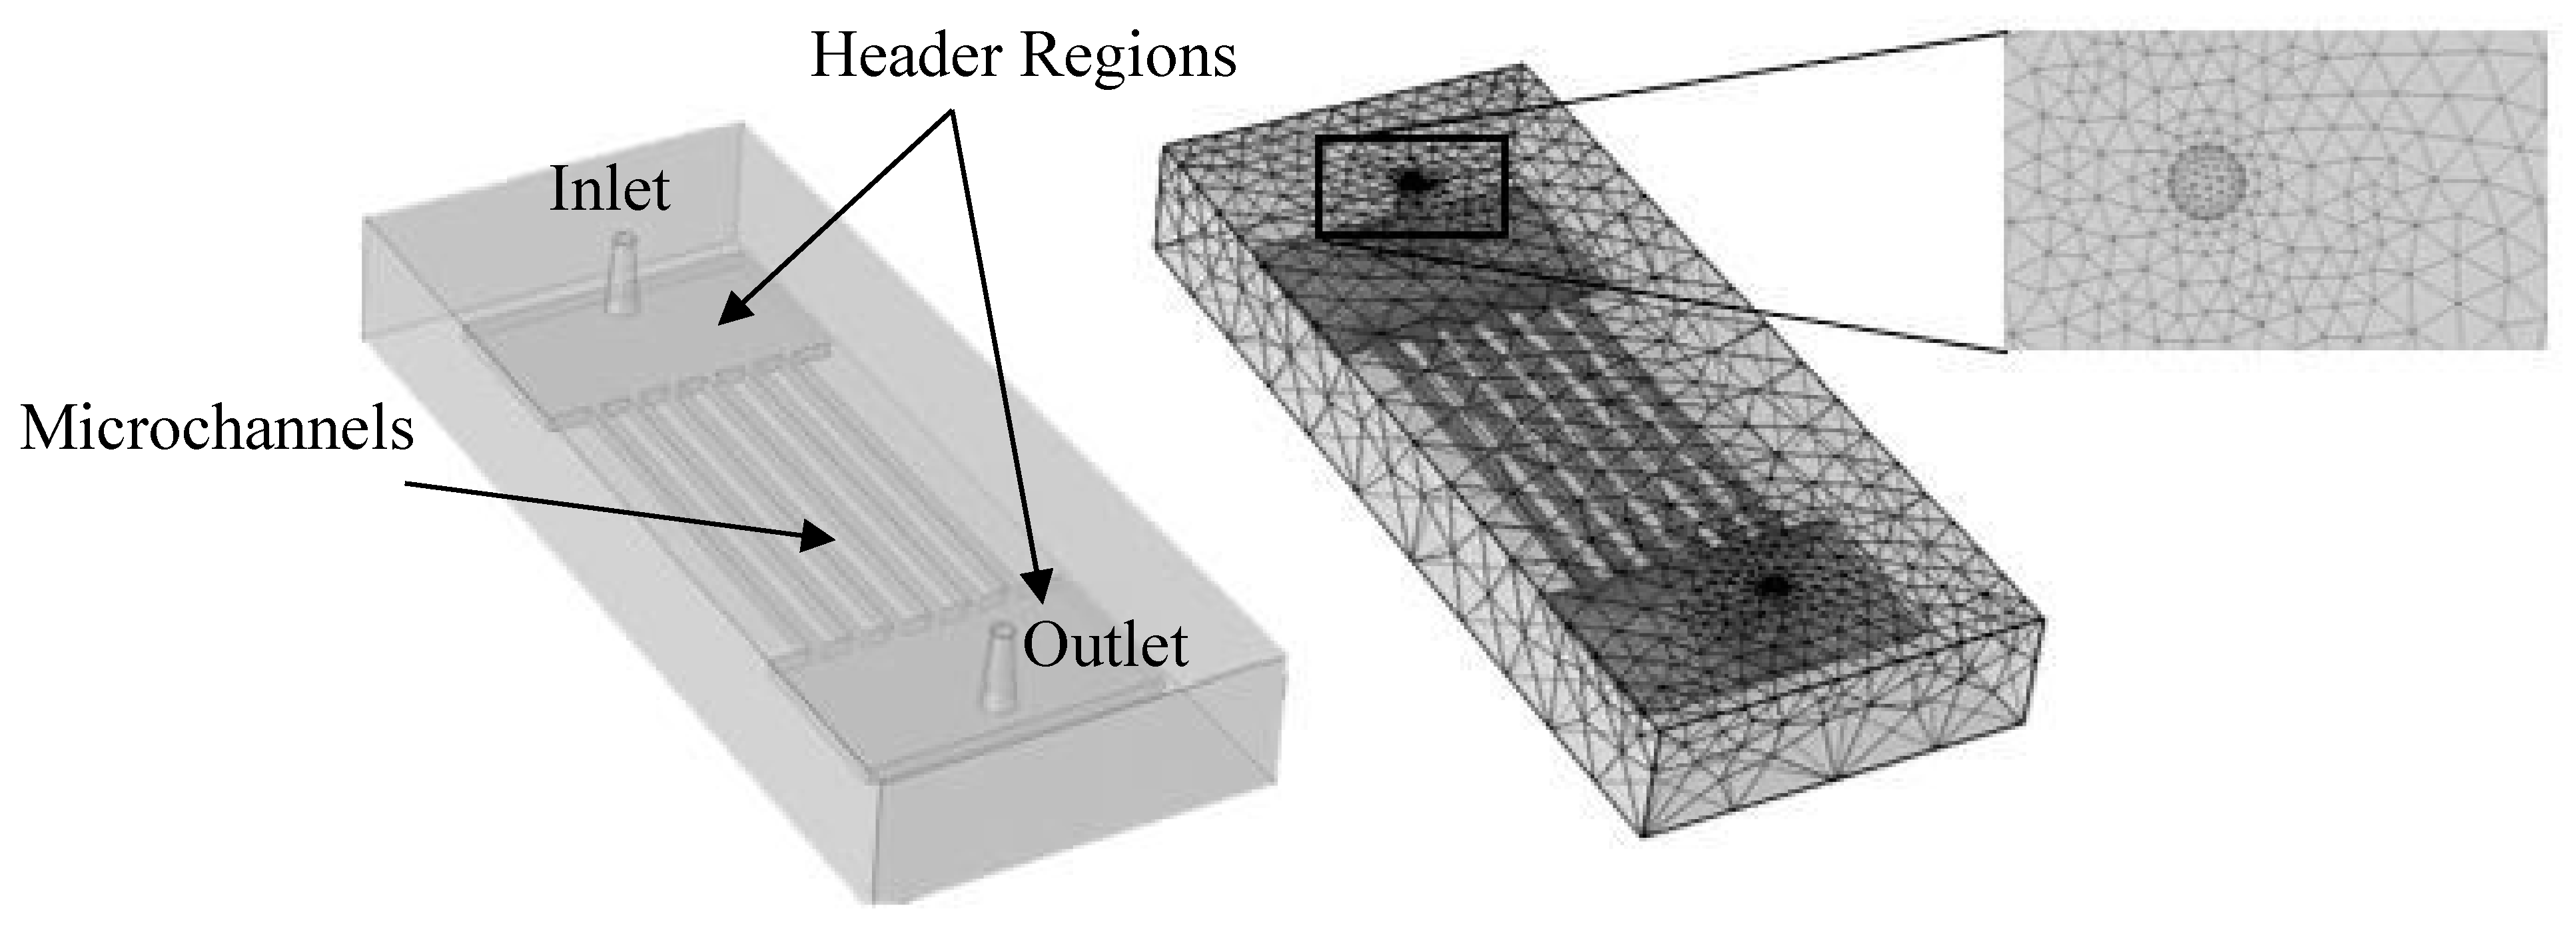
2.2. Geometry, Computational Domain and Mesh

The geometry used for the simulation corresponds to the geometry of the master mold used to make the microchannels device for experimental purposes. This device, together with the supporting experimental setup, isdescribed by [26]. Briefly, the polydimethylsiloxane (PDMS), which is a very suitable material for replica molding, was inserted into the acrylonitrile–butadiene–styrene (ABS) 3D-printed mold to cure in the shape of the mold depicted in Figure 1. After the curing period of the PDMS, the ABS mold was dissolved in an acetone bath, and finally we obtained the cleaned PDMS microfluidic heat sink. The dimensions of the master mold were also used for the COMSOL Multiphysics 5.6®software simulations.
The mesh of the fluid domain was tuned for the flow studies, i.e., besides the tetrahedral elements that composed the majority of the mesh, a shell was created near the walls to enhance the reliability of the results in those regions [27], as shown in Figure 2.
To optimize the dimension of the elements, and thus the quality of the mesh, a preliminary convergence study was performed through sequentially increasing the number of mesh elements until reaching saturation. An evaluation parameter developed by the COMSOL Multiphysics 5.6®commercial software was used to evaluate the quality of the mesh. The value ranges between 0 and 1 depending on the proximity between the mesh elements. An ideal element has thevalue 1, while the value is 0 for a completely distorted element. A mesh is considered acceptable when this parameter is above 0.1 [28]. Details of the mesh quality and other mesh characteristics are presented in Table 1.
The average quality of the mesh elements was around 0.6–0.7, which was a good indicator of the reliability of the mesh. Some regions were critical, namely, the inlet and outlet regions, as they have a shell too thin for their diameter. The region where the collector transitions to the microchannels was also found to be troublesome. The details are provided in Figure 3. Tests were performed to evaluate the mesh’s performance. The flow rate in a given channel was calculated for the four meshes, and the result for the A4 mesh was shown to be similar to that for mesh A3. As the simulation time and the average quality of the elements were shown to be acceptable, mesh A4 was selected for the flow distribution uniformity (FDU) simulation.
In contrast to the flow distribution uniformity simulation, for heat transfer purposes, the entire dissipator had to be represented as a whole. Accordingly, the geometry had to include the PDMS channels’ surroundings and their hollow region to allow the generation of distinct domains and different simulation modules in each one of them, as seen in Figure 4.
The mesh comprises different regions, namely, the zone where the fluid flows, the solid region around that zone, and a localized transition in the boundary between both. The presence of two distinct domains requires the definition of the connection between them, specifying the means of contact (a union in this case). In this way, the temperature changes continuously across the domain boundaries. An adaptation of the mesh to create a transition region on the inlet surface can be noted in Figure 4.
The mesh with the best results in the convergence study was kept, and only one convergence study in the solid domain was performed, using the same points mentioned on the previous study. Details of the mesh are presented in Table 2.
Mesh tests were also performed to select the best mesh for the heat transfer studies. The outlet temperature was calculated using the different meshes. The outlet temperature becomes independent of the mesh for meshes B5 and denser. Thus, the mesh B5 was selected, since the average quality of the elements is reasonably acceptable, and the mesh tests also demonstrated that a mesh with a higher number of elements will not strongly influence the final result of the simulation. Consequently, choosing the B5 mesh will also minimize the computational cost.

2.3. Fluid and Solid Properties

The numerical simulation required the setting of the properties of the fluid and solid domains associated with the flow and heat transport, as summarized in Table 3 [29]. All properties are taken for a temperature of 20 °C, i.e., the temperature at the beginning of the study. Although those properties were temperature-dependent, they were considered constant for simplification purposes. Nanofluids are stable fluids with well-defined bulk properties, and the characteristic size of the nanoparticles does not affect the continuous mean hypothesis, such that Navier–Stokes equations are valid and can be used to model this kind of flow.

2.4. Boundary Conditions

The boundary conditions (BC) used in the present simulation for all the heat sink configurations are summarized in Table 4.
The inlet is the region where the fluid enters into the fluid domain, and it has the inlet mass flow rate as a boundary condition. Since the flow rate was one of the studied parameters, a parametric variable was used, and a systematic study was performed, for a range of flows from 1 to 100 mL/min. The choice of this range of values enabled predictions for flows above the range used in experimental tests. The flow was always laminar, as its maximum Reynolds number was 293, which was within the limits of the laminar regime for internal flow [30]. At the outlet, the pressure was set to zero since at the exit, the fluid is drained to the atmosphere. The no-slip conditions were applied to the inner walls of the microchannels. In the heat transport studies, the boundary conditions for the external surfaces of the PDMS block needed to be considered. Regarding the real function of the heat source (controller associated with the temperature variable) of ensuring a changeable heat flux in order to maintain a constant temperature, the temperature of the bottom surface of the PDMS block was fixed at 60 °C. The side walls and faces of the surrounding PDMS were defined as adiabatic boundaries, which means that no heat will be transferred through them. For the fluid domain, the inlet temperature was set to 20 °C and at the outlet the temperature gradient was set to zero.

2.5. Data Evaluation

After the numerical computation, the flow rate in each microchannel was calculated by velocity integration. In addition, the standardized flow rate, that is, the ratio between the flow rate at channel iqiand the mean flow rateqmed, was calculated, enabling the comparison of the flow rate distribution’s uniformity within different geometries. An example can be seen in Figure 5, where a higher flow is responsible for the concentration of the flow in the central microchannels, which are aligned with the inlet, showing an effect of the inertia of the fluid on the FDU coefficient S.
The FDUcoefficient, S, can be calculated by Equation (6):
S   =   i   =   1 N ( q i q ¯ ) 2 N
where q ¯ is the mean flow rate, q i the flow rate in the microchannel i, and N is the total number of microchannels of the device. A higher S means a lower flow distribution uniformity, and vice-versa. The temperature was determined in the fluid and solid domains. The temperature evolution throughout the complete pathway of the working fluid was analyzed, from the collectors to the individual channels, allowing for the evaluation of the impact of the FDU on temperature distribution.
Figure 6 shows two cases that enable the analysis of the effect of the flow rate on the temperature field of the device. As can be seen, for lower flow rates (Figure 6a), higher temperatures are globally attained, resulting in a lower heat removal. This type of representation improves the understanding of the heat transport phenomena in the device. For example, a study of the evolution of the temperature in the different channels can also be useful for understanding how FDU affects temperature.
The results presented in Figure 7 highlight a variation in the registered temperatures of the channels. They show some symmetry, with a smaller temperature difference for the central channels and a greater difference with distance from the centralaxis.
This profile can be explained with the help of the flow trajectories, depicted in Figure 8, where it can be seen thatthe fluid coming from the inlet disperses in all the directions. Therefore, the fluid that crosses the central channels originates directly from the jet, while the external channels receive fluid that has covered a greater distance since it comes from the rear of the collector. The temperature profile will possibly be influencedby the same phenomena that occur in Figure 6, only on a smaller scale.

3. Results and Discussion

In this section, the results obtained will be presented and discussed. Firstly, a comparison between numerical and previously performed experimental tests will be discussed, followed by the analysis of the influence of the geometry on flow distribution and heat transfer.

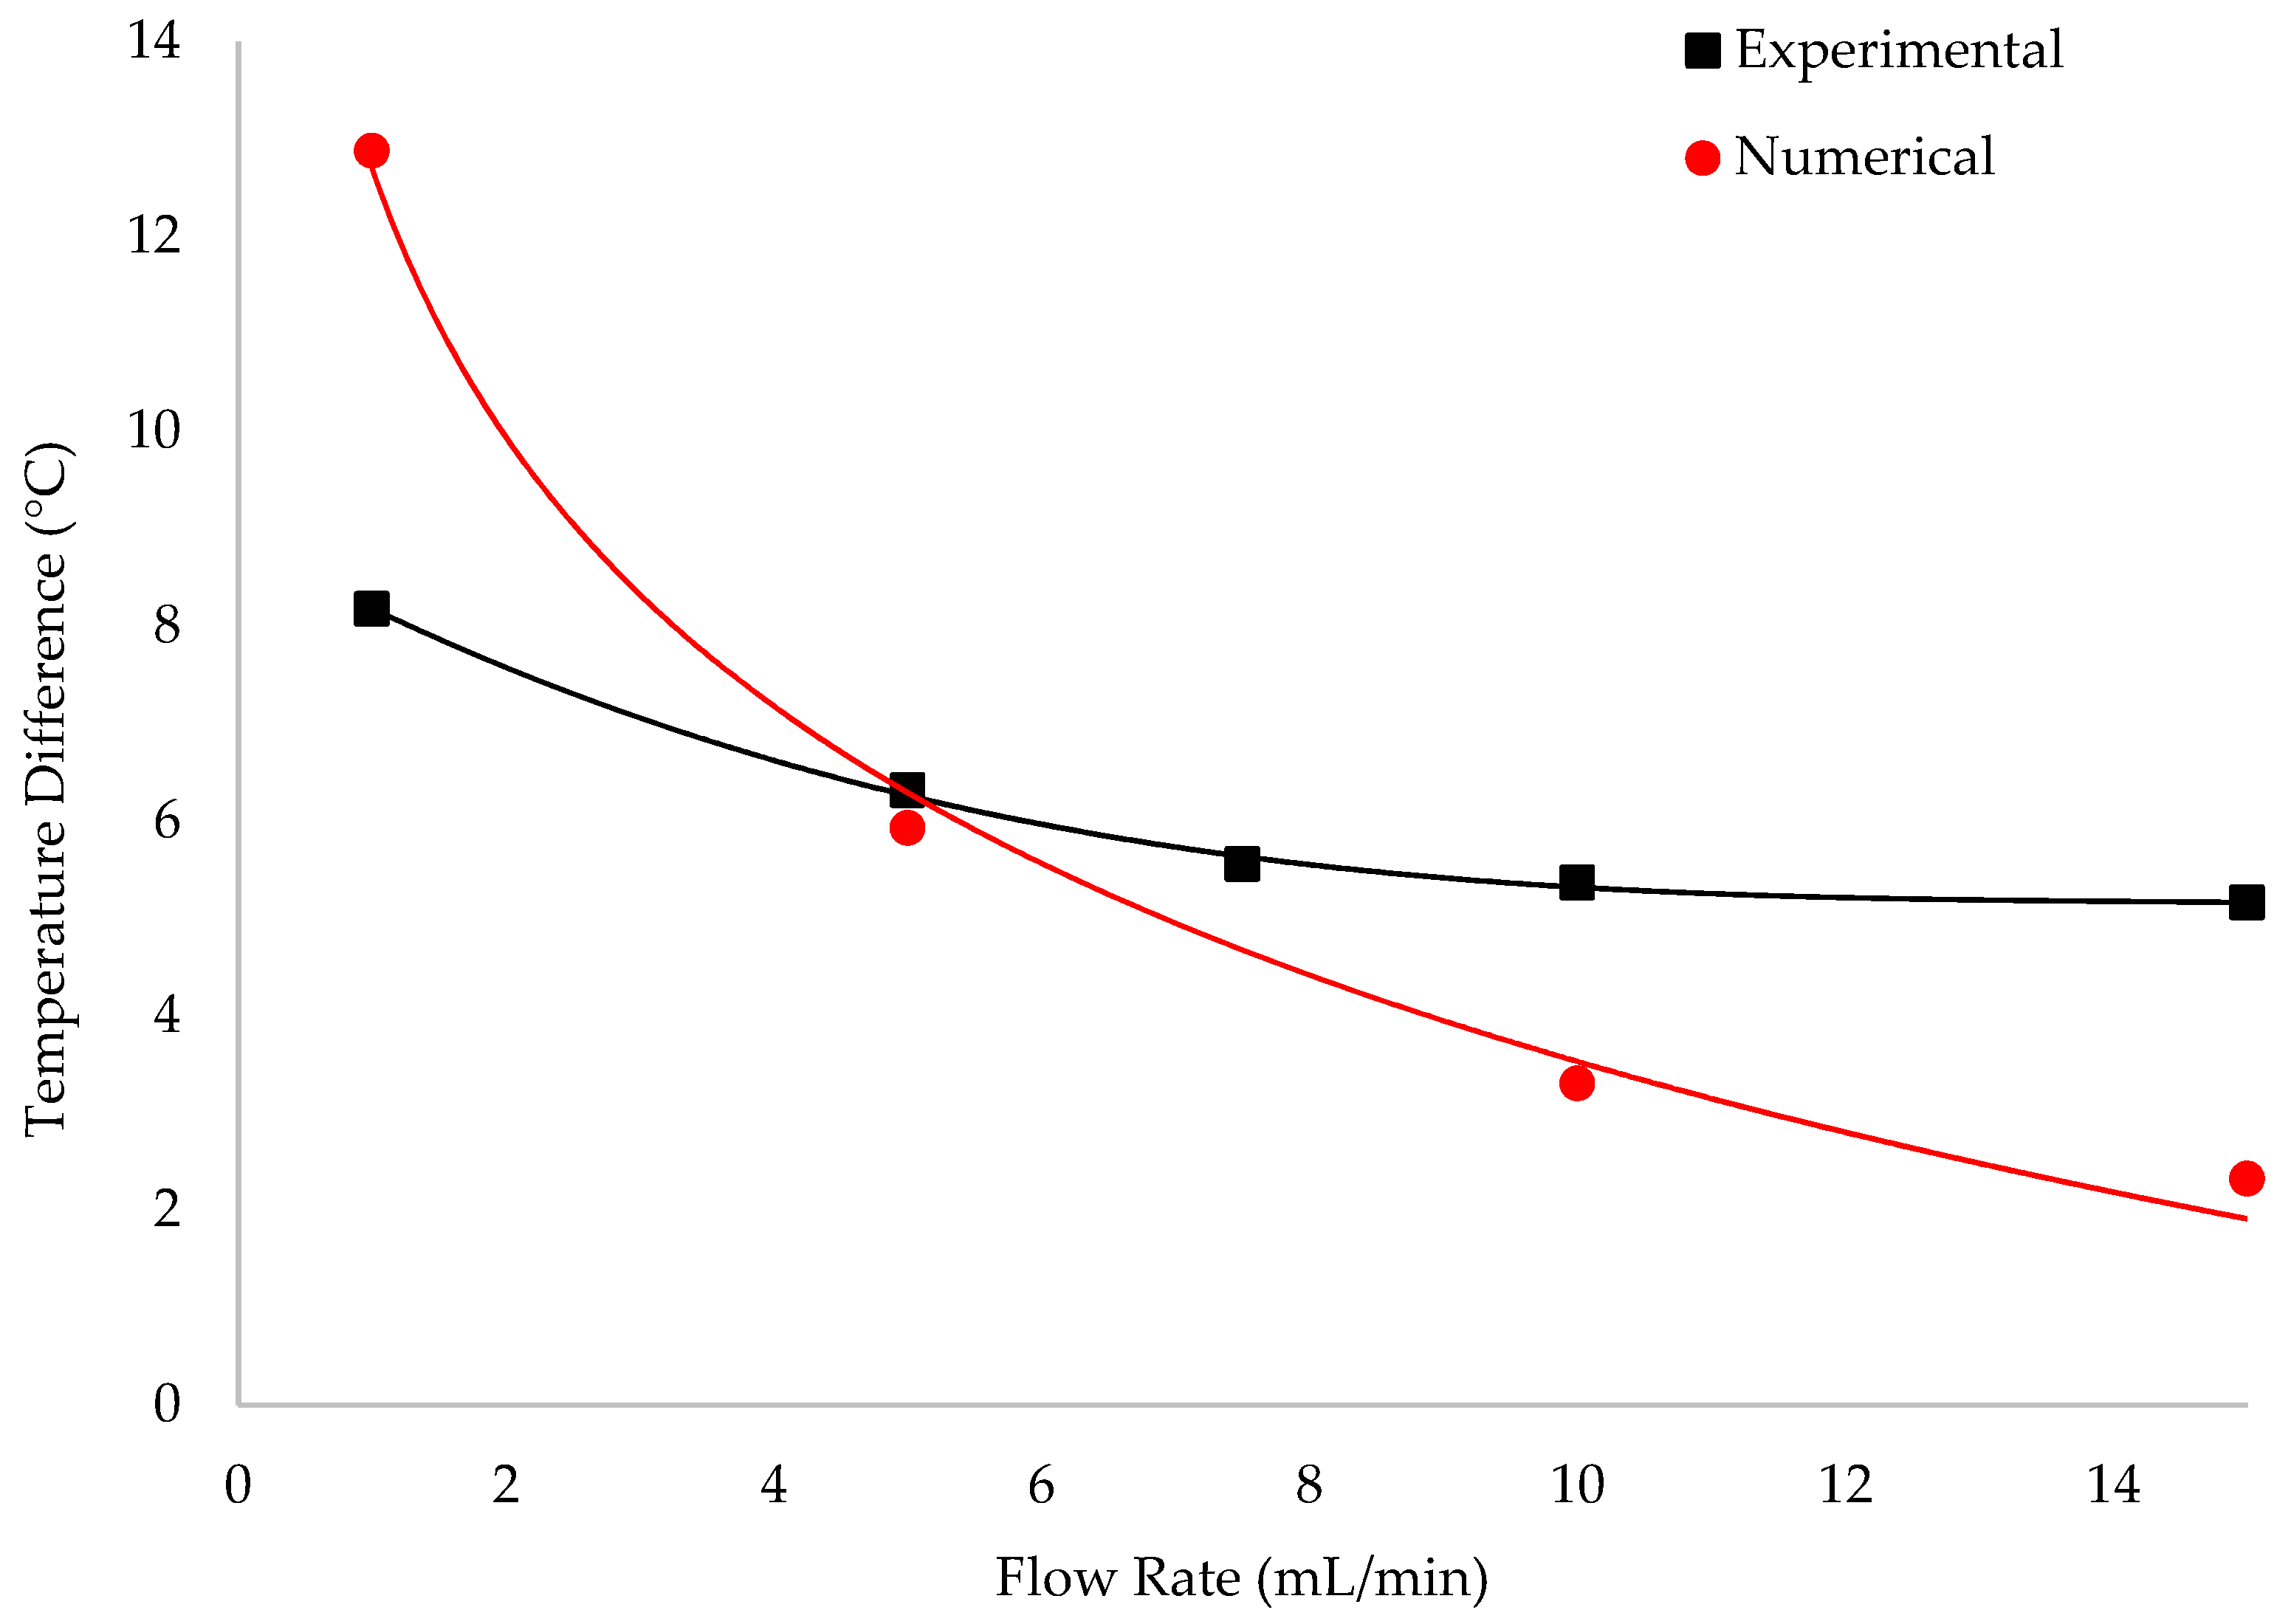
3.1. Comparison between the Numerical and the Experimental Results

A comparative analysis of the numerical and experimental results of temperature difference was performedin order to validate and optimize the numerical model. The experimental results reproduced here as well as the details of the experimental test set-up can be found in [26]. As shown in Figure 9, the temperature differences deviate from the experimental results for the same geometry, and the temperature was measured in similar positions.
The discrepancies observed (for instance, the fact that the temperature difference is about 5 °C higher for the numerical simulation under low flow rates) could be explained by the simplifications in the numerical model, such as in the boundary conditions. For instance, in the numerical simulation, considering the side walls as adiabatic could have contributed to an enhanced heat flux fraction. The flow is adiabatic, which is a reasonably good approximation given the range of temperatures and the small variation in the enthalpy.
In addition, factorssuch as not considering the contact resistances in the numerical model could have promoted the increase in the discrepancies. Similarly, the experimental assays also have associated errors that contribute to the increase in the uncertainty interval.

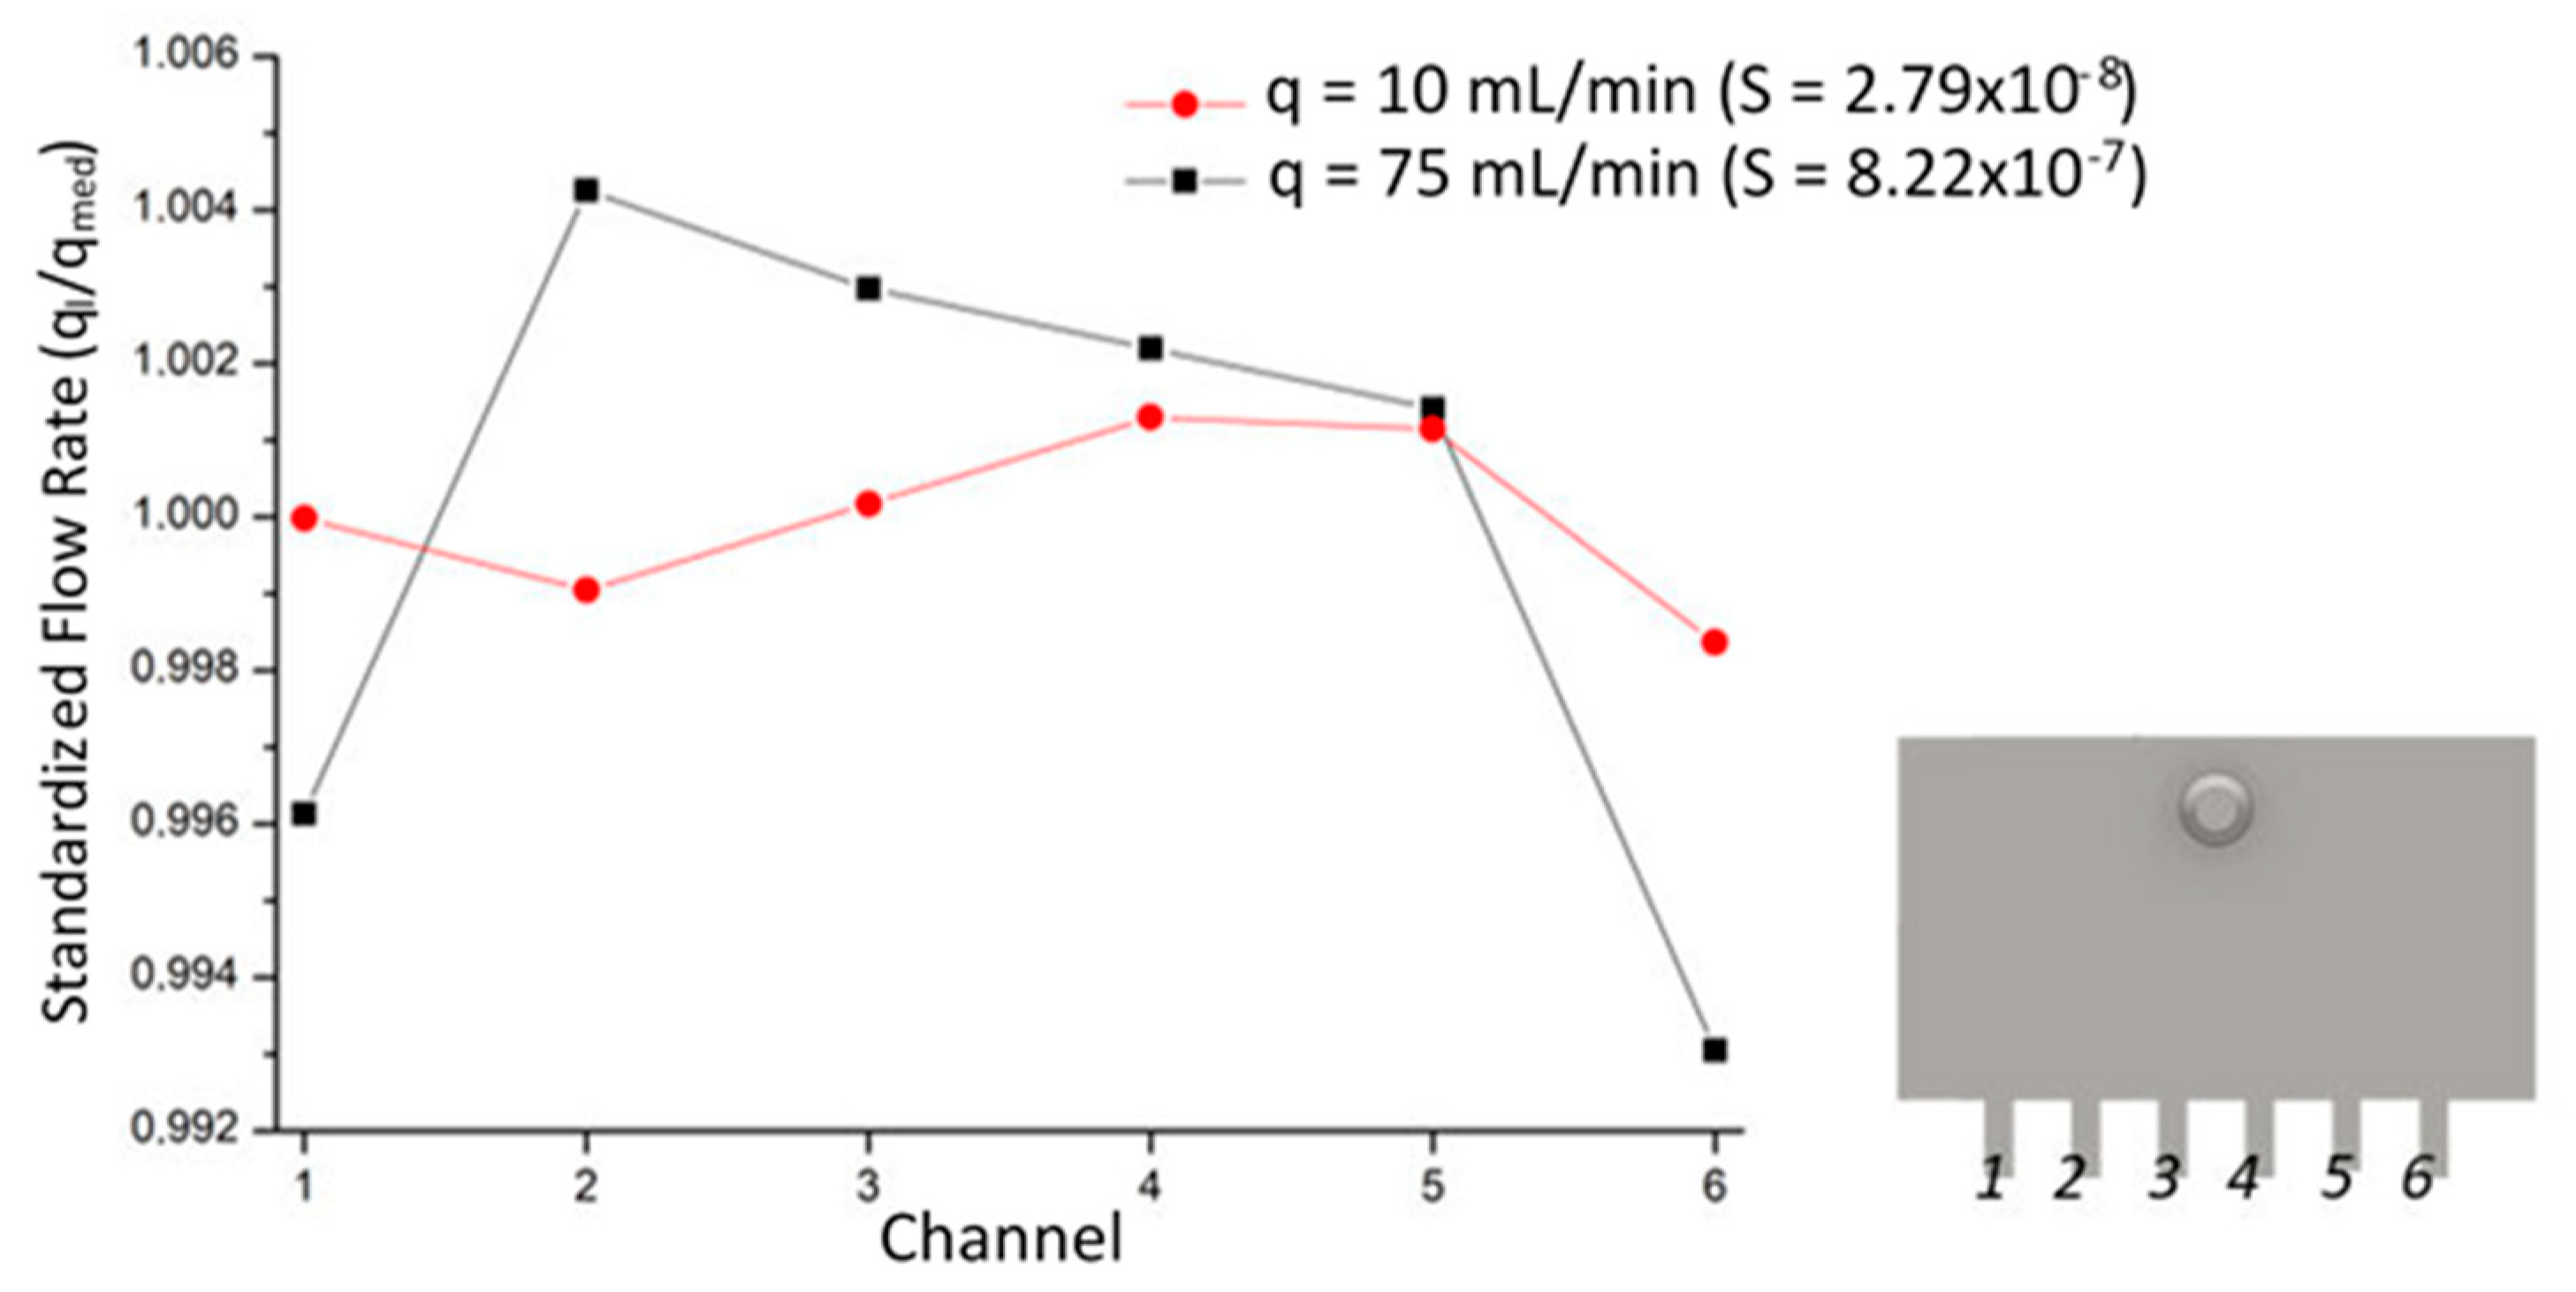
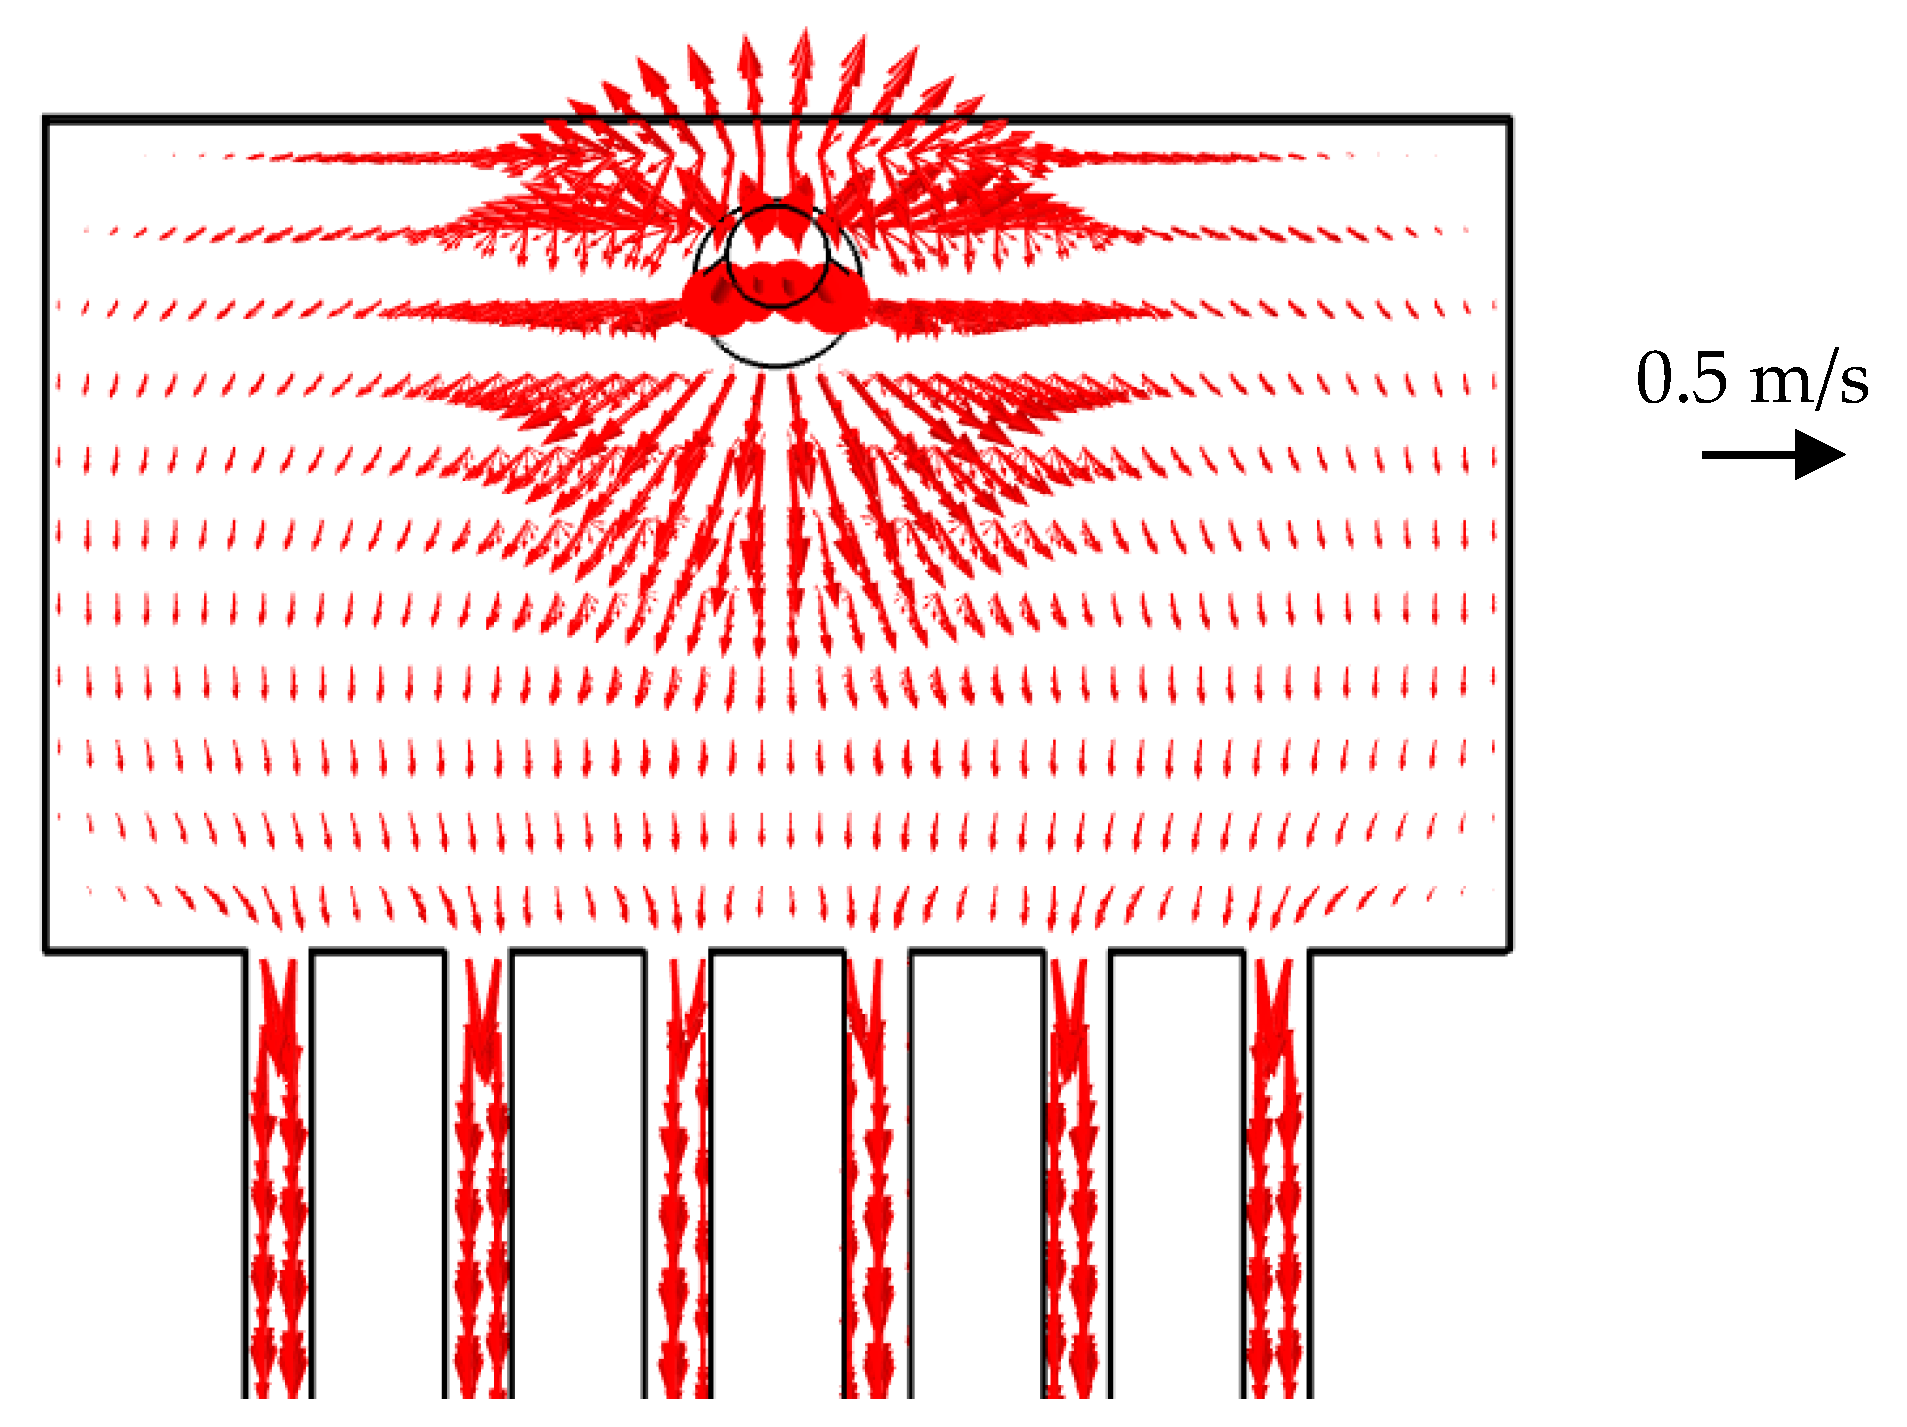
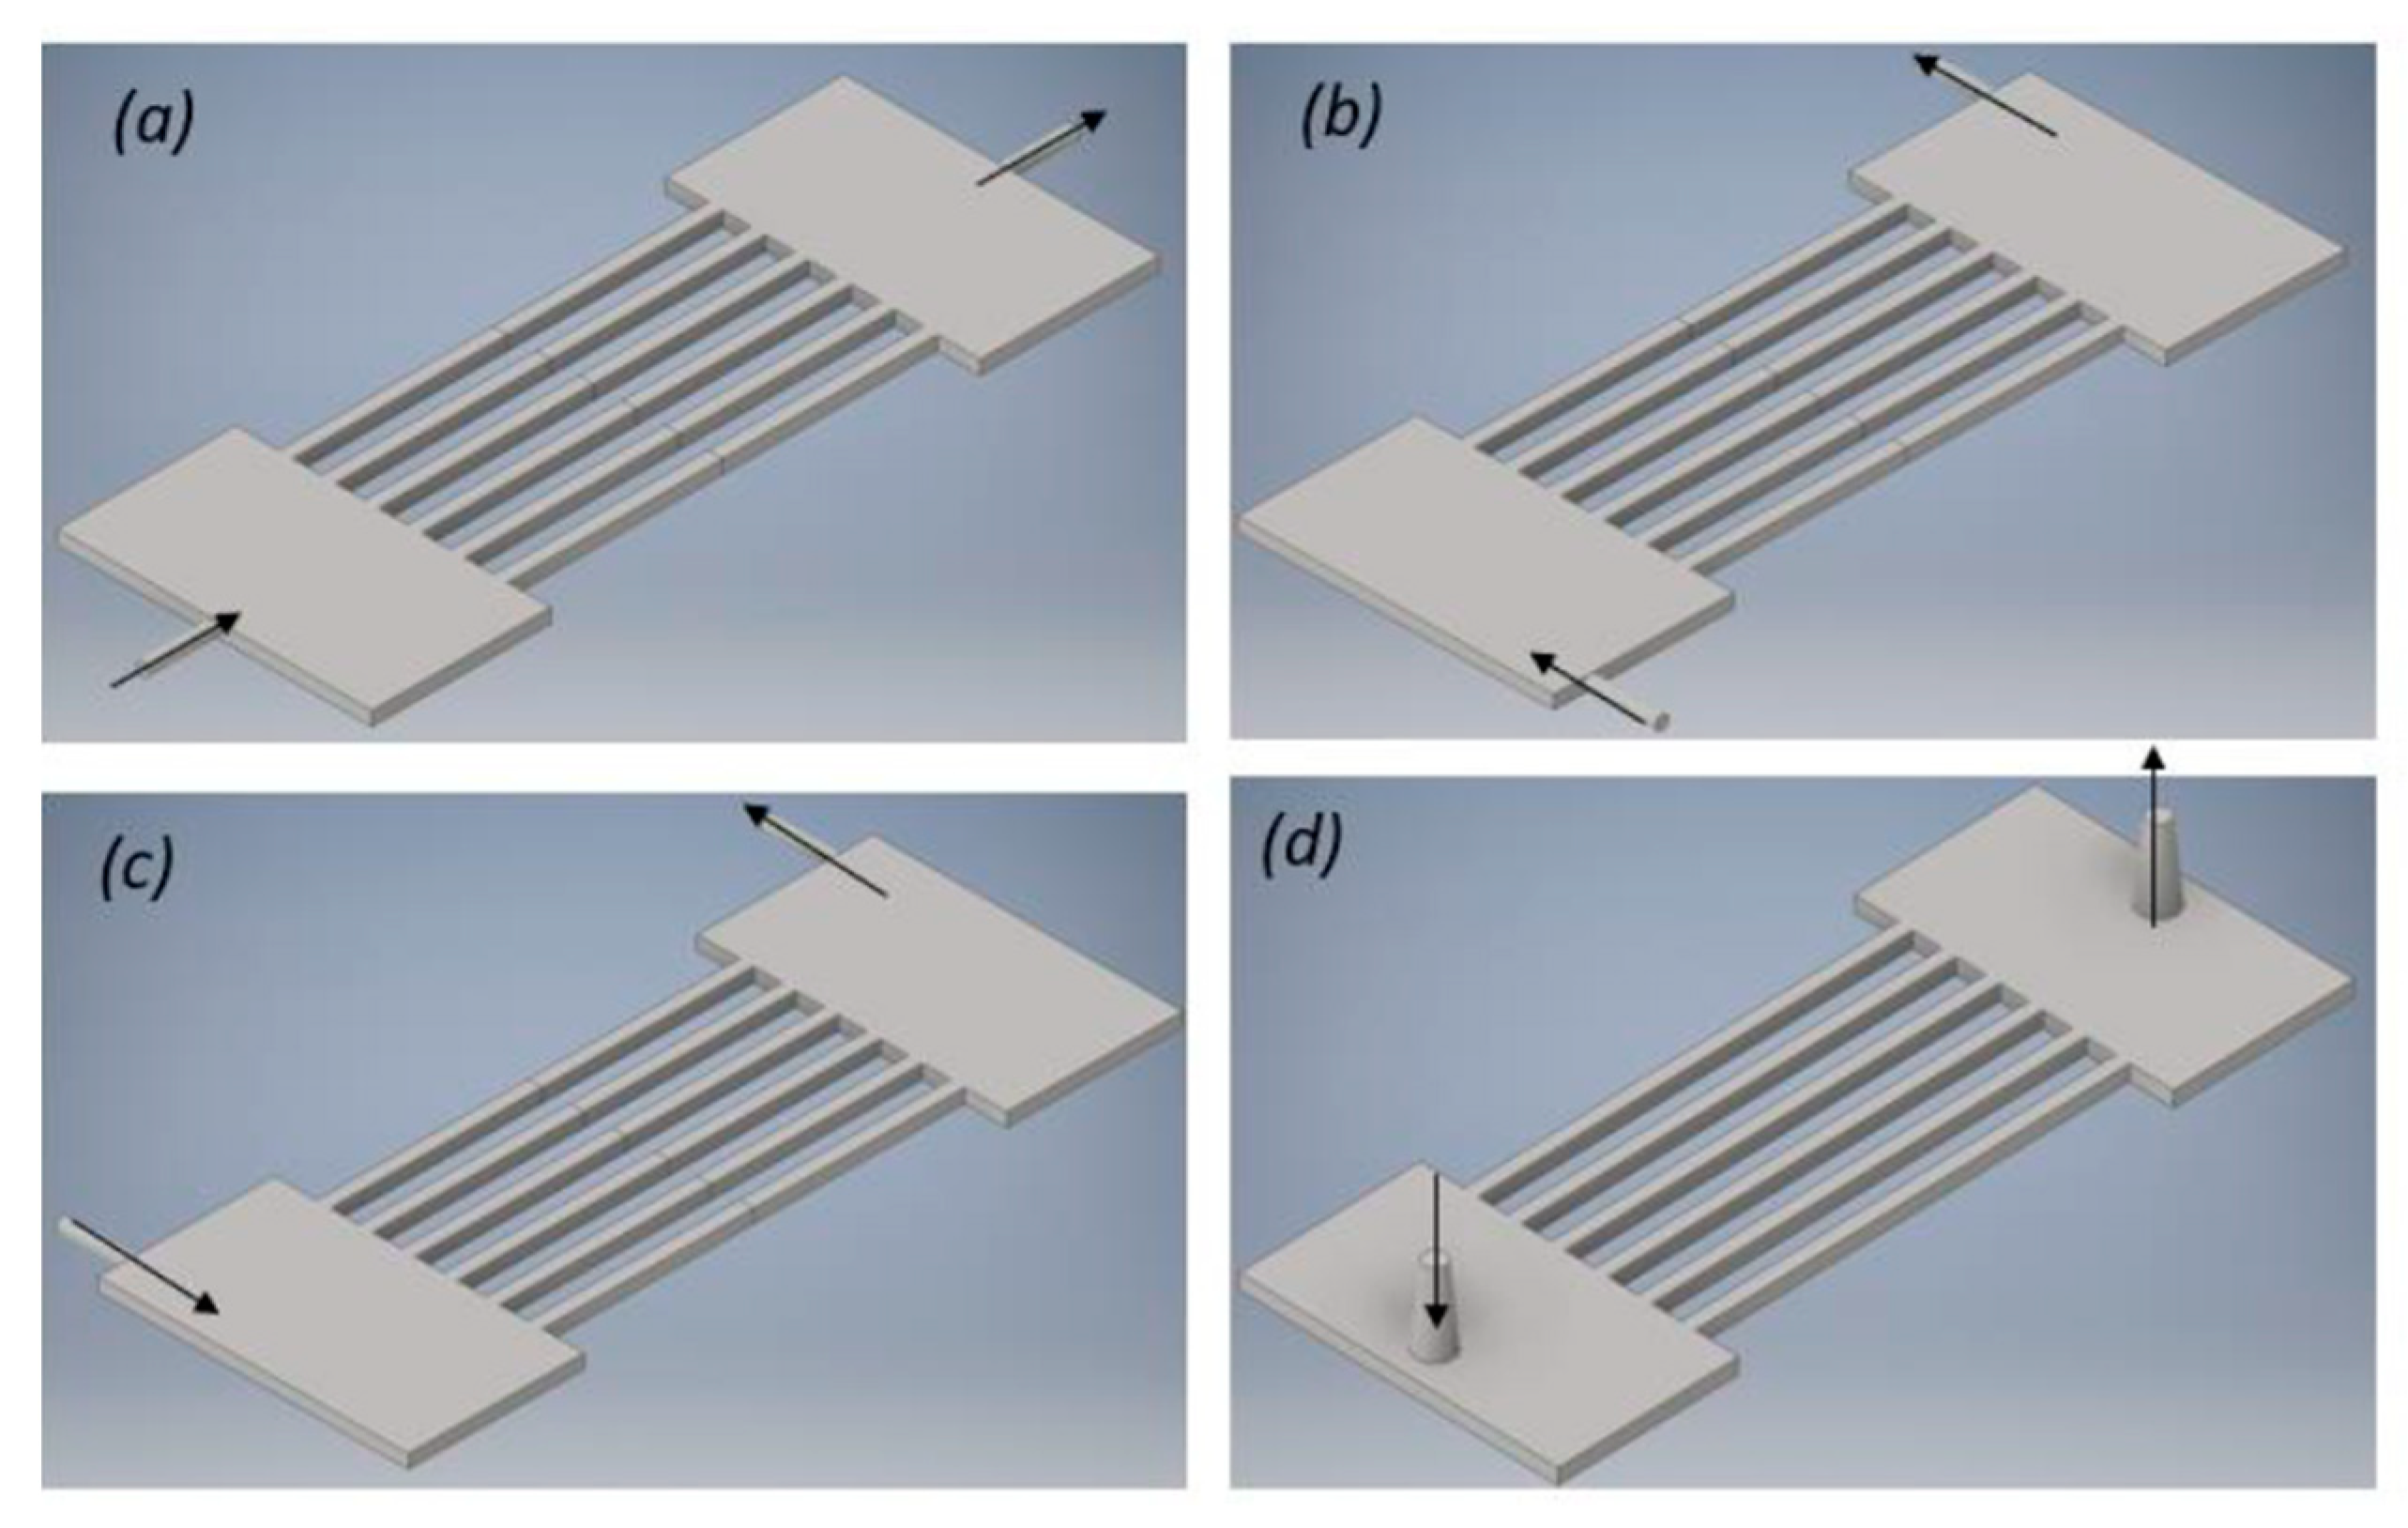
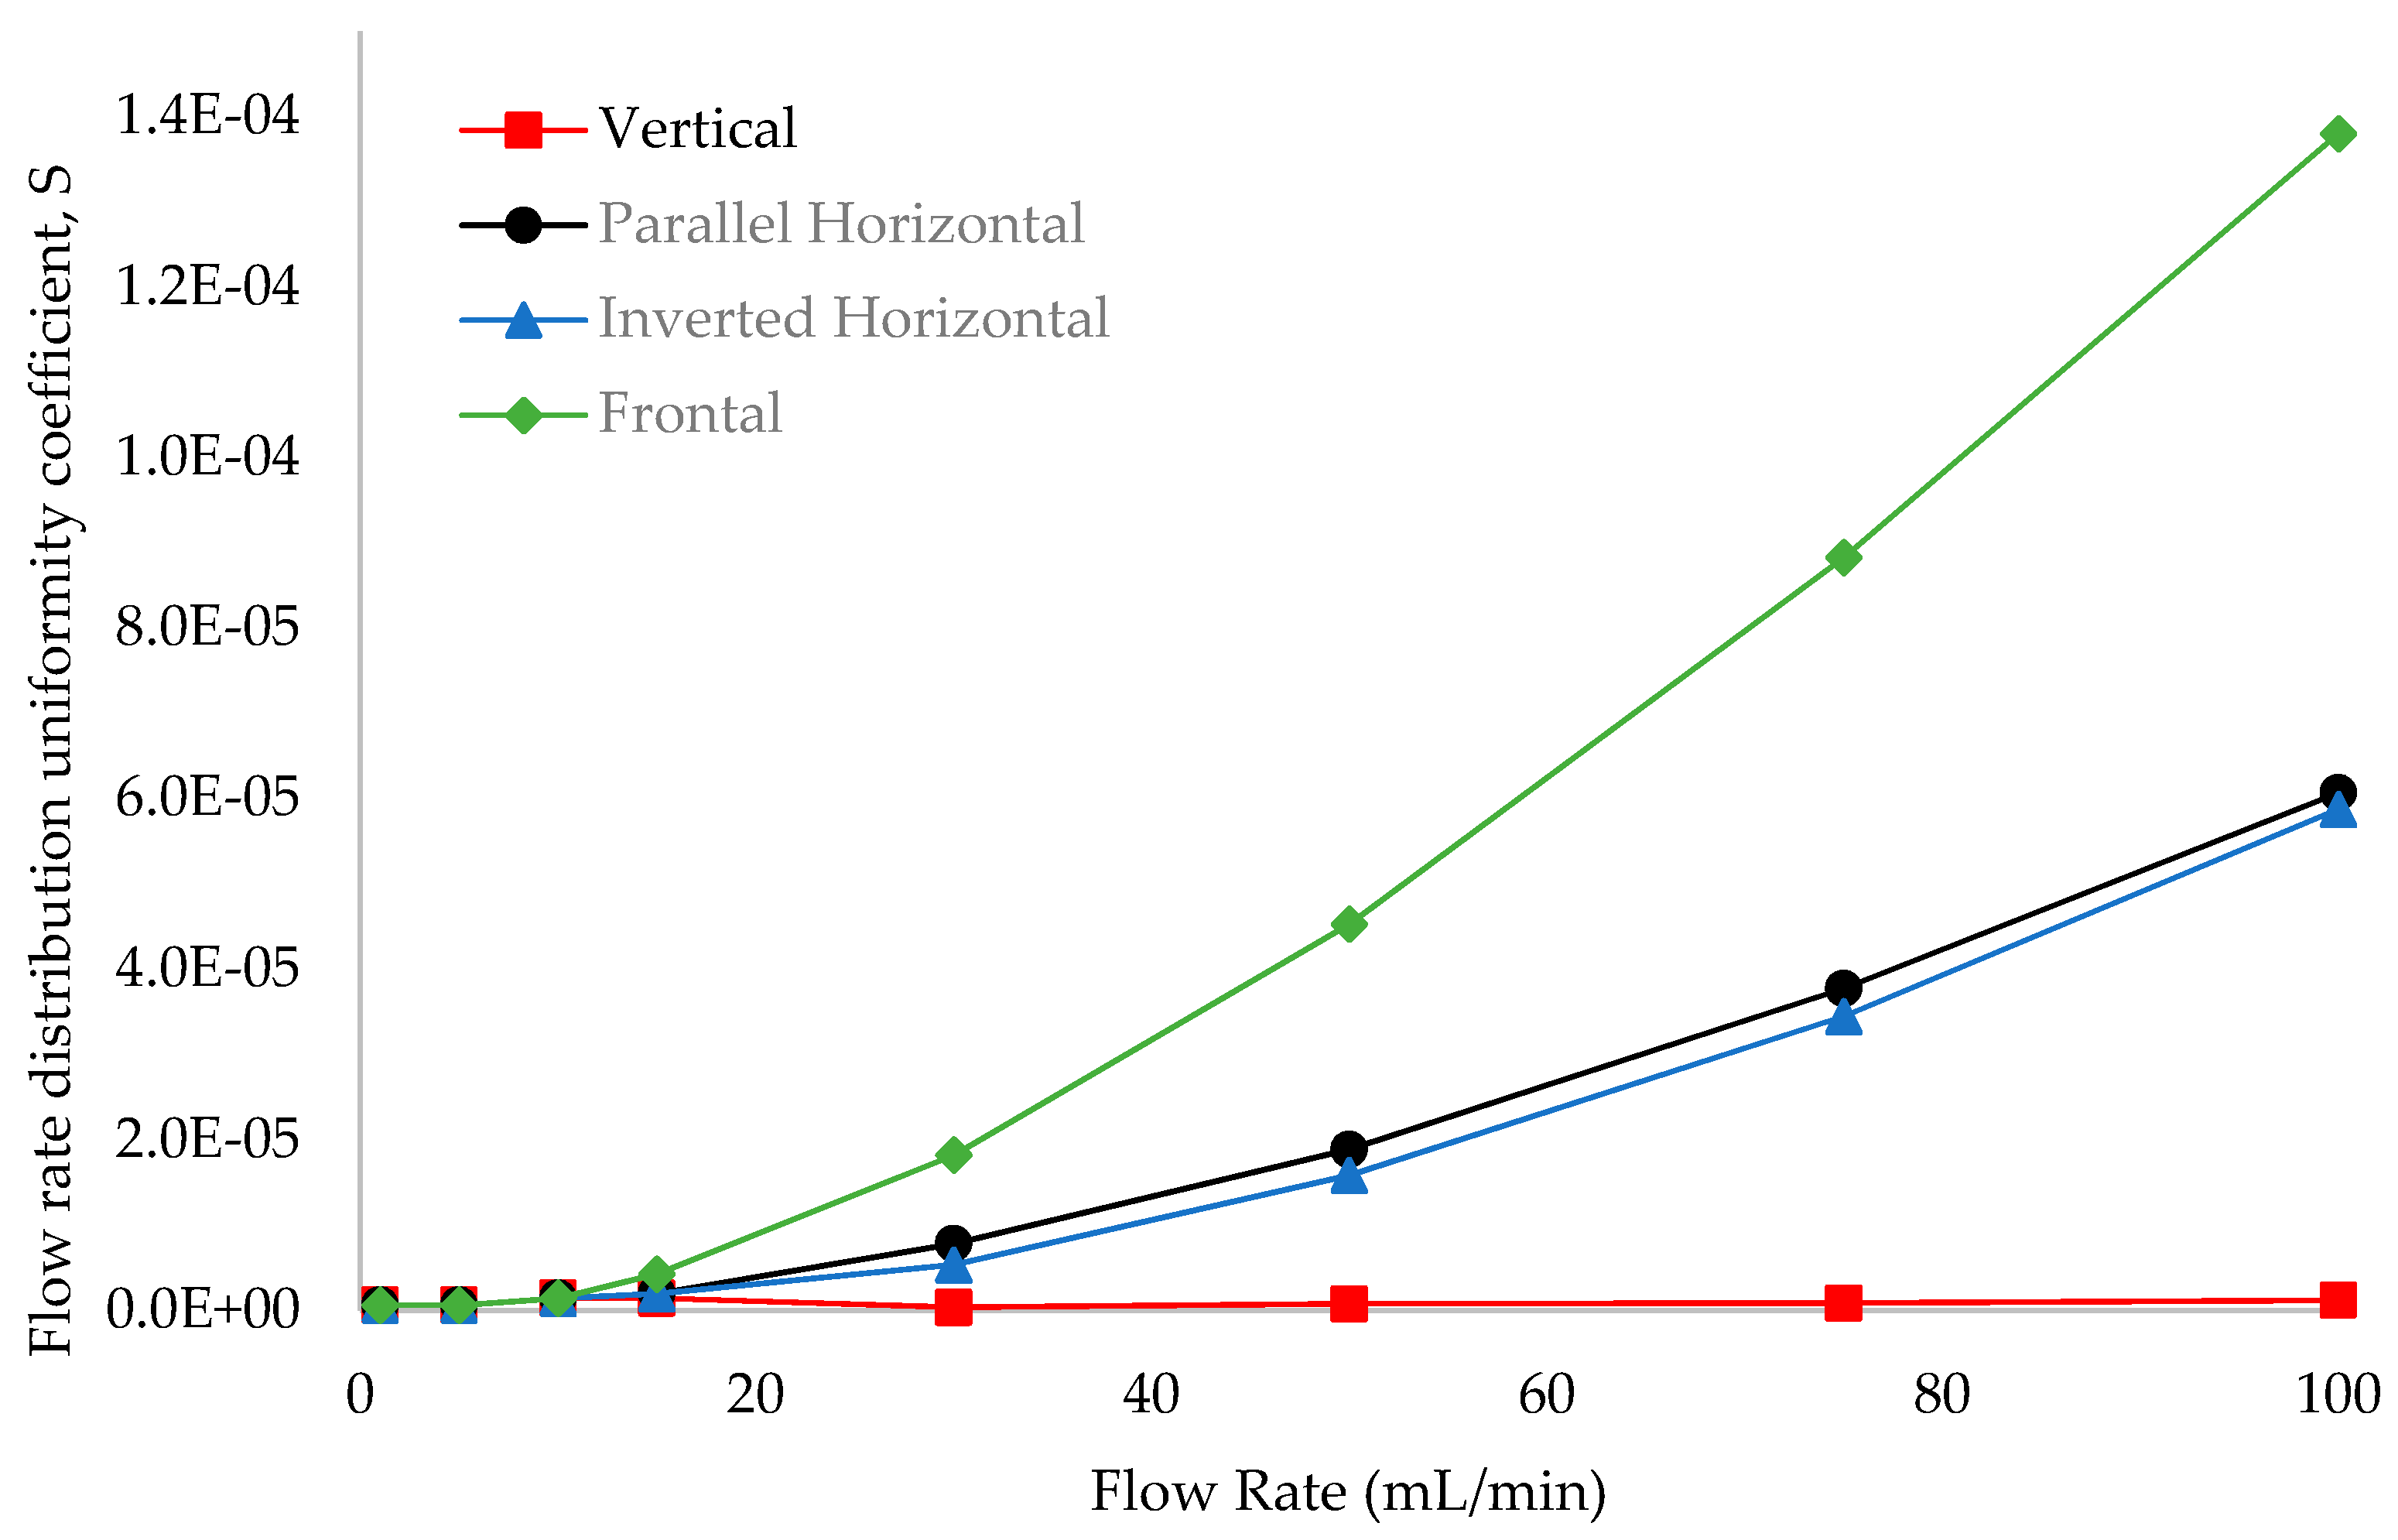
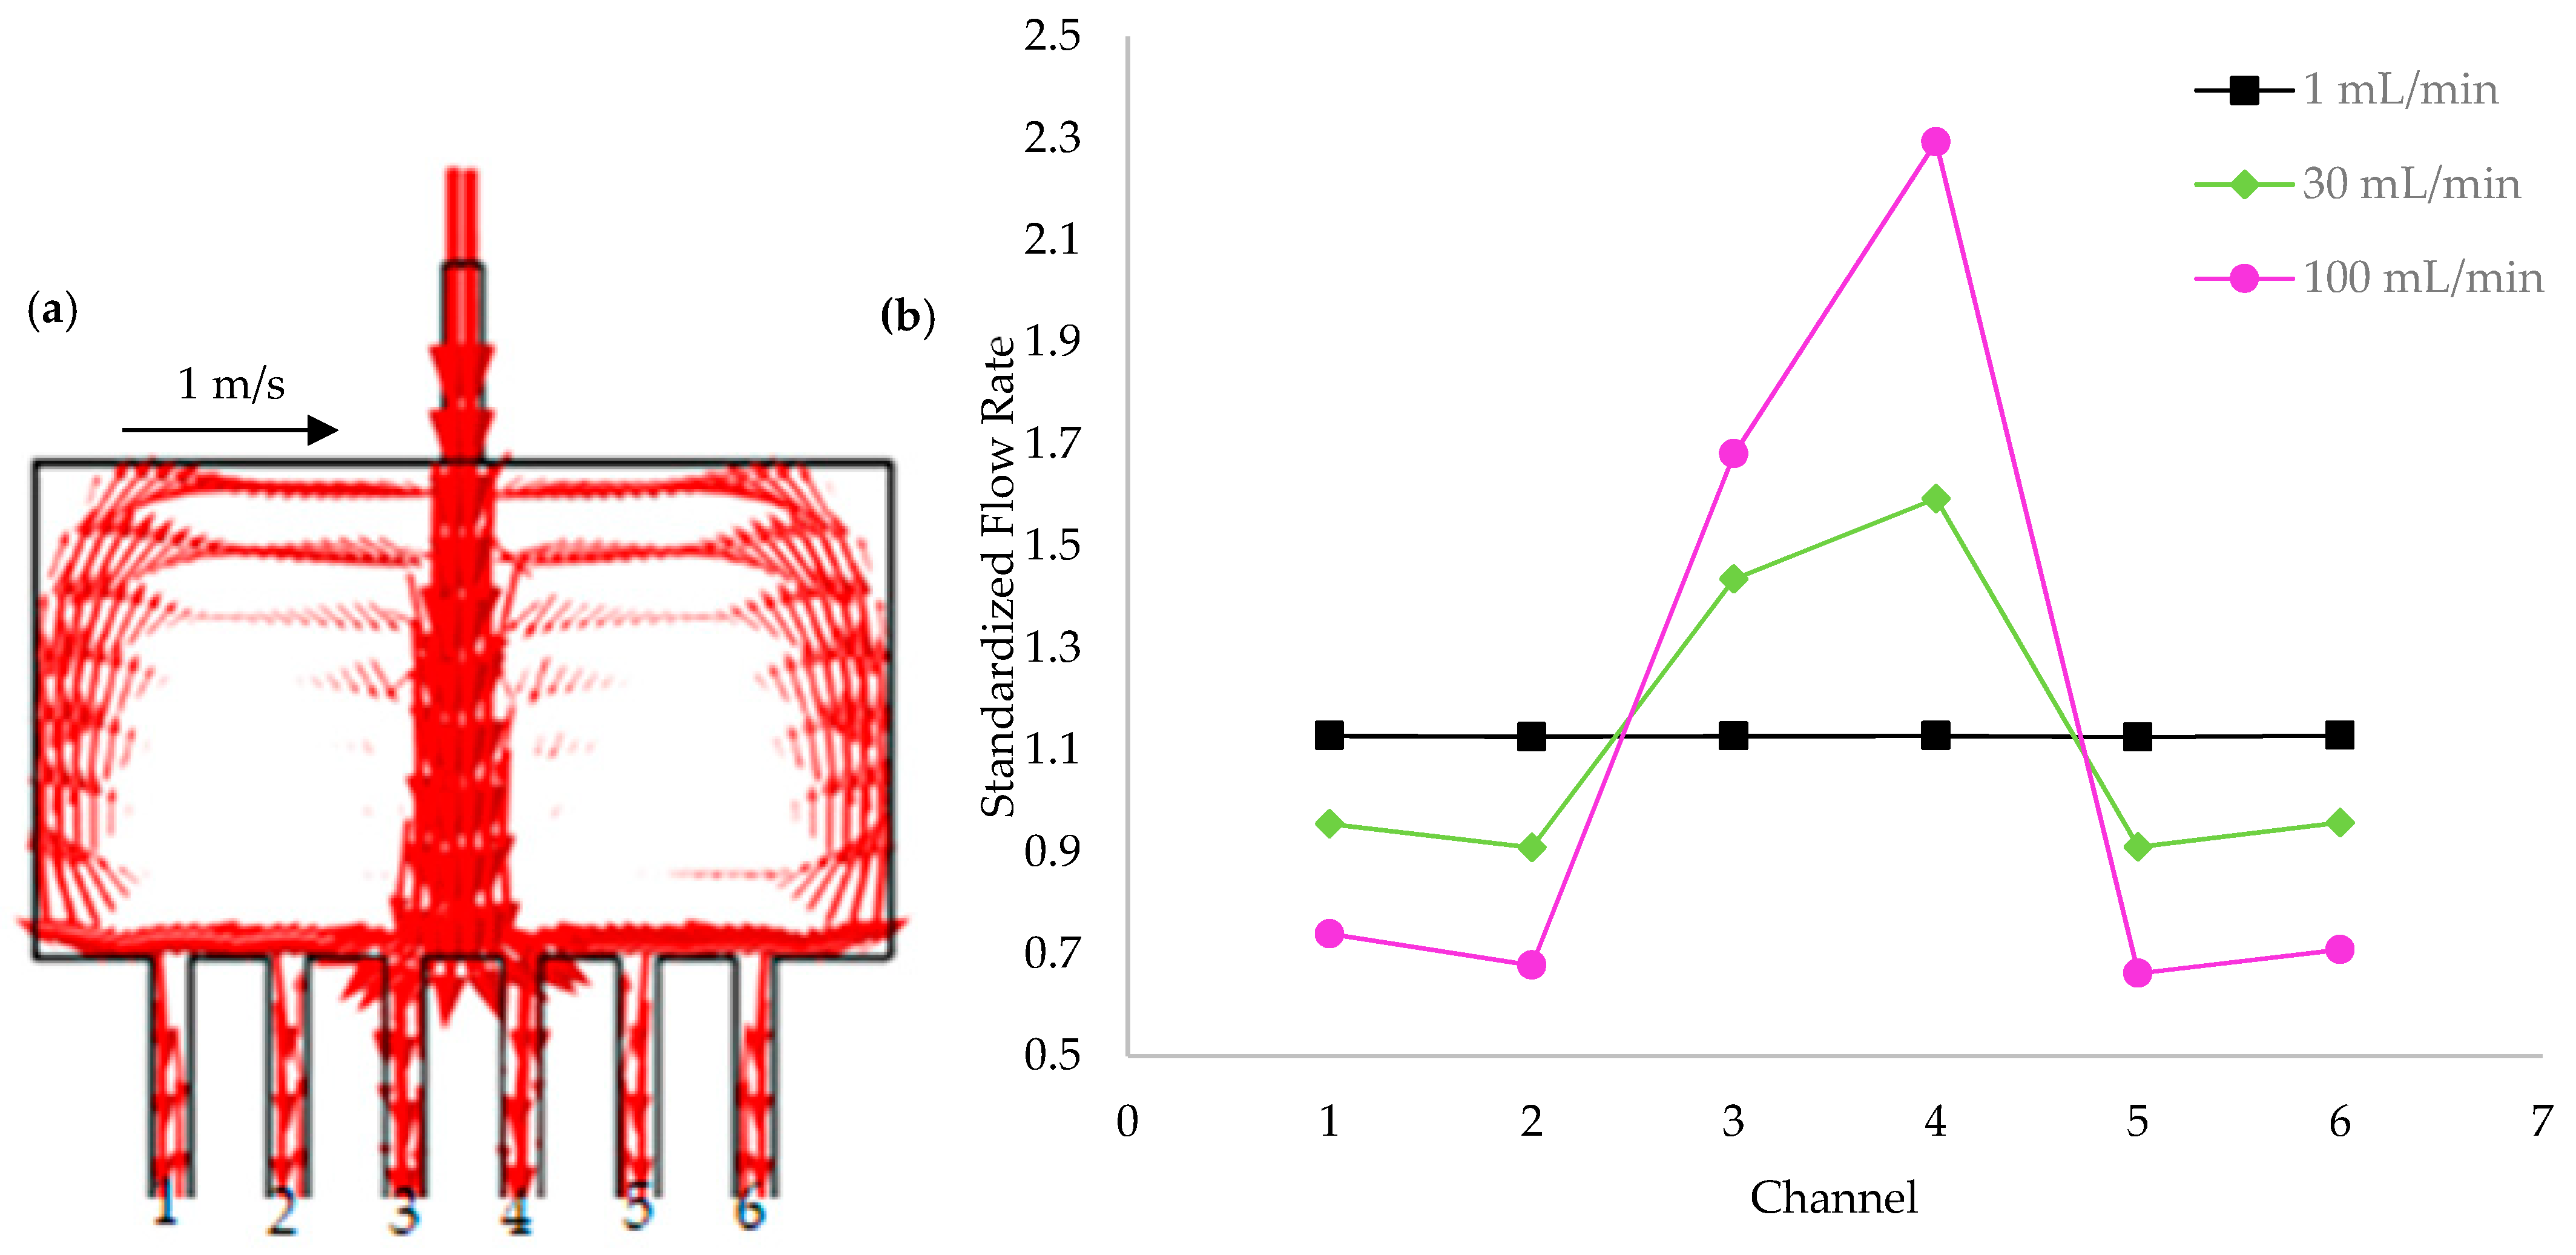
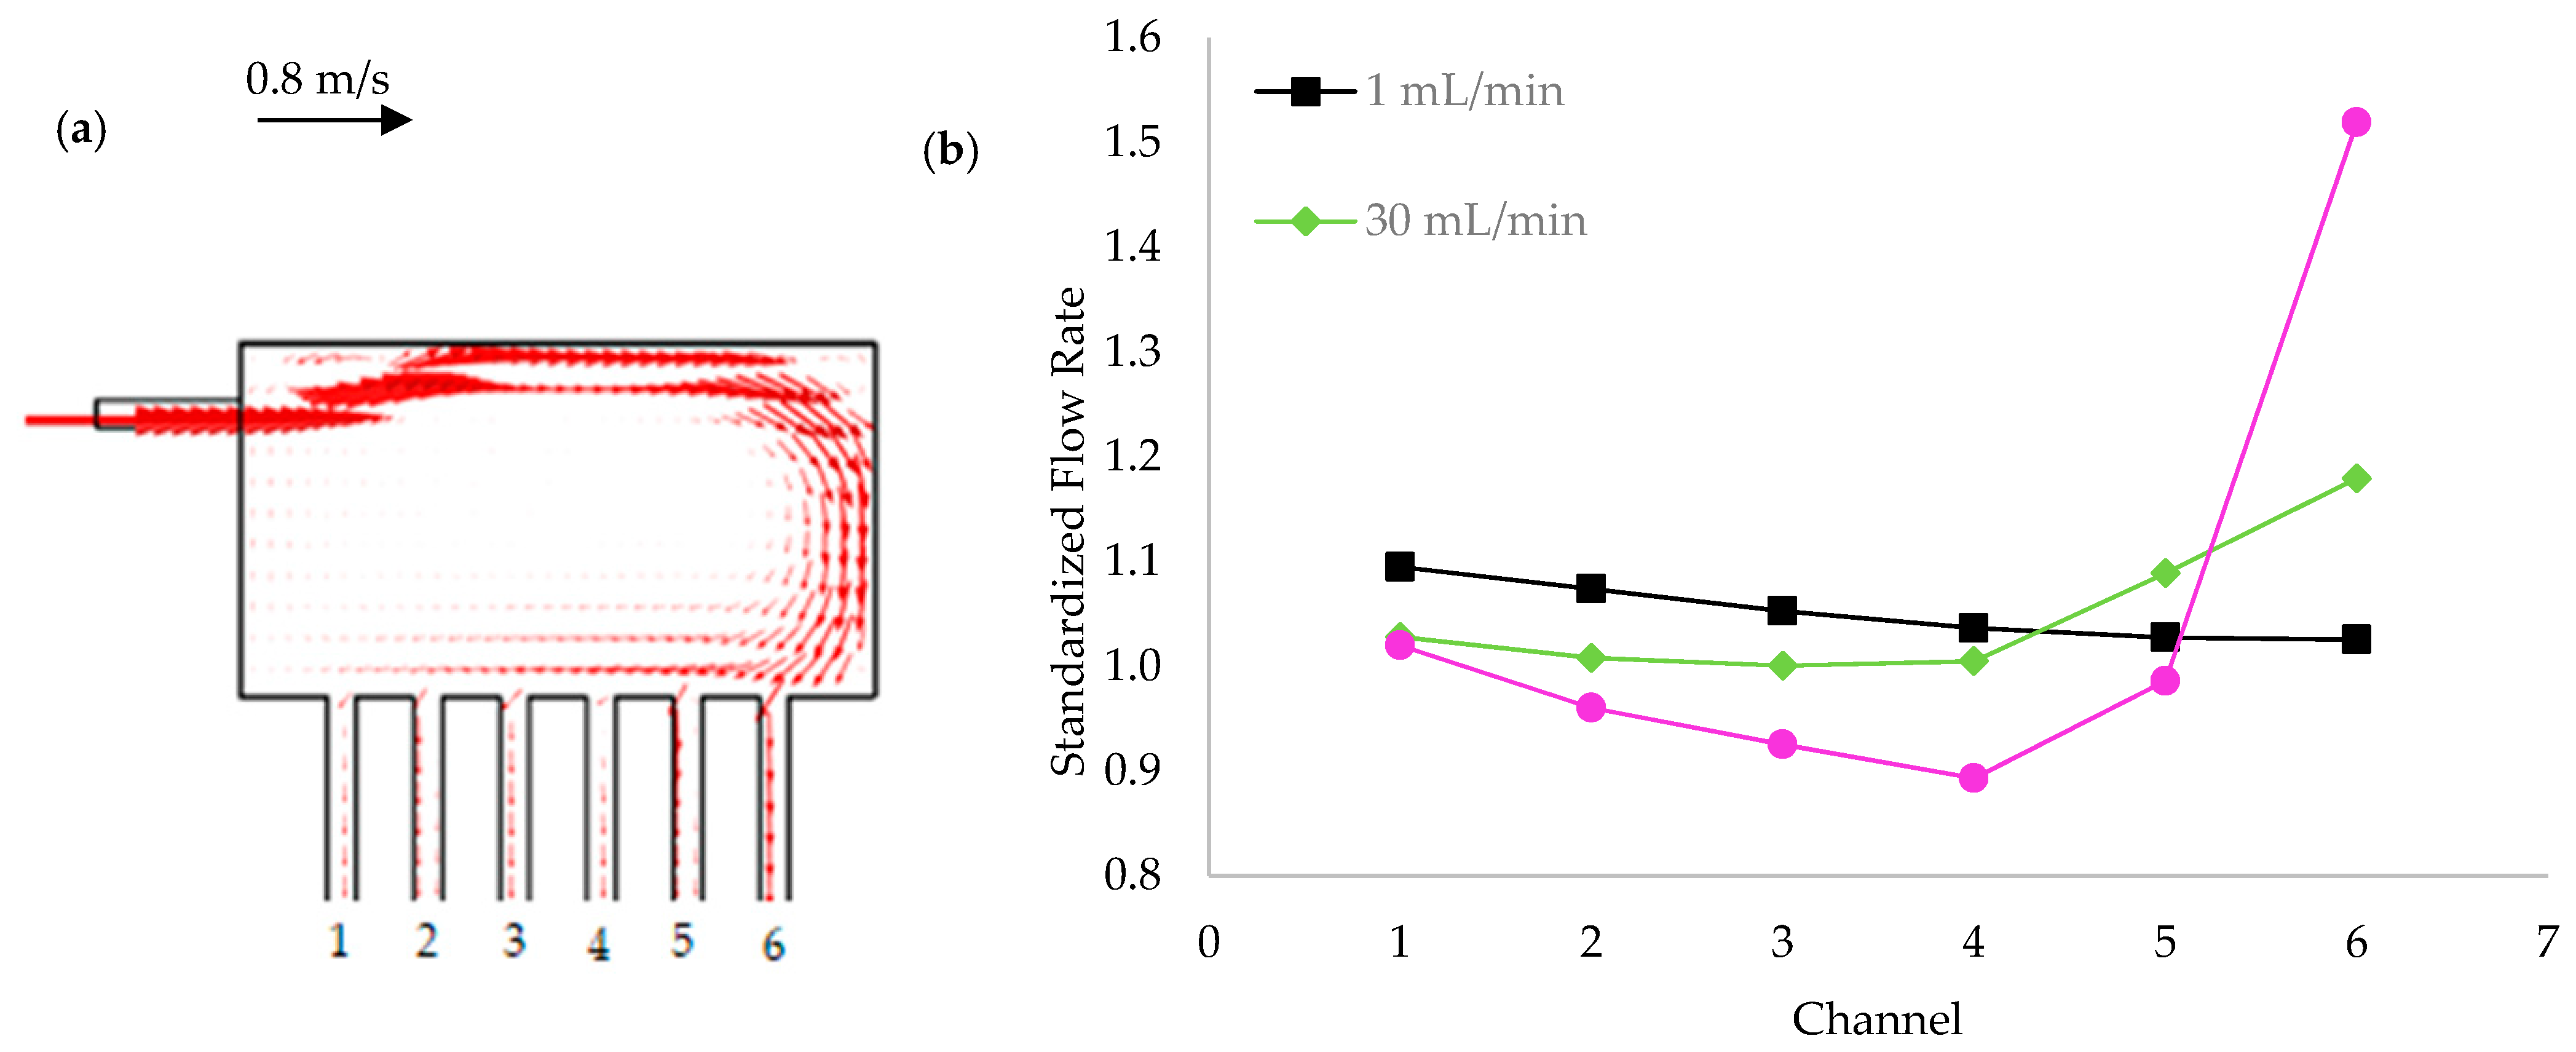
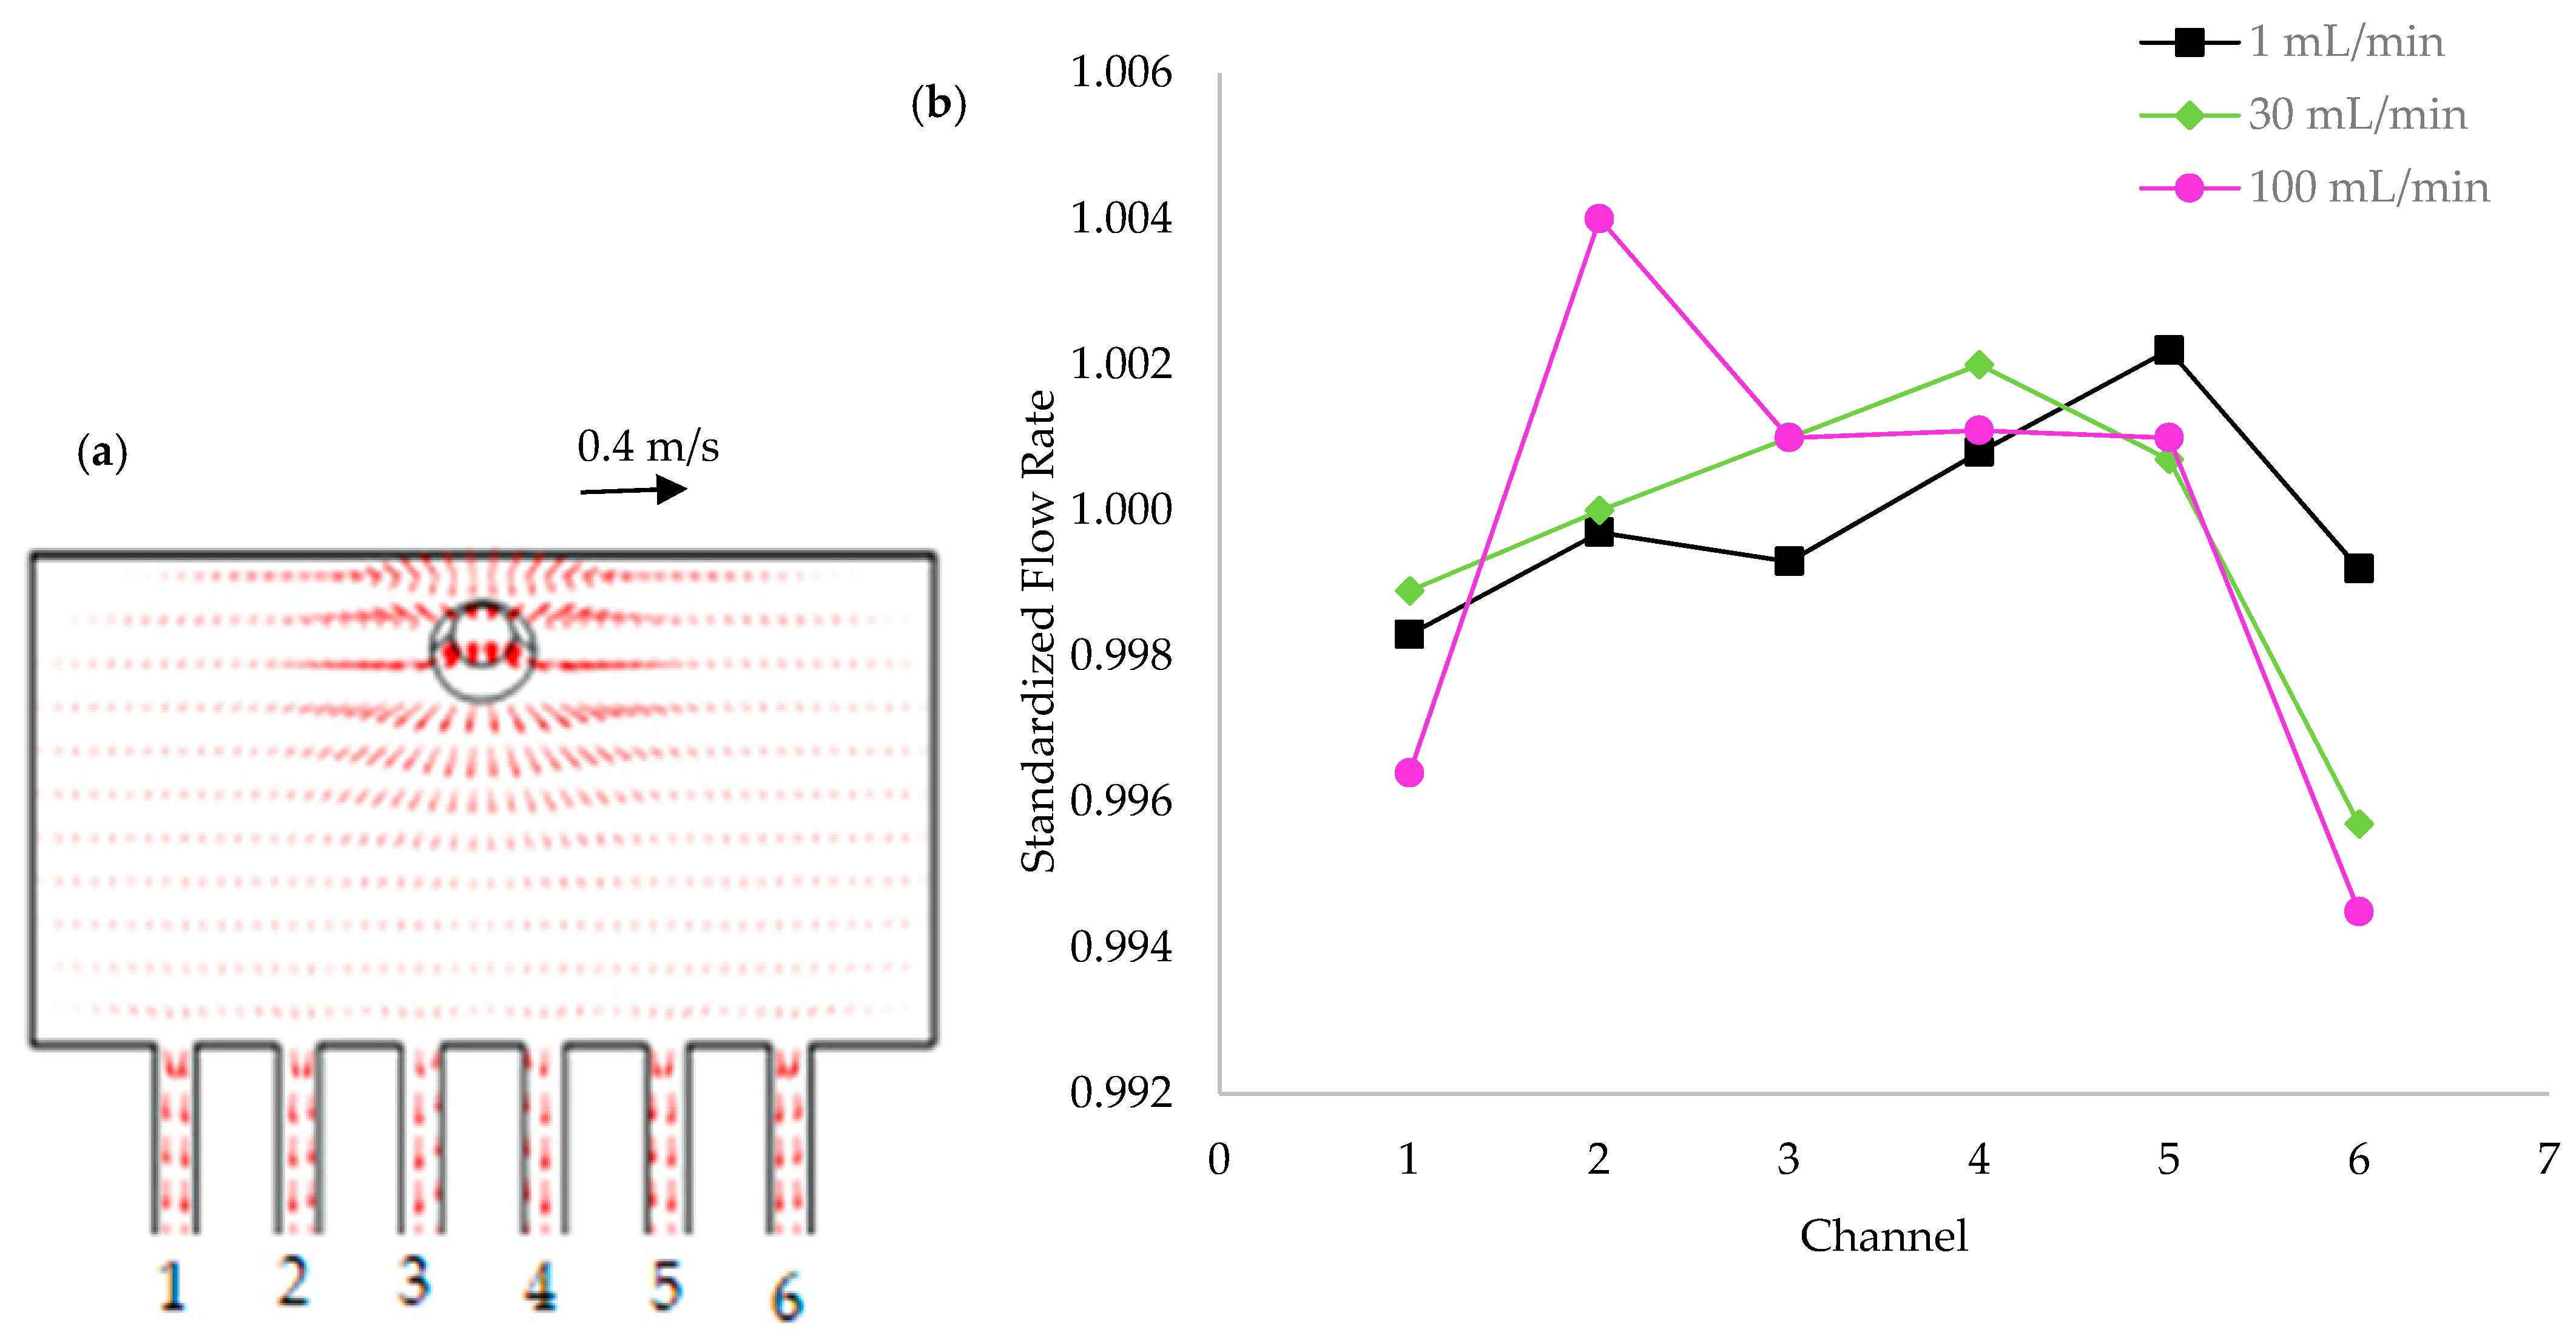
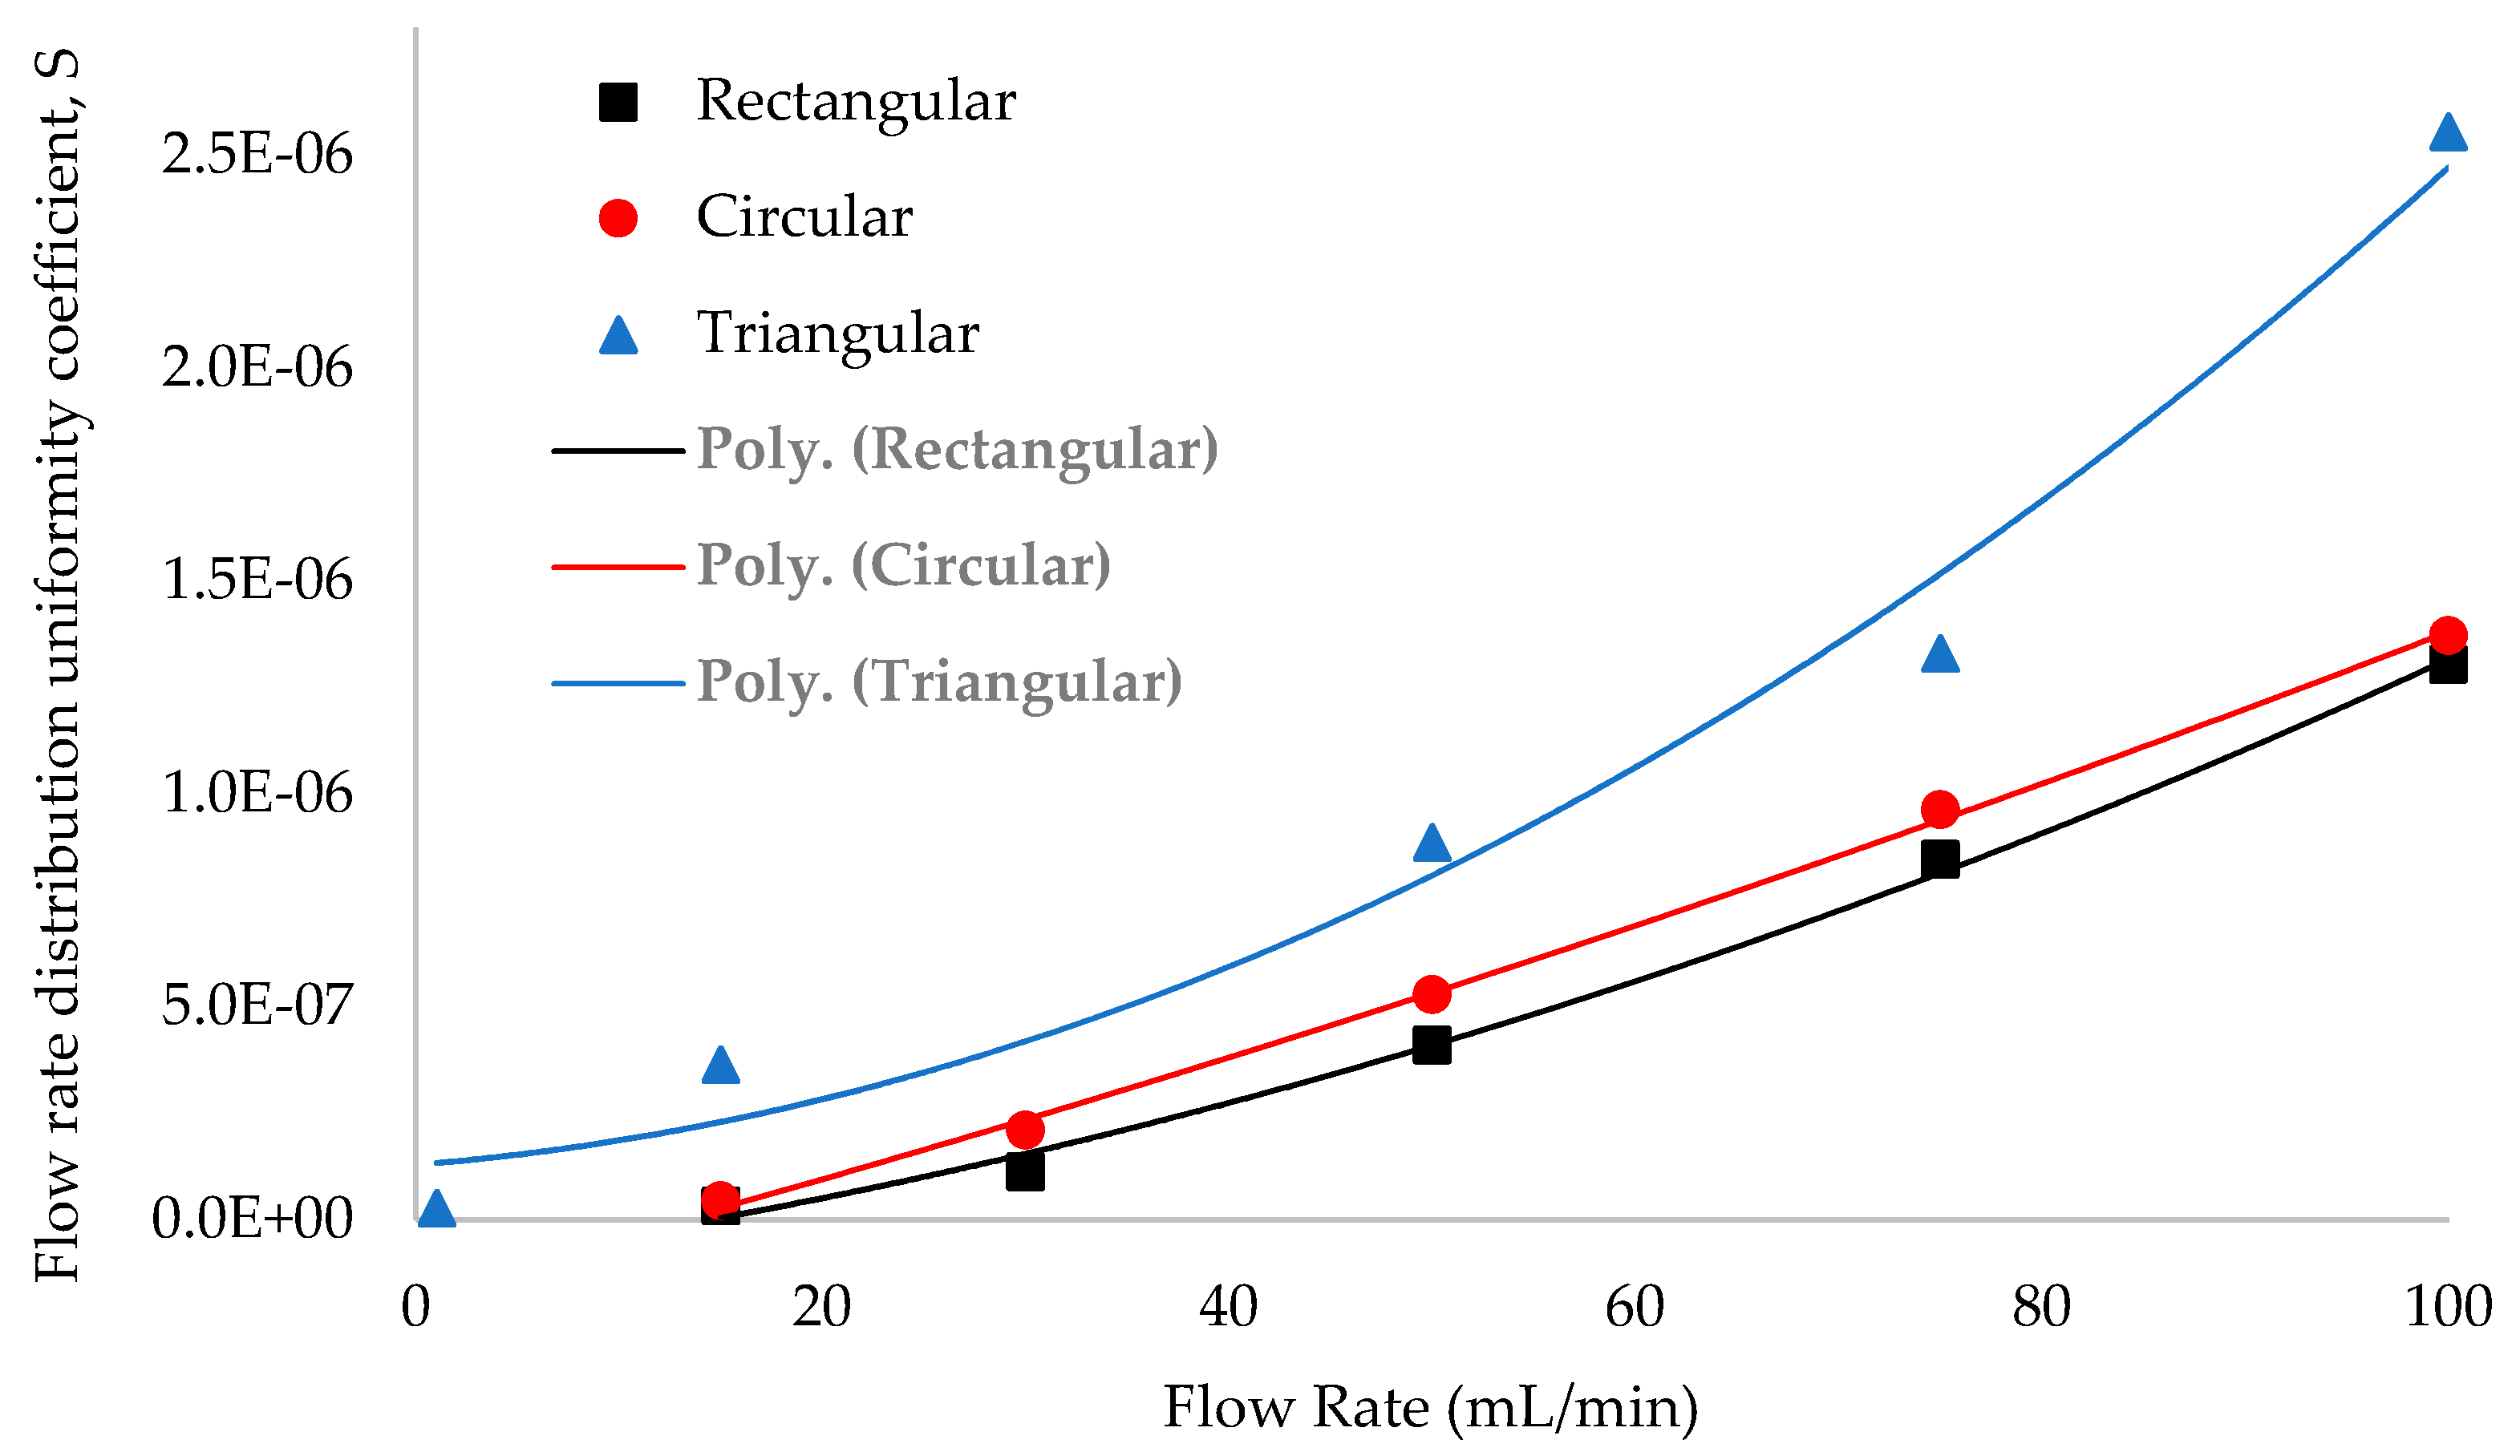
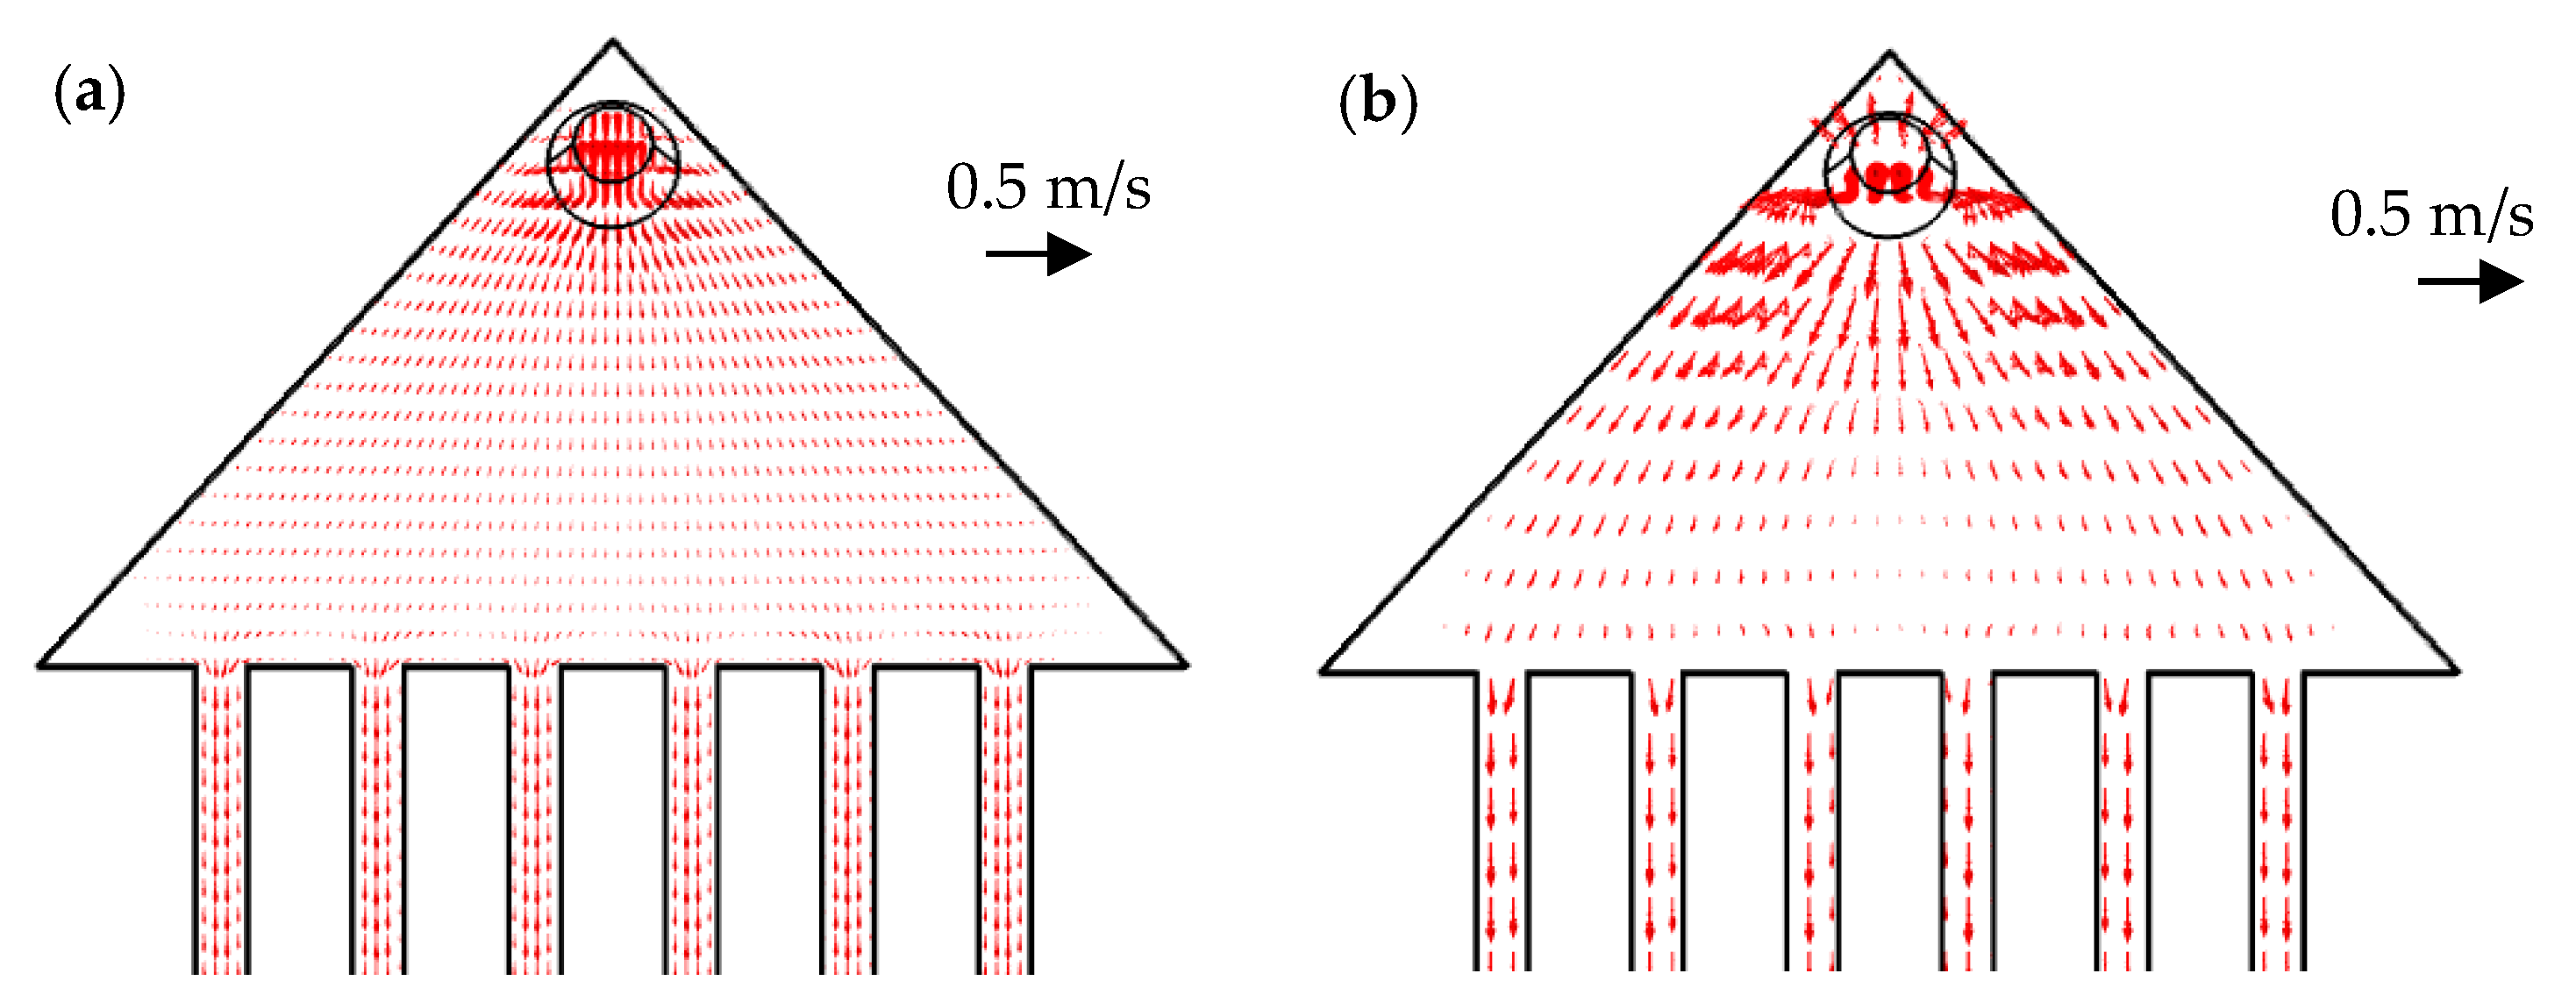
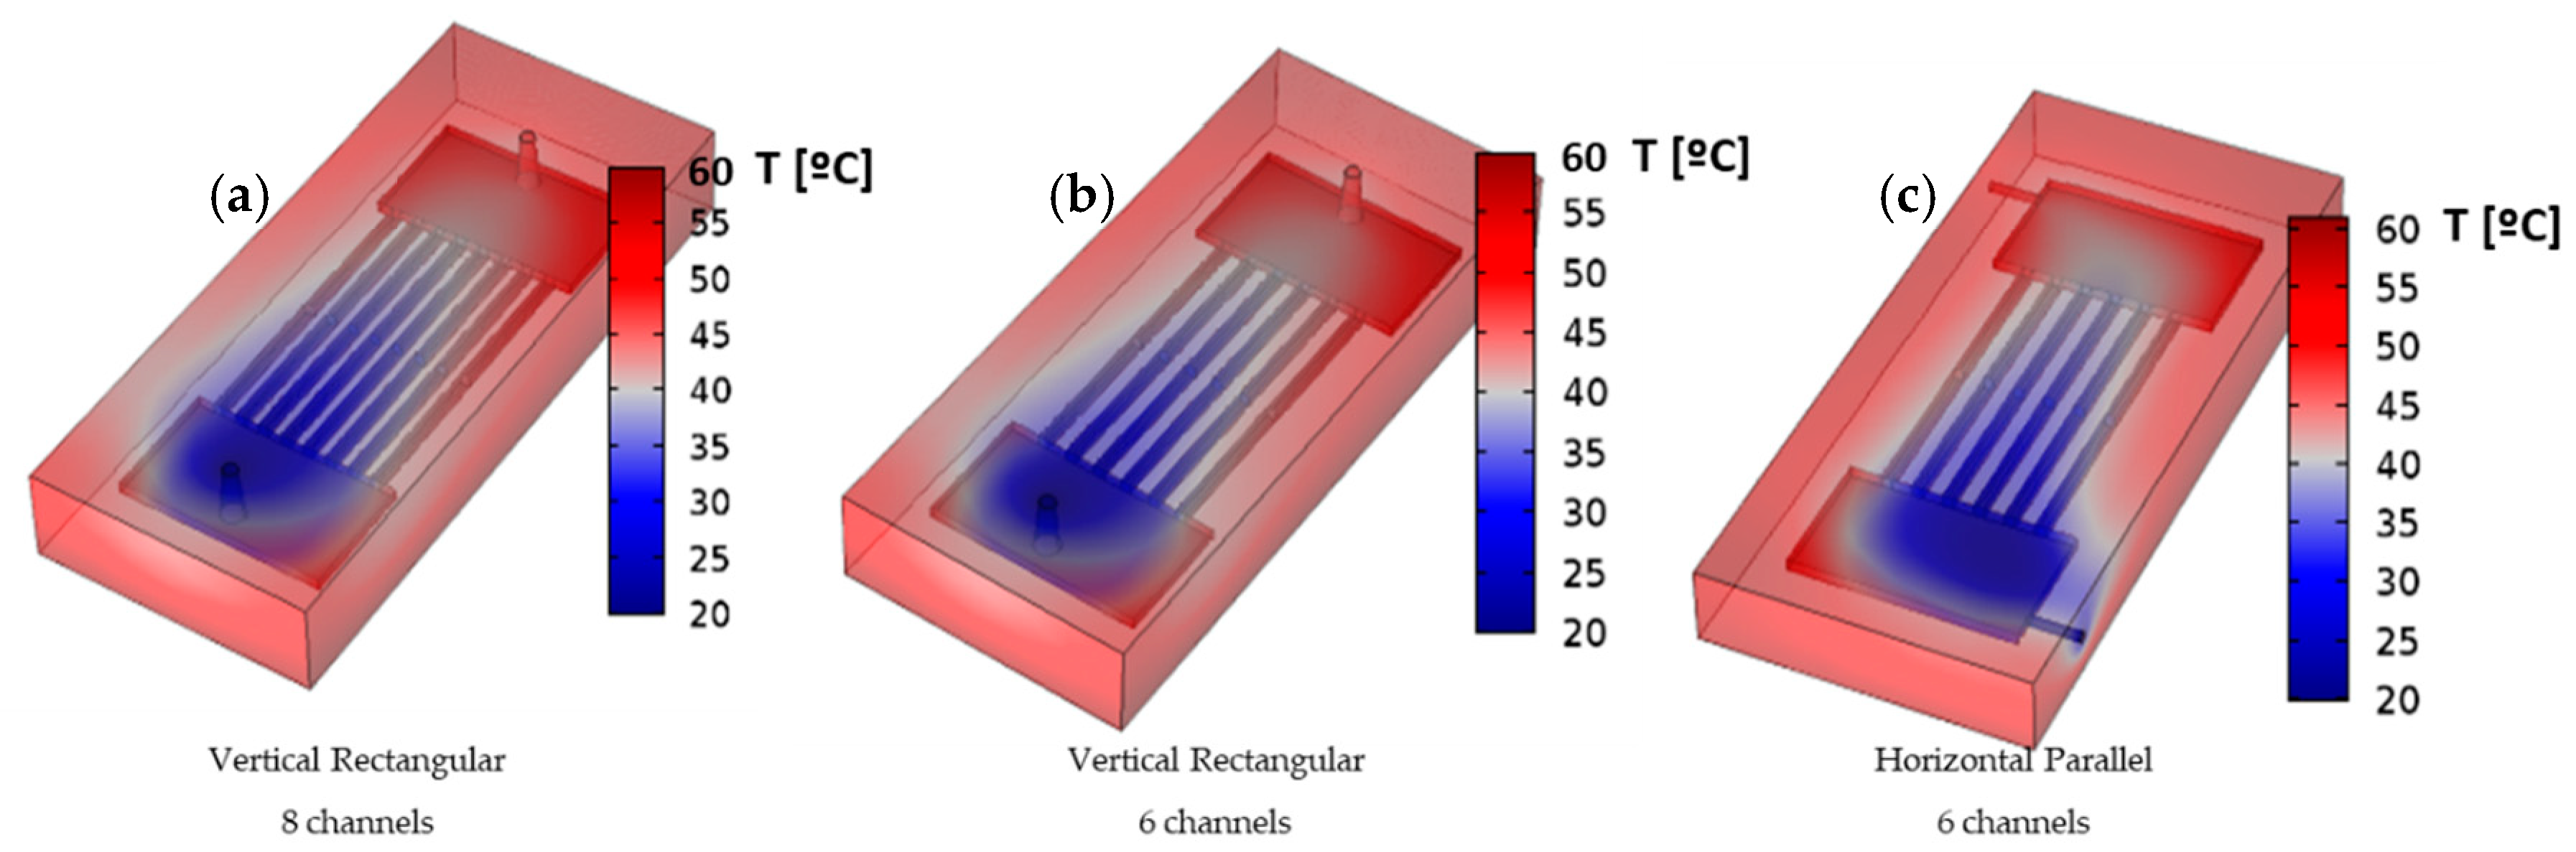
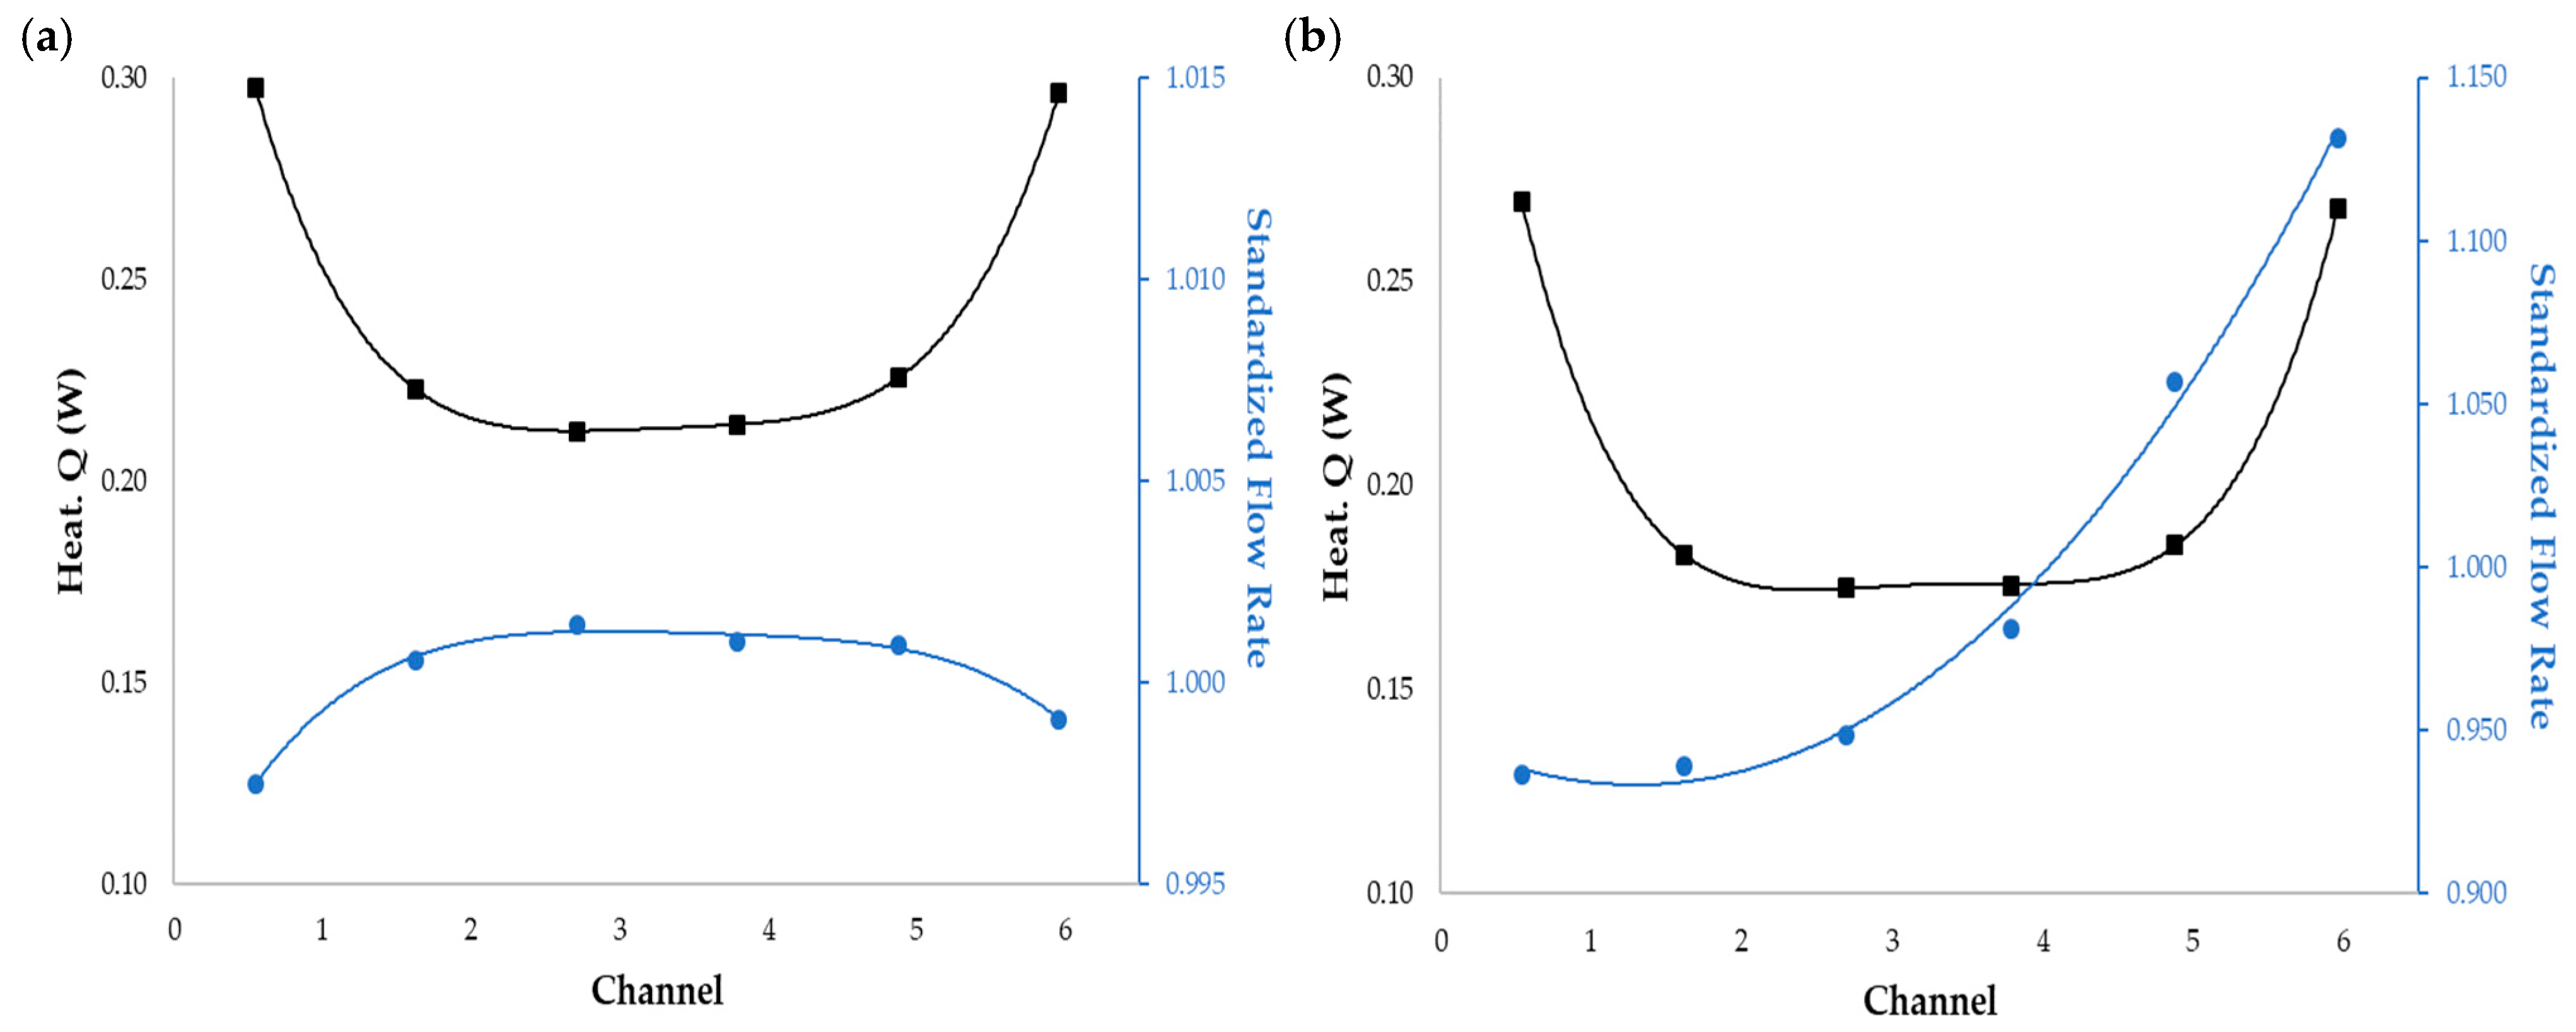
3.2. Influence of Heat Sink Geometry in Flow Distribution

Three sets of geometries were investigated and characterized by the orientation of the flow, the type of collector and the number of parallel channels. The numerical study performed in the commercial COMSOL Multiphysics 5.6® software allowed the determination of the flow rate through each section, and the analysis of the quadratic deviations enabled the quantification of the FDU through the FDU coefficient, S. It can already be stated that the rectangular-shaped support manifold is the one that provides the lowest values of flow distribution uniformity coefficient (S) when compared with the circular and triangular shapes. As such, the rectangular shape is the one causing the greater uniformity in the distribution of the heat transfer in the microchannels, as was clearly outlined in the abstract, and because of this fact the rectangular shape is the only one to be considered in the further analysis undertaken in this work. The orientation of the flowing the rectangular-shaped manifold was imposed by the positioning of the inlet and outlet, as presented in Figure 10. After the numerical simulation, the FDU coefficient was determined for the different geometries. The results are compiled in Figure 11. The coefficient increases exponentially with the increase in the flow rate. The vertical placement of the inlet and outlet allowed the development of a more uniform flow. Regarding the horizontal flow, a small difference was noticed when placing the inlet and outlet on the same or opposite faces. Finally, the greatest flow maldistribution was observed with the injection of the fluid frontally.
The observed distributions can be better explained by analyzing particular cases. In the case of the frontal configuration, a jet is formed in the center while two recirculation regions form laterally, as observed in Figure 12a. Figure 12b shows that the maximum value of the standardized flow rate occurs in the central channels, 3 and 4. The path passing through the central channels has low resistance to flow, which explains why this configuration presents the highest coefficient.
Both horizontal configurations presented a similar distribution, only diverging in the exit collector, which also affected the coefficient. The inverted horizontal configuration was slightly more uniform than the parallel horizontal configuration. Figure 13 shows that the fluid flows preferentially via channel 6, which is placed in the opposite side to one of the inlets, this flow pattern being caused by the inertia of the fluid.
The vertical configuration presented the best results, since the placement of the inlet vertically allows it to be perpendicular to the smallest dimension of the collector (height of 1 mm). In this way, the jet is immediately broken and spread radially. This phenomenon is known as jet impingement [31], and is shown in Figure 14. It is responsible for the uniformity in this configuration, where no preferential flow path is noted.
As the vertical configuration has the best flow distribution, an attempt was made to improve it by changing the collector geometry from rectangular to triangular or circular. Figure 15 shows the effect of the shape on the FDU coefficient. The rectangular shape leads to the highest flow uniformity, while the triangular shape leads to the highest flow maldistribution.
The flow maldistribution in the triangular case is due to the disturbance of the impinging jet by the collector walls. For small flow rates, the fluid is better distributed at the center. However, the increase in the flow rate leads to a preferential orientation of the flow towards the external channels, as seen in Figure 16. The results obtained in each of the channel sections agree with what was presented in the qualitative analysis (Figure 16). In Figure 17, it is possible to verify an alteration in the profile of the flow for a flow rate above 50 mL/min, wherein the accumulation of the flow changes from central to lateral.
The flow distribution in the circular collector is very similar to the one observed in the rectangular collector. The impinging jet was also disturbed, but the effect is much smaller than the one obtained with the triangular collector. The results are presented in Figure 18.
In order to evaluate the impact of the number of channels on the heat transfer phenomena, a parametric study was performed. As such, the initially considered six-channel configuration was compared to four- and eight-channel configurations. The distance between channels was modified to maintain a uniform distribution over the width of the ABS mold master. Figure 19 presents the FDU coefficient for those cases.
Increasing the number of channels improved the flow distribution, as the flow patterns in Figure 20 demonstrate. The increase in the number of channels leads to a more uniform flow in the collector, especially in the channels approaching regions, where the fluid travels through the shortest path to the respective channel.

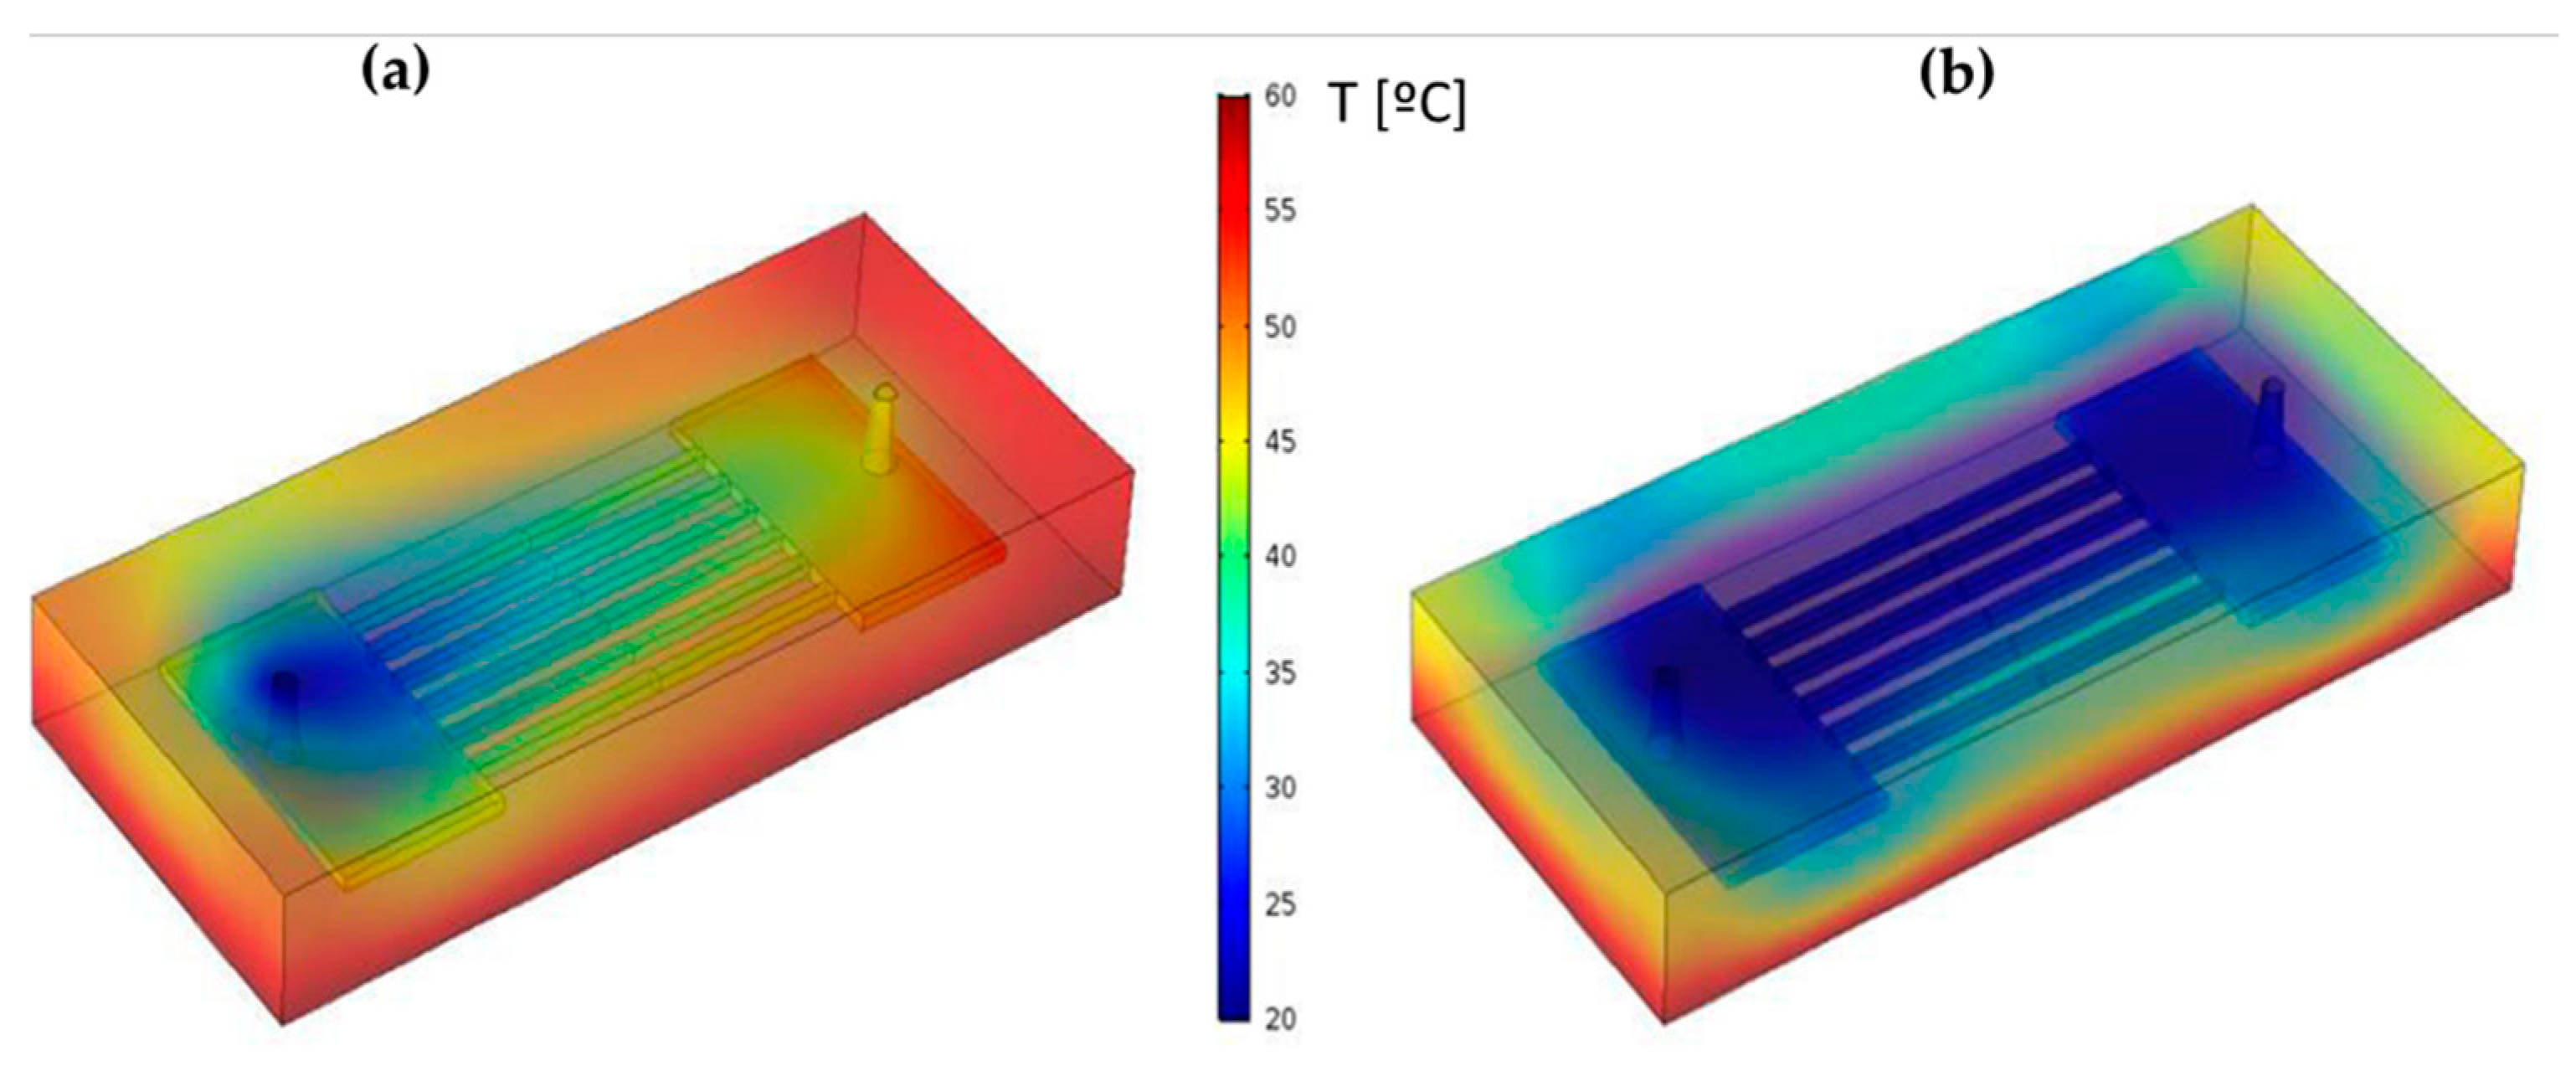
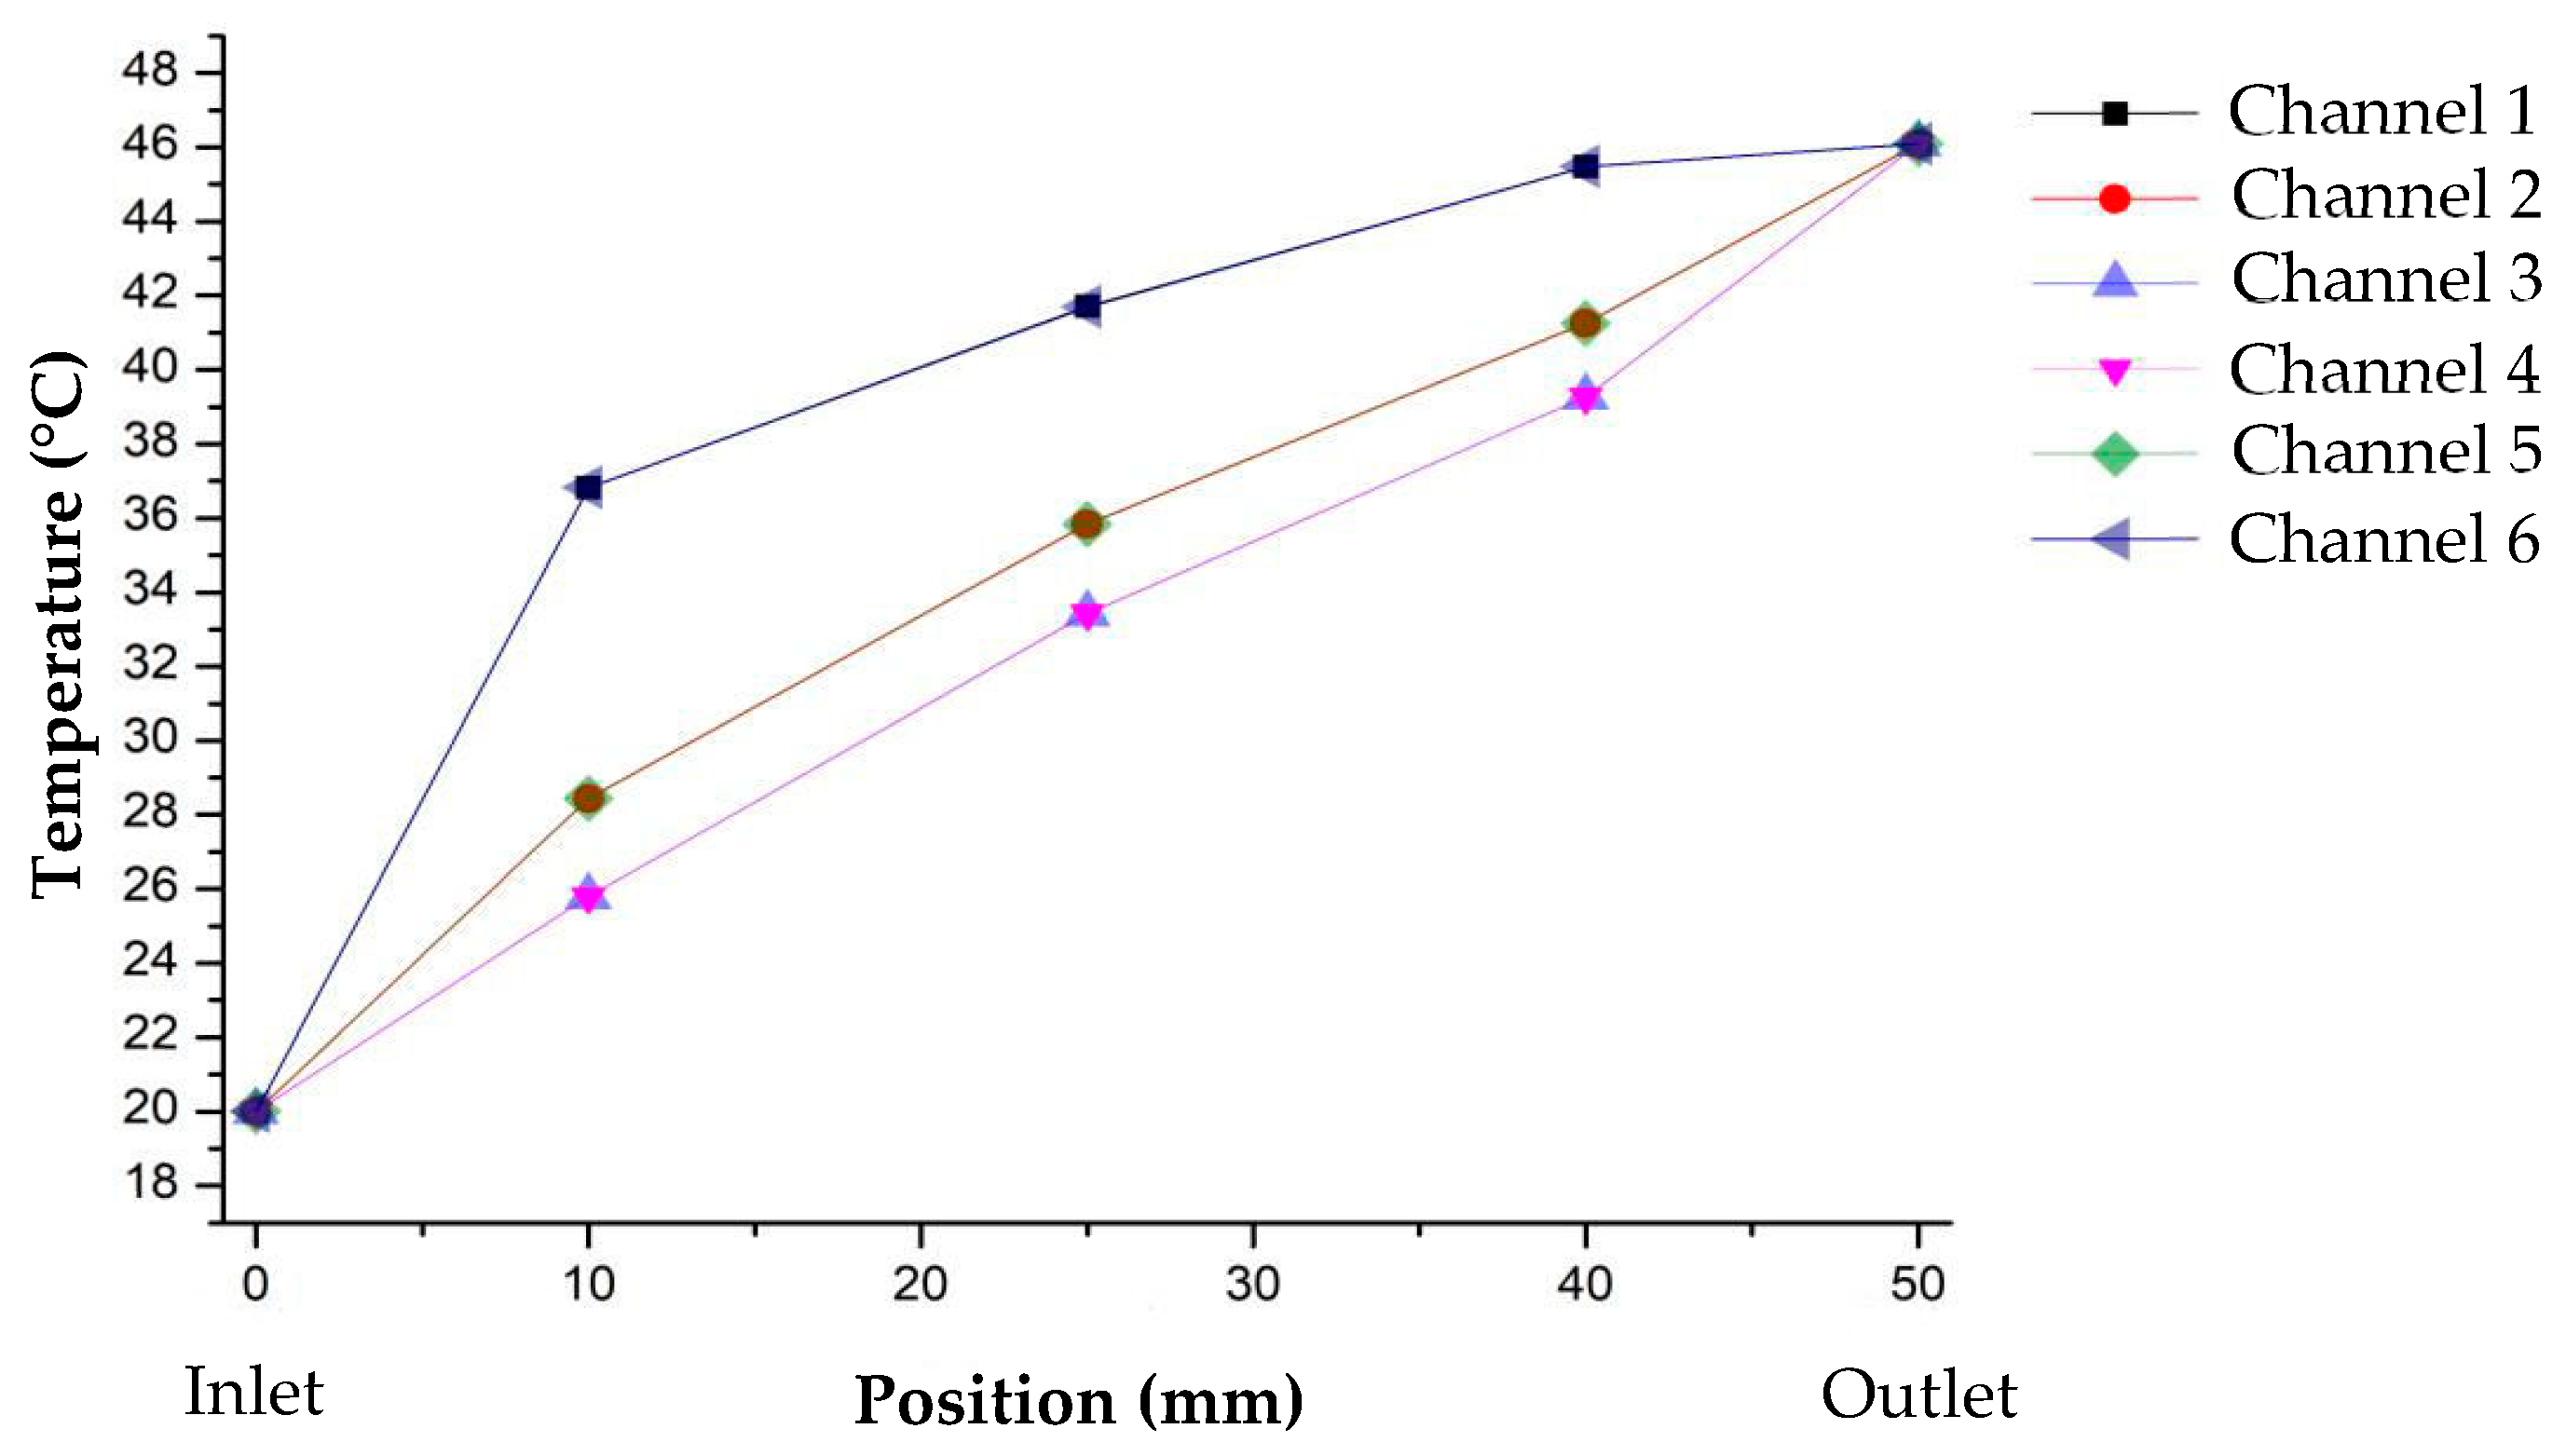
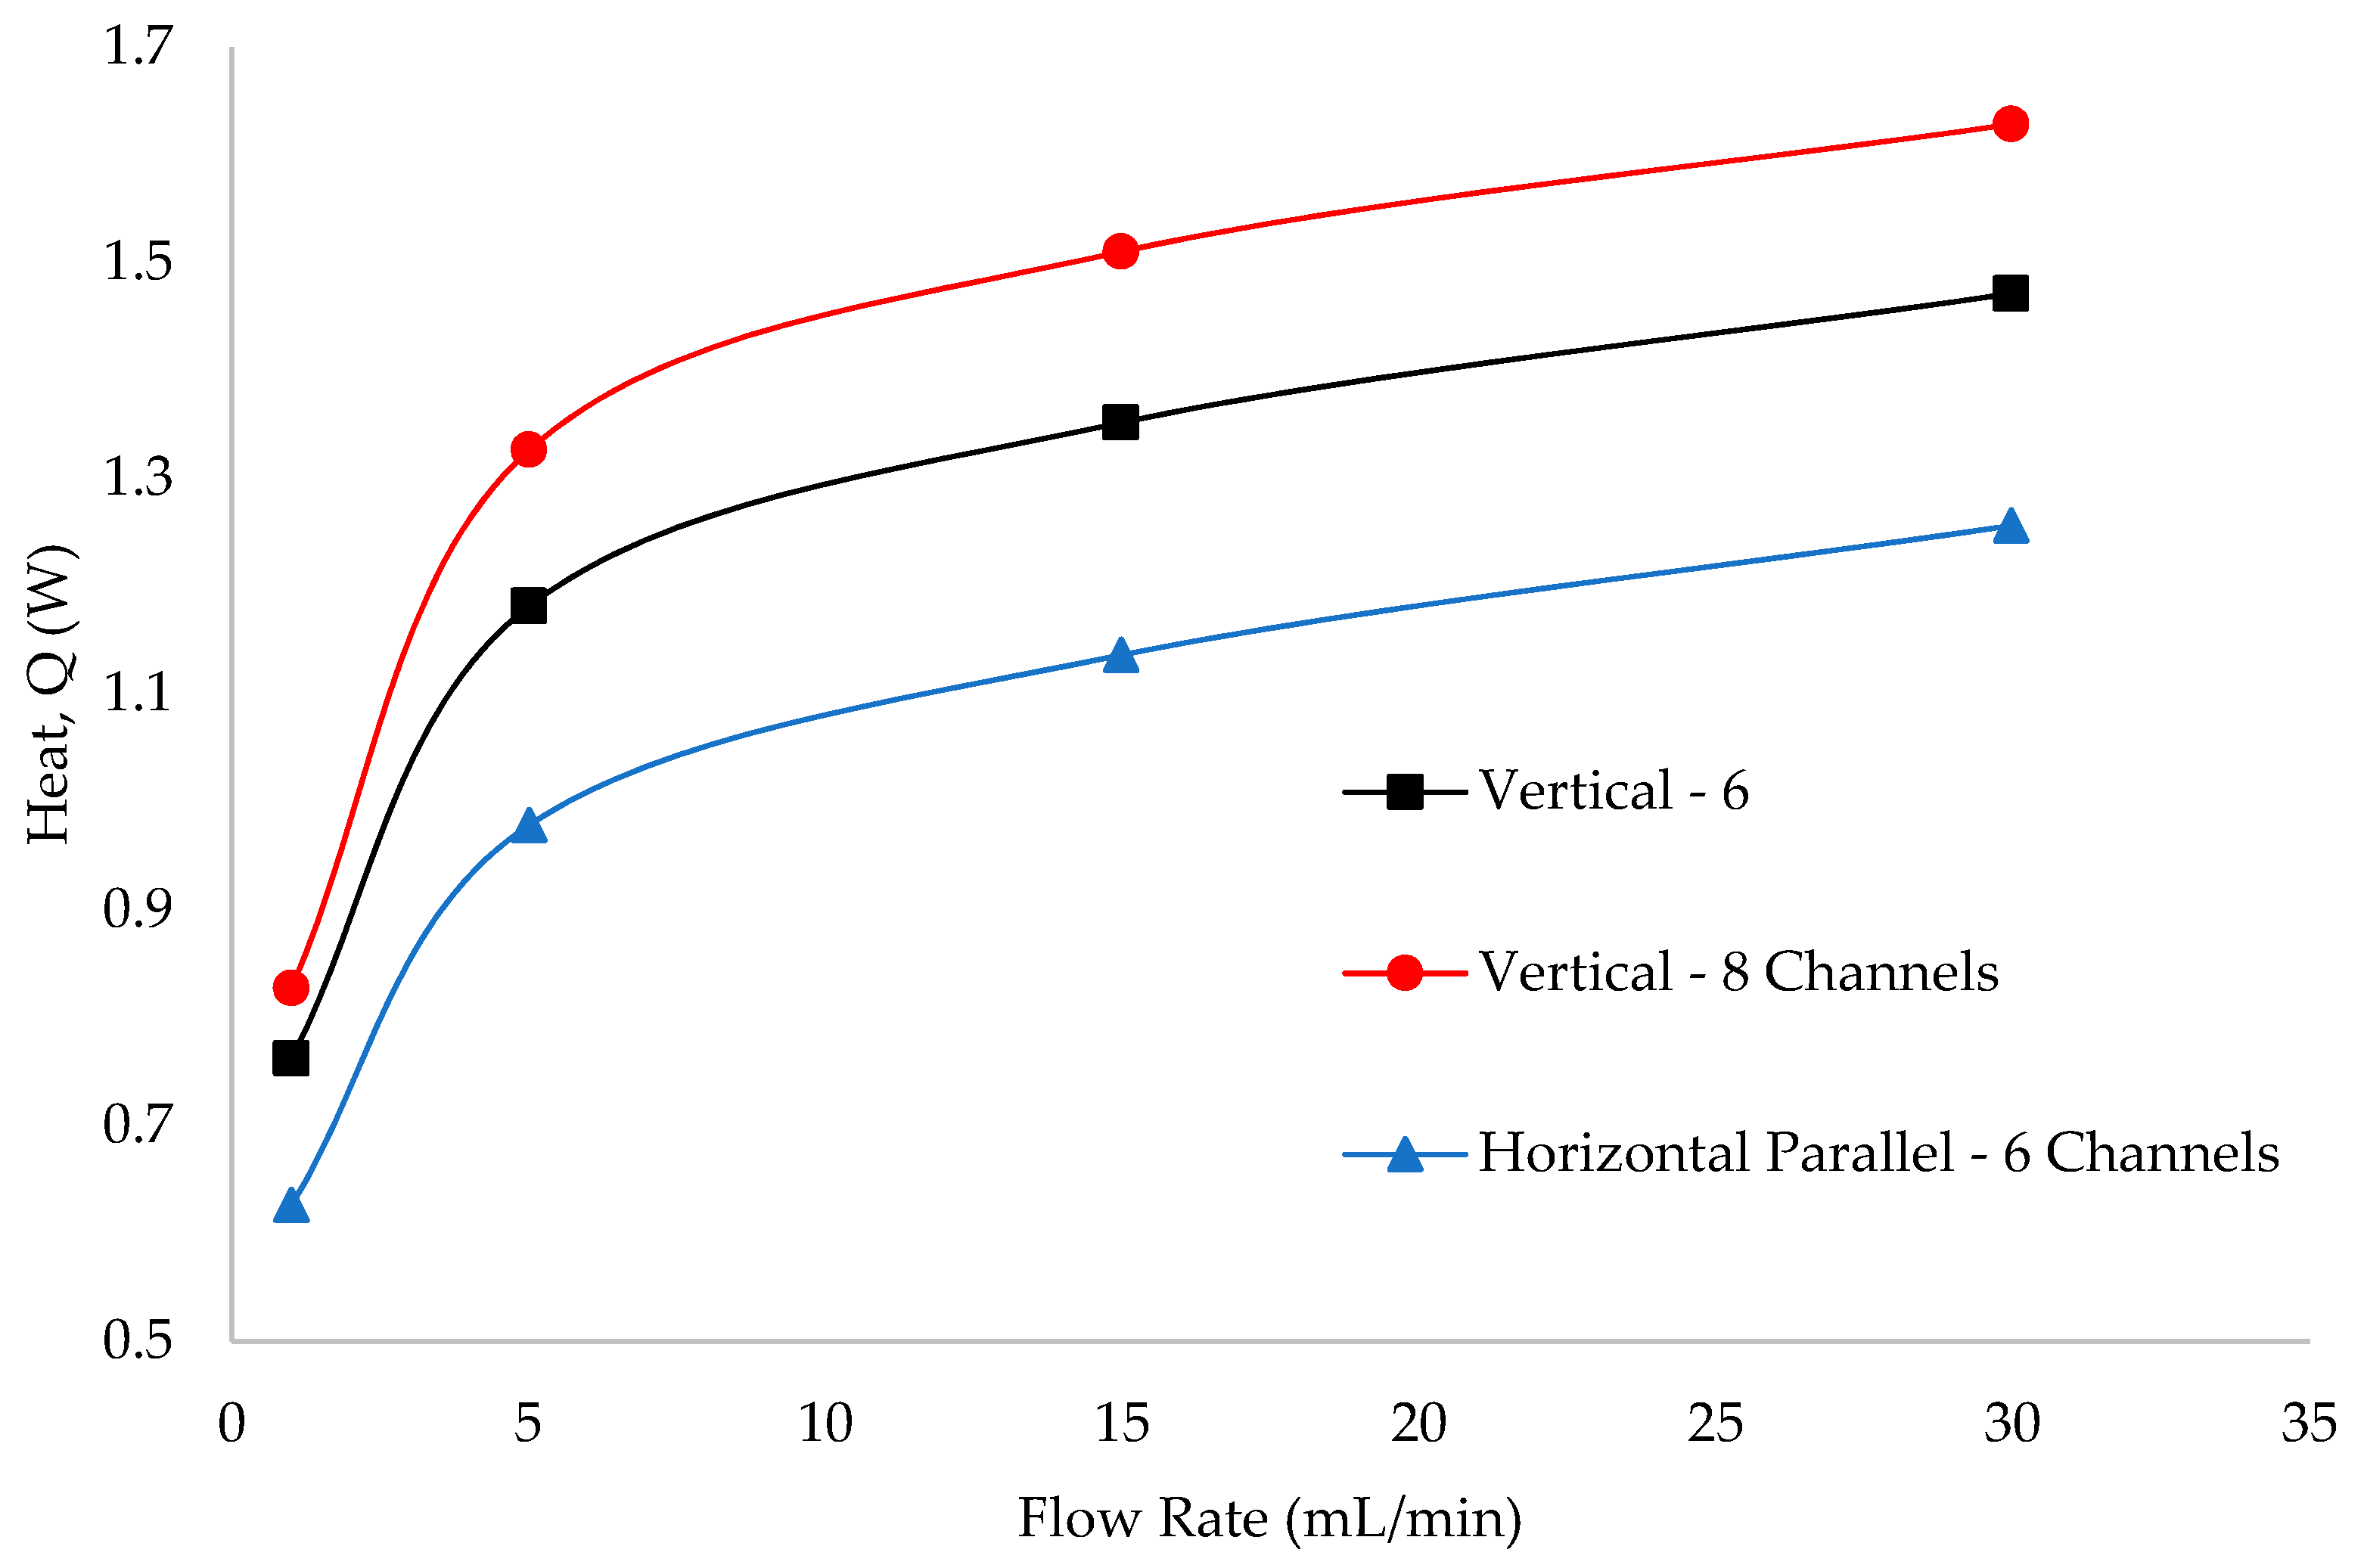
3.3. Effect on Heat Transfer

Figure 21 shows the total amount of heat dissipated by the device as a function of the flow rate. The relation between the geometry and heat transfer was confirmed, particularly in the FDU context. It should be emphasized that the geometries that present a greater uniformity also dissipate more heat.
The Figure 22 clearly shows that the temperature is not uniform in all channels, it also being possible to note that in the exit region of the collector, the average temperature is higher for the heat sink configurations with lower flow distribution uniformity. This was also noted by [32].
As the horizontal parallel geometry has the least uniform flow, it is suitable for the further analysis of the influence of flow distribution on heat dissipation. Figure 23 shows the heat transfer and the flow distribution in each channel. The heat transfer was maximized in the edge channels and was approximately uniform in the central region. The velocity of the flow and the temperature difference vary inversely, the heat transfer being maximized at the edge with greater velocity and at the one with a smaller velocity (by the greater temperature difference), with those effects being mitigated in the central channels, originating an intermedium heat transfer. The heat transfer increased globally in the vertical heat sink, especially in the central channels that present the greatest comparative gain, whichis in agreement with the conclusions reported in [33]. It is in this regard that it was inferred that the development of a uniformly distributed flow will be advantageous, since it will increase the global heat transfer of the heat sink and will likely cover a greater effective area.

4. Concluding Remarks

The present work comprehensively investigated the impacts of different straight microchannel geometry designs of heat sinks on the flow and heat distribution throughout the channels via numerical modeling. The simulations were performed with the conjugate heat transfer module ofthe software COMSOL Multiphysics 5.6®. From the different relative positions of the inlet and outlet that were tested, the vertical placement allowed the development of a flow with greater uniformity, while the frontal placement showed the highest flow maldistribution. The results also showed that the collector with a rectangular shape was the one leading to greater uniformity, while the triangular shape led to the least uniformity since the geometry causes a disturbance in the jet impingement. Additionally, this study indicates that increasing the number of channels tends to improve the uniformity of the flow distribution. In this way, the microchannel heat sink that showed the greatest flow uniformity and heat transfer performance was the heat sink with the vertical placement of the inlet and outlet, a rectangular collector, and eight microchannels.
So, as the main concluding remark, the following guidelines for obtaining an optimized microchannel heat sink design, which is essential to providing high heat dissipation rates, should be considered:
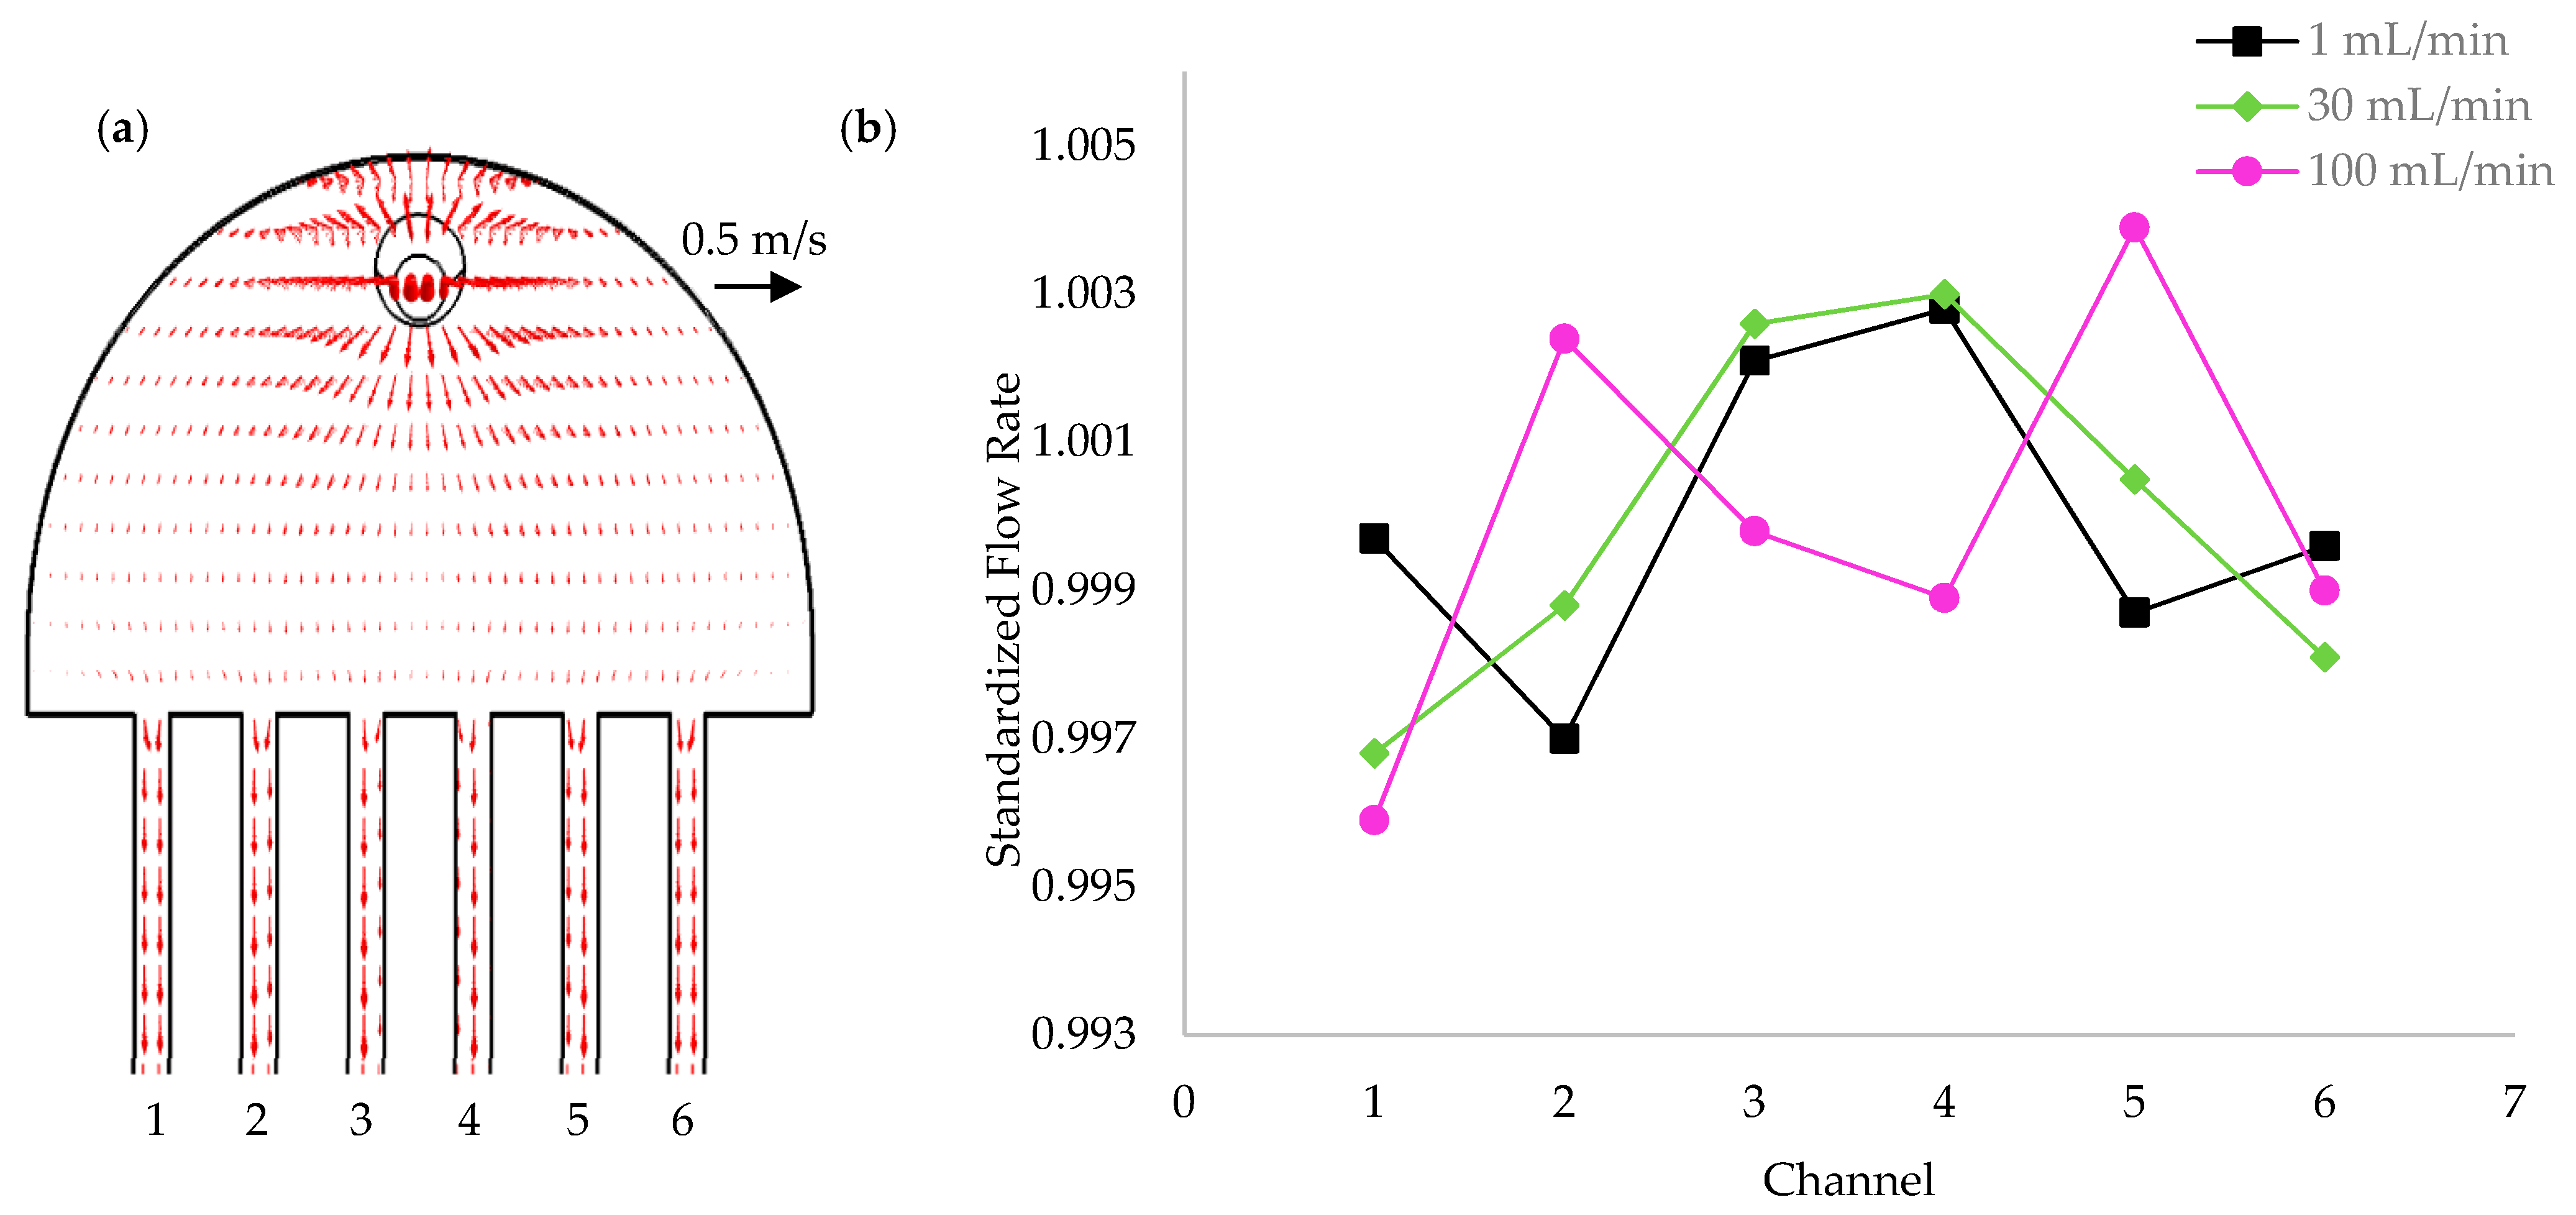
  • A rectangular-shaped collector, since this causes less flow maldistribution and instability.
  • Vertical placement of the inlet and outlet, since, in the particular case of the inlet, this causes less throttling and the easier breaking and spreading of the impinging jet.
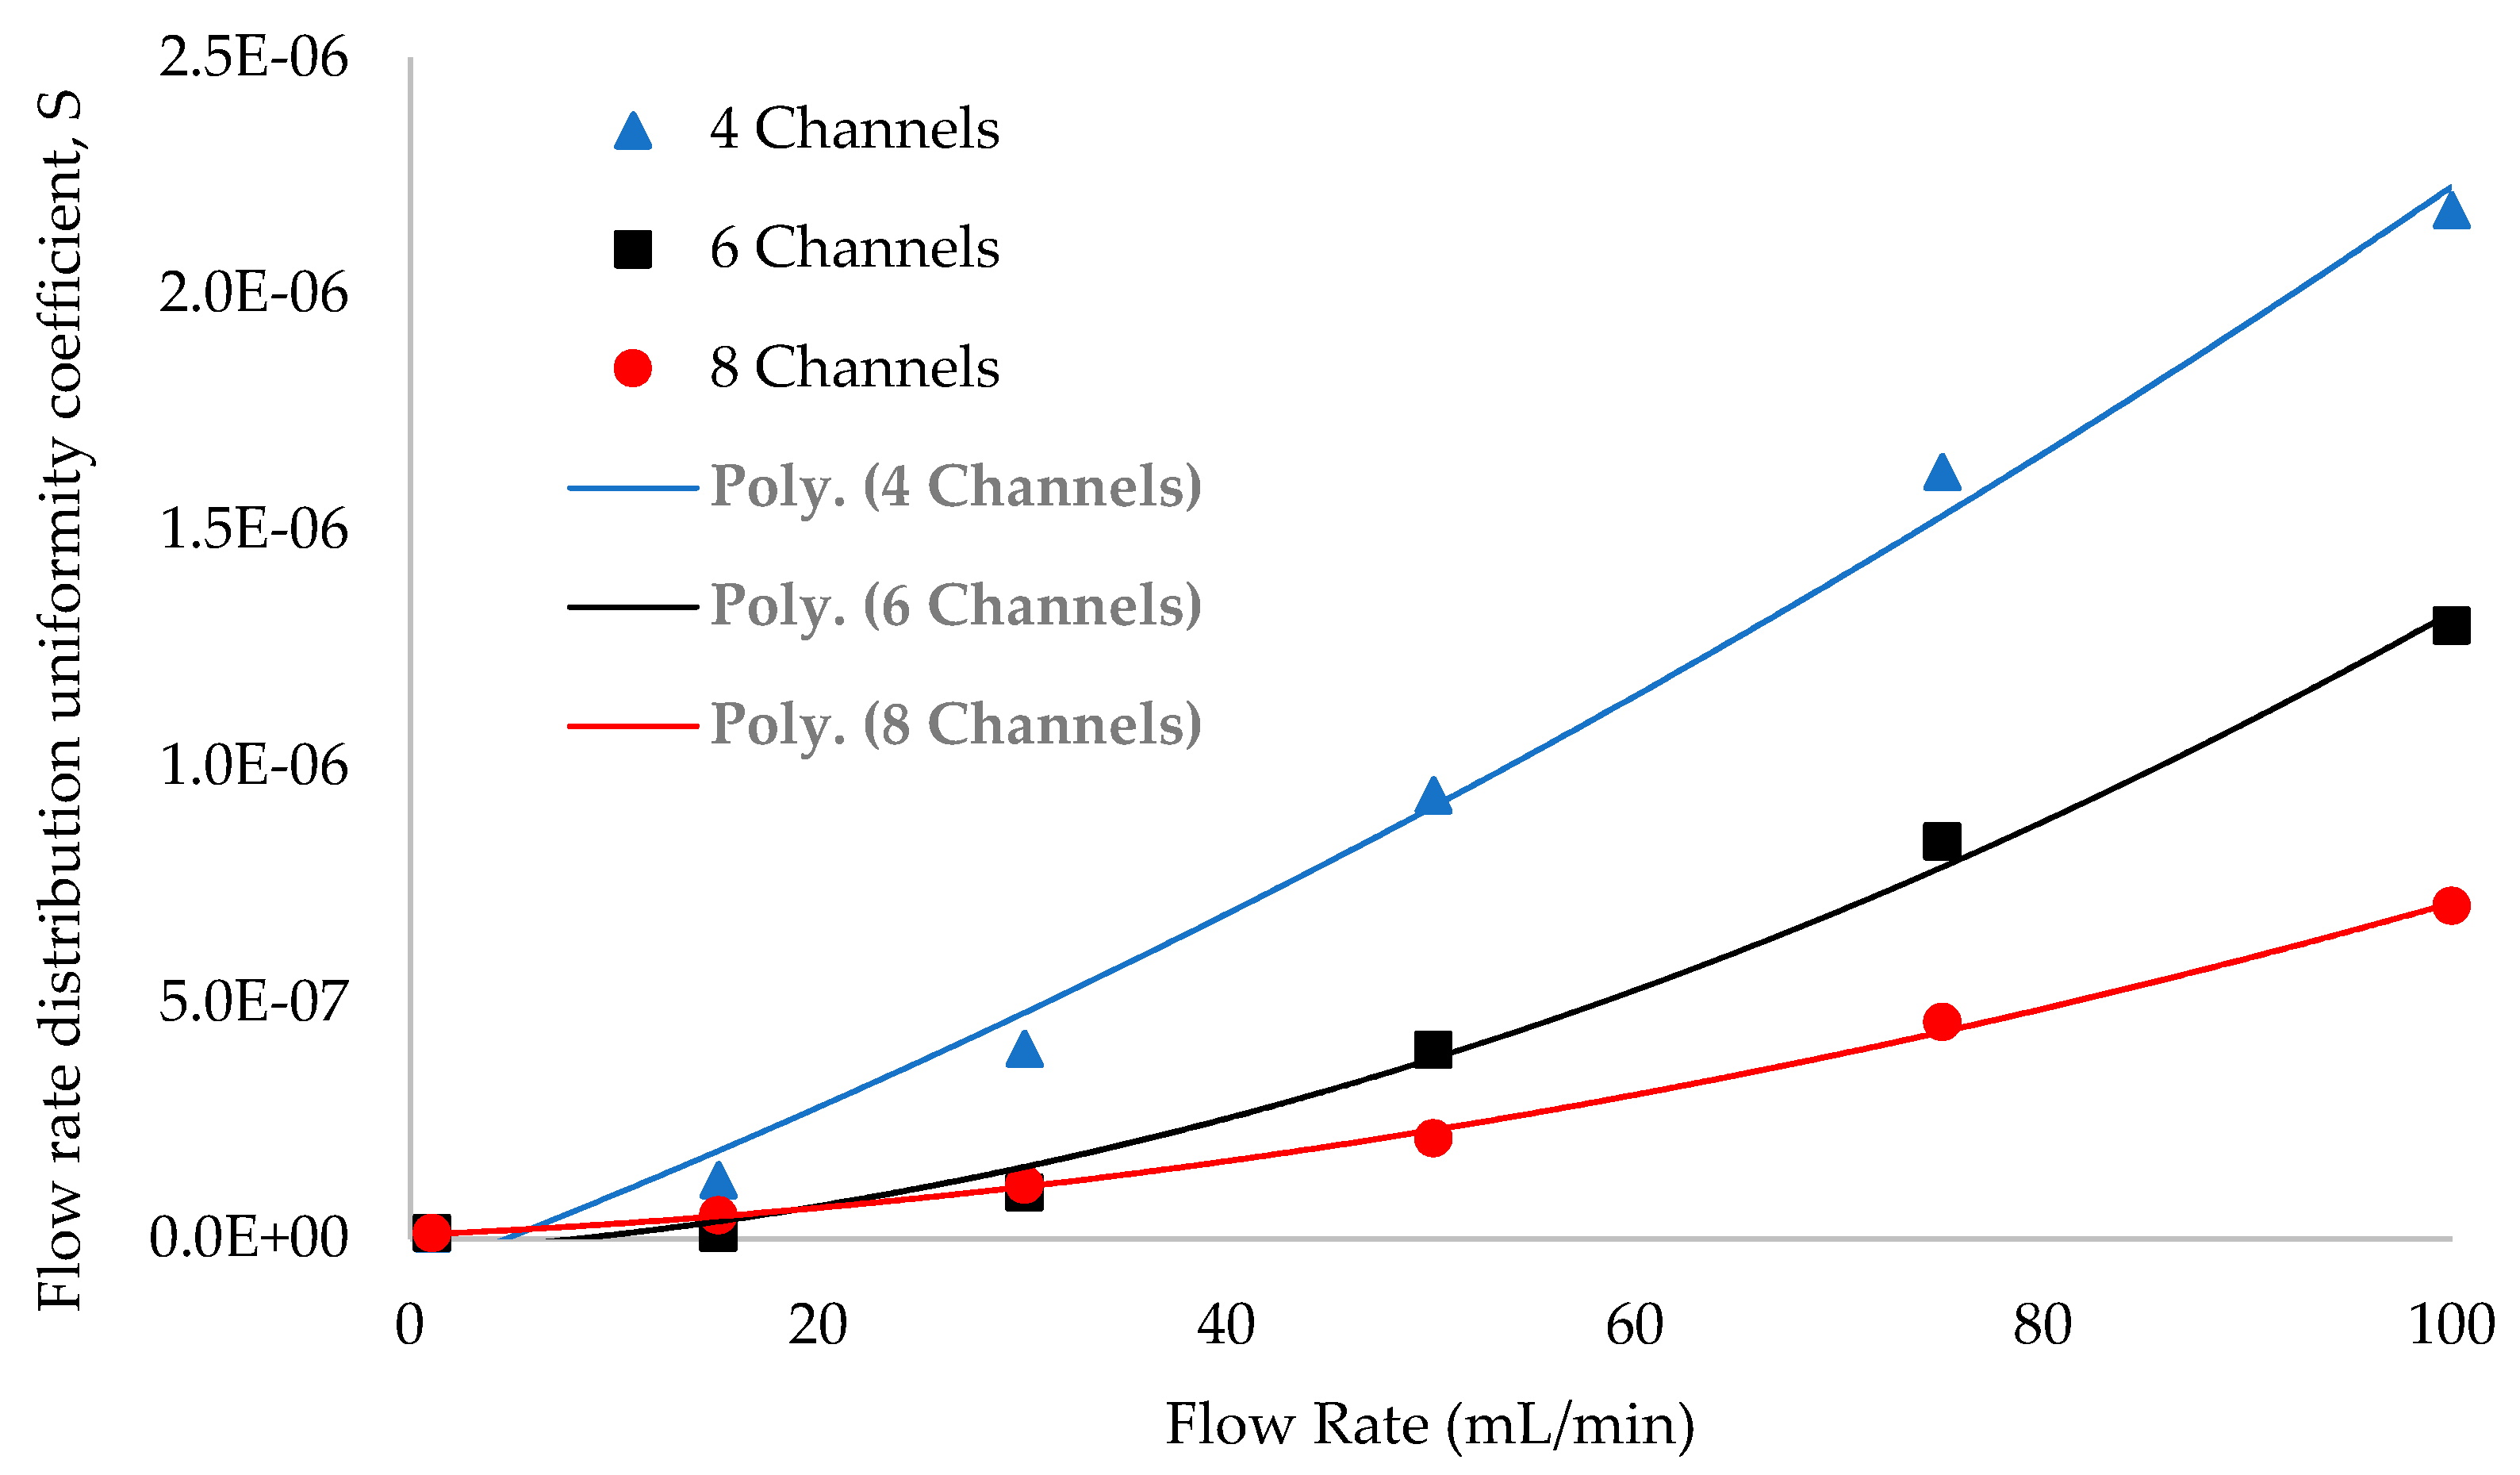
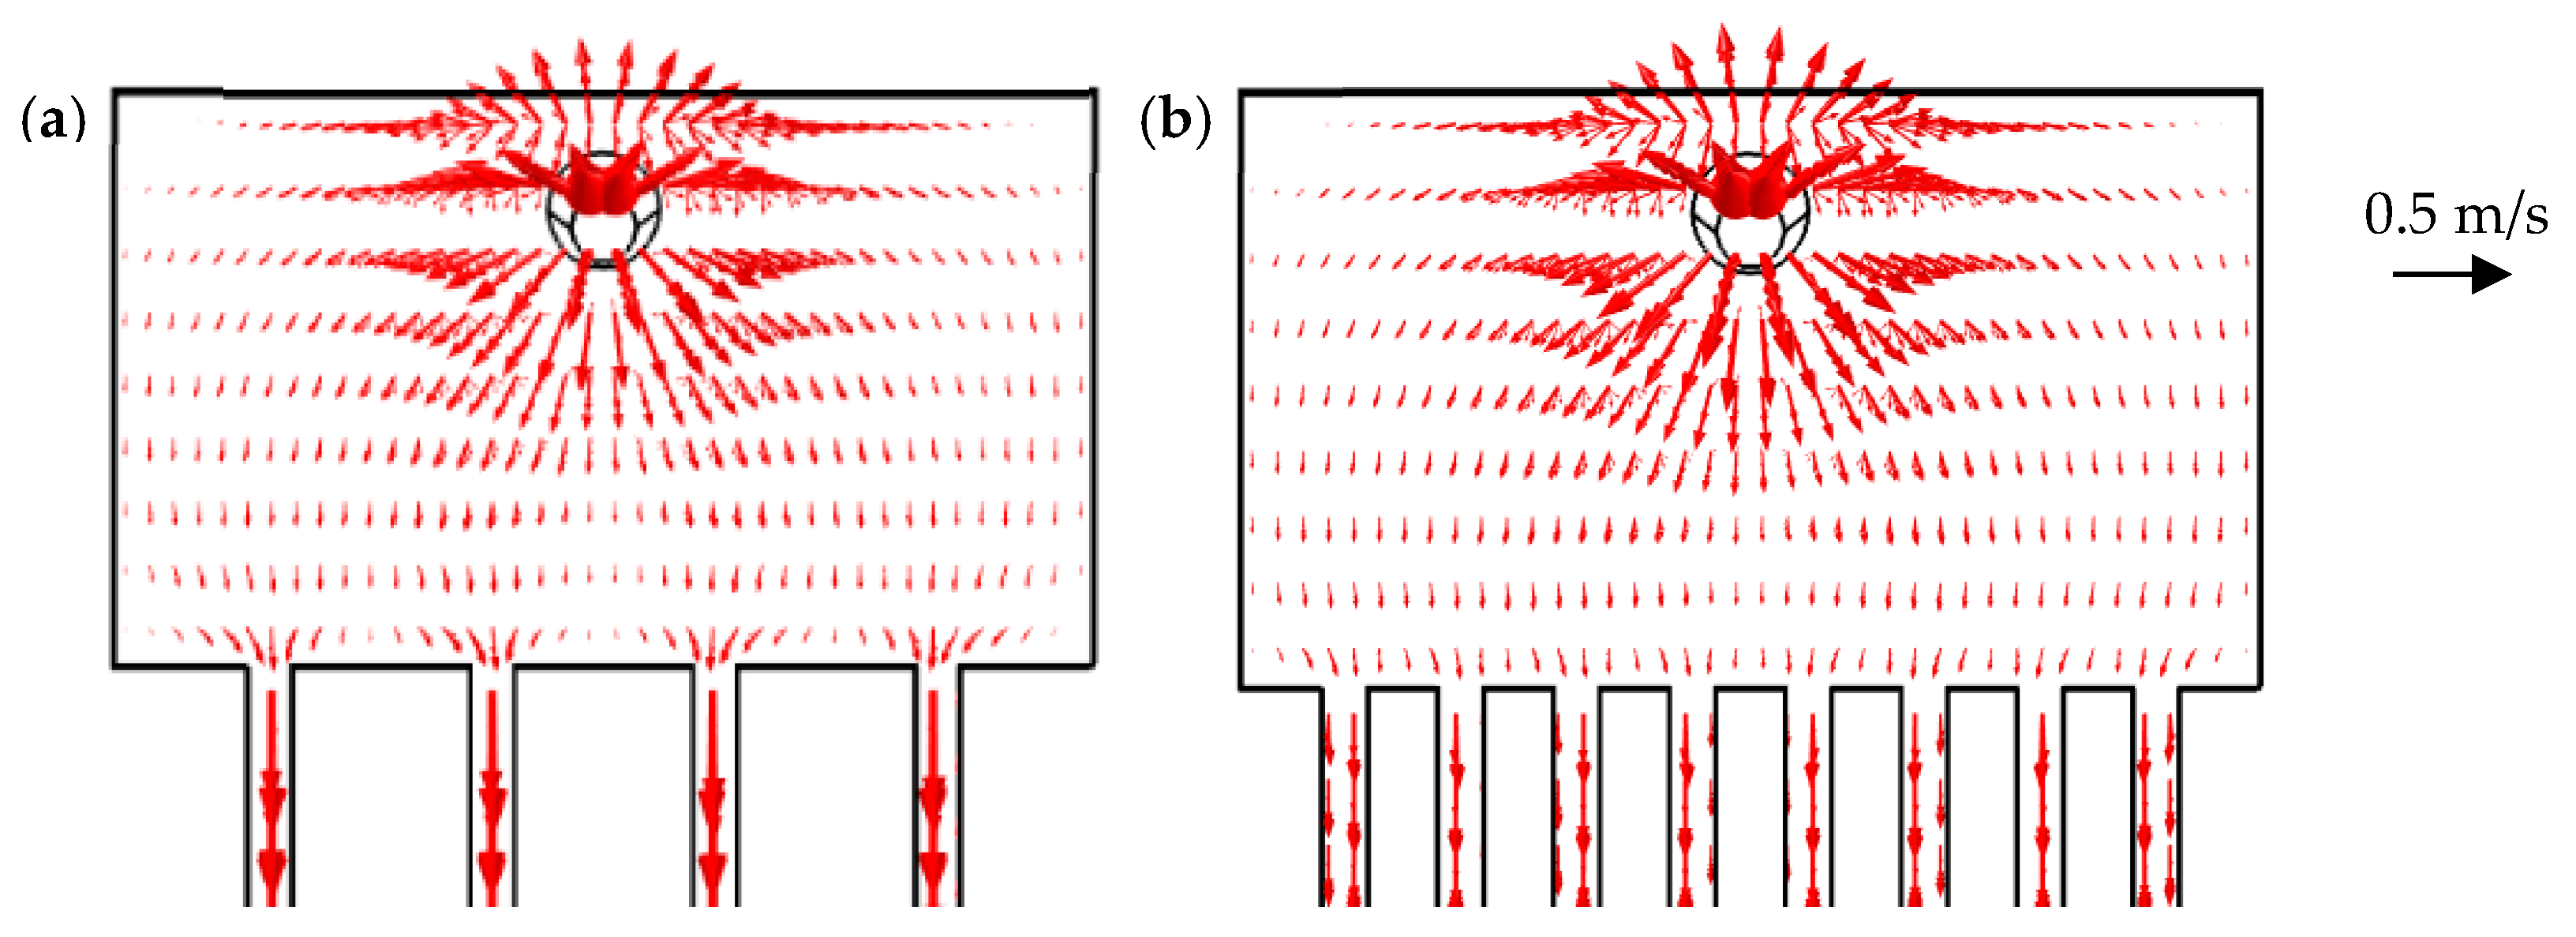
  • The maximum number of microchannels possible within the limits of the intended overall reduced dimensions of the heat sinks (eight in the case of the current work).
These guidelines, together with the results obtained in this work, highlight the key role played by the optimization of the geometrical arrangement of thermal management devices. Scaling down from macro- to micro-devices entails several issues related to the flow rate and the distribution that must be considered. The most preeminent practical impact of this work is the guidance offered for the design and production of more efficient and cost-effective miniaturized devices, such as micro channel heat sinks, which seem to be the most reliable thermal management technology due to their command of heat transfer capability.
In future work, it will be important to compare the results to experimental models, and also to test, numerically and experimentally, the flow of nanofluids in microchannel heat sinks with an optimized design.

Author Contributions

Conceptualization, A.S.M., J.M.M., C.R., R.R.S. and R.L.; methodology, A.S.M., J.M.M., C.R., R.L. and R.R.S.; formal analysis, A.S.M., J.M.M., C.R., R.R.S. and I.M.G.; investigation, A.S.M., J.M.M., C.R., R.R.S., I.M.G., J.E.P. and G.C., resources, A.S.M., J.M.M., R.L., R.R.S. and A.L.N.M., data curation, C.R., R.R.S. and I.M.G., writing-original drafting preparation, A.S.M., C.R., R.R.S., I.M.G., J.E.P., writing-review and editing, A.S.M., J.M.M., C.R., R.R.S., R.L., J.E.P., A.L.N.M., G.C.; visualization, A.S.M., J.M.M., C.R., R.R.S., supervision, A.S.M., R.L. and J.M.M.; project administration, A.S.M., R.L., J.M.M. and A.L.N.M., funding acquisition, A.S.M., R.L., J.M.M. and A.L.N.M. All authors have read and agreed to the published version of the manuscript.

Funding

This research received no external funding.

Institutional Review Board Statement

Not applicable.

Informed Consent Statement

Not applicable.

Acknowledgments

This work has been funded by Portuguese national funds of FCT/MCTES (PIDDAC) through base funding from the following research units: UIDB/00532/2020 (Transport Phenomena Research Center-CEFT), UIDB/04077/2020 (MEtRICs) and UIDP/04436/2020. The authors are also grateful for the funding of Fundação para a Ciência e a Tecnologia-FCT through the projectsLISBOA-01-0145-FEDER-030171/NORTE-01-0145-FEDER-030171 (PTDC/EME-SIS/30171/2017), funded by COMPETE2020, NORTE2020, PORTUGAL2020, and FEDER. The authors also acknowledge FCT for partially financing the research under the framework of the project JICAM/0003/2017. Finally, I. Gonçalves acknowledges FCT for supporting her PhD fellowship, ref.: 2020.08646.BD.

Conflicts of Interest

The authors declare no conflict of interest.

Nomenclature

ASurface area (m2)
CpSpecific heat(J/kg·K)
fForce(N)
GStrain rate tensor (1/s)
HChannel height (m)
hEnthalpy (J)
kThermal conductivity (W/m·K)
LHeat sink length (m)
NNumber of channels
pPressure (Pa)
qFlow rate (mL/min or m3/s)
QHeat (W)
SFlow distribution uniformity coefficient
tTime (s)
TTemperature (K)
uVelocity field (m/s)
VVelocity (m/s)
WHeat sink width (m)
ZHeat sink height (m)
Greek Symbols
αpThermal expansion coefficient (1/K)
ϕVolume fraction (-)
υKinematic viscosity (m2/s)
ρDensity (kg/m3)
τViscous stress tensor
Subscripts
cChannel
wWall
bBase

References

  1. Wang, J.; Wang, M.; Li, Z. A lattice Boltzmann algorithm for fluid–solid conjugate heat transfer. Int. J. Therm. Sci. 2007, 46, 228–234. [Google Scholar] [CrossRef]
  2. Jha, B.K.; Aina, B.; Ajiya, A.T. MHD natural convection flow in a vertical parallel plate microchannel. Ain Shams Eng. J. 2015, 6, 289–295. [Google Scholar] [CrossRef] [Green Version]
  3. Catarino, S.O.; Rodrigues, R.O.; Pinho, D.; Miranda, J.M.; Minas, G.; Lima, R. Blood Cells Separation and Sorting Techniques of Passive Microfluidic Devices: From Fabrication to Applications. Micromachines 2019, 10, 593. [Google Scholar] [CrossRef] [Green Version]
  4. Rodrigues, R.O.; Sousa, P.; Gaspar, J.; Bañobre-López, M.; Lima, R.; Minas, G. Organ-on-a-chip: A Preclinical Microfluidic Platform for the Progress of Nanomedicine. Small 2020, 16, 1–19. [Google Scholar]
  5. Shalchi-Tabrizi, A.; Seyf, H.R. Analysis of entropy generation and convective heat transfer of Al2O3 nanofluid flow in a tangential micro heat sink. Int. J. Heat Mass Transf. 2012, 55, 4366–4375. [Google Scholar] [CrossRef]
  6. Benedetto, A.D.; Sarli, V.D.; Russo, G. Effect of geometry on the thermal behaviour of catalytic micro-combustors. Catal. Today 2010, 155, 116–122. [Google Scholar] [CrossRef]
  7. Sarli, V.D.; Trofa, M.; Benedetto, A.D. A Novel Catalytic Micro-Combustor Inspired by the Nasal Geometry of Reindeer: CFD Modeling and Simulation. Catalysts 2020, 10, 606. [Google Scholar] [CrossRef]
  8. Xu, Z.; Li, Y.K.; Wang, J.Y.; Liu, C.; Liu, J.S.; Chen, L.; Wang, L.D. A novel method for fabrication of micro-nanofluidic devices and its application in trace enrichment. FenxiHuaxue Chin. J. Anal. Chem. 2014, 42, 166–172. [Google Scholar] [CrossRef]
  9. Comsol Multiphysics Software Features. Available online: https://www.comsol.com/comsol-multiphysics (accessed on 10 February 2021).
  10. Teodori, E.; Andredaki, M.; Georgoulas, A.; Moita, A.; Moreira, A.; Marengo, M. Enhanced VOF-based direct numerical simulations of slug flow boiling within micro-channels with smooth and finned heated walls. Int. Heat Transf. Conf. 2018, 18, 6503–6510. [Google Scholar]
  11. D’Orazio, A.; Karimipour, A. A useful case study to develop lattice Boltzmann method performance: Gravity effects on slip velocity and temperature profiles of an air flow inside a microchannel under a constant heat flux boundary condition. Int. J. Heat Mass Transf. 2019, 136, 1017–1029. [Google Scholar] [CrossRef]
  12. Wang, H.L.; Yang, M.; Wang, Y. Analytical and numerical solutions for the flow in microtube with three-dimensional corrugated surface, part 1: Steady flow. J. Hydrodyn. 2010, 22, 647–656. [Google Scholar] [CrossRef]
  13. Yang, L.; Yu, Y.; Hou, G.; Wang, K.; Xiong, Y. Boundary conditions with adjustable slip length for the lattice Boltzmann simulation of liquid flow. Comput. Fluids 2018, 174, 200–212. [Google Scholar] [CrossRef] [Green Version]
  14. Di Capua, H.M.; Escobar, R.; Diaz, A.J.; Guzmán, A.M. Enhancement of the cooling capability of a high concentration photovoltaic system using microchannels with forward triangular ribs on sidewalls. Appl. Energy 2018, 226, 160–180. [Google Scholar] [CrossRef]
  15. Muhammad, A.; Selvakumar, D.; Wu, J. Numerical investigation of laminar flow and heat transfer in a liquid metal cooled mini-channel heat sink. Int. J. Heat Mass Transf. 2020, 150, 119265. [Google Scholar] [CrossRef]
  16. Alfellag, M.A.; Ahmed, H.E.; Kherbeet, A.S. Numerical simulation of hydrothermal performance of minichannel heat sink using inclined slotted plate-fins and triangular pins. Appl. Therm. Eng. 2020, 164, 114509. [Google Scholar] [CrossRef]
  17. Ong, Y.S.; KuShaari, K.Z. CFD investigation of the feasibility of polymer-based microchannel heat sink as thermal solution. Chin. J. Chem. Eng. 2020, 28, 980–994. [Google Scholar] [CrossRef]
  18. Freegah, B.; Hussain, A.A.; Falih, A.H.; Towsyfyan, H. CFD analysis of heat transfer enhancement in plate-fin heat sinks with fillet profile: Investigation of new designs. Therm. Sci. Eng. Prog. 2020, 17, 100458. [Google Scholar] [CrossRef]
  19. Hempijid, T.; Kittichaikarn, C. Effect of heat sink inlet and outlet flow direction on heat transfer performance. Appl. Therm. Eng. 2020, 164, 114375. [Google Scholar] [CrossRef]
  20. Sajadifar, S.A.; Karimipour, A.; Toghraie, D. Fluid flow and heat transfer of non-Newtonian nanofluid in a microtube considering slip velocity and temperature jump boundary conditions. Eur. J. Mech. B/Fluids 2017, 61, 25–32. [Google Scholar] [CrossRef]
  21. Awais, A.A.; Kim, M.H. Experimental and numerical study on the performance of a minichannel heat sink with different header geometries using nanofluids. Appl. Therm. Eng. 2020, 171, 115125. [Google Scholar] [CrossRef]
  22. Bahiraei, M.; Heshmatian, S.; Goodarzi, M.; Moayedi, H. CFD analysis of employing a novel ecofriendly nanofluid in a miniature pin fin heat sink for cooling of electronic components: Effect of different configurations. Adv. Powder Technol. 2019, 30, 2503–2516. [Google Scholar] [CrossRef]
  23. HadiNajafabadi, H.; Keshavarz Moraveji, M. CFD investigation of local properties of Al2O3/water nanofluid in a converging microchannel under imposed pressure difference. Adv. Powder Technol. 2017, 28, 763–774. [Google Scholar] [CrossRef]
  24. Ganguly, S.; Sarkar, S.; Kumar Hota, T.; Mishra, M. Thermally developing combined electroosmotic and pressure-driven flow of nanofluids in a microchannel under the effect of magnetic field. Chem. Eng. Sci. 2015, 126, 10–21. [Google Scholar] [CrossRef]
  25. Huc, N. Conjugate Heat Transfer. Available online: https://www.comsol.com/blogs/conjugate-heat-transfer/ (accessed on 12 January 2021).
  26. Maia, I.; Rocha, C.; Pontes, P.; Cardoso, V.; Miranda, J.M.; Moita, S.A.; Minas, G.; Moreira, L.N.A.; Lima, R. Heat Transfer and Fluid Flow Investigations in PDMS Microchannel Heat Sinks Fabricated by Means of a Low-Cost 3D Printer. In Advances in Microfluidic Technologies for Energy and Environmental Applications; IntechOpen: London, UK, 2020. [Google Scholar]
  27. Wollblad, C. Your Guide to Meshing Techniques for Efficient CFD Modeling. Available online: https://www.comsol.com/blogs/your-guide-to-meshing-techniques-for-efficient-cfd-modeling/ (accessed on 12 January 2021).
  28. Gothäll, H. How to Inspect Your Mesh in COMSOL Multiphysics®. Available online: https://www.comsol.com/blogs/how-to-inspect-your-mesh-in-comsol-multiphysics/ (accessed on 12 January 2021).
  29. Cengel, Y.A. Heat Transfer—A Practical Approach, 2nd ed.; McGraw-Hill Education: New York City, NY, USA, 2002; ISBN 9780072458930. [Google Scholar]
  30. Takács, G.; Bognár, G.; Bándy, E.; Rózsás, G.; Szabó, P.G. Fabrication and characterization of microscale heat sinks. Microelectron. Reliab. 2017, 79, 480–487. [Google Scholar] [CrossRef]
  31. Ghani, I.A.; Che Sidik, N.A.; Kamaruzzaman, N.; Jazair Yahya, W.; Mahian, O. The effect of manifold zone parameters on hydrothermal performance of micro-channel HeatSink: A review. Int. J. Heat Mass Transf. 2017, 109, 1143–1161. [Google Scholar] [CrossRef]
  32. Wang, T.; Wang, J.; He, J.; Wu, C.; Luo, W.; Shuai, Y.; Zhang, W.; Chen, X.; Zhang, J.; Lin, J. A Comprehensive Study of a Micro-Channel Heat Sink Using Integrated Thin-Film Temperature Sensors. Sensors 2018, 18, 299. [Google Scholar] [CrossRef] [PubMed] [Green Version]
  33. Memon, S.A.; Cheema, T.A.; Kim, G.M.; Park, C.W. Hydrothermal Investigation of a Microchannel Heat Sink Using Secondary Flows in Trapezoidal and Parallel Orientations. Energies 2020, 13, 5616. [Google Scholar] [CrossRef]
Figure 1. Schematic representation of the acrylonitrile–butadiene–styrene (ABS) master mold and respective dimensions (heat sink length, L; width, W; height, Z).
Applsci 11 02440 g001
Figure 2. Tetrahedral structures in the core of the channel involved in a shell.
Applsci 11 02440 g002
Figure 3. Details of the mesh in the collector.Highlighted: the inlet region and the transition between the collector and the channels.
Applsci 11 02440 g003
Figure 4. Example of the geometry used in the heat transfer simulation, wherein both domains of the simulation can be seen.
Applsci 11 02440 g004
Figure 5. Flow distribution in the microchannels for two different flow rates.
Applsci 11 02440 g005
Figure 6. View of the temperature profile of a fluid flow at different flow rates:(a) 1 mL/min; (b) 30 mL/min.
Applsci 11 02440 g006
Figure 7. Temperature evolution throughout each channel, from the entrance to the exit, with a fluid flow of 1 mL/min.
Applsci 11 02440 g007
Figure 8. Trajectory of the fluid in the collector and respective distribution to the channels at a fluid flow of 100 mL/min and at a scale of 5.
Applsci 11 02440 g008
Figure 9. Comparison of the difference in temperature generated in the experimental tests and in the numerical simulation.
Applsci 11 02440 g009
Figure 10. Different configurations for the microchannel device: (a) horizontal frontal; (b) horizontal parallel; (c) horizontal parallel inverted; (d) vertical.
Applsci 11 02440 g010
Figure 11. Coefficient of the uniformity distribution of the flow for different heat sink configurations.
Applsci 11 02440 g011
Figure 12. Flow distribution uniformity (FDU) study for the frontal configuration. (a) Schematic view of the velocity profile for a 100 mL/min flow and at a scale of 2. (b) The standardized flow in each channel of the heat sink.
Applsci 11 02440 g012
Figure 13. FDU study for the inverted horizontal configuration. (a) Schematic view of the velocity profile for a 100 mL/min flow and at a scale of 2. (b) The standardized flow in each channel of the heat sink.
Applsci 11 02440 g013
Figure 14. FDU study for the vertical configuration. (a) Schematic view of the velocity profile for a 100 mL/min flow and at a scale of 2. (b) The standardized flow in each channel of the heat sink.
Applsci 11 02440 g014
Figure 15. Influence of the shape of the collector on the FDU coefficient, S.
Applsci 11 02440 g015
Figure 16. FDU study for the triangular shape. (a) Schematic view of the velocity profile for a 5 mL/min flow and at a scale of 20. (b) Schematic view of the speed profile for a 100 mL/min flow and at scale of 2.
Applsci 11 02440 g016
Figure 17. Standardized flow in each channel of the heat sink with triangular-shaped collectors, for different flow rates.
Applsci 11 02440 g017
Figure 18. FDU study for the circular shape. (a) Schematic view of the velocity profile for a 100 mL/min flow and at a scale of 2. (b) Standardized flow in each channel of the heat sink.
Applsci 11 02440 g018
Figure 19. Influence of the number of channels of the heat sink on the FDU coefficient.
Applsci 11 02440 g019
Figure 20. FDU study for different numbers of channels for a 100 mL/min fluid flow at a scale of 5. (a) Velocity profile for four-channel configuration. (b) Velocity profile for eight-channel configuration.
Applsci 11 02440 g020
Figure 21. Heat transfer for three different configurations.
Applsci 11 02440 g021
Figure 22. Temperature profiles for the studied configurations for heat transfer at a flow rate of 5 mL/min: (a) Vertical Rectangular with 8 channels; (b) Vertical Rectangular with 6 channels; (c) Horizontal Parallel with 6 channels.
Applsci 11 02440 g022
Figure 23. Heat transfer rate in each channel of the geometries: (a) Vertical rectangular. (b) Horizontal parallel.
Applsci 11 02440 g023
Table 1. Main characteristics of the mesh used for convergence in fluid flow studies.
MeshA1A2A3A4
Maximum Size (mm)0.6090.4250.2640.23
Minimum Size (mm)0.1150.0460.01720.015
Maximum Growth1.131.11.081.08
Curve Factor0.50.40.30.25
Resolution of Narrow Regions0.80.90.950.95
Elements Number125,426402,3651,342,3651,975,310
Average Quality0.55690.6050.63590.6478
Simulation Time1 min 26 s3 min 26 s8 min 54 s14 min 12 s
Table 2. Main characteristics of the meshes used for convergence in heat transfer studies.
MeshB1B2B3B4B5B6
Maximum Size (mm)10.575.63.852.451.4
Minimum Size (mm)1.961.260.70.280.1050.014
Maximum Growth1.61.51.451.41.351.3
Curve Factor0.70.60.50.40.30.2
Resolution of Narrow Regions0.40.50.60.70.851
Elements Number126,348151,540167,311188,105239,112366,980
Average Quality0.6610.6910.7010.7130.7250.746
Table 3. Main properties of the fluid and solid used in the numerical simulations.
WaterPDMS
Viscosity [ Pa × s ] 0.00101-
Density [ kg / m 3 ] 1001.6970.0
Specific Heat [ J / kg × K ] 4182.51460.0
Thermal Conductivity [ W / ( m × K ) ] 0.6030.180
Specific Heat Ratio1-
Table 4. Boundary conditions used in the current simulation for solid and fluid domains.
SurfaceBoundary ConditionsMathematical Expression
InletFlow Rate Inlet q I N t ,   t [ 1 ,   100 ] , Tmean = 20 °C
OutletPressure OutletPOUT = 0 Pa (free atmosphere) and ΔTOUT = 0
Fluid–Solid InterfaceNo-slip Interface K f × T f   =   K P D M S × T P D M S and Tf = TPDMS
Sided WallsAdiabatic K i × ( T i x ) = K i ( T i y ) = 0
Interface between the Heater and PDMSThermal Coupled K H × T H   =   K P D M S × T PDMS and TH = TPDMS
Bottom Surface of the PDMSMixed Radiation and Convection K P D M S × ( T P D M S z ) = q r a d ,   P D M S   s + q c o v ,   P D M S   a
Publisher’s Note: MDPI stays neutral with regard to jurisdictional claims in published maps and institutional affiliations.

