Abstract
According to recent UN reports, it is estimated that more than one billion people live in informal settlements globally, exposing them to a large potential fire risk. In previous research, it was found that the main fire spread mechanism between dwellings is the external flaming (plume) and radiative heat fluxes from the vertical openings at the dwelling of origin to the surroundings. In this paper, an experimental and numerical study was conducted to quantify the effect of adding horizontal roof openings to the design of informal settlement dwellings to reduce the fire spread risk by decreasing the length of flames and radiation from the external plumes at the vertical openings. In total, 19 quarter scale ISO-9705 compartment fire experiments were conducted using an identical fuel load (80 MJ/m2) of polypropylene and were used to validate a physical computational fluid dynamics model for future studies. Five different total horizontal openings areas (0.0025, 0.01, 0.04, 0.09, and 0.16 m2) were investigated using two horizontal openings designs: (1) four square openings at the four corners of the compartment and (2) one slot cut at the middle of the compartment. It was found that adding horizontal openings decreased the average heat flux measured at the door by up to 65% and 69% for corner and slot cases, respectively. Heat flux reductions were achieved at opening areas as low as 0.01 m2 for slot cases, whereas reductions were only achieved at areas of at least 0.09 m2 for corner cases. The Computational Fluid Dynamics (CFD) model was validated using the experimental results. It successfully captured the main fire dynamics within the compartment in addition to the values of the external radiative heat flux. Further, a new empirical ventilation factor was generated to describe the flow field through both openings configurations which showed strong coupling with the inlet mass of fresh air to the compartment.
Keywords:
compartment fire; horizontal opening; external plume; thermally thin; flashover; urban fire spread; risk; CFD 1. Introduction
Urbanization is one of the most critical global phenomena in today’s world. Urbanization poses immense burdens on infrastructure, essential services, life quality, and safety. It presents a real dilemma mainly in the global south and more specifically within low/middle income countries (LMIC), where cities are expanding in extent and density (e.g., Lagos, Delhi and Cape Town) [1]. With authorities unable to keep up with the housing demand, informal settlements (IS) are often established by the urban vulnerable with more than one billion people currently living within IS across the globe [1]. This number is still increasing—for example, since 1990 more than 213 million IS residents were added to the IS population, putting the IS population at around 25% of the total current urban population [2]. In addition to the increasing IS population, IS inhabitants typically use any available materials to build their homes, which do not comply with formal building codes leaving them vulnerable to hazards such as fire. For example in Western Cape, South Africa, steel sheets and timber are the most used materials for building dwellings [3]. In the last few years, many destructive fires took place within informal settlements around the globe: Dhaka, Bangladesh in 2019 [4]; Imizamo Yethu, South Africa in 2017 [5]; and Bahay Toro, Philippines in 2011 [6].
Informal settlement dwellings (ISDs) are unique in a few aspects compared to formal compartments/dwellings. For example, the walls/boundaries are usually made out of thermally thin (e.g., steel sheets) or combustible materials (e.g., timber); for insulation, the walls are usually internally lined with combustible linings (e.g., cardboard); and due to poor construction, there are usually gaps/leakages in the dwellings’ boundaries (walls and roof) [3]. Therefore, most current understandings of compartment fire dynamics must be adapted to take into account these features.
As shown in Figure 1, fire spread in IS is also unique due to the high dwelling proximity in these settlements, the presence of combustibles between the dwellings, high fuel loads which affects the size of the external plumes, and the effect of vegetation and topography (e.g., wind and land slope) [3,7].
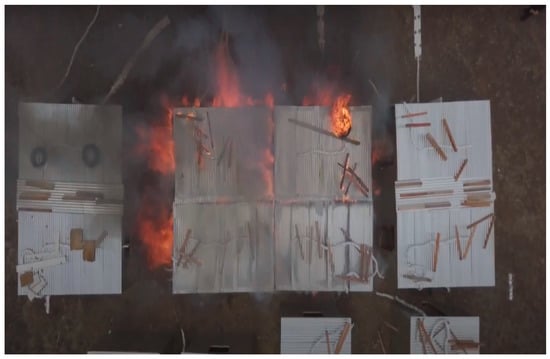
Figure 1.
Large scale experiment performed via the IRIS-Fire project [2] in 2018 emphasizing the size of the external plume from vertical openings (doors and window) and leakage at joins of walls and roofs.
Fire development within Informal Settlements Dwellings (ISDs) and fire spread within the ISs are currently under the focus of intensive research. Since 2017, there have been many experimental and numerical studies to fill the gap of knowledge for these unique compartments and fire spread techniques. In summary, these studies have included (1) bench scale material tests (Wang et al. [8]); (2) small scale experiments determining heat transfer and the heat release rate needed for flashover in thermally thin and thick boundaries (Beshir et al. [9]); (3) large scale outdoor compartment fire experiments determining the difference between timber and steel clad ISD fire behaviour (Cicione et al. [10]), fire spread (Cicione et al. [11]), and critical separation distance; (4) full scale laboratory experiments to understand the fire dynamics and the effect of different boundaries (Wang et al. [12]) and test current theories for temperature, flame shape, and flashover conditions (Wang et al. [13]); (5) modelling the results of these experiments to determine controlled experiments required to validate the Fire Dynamics Simulator (FDS) ISD models [14] and the utility of FDS in capturing fire dynamics in ISDs (Beshir [9,15]); (6) wind tunnel simulations to understand the effects of the wind on the fire dynamics (Centeno et al. [16]); and (7) fire risk mapping using remote sensing and GIS techniques (Stevens et al. [17]) for fire spread modelling (Cicione et al. [18]) and determining critical separation distance (Wang et al. [19]).
In all the previous experimental and modelling work highlighted above, the fires have followed the trend of ventilation-controlled fires. In more detail, ventilation-controlled fires are highly affected by both the size and location of the openings [20]; therefore, to further understand the fire dynamics in relation to the ventilation in ISDs, numerical parametric studies were conducted. Beshir et al. [21] studied the effect of the ventilation location (the dwelling’s window) in relation to the fire dynamics and the external plume behaviour. It was found that the heat flux from the vertical openings (door and window) could vary by up to 60% depending on the relative position of the window from the door and presented the theoretical optimal location of the window relative to the door on each wall.
Beshir et al. [22] then studied numerically, using FDS, the effect of adding horizontal openings (collapsible roofs) to the design of the ISDs, where the idea is simply to cut out parts of the steel-clad roofs of the ISDs and add a thin flammable material with low ignition temperature (e.g., polycarbonate) to collapse, or burn, due to the contact with the hot gas layer before flashover. This will create vents for the gas layer’s hot smoke to escape. The presence of a horizontal openings will allow combustion products to leave the compartment while cool air enters through the vertical openings located at the floor level. This is expected to significantly increase the ventilation to the fire [20] as illustrated in Figure 2, Figure 3 and Figure 4, lower heat fluxes to the combustibles (QRi), increase times to flashover (T), and shorten projected flame lengths from the vertical openings (Xi). The study [22] proved the potential validity of the method for reducing the risk of spread at vertical dwelling openings; therefore, an experimental study was needed to further investigate the idea and validate the FDS code for these conditions.

Figure 2.
Illustration of fire development in compartments.
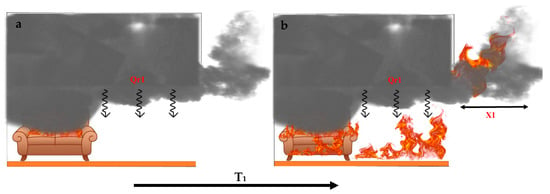
Figure 3.
Illustration of pre-flashover (a) and post-flashover (b) conditions inside a dwelling with vertical openings only.
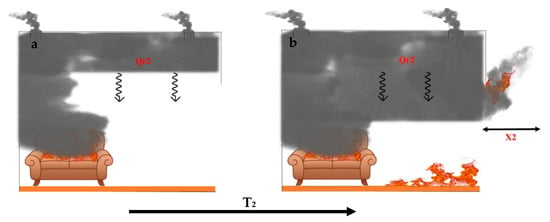
Figure 4.
Illustration of pre-flashover (a) and post-flashover (b) conditions inside a dwelling with horizontal and vertical openings.
Horizontal openings have been studied a few times in fire safety research. Yuan et al. [23] developed a simplified mathematical model to predict the vertical temperature profiles in enclosures without vertical openings. This model was performed on two types of compartments: one without any openings and another with only horizontal (roof vents). The model was then validated against experimental work on a large scale (3.0 × 3.0 × 1.95 m) compartment with a pool fire and thermocouple (TC) tree to measure the temperature profile, where the vent was placed in one of the corners. The model, however, is inadequate for use in the current study due to the lack of the vertical openings as a factor.
Chen et al. [24] conducted a series of experiments with a compartment vented via the roof only to understand the effect of the horizontal opening on the pool fire behaviour, where six different horizontal openings and three pool fire sizes were used. This work also did not consider the fire behaviour with both horizontal and vertical openings present. As expected, the Heat Release Rate (HRR) and the oxygen concentration at extinction was highly affected by the opening size. This study was based on the studies carried out by Epstein [25] and Jaluria et al. [26], and it proposed a unique ventilation factor () which couples the horizontal opening and the pool fire areas as the following:
where α is a constant of 250 m1/2, is the total horizontal opening area, and is the fuel bed area. It is important to note that in compartments with only vertical openings there is an empirical dependence of ventilation controlled burning rate on the commonly-known ventilation factor () which is equal to , where and are the areas and weighted height of the vertical ventilation openings, respectively [27]. Additionally, compartments with horizontal openings showed different fire dynamic behaviour compared to those with vertical openings [20]: pulsation, bidirectional flows, and ghosting flames (where flames are observed away from the burner) have been observed in different experimental and numerical work (e.g., [28,29,30]). These studies, however, did not cover cases with both horizontal and vertical openings present, the effect of the horizontal openings on the time to flashover and external plume size, they also did not validate the FDS code in these conditions. To the authors’ knowledge, only one study has been carried out to estimate an empirical (fictitious) ventilation factor for the case with horizontal and vertical openings. Magnusson et al. [31] assumed one vertical and one horizontal opening and presented an approximate nomogram. As shown in Figure 5, it was assumed that all the hot smoke will be leaving the compartment in straight lines through the horizontal opening, while the vertical opening will only pass cold air one way to the inside of the compartment. Based on these assumptions, a fictitious ventilation factor that couples between the vertical and horizontal opening was proposed as the following:
where is the area of the horizontal opening, and is the vertical distance from mid-height of the window opening to the roof of the compartment. These assumptions do indeed not cover all the real case scenarios as presented in Figure 2, Figure 3 and Figure 4, where the hot smoke exits the compartment via both the vertical and horizontal openings; the air flow is not in straight lines, and indeed there could be multiple vertical or horizontal openings in the same compartment.
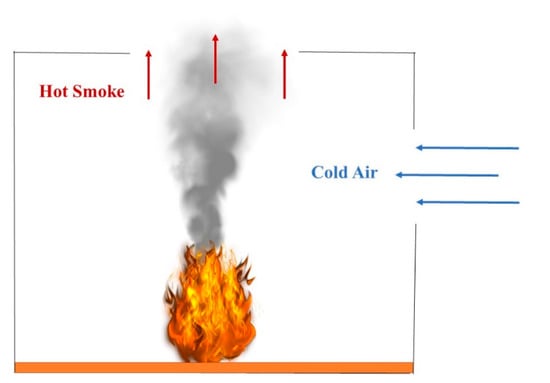
Figure 5.
Vent flows based on Magnusson et al.’s approximations [31].
To further this base of knowledge on horizontal openings in compartments, in the present study a quarter scale IS0-9705 room (similar the compartment used by Beshir et al. [9]) is used to demonstrate the following:
- The effect of adding four corner horizontal openings or one slot central horizontal opening, in addition to a vertical opening on the ventilation, fire dynamics, and external plumes;
- The effect of adding collapsible covers on these openings (e.g., covered with polycarbonate) on the fire spread between dwellings’ parameters (e.g., the time to reach flashover and the heat fluxes to the surroundings);
- The validation of the FDS software using the previously mentioned cases;
- The use of the experimental and numerical results to create an empirical ventilation factor that couples the HRR with the vertical and horizontal openings’ dimensions.
This is performed using 25 small scale experiments, including 19 unique cases, and 6 cases are repeated. This is then further investigated via numerical simulations and theoretical mass and heat transfer models.
2. Experimental Setup
2.1. Geometry and General Description
The compartment used in this work is that used by Beshir et al. [9], specifically, a quarter scale ISO-9705 room (0.6 × 0.6 × 0.9 m) with one vertical opening (door) (0.5 × 0.2 m), and the dimensions presented in Figure 6. The choice of the design is employed to replicate a small-scale model of ISDs similar to typical dwellings in South Africa. The walls were made out of 0.5 mm corrugated steel sheets, with dimensions of 0.9 × 0.6 × 0.6 m (L × W × H). The compartment was considered to be bounded by a thermally thin material with an estimated Biot number of less than 0.1; therefore, the temperature gradient within the wall thickness is neglected in any analysis within this paper. The compartment was placed under a calorimetry hood that utilizes a suction fan to extract the combustion products and estimates the total HRR using the oxygen consumption method via the formulations derived by Janssens [32]. The suggested error for this method is ±10% for complete combustion, and this error increases with larger amounts of CO or soot produced.
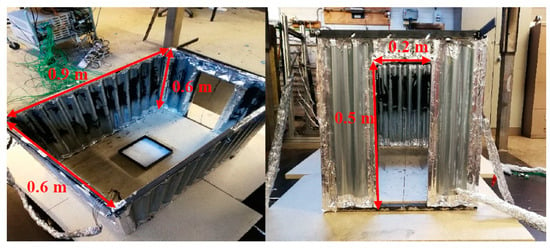
Figure 6.
Quarter scale ISO-9705 compartment (open roof for demonstration) [9].
The openings in these experiments varied and covered a wide range of ventilation factors; the methodology was based on keeping the vertical opening constant (door) and varying both the size and location of the horizontal openings. In this paper, two horizontal openings locations are examined as shown in Figure 7, with the different sizes, location, and percentage of the total roof area of each case presented in Table 1. The location of the vertical opening highly affects the external plume size and radiation to the surroundings [21]; therefore, in this study the two locations varied in order to determine their locational importance on the fire dynamics, the external plume size, and eventually the radiation to the surroundings.
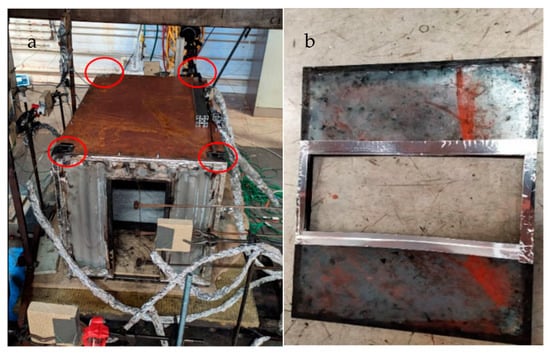
Figure 7.
Roof of the compartment (a) with four corner horizontal openings and (b) one central slot horizontal opening.

Table 1.
Experimental cases.
The fuel used in these experiments was the same as that used by Beshir et al. [9], specifically, 1000 g of polypropylene (PP) equivalent to a fuel load of 80 MJ/m2, enabling a long enough steady-state period (post-flashover) and enough internal unburned gases to create an external plume. Polypropylene was chosen to mimic the normal plastics found in ISDs. Given its flammability and sootiness, polypropylene, typically used in the manufacturing of furniture, plastic containers, water bottles, toys and luggage, was chosen to mimic the normal plastics found in ISDs. As an accelerant, 200 mL of heptane was used to start the ignition by pouring it on the PP within the 400 × 400 mm fuel tray, which was placed in the middle of the compartment.
2.2. Measurements’ Instrumentation
Many measuring devices were positioned inside and around the compartment to capture as many changes as possible to the fire dynamics, flow field through the openings, external plume size, and external radiation due to the effect of the location and size of the horizontal opening. The HRR was measured using the oxygen consumption method, and the calculations were based on the method proposed by Janssens [32] with an estimated error of ±10% for complete combustion conditions. This error increases in the case of incomplete combustion and/or sooty exhaust gases and carbon monoxide.
As presented in Figure 8 and Figure 9, four thermocouple (TC) trees were placed at each corner of the compartment at 50 mm away from each wall. The TCs were of 1.5 mm Type K (estimated negligible measurement error), with five TCs at each corner distanced 100 mm from each other, the roof, and the floor. Thin Skin Calorimeters (TSCs) were used to capture the incident radiative heat flux at different locations around the compartment. The TSCs were in-house designed according to the description, calibration, and estimated uncertainties are presented in details in [33]. In short, the main uncertainties are associated with the assumption of uniform temperatures in the compartment and uniform heat flux distribution onto the solid elements, the radiative effect on the thermocouple bed, and the complexity of estimating the heat transfer coefficient (e.g., convective term). A total of 13 TSCs were mounted at distances of 300, 450, and 650 mm from the top of the door: one TSC at 150 mm from the top center of the back wall, three TSCs at 150, 300, and 450 mm from the top middle side of the left wall. To ensure correct measurements via the TSCs, two water-cooled heat flux gauges were placed at 600 mm from the top of the door, and another was placed at 150 mm from the middle of the side wall.
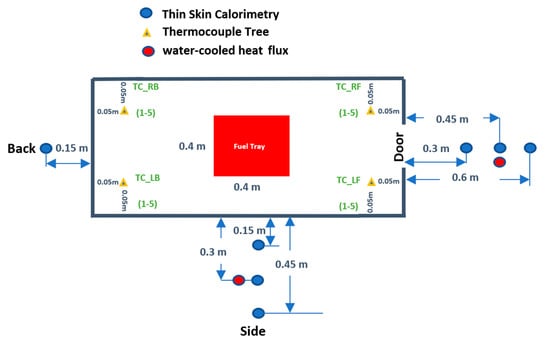
Figure 8.
Instrumentations’ locations plan view (note: not to scale).
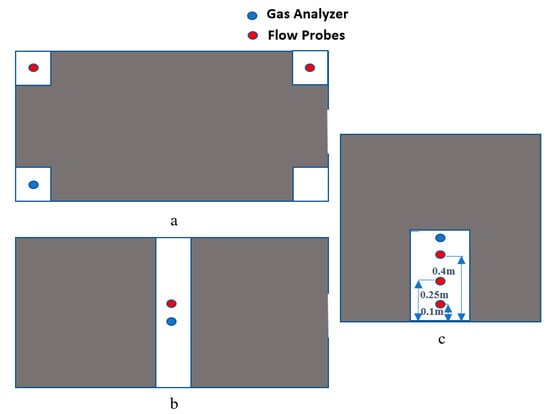
Figure 9.
Gas analyser and flow probe locations in (a) roof plan for corner openings (with the gas analyser placed at same location as the top ThermoCouple (TC) in the Left Back (LB) tree and the flow probe placed at the plan of the horizontal opening); (b) roof plan for central slot horizontal opening (with the flow probe and the gas analyzer at the middle of the slot); and (c) door vertical opening (wall elevation shown) (with the gas analyser placed at the same location as the top flow probe) (NOTE: not to scale).
The flow fields through the openings (both vertical and horizontal) were measured via positioning bi-directional flow probes at each opening. At the door, three flow probes were placed at 100, 250, and 400 mm from the floor. In the case of the corner openings, a symmetric compartment was assumed, and therefore only the right front and right back horizontal openings flow was measured via flow probes. In case of the central slot, given the same assumption, a flow probe was placed at the centre, and another was placed at the outer edge of the slot.
Due to technical issues, only for the closed roof and central slot cases, two gas analysers were placed internally at the same location as the top left back TC and at the same location as the top door flow probe (for the closed case) and the middle of the slot (for the horizontally opened case). The analysers measured the O2, CO2, and CO gas concentrations in addition to the hydrocarbon products in parts per million (ppm).
3. Numerical Model and Modelling Methods
Fire applications accompanied with buoyancy and low Mach number flows can be solved via FDS, which uses appropriate representations of the Navier–Stokes equations via a second order finite difference numerical scheme. In this paper, FDS version 6.7.1 is used to model all the experimental cases mentioned earlier, where the ventilation boundary conditions of these experiments are unique, and FDS has not yet been tested/validated for these conditions [14,34].
FDS uses the Large Eddy Simulation (LES) modelling technique where the turbulence model represents the closure of the Sub Grid Scale (SGS) flux term. FDS uses a variation of Deardorff’s turbulent viscosity model as the default for the SGS closure. FDS models turbulent combustion using a simple mixing method to close the mean chemical source term, and each computational cell is considered as a turbulent batch reactor where the rate of mixing is dominated by turbulence. Therefore, the combustion modelling relies on the turbulence modelling, where the turbulence modelling is highly affected by the LES filter width (cell size), which in turn affects the SGS model and eventually the mixing. The radiative heat transfer is implemented in FDS via the solution of the Radiation Transport Equation (RTE) for grey gas model where the option of using a wide band model is also available. The RTE is solved via a method similar to the Finite Volume Method (FVM) and has some limitations in that the radiation transport is discretized via approximately 100 solid angles, with the option to increase the number of the angles if needed, particularly if targets are located far away from the radiation source. The increase in the number of angles increases the computational time as the radiation model usually accounts for approximately 20% of the computational time. To model the experiments via FDS, the experimental set-up reported above was implemented in the model, where the Type-K thermocouples were modelled to measure the temperature with the same thickness used in the experiments (1.5 mm). The heat flux was calculated using the device named as radiative heat flux and positioned as that for the TSCs and heat flux gauges. The gas species analysers were also modelled via the gas concentration device for the O2 and CO2 and located at the same location for the two gas analysers with respect to the different experiments. The flow probes were modelled via flow speed measuring devices located at the horizontal and vertical openings with the direction placed similar to that in the experiments. The fire was represented on a surface with the same location and dimensions as the tray used in the experiments, and the edges of the tray were modelled with the same thickness and material (5 mm thickness, 10 mm lip, and carbon steel as a material); the fire was modelled using the simple pyrolysis model in the FDS. That means the fire was represented via a Heat Release Rate Per Unit Area (HRRPUA) curve corresponding to that measured during the experiments.
The computational domain was set to X = 1.12 m, Y = 1.5 m, Z = 0.9 m (e.g., the domain was extended sufficiently from the compartment’s walls); the cell size used in all the simulations (except if other cell size is mentioned) was Δ = 50 mm and based on the cell size sensitivity analysis conducted by Beshir et al. [9]; however, in this study a smaller cell size of Δ = 25 mm was used in cases Case C_0.0025 and Case S_0.04 to accommodate the smaller horizontal opening sizes.
The fuel was specified via the properties of the PP with a heat of combustion of 43.3 MJ/kg, soot yield of 0.058, CO yield of 0.024, and a radiative fraction of 0.37 [35]. The ambient temperature in the model was adjusted to be 10 °C to resemble the ambient conditions in the lab during the experiments.
The wall material was set to the properties of carbon steel with density of 7850 kg/m3, an emissivity of 0.6, a specific heat of 0.6 kJ/kg·K, and a conductivity of 48 W/m·K. The insulation on the floor of the compartment was modelled with a density of 208 kg/m3, an emissivity of 1, a specific heat of 0.7 kJ/kg·K, and conductivity of 0.1 W/m·K [35].
4. Results and Discussion
4.1. Repeatability
Different physical and chemical phenomena occur during compartment fire experiments, e.g., ignition, combustion, radiation, flame spread, and many others. This makes compartment fires hard to predict and repeat. Therefore, to maintain good and reliable conclusions, repeatability of these experiments should be ensured first. As presented in Table 1, four cases were repeated (CL, C_0.16 open, S_0.16 open, and S_0.16 poly). The repeatability of the closed roof cases was previously presented in Beshir et al. [9]. This paper presents the repeatability of cases S_0.16_Poly and C_0.16_Open.
As presented in Figure 10, the growth and steady state regions of the HRR curves were repeated well with a slight delay in the decay phase, potentially due to the amount of residuals left in the pan during this phase. This is probably due to the complexity of the burning of solid fuels (PP in this case). Table 2 shows a comparison between the gas layer temperatures averaged over time and the total energies received by the TSCs, which is calculated by the summation of conductive, convective, and radiative losses resulting from the heat transfer between the hot gases and the metallic disk of the TSC for each case. It is clear that both cases were well repeated over all the measurements for both thermocouples and heat fluxes with differences ranging between −1 and +13%.
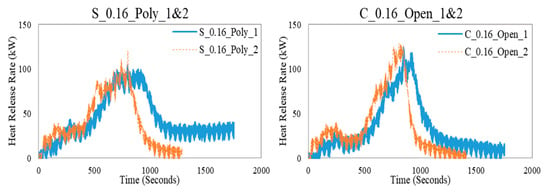
Figure 10.
Repeatability check for two cases.

Table 2.
Repeatability check for two cases.
4.2. Horizontal Openings Effect on Compartment Fire Dynamics
This section will present only experimentally the effect of adding these openings on the time to flashover and the potential fire spread from the compartment to the surrounding. The value of implementing horizontal openings into the roof structure lies in the potential to reduce the heat flux from the dwelling to the surrounding environment. This is of particular importance at vertical openings (i.e., doors and windows) where ejected flame plumes produce high localised heat fluxes to adjacent dwellings. In practice, the heat fluxes to surrounding dwellings will partly determine if and how quickly they will ignite. TSCs were located at several locations around the dwelling to measure how the heat flux at different locations, or “thermal environment”, around the dwelling was affected by adding horizontal openings.
4.2.1. Steady-State Burning
A dwelling will achieve its highest heat release rate and thus the highest values of heat flux to the environment during the post-flashover “steady-state” burning regime. It is therefore important to identify the likely start (usually at flashover) and end (beginning of the decay phase) of this regime. However, for some of the experiments with larger horizontal opening areas, the behaviour exhibited did not necessarily conform to classic criteria for flashover. Therefore, it was necessary to define two criteria for identifying the start and end of the steady-state burning period:
- Classic behaviour
- Start—the first instance at which the gas temperature at the roof reached 525 °C (flashover).
- End—the point at which the heat flux 30 cm from the door first returns below the value it was at flashover.
- Well-ventilated behaviour
- Start—the first instance at which the heat flux 30 cm from the door exceeds 2 kW/m2.
- End—the first instance after the peak value that the heat flux 30 cm from the door drops below 2 kW/m2.
4.2.2. Time to Flahsover
It is expected that adding and varying the size of horizontal openings will have an effect on the time to flashover, or in well-ventilated cases, the start of the steady-state regime. However, the data obtained from these experiments are perhaps insufficient to draw a reliable correlation (Figure 11). It appears that time to “flashover” decreases as ventilation area increases, although the data have a significant scatter (R2 = 0.1789). This suggests that adding horizontal openings accelerates fire growth, but this is as yet an unreliable correlation and so further work is required on this subject. Indeed, these results do appear to contradict the intuitive theory that ventilation in the roof should reduce the build-up of hot gases and slow fire growth. It is therefore likely that these results are skewed by the looser definition of flashover for the well-ventilated cases.
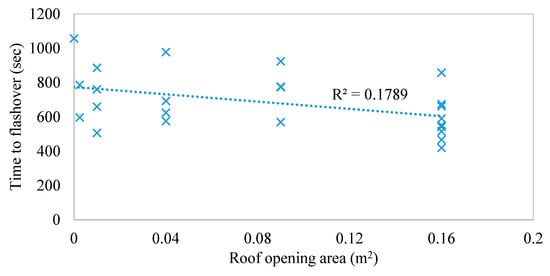
Figure 11.
Time to flashover of compartments with different horizontal opening areas.
4.3. Flux from the Door
As mentioned, one aspect of this analysis is the heat flux from the vertical openings, which in this case is the doorway of the dwelling. Heat flux data measured 30 cm from the top of the doorway clearly show the growth, steady-state, and decay phases in each experiment—examples are given in Figure 12.
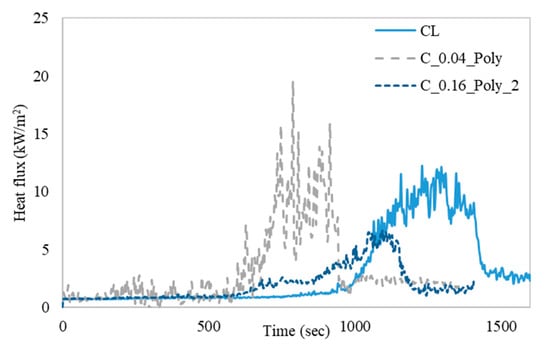
Figure 12.
Heat flux at 30 cm from the door for cases: CL, C_0.04_Poly, and C_0.16_Poly_2.
The potential for ignition of materials in the vicinity of a burning dwelling will be determined largely by three aspects of heat flux: magnitude, duration, and variability. All three are implicitly recognised within a calculation method called the Flux-Time Product (FTP) method [36,37]. The theory is that any given material has an FTP threshold value that reflects its thermal properties and will ignite once this threshold is exceeded when subject to a known input flux-time curve:
In simple terms, this calculation tracks the margin between incident flux () and critical heat flux () over the time of exposure to heating. However, the intention of this experiment was not to determine if certain materials would ignite adjacent to the small-scale dwelling, given the magnitudes of heat flux will be much larger for full scale dwellings, and thus no direct FTP calculations are made here. Instead, the cumulative flux over the steady-state phase, shown in Figure 13, is a simpler metric that implicitly quantifies the magnitude and duration of heat flux, and thus the risk of ignition in general.
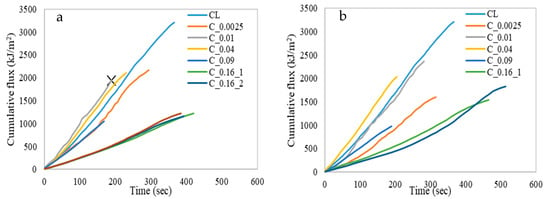
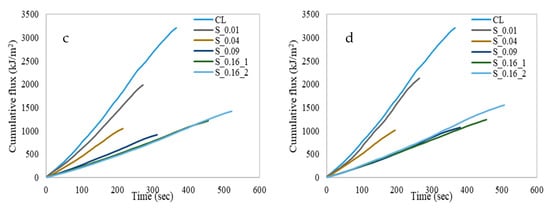
Figure 13.
Cumulative heat flux curves in the post-flashover/steady-state phase, 30 cm from the door for (a) corner-open, (b) corner-poly, (c) slot-open, and (d) slot-poly horizontal opening cases.
The key features of these curves are the overall magnitude and the gradient, which is simply the average steady state heat flux. The closed roof case clearly produces the highest cumulative flux, or to be specific, exposed the receiver to the greatest quantity of thermal energy. This is due to the combination of a steep gradient and long duration of the steady-state phase. However, from the FTP method it is clear that the magnitude by which the Critical Heat Flux (CHF) of a material is exceeded consistently over time is key for establishing time to ignition. Therefore, whilst the 0.01 and 0.04 m2 corner opening cases expose the receiver to less cumulative energy over the full course of the steady-state phase, they may actually decrease the time to ignition of certain materials given they exceed the gradient—implicitly, the margin by which the CHF is exceeded—produced by the closed case.
Conversely, the benefit of the slot cases is immediately apparent, with no case exceeding the gradient of the closed case and the 0.04 m2 slot cases producing approximately the same effect as the 0.09 m2 corner cases. From this analysis, it is suggested that slot cases were clearly more effective than corner cases at reducing heat transfer at the door of the compartment, given the location of the fire in this experiment. In general, it appears that the 0.16 m2 opening cases are not the most effective in reducing the cumulative heat flux given the higher magnitudes than a selection of the 0.04 m2 and 0.09 m2 cases. However, the difference in criteria for identifying the flashover/steady-state phases for these experiments should be noted. In spite of this difference, they still exhibit much lower gradients, implying that, in practice, it is less likely that material CHFs will be exceeded, and in the case of exceedance, by a lesser margin. This will result in fewer and slower ignitions, and so it is recommended that larger opening areas are the most effective at reducing thermal exposure at the door.
While useful, these cumulative flux plots do not give an accurate sense of another key factor for ignition—the variability in flux. For some of the experiments, it was discovered that the peak heat flux during the steady-state regime was significantly larger than the average. The trend was similar for both the open and the polycarbonate cases, shown in Figure 14. Here, for cases that had multiple experiments (e.g., three of C_Open_0.16), the peak and average values are taken across the steady states for all the relevant experiments.
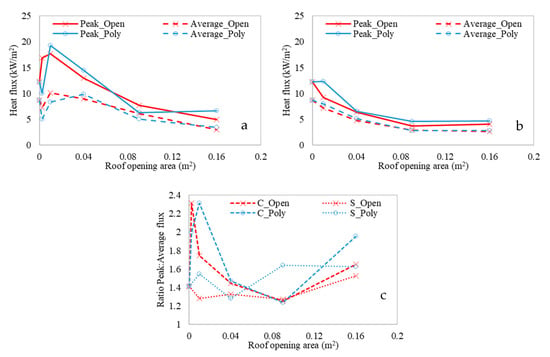
Figure 14.
Peak and average heat fluxes in the steady-state, 30 cm from the door for (a) corner and (b) slot opening cases, and (c) the ratio between peak and average flux in each case.
It is clear that the cases with small corner openings produced highly variable fluxes, with the 0.0025 m2 polycarbonate case and 0.01 m2 open case both spiking to values 231% of their respective steady state values. Generally, the slot opening cases produce much lower spikes relative to their averages. The variability appears to increase again as the area increases above 0.01 m2; however, this should be set against the fact that the peak flux values for 0.16 m2 cases are approximately 3–4 times smaller than the largest across the closed or small (0.0025–0.01 m2) cases. This may also partly be due to the semi-arbitrary method of defining the steady-state regime for the well-ventilated cases. Notably, reliable reductions in both peak and average fluxes relative to the closed case were achieved for all slot cases except the peak flux in the polycarbonate 0.01 m2 case. However, flux reductions were not achieved for any corner cases below 0.09 m2. The largest reductions in average flux for corner and slot cases were 65% (C_0.16 Open) and 69% (S_0.16 Open), respectively.
From a database of materials found in an informal settlement [38], it is possible to identify some specific examples of materials which will be sensitive to highly variable flux in real fire scenarios (Table 3).

Table 3.
Example materials from informal settlements that show a high degree of flux-sensitivity [38].
Whilst these examples are highly specific and at values of flux not achieved in this experiment, they do show the importance of trying to limit the variability of heat flux from an opening. In real fire situations with large dwellings, spikes in flux of similar proportion to those achieved in the experimental small corner opening cases may be sufficient to reduce the time to ignition of a neighbouring dwelling by over 90%. Therefore, based on the conditions of this study, it is again shown that slot openings are more efficient at reducing risk relative to equivalent-area corner openings.
4.4. Flux from the Walls and Roof Flames
Adding horizontal openings not only changes the thermal environment at the door but also changes heat fluxes to the surroundings near to the new openings in the roof. The effects of this must be checked to quantify any additional benefits or risk induced. The changes in flux between experiments are due to different wall temperatures and the addition of flame plumes at the roof as a radiant heat source.
Heat fluxes were measured at 15 cm from the centres of the side and back walls at the height of the dwelling. The data are analysed over the same steady-state phases as used in the previous analyses (Figure 15). Again, it is proven that slot opening cases were more efficient at reducing heat flux to the surroundings. For all cases at both the back and side walls, an opening area of 0.04 m2 produced the highest maximum fluxes. However, the increase in flux relative to the closed case was significantly larger for the corner opening cases. The largest such increase across all corner cases was a 131% increase (6.6→15.2 kW/m2) produced by the 0.04 m2 Polycarbonate corner case at the back wall (Figure 15b). Across all slot cases, the greatest increase in peak flux was only 69% (5.6→9.5 kW/m2) produced by the 0.04 m2 polycarbonate slot case at the side wall (Figure 15d).
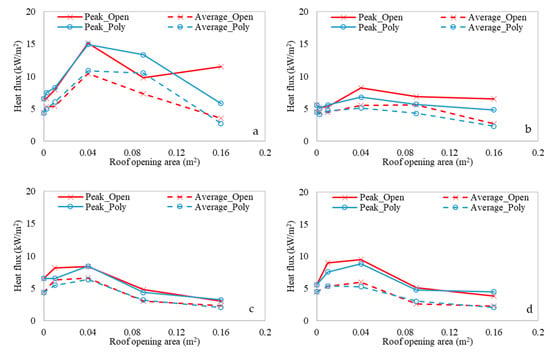
Figure 15.
Peak and average heat flux in the steady-state phase at 15 cm for the following opening-wall combinations: (a) corner-back, (b) corner-side, (c) slot-back, and (d) slot-side.
The 0.16 m2 slot cases reduced the peak and average steady-state fluxes by 39% and 51%, respectively, on average, from both the side and back walls relative to the closed case. The corresponding corner cases succeeded in reducing the steady-state average fluxes by 36% on average; however, the largest reduction to the peak flux was only 13% (open-side wall), with one case actually increasing the peak flux by up to 75% (poly-back wall). In addition to the 0.16 m2 cases, reductions below the closed case peak and average values, though not as great, are achieved by all of the 0.09 m2 slot cases, whereas the corresponding 0.09 m2 corner cases do not achieve this. Overall, the efficacy of the slot cases relative to the corner cases has again been proven, showing the ability to reduce heat fluxes to the surroundings by a greater margin and at smaller areas than the corner cases. Similar to the situation at the door, corner cases show a greater degree of variability in flux, presenting an unintended additional risk if flux-time-sensitive materials are present.
4.5. Comparison of Polycarbonate vs. Closed Cases
Referring back to Figure 13, Figure 14 and Figure 15, it is observationally apparent that there are few if any significant differences in heat flux to the surroundings between the open and polycarbonate data. Individual data may suggest that polycarbonate cases generally result in larger relative spikes of flux at the door (Figure 14c) but that open cases are prone to larger peak fluxes at the back and side walls (Figure 15a,b), but there are insufficient data to establish any clear correlations. Additionally, it has already been established that the results of the study are insufficient to draw correlations relating to time to flashover. Therefore, it may be concluded that further work is required to establish the differences between polycarbonate and open cases, although generally it is apparent that there is a good degree of comparability between the heat fluxes to the environment across both cases, particularly for average fluxes. This is to be expected—the fire characteristics are functions of compartment and opening dimensions which are essentially identical across corresponding cases once the polycarbonate has fallen out, melted, or burned away from the roof opening.
5. CFD Validation
As the HRR was implemented as input in the FDS models, the HRR will not be part of the validation of this section, however, parameters such as gas temperatures, heat fluxes, gas concentrations, and flow field will be used for validation.
5.1. Gas Concentration
Due to technical issues, for the closed roof and central slot cases, two gas analysers were placed internally at the same location as the top left back TC and at the same location as the top door flow probe (for the closed case) and the middle of the slot (for the horizontally opened case). The analysers measured the O2, CO2, and CO gas concentrations, in addition to the hydrocarbon products in parts per million (ppm). In alignment with what was found by Beshir et al. [15], the combustion efficiency was captured well by the FDS at locations with low turbulence. The steady state gas concentrations of oxygen and carbon dioxide were found to be very similar for both experimental and numerical work for both the CL and S_0.04 cases with a variation of about ±5%. At the back of both cases, the flow field is almost steady due to the homogenous air temperature. In Figure 16 and Figure 17, it clear that the bigger the slot opening, the less accurate the FDS predictions are in terms of the gas concentration (e.g., varying between −200 and −40%), likely due to the very large fluctuation in the temperatures and hence the buoyancy effect, turbulence, and mixing. The higher the turbulence, the more difficult it becomes to capture all the eddies within specific space and time. Therefore, to accurately capture the gas concentrations at these locations a smaller LES filter is required which increases the computational demands.

Figure 16.
Gas concentration at the back of the compartment for the closed and S_0.04_Open cases.

Figure 17.
Gas concentration at the back of the compartment for the S_0.09 and S_0.16 cases.
5.2. Gas Temperatures
To cover the gas layer temperature for all cases, the top back and front right corner thermocouples measurements are presented and compared with the results from the simulations to understand to what extent FDS replicated the gas layer development. Figure 18 and Figure 19 show that the current model well replicated the growth phase in all the cases, and that was expected as this was mainly driven by the accelerant (heptane) and the fire at that stage still being over-ventilated. Additionally, FDS managed to capture the time to flashover and the peak gas layer temperature for all of the cases except the cases with the biggest horizontal openings (C and S _0.16 m2). The FDS underestimated the gas layer temperature at the back of the compartment by −22% and overestimated the gas layer at the front by around +60%. FDS, however, managed to capture the front gas layer temperature for the S_0.16 case accurately, while it underestimated the back gas layer temperature by around −30%. The decay was also captured well by the FDS in all cases.
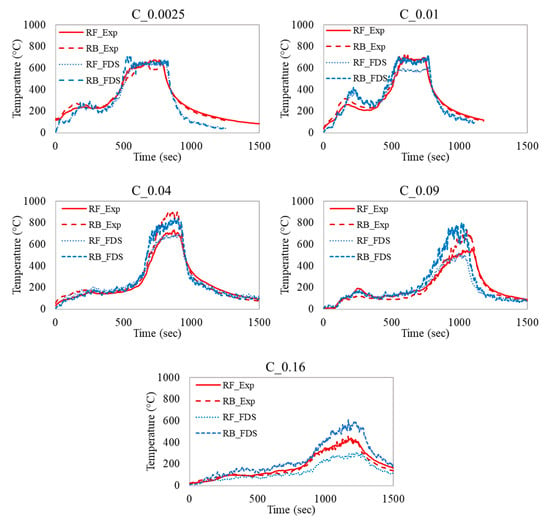
Figure 18.
Gas layer temperature for corner cases.
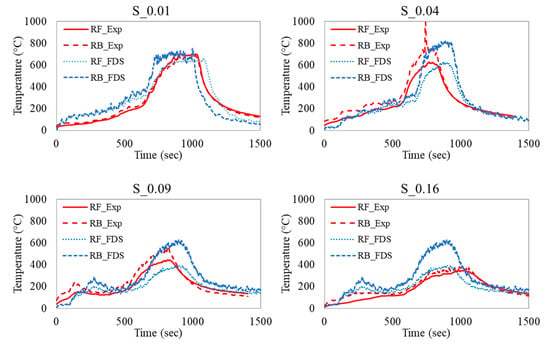
Figure 19.
Gas layer temperature for slot cases.
The combustion efficiency impact was clear on the gas layer temperature: the bigger the horizontal opening, the higher the turbulence, which leads to more eddies. To further discuss the effect of the turbulence modelling on the combustion efficiency and eventually the combustion products (gas concentrations and temperatures) it is important to explain how FDS models turbulent combustion.
It is usually mathematically challenging to model chemical reactions in any turbulent flows, due to the fact that the length and time scales associated with the reactions are orders of magnitude below what can be spatially and temporally resolved by the physical model. FDS uses a simple mixing environment method to close the mean chemical source term in complex reactions. Each cell in this case will be considered a turbulent batch reactor, and turbulence will dominate the rate of mixing. Therefore, FDS is based on considering the three physical processes of diffusion, SGS advection, and buoyant acceleration to take the fastest of the three (locally) as the controlling flow time scale. As mentioned earlier, the LES filter width (cell size) is considered as one of the main parameters in this process, which affects the SGS model and eventually the mixing modelling. The mixing process determines the combustion rate and/or efficiency, based on the infinitely fast chemistry that occurs within the cell. The authors therefore expect that using a cell size smaller than the 5 cm in use will lead to even more accurate results for the combustion efficiency and the gas layer temperature for cases with larger horizontal openings and/or higher turbulent flows.
5.3. Heat Fluxes
In this validation section, only the heat fluxes at 30 cm from the vertical opening (door) are presented. This point is both computationally and experimentally the most challenging, due to its location relative to the external buoyant plume which adds the challenge of the convective cooling effect. Numerically, the closer to the flame, the more challenging it is to capture the right flame temperature and participating species concentrations and hence to compute the right radiative heat fluxes. The TSC at this location was well calibrated using a water cooled heat flux gauge, and the FDS simulation with 5 cm cell size captured the radiative heat flux from the external plume relatively accurately for all of the experiments as presented in Figure 20 and Figure 21 (e.g., almost overlapping for all cases and with maximum variation of ±20% for only two cases, C_0.09 and 0.04).
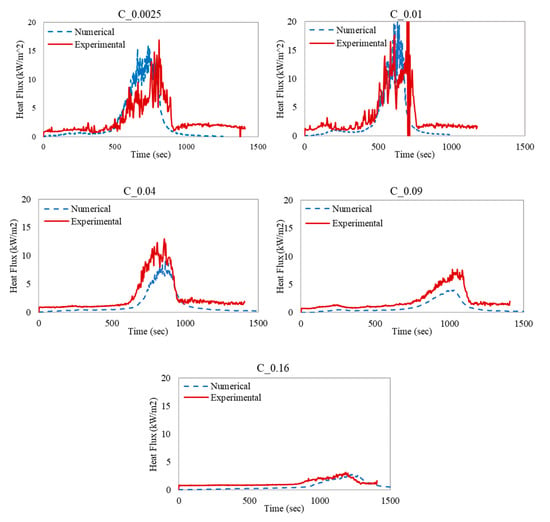
Figure 20.
Radiative heat flux (corner cases).

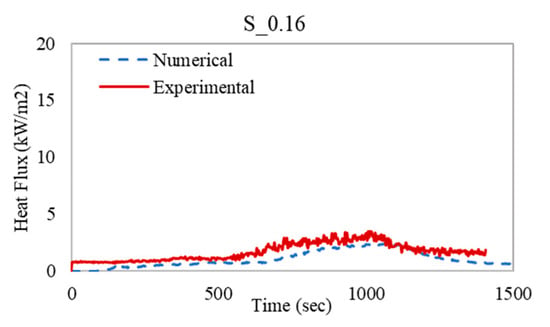
Figure 21.
Radiative heat flux (slot cases). (Due to technical issues S_0.01 was not recorded).
6. Re-Visiting Ventilation Factor
It was observed during the experiments that the post-flashover external flow was variable in its behaviour based on the size of the horizontal opening. For horizontal openings with total size of up to 0.04 m2, the external flow was from both the horizontal and vertical openings, while for horizontal openings above 0.04 m2, the external flow was totally through the horizontal opening. This was obvious from the radiative heat flux at 0.3 m from the door; for cases with horizontal openings larger than 0.04 m2, the radiative heat flux decreased by around 60–80%. This behaviour changes our understanding of the flow field of a typical post-flashover under-ventilated compartment fire, where some criteria vanished (e.g., the gas layer temperature for flashover and the neutral plane at the vertical opening). Therefore, the current empirical factor that describes the flow field in post-flashover (e.g., the ventilation factor) also does not fit these conditions. As discussed in the introduction, the ventilation factor was updated by Magnusson et al. [31] to fit for compartment fires with both vertical and horizontal openings. The main assumptions for this method are that there is only one vertical and one horizontal opening and that the hot gases leave the compartment only through the horizontal opening. These assumptions do not cover the cases in this study where there are more than one horizontal opening and the hot gases leave through all openings (horizontal and vertical), depending on the size of the horizontal opening.
Based on that, in this study the experimental compartment fires were used to update an empirical ventilation factor for such scenarios. The updated ventilation factor was then coupled well with the mass of inlet air and fits in the following equation (e.g., Figure 22):
where, is the inlet fresh air, is the total area of the vertical openings, is the total area of the horizontal openings, and is the vertical opening height.
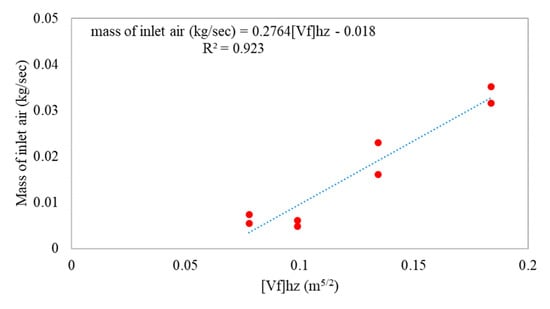
Figure 22.
Average compartment inlet fresh air during steady state period as a function of the updated ventilation factor.
This new form of ventilation factor still needs to be tested using further research; this form was conducted to be general and could cover most cases with both horizontal and vertical opening conditions.
7. Conclusions
Ten quarter-scale (thermally thin bounded) ISO-9705 compartment fire experiments were conducted to investigate the effect adding horizontal openings in addition to the vertical openings on the fire dynamics, external radiation, and the ability of the LES CFD model, namely FDS, to reproduce compartment fire dynamics with these boundary conditions. Nine of these experiments were then repeated where the horizontal openings were covered with a flammable plastic-based thin material (e.g., polycarbonate) to mimic the situation in informal settlements and understand the practicality of adding these openings to restrain the fire spread in informal settlements. The experimental results were also used to develop an empirical correlation for an updated ventilation factor and develop a coupling relation between the updated ventilation factor and the mass inlet air to the compartment. The conclusions of the study are as follows:
- -
- The efficacy of adding horizontal openings to reduce the heat flux to the surrounding and thus the potential fire spread risk was proven for horizontal openings located as a central slot compared to equivalent-area openings at the corners. The slot cases, relative to the corner cases, showed the ability to reduce heat fluxes from the door consistently at areas as low as 0.01 m2—and all cases above this—compared to the corner cases which only achieved reductions at a minimum of 0.09 m2. The maximum reductions in average heat flux were 65% and 69% by the largest corner and slot cases, respectively.
- -
- Regarding the wider surroundings (at the back and side wall), slot cases of ≥0.09 m2 caused reductions in both the average and peak fluxes relative to the closed case (up to 51% and 39%, respectively). However, corner cases only achieved reductions at 0.16 m2 and by smaller margins (up to 36% and 13% for average and peak, respectively) with some cases of this size still actually exhibiting increases in peak flux up to 75%.
- -
- A new empirical ventilation factor was proposed to describe the flow field through both openings and was then coupled to the mass of inlet air with high accuracy.
- -
- The numerical simulations generally reproduced the main fire dynamics and trends within these under-ventilated compartments successfully.
- -
- The high turbulence and mixing at some cases were challenging to capture with a 5 cm LES filter. This highly affected the simulated combustion efficiency and gas temperature at some locations within the compartment.
- -
- The data produced were insufficient to establish any clear correlations relating to the differences between polycarbonate and open cases. No clear trends were observed in the time to flashover across different types and size of opening, despite an expectation that the presence of the polycarbonate sheeting may influence this. There was good agreement between polycarbonate and open cases for the average heat fluxes to surroundings and fair agreement between the peak fluxes.
Future research should be focused on testing and understanding the limitations of the proposed empirical correlation; this study offers validation for the FDS code in these conditions to be used in future studies to enhance the empirical correlation and understand its limitations using numerical models rather than experimental work, in addition to understanding the effect of scaling these conditions on the end result.
Author Contributions
M.B.: conceptualization, data curation, formal analysis, investigation, methodology, validation, writing—original draft. K.O.: data curation, formal analysis, investigation, validation. F.R.C.: formal analysis, investigation, methodology, writing—review and editing, S.S.: formal analysis, writing—review and editing. L.G.: methodology, writing—review and editing. D.R.: methodology, funding acquisition, supervision, writing—review and editing. All authors have read and agreed to the published version of the manuscript.
Funding
This work is supported by IRIS-Fire project of UK (Engineering and Physical Sciences Research Council Grant no.: EP/P029582/1). Author KO was supported by the International Masters of Science in Fire Safety Engineering (IMFSE) to conduct this research www.imfse.be. Author FRC was supported by the CNPq/Brazil for research grant 205477/2018-6. Author SS was supported by the Engineering and Physical Sciences Research Council grant EP/R513209/1.
Conflicts of Interest
The authors declare no conflict of interest.
References
- UN Habitat. Habitat III Issue Papers 22-Informal Settlements; UN Habitat: Kenya, Nairobi, 2015. [Google Scholar]
- Improving the Resilience of Informal Settlements to Fire Project’s Website. Available online: https://www.iris-fire.com/ (accessed on 29 August 2019).
- Walls, R.; Olivier, G.; Eksteen, R. Informal settlement fires in South Africa: Fire engineering overview and full-scale tests on “shacks”. Fire Saf. J. 2017, 91, 997–1006. [Google Scholar] [CrossRef]
- BBC. Bangladesh Fire: Thousands of Shacks Destroyed in Khaka Slum. 2018. Available online: https://www.bbc.co.uk/news/world-asia-49382682 (accessed on 30 September 2019).
- Kahanji, C.; Walls, R.S.; Cicione, A. Fire spread analysis for the 2017 Imizamo Yethu informal settlement conflagration in South Africa. Int. J. Disaster Risk Reduct. 2019, 39, 101146. [Google Scholar] [CrossRef]
- Fire Incidient in Bahay Toro, Quezon City. 2011. Available online: https://www.ndrrmc.gov.ph/index.php/20-incidents-monitored/1599-fire-incident-in-bahay-toro-quezon-city (accessed on 13 September 2020).
- Rush, D.; Bankoff, G.; Cooper-Knock, S.-J.; Gibson, L.; Hirst, L.; Jordan, S.; Spinardi, G.; Twigg, J.; Walls, R.S. Fire risk reduction on the margins of an urbanizing world. Disaster Prev. Manag. Int. J. 2020, 29, 747–760. [Google Scholar] [CrossRef]
- Wang, Y.; Bertrand, C.; Beshir, M.; Kahanji, C.; Walls, R.; Rush, D. Developing an experimental database of burning characteristics of combustible informal dwelling materials based on South African informal settlement investigation. Fire Saf. J. 2020, 111, 102938. [Google Scholar] [CrossRef]
- Beshir, M.; Wang, Y.; Centeno, F.; Hadden, R.; Welch, S.; Rush, D. Semi-empirical model for estimating the heat release rate required for flashover in compartments with thermally-thin boundaries and ultra-fast fires. Fire Saf. J. 2020, 103124. [Google Scholar] [CrossRef]
- Cicione, A.; Beshir, M.; Walls, R.S.; Rush, D. Full-Scale Informal Settlement Dwelling Fire Experiments and Development of Numerical Models. Fire Technol. 2019, 56, 639–672. [Google Scholar] [CrossRef]
- Cicione, A.; Walls, R.S.; Kahanji, C. Experimental study of fire spread between multiple full scale informal settlement dwellings. Fire Saf. J. 2019, 105, 19–27. [Google Scholar] [CrossRef]
- Wang, Y.; Beshir, M.; Cicione, A.; Hadden, R.; Krajcovic, M.; Rush, D. A full-scale experimental study on single dwelling burning behavior of informal settlement. Fire Saf. J. 2020, 103076. [Google Scholar] [CrossRef]
- Wang, Y.; Beshir, M.; Hadden, R.; Cicione, A.; Krajcovic, M.; Rush, D. Laboratory experiment of fire spread between two informal settlement dwellings. Int. J. Therm. Sci. 2021. Under Review. [Google Scholar]
- McGrattan, K.; Hostikka, S.; McDermott, R.; Floyd, J.; Weinschenk, C.; Overholt, K. Fire Dynamics Simulator Technical Reference Guide; National Institute of Standards and Technology: Gaithersburg, ML, USA, 2017; Volume 3. [Google Scholar]
- Beshir, M.; Mohamed, M.; Welch, S.; Rush, D. Modelling the Effects of Boundary Walls on the Fire Dynamics of Informal Settlement Dwellings. Fire Technol. 2021, 1–29. [Google Scholar] [CrossRef]
- Centeno, F.R.; Beshir, M.; Rush, D. Influence of wind on the onset of flashover within small-scale compartments with thermally-thin and thermally-thick boundaries. Fire Saf. J. 2020, 117, 103211. [Google Scholar] [CrossRef]
- Stevens, S.; Gibson, L.; Rush, D. Conceptualising a GIS-based risk quantification framework for fire spread in informal settlements: A Cape Town case study. Int. J. Disaster Risk Reduct. 2020, 50, 101736. [Google Scholar] [CrossRef]
- Cicione, A.; Wade, C.; Spearpoint, M.; Gibson, L.; Walls, R.; Rush, D. A preliminary investigation to develop a semi-probabilistic model of informal settlement fire spread using B-RISK. Fire Saf. J. 2020, 103115. [Google Scholar] [CrossRef]
- Wang, Y.; Gibson, L.; Beshir, M.; Rush, D. Determination of Critical Separation Distance Between Dwellings in Informal Settlements Fire. Fire Technol. 2021, 1–28. [Google Scholar] [CrossRef]
- Buchanan, A.H.; Abu, A.K. Structural Design for Fire Safety, 2nd ed.; Willey: Hoboken, NJ, USA, 2017; ISBN 978-0-470-97289-2. [Google Scholar]
- Beshir, M.; Cicione, A.; Wang, Y.; Welch, S.; Rush, D. Re-visiting NIST reduced/full-scale enclosures (R/FSE). In Proceedings of the 15th International Conference and Exhibition on Fire Science & Engineering (Interflam 2019), Royal Holloway College, Nr Windsor, UK, 1–3 July 2019. [Google Scholar]
- Beshir, M.; Wang, Y.; Gibson, L.; Welch, S.; Rush, D. A Computational Study on the Effect of Horizontal Openings on Fire Dynamics within Informal Dwellings. In Proceedings of the Ninth International Seminar on Fire and Explosion Hazards, 21–26 April 2019, Saint Petersburg, Russia; pp. 512–523. [CrossRef]
- Yuan, M.; Lu, S.; Zhou, Y.; Zhang, J. A Simplified Mathematical Model for Predicting the Vertical Temperature Profiles in Enclosure Fires Without Vertical Opening. Fire Technol. 2012, 50, 929–943. [Google Scholar] [CrossRef]
- Chen, X.; Lu, S.; Liew, K.M. Preliminary Experimental Study of Horizontal Opening Effect on Pool Fire Behavior. Energy Procedia 2015, 66, 181–184. [Google Scholar] [CrossRef][Green Version]
- Epstein, M. Buoyancy-Driven Exchange Flow Through Small Openings in Horizontal Partitions. J. Heat Transf. 1988, 110, 885–893. [Google Scholar] [CrossRef]
- Jaluria, Y.; Lee, S.-K.; Mercier, G.; Tan, Q. Transport processes across a horizontal vent due to density and pressure differences. Exp. Therm. Fluid Sci. 1998, 16, 260–273. [Google Scholar] [CrossRef]
- Heselden, A.J.M.; Thomas, P.H.; Law, M. Burning rate of ventilation controlled fires in compartments. Fire Technol. 1970, 6, 123–125. [Google Scholar] [CrossRef]
- Chen, X.; Lu, S.; Wang, X.; Liew, K.M.; Li, C.; Zhang, J. Pulsation Behavior of Pool Fires in a Confined Compartment with a Horizontal Opening. Fire Technol. 2015, 52, 515–531. [Google Scholar] [CrossRef]
- Varrall, K.; Pretrel, H.; Vaux, S.; Vauquelin, O. Stereoscopic Particle Image Velocimetry Investigation of the Bidirectional Natural Convection Flow Through a Horizontal Vent. Fire Technol. 2016, 52, 2027–2041. [Google Scholar] [CrossRef]
- Chen, X.; Lu, S.-X. On the Analysis of Flame Pulsation and Fire Induced Vent Flow Oscillatory Behaviors in Confined Enclosures with Horizontal Openings. Procedia Eng. 2018, 211, 104–112. [Google Scholar] [CrossRef]
- Magnusson, S.E.; Thelandersson, S. Temperature—Time Curves of Complete Process of Fire Development. In Bulletin of Division of Structural Mechanics and Concrete Construction; Bulletin 16; Lund Institute of Technology: Lund, Sweden, 1970. [Google Scholar]
- Janssens, M.L. Measuring rate of heat release by oxygen consumption. Fire Technol. 1991, 27, 234–249. [Google Scholar] [CrossRef]
- Hidalgo, J.P.; Maluk, C.; Cowlard, A.; Abecassis-Empis, C.; Krajcovic, M.; Torero, J.L. A Thin Skin Calorimeter (TSC) for quantifying irradiation during large-scale fire testing. Int. J. Therm. Sci. 2017, 112, 383–394. [Google Scholar] [CrossRef]
- McGrattan, K.; Hostikka, S.; McDermott, R.; Floyd, J.; Vanella, M.; Weinschenk, C.; Overholt, K. Fire Dynamics Simulator, User’s Guide, 6th ed.; NIST Special Publication 1019; National Institute of Standards and Technology: Gaithersburg, MA, USA, 4 November 2013; 262p. [Google Scholar]
- SFPE Handbook of Fire Protection Engineering, 5th ed.; The National Fire Protection Association, Inc.: Quincy, MA, USA, 2016.
- Cicione, A.; Walls, R.; Sander, Z.; Flores, N.; Narayanan, V.; Stevens, S.; Rush, D. The Effect of Separation Distance Between Informal Dwellings on Fire Spread Rates Based on Experimental Data and Analytical Equations. Fire Technol. 2021, 57, 873–909. [Google Scholar] [CrossRef]
- Shields, T.J.; Silcock, G.W.; Murray, J.J. Evaluating ignition data using the flux time product. Fire Mater. 1994, 18, 243–254. [Google Scholar] [CrossRef]
- Wang, Y.; Rush, D. Cone Calorimeter Tests of Combustible Materials Found in Informal Settlements; Database, University of Edinburgh, School of Engineering: Edinburgh, UK, 2019. [Google Scholar] [CrossRef]
Publisher’s Note: MDPI stays neutral with regard to jurisdictional claims in published maps and institutional affiliations. |
© 2021 by the authors. Licensee MDPI, Basel, Switzerland. This article is an open access article distributed under the terms and conditions of the Creative Commons Attribution (CC BY) license (http://creativecommons.org/licenses/by/4.0/).