Article

Is the Large-Scale Development of Wind-PV with Hydro-Pumped Storage Economically Feasible in Greece?

by
Anna Dianellou
1,
Theofanis Christakopoulos
1,
George Caralis
1,*,
Vassiliki Kotroni
2,
Konstantinos Lagouvardos
2 and
Arthouros Zervos
1
1
School of Mechanical Engineering, Fluids Section, National Technical University of Athens (NTUA), Zografou, 15771 Athens, Greece
2
National Observatory of Athens, Institute for Environmental Research, Penteli, 15236 Athens, Greece
*
Author to whom correspondence should be addressed.
Appl. Sci. 2021, 11(5), 2368; https://doi.org/10.3390/app11052368
Submission received: 17 December 2020 / Revised: 25 February 2021 / Accepted: 2 March 2021 / Published: 7 March 2021
(This article belongs to the Special Issue Advances in Underground Energy Storage for Renewable Energy Sources)

Abstract

:
The achievement of the long-term national energy targets in Greece for large-scale integration of wind and solar energy may be facilitated by the development of hydro-pumped storage projects. In light of the above, technical aspects related with the operation of the Greek power system and its ability to absorb renewable energy are analyzed in connection with the role of hydro-pumped storage and relative economic aspects. The aim of this work is to assess the potential contribution of hydro-pumped storage projects and estimate the capacity magnitude order to support large-scale wind and photovoltaic (PV) integration in Greece. For this purpose, scenarios for the Greek power system with focus on Wind and PV development, in conjunction with hydro-pumped storage capacity, are developed, and results for current situation and reference years 2030 and 2050 are presented. For the simulation, among others, high resolution mesoscale wind data for a typical year in the whole Greek territory are used for the steady state simulation of the Greek power system, in order to better estimate the power that could be generated from installed wind turbines, taking into consideration technical characteristics of a typical commercial wind turbine. Results indicate the need of gradual development of hydro-pumped storage in parallel with the large-scale integration of wind and PV capacity into the Greek power system. In addition, the feasibility of the examined scenarios is supported from the low cost of wind and PV generation. In the case of Greece, thanks to the complex morphology and hydraulic conditions of the country, hydro-pumped storage composes an efficient and low-cost storage solution.

1. Introduction

1.1. Background

The consequences of climate change due to energy production from traditional energy sources, the growing energy demand and the EU decarbonization targets lead to a need for replacement of conventional resources with renewable ones.
However, in the power sector, large-scale integration of intermittent output renewable sources is a great challenge, especially in non-interconnected or saturated grids. For this reason, the growth of large-scale wind and solar integration is a prerequisite for the simultaneous development of energy storage infrastructure.
Storage infrastructure may be a decisive factor for the size of wind and solar energy integration in the power system, as energy storage can act as a balancing component of the system. The energy storage technology that has met the biggest development, is applicable at large scale and has a considerable rate of efficiency is hydro-pumped storage.
Hydro-pumped storage attracts the attention of the scientific community. In parallel, the role of storage solutions is drawing towards large-scale non-dispatchable renewable energy penetration [1]. The policy framework for large-scale electricity storage to use wind energy surplus has been comparatively analyzed in France and Germany for 2020 and 2030 [2]. Additionally, hydro-pumped storage has been widely examined as a solutionto reduce wind energy curtailment in the cases of Ireland [3], China [4,5], Greece [6,7,8] and in some North European Smart Islands [9]. A special research interest on the combination of hydro-pumped storage with wind energy was shown for autonomous islands, like Azores [10], Gran Canaria [11], El Hierro [12], Crete [13,14] and other Greek islands [7,13,15].
Concerning this paper’s case study, the Greek energy supply system is characterized by the oddity that it is not a cohesive system. In particular, it consists of the mainland’s electric grid and small non-interconnected power systems on the islands. The interconnections of Greece with the neighboring countries have a relatively small capacity, and the power supply of the system is mainly based on the production of lignite and natural gas power plants, with lignite power plants being gradually phased out and natural gas power gaining a larger production share.
Moreover, the potential of energy production from renewable sources is considered to be high due to the geographical location and the weather conditions that prevail across the country. The instability and the deficiency that could be caused to the Greek power system with the higher integration of renewable sources, inhibit their integration, as the system depends mainly on inland production, and security of supply cannot be compromised. For that reason, hydro-pumped storage or other energy storage systems should be integrated into the power system, in order to facilitate the share increase of power produced from renewable sources and in parallel diversify the energy mix of the country, introducing storage capacity.
A literature review of barriers related to large-scale market integration of Variable Renewable Energy Sources in European electricity markets design has been included in the discussion of the storage facilities’ importance underlying the barriers of their high capital cost and the unsound business case due to the lack of scarcity price [16]. However, the role of storage is analyzed in large-scale wind and PV integration in Germany showing that integration level up to 50% could be achieved if flexible back-up power plants are used [1]. Different storage technologies (batteries, pumped hydro storage, adiabatic compressed air energy storage, thermal energy storage, and power-to-gas technology) and their role have been investigated in the transition path towards a 100% renewable energy power sector by 2050 in Europe [17]. The synergy between storage and balancing is analyzed in a fully or highly renewable pan-European power system, based on 8 years solar—wind demand data, with focus on the forms of hydro-pumped storage and hydrogen [18].
The sitting of hydro-pumped storage is a critical parameter from the social, environmental and energy points of view. A review of the existing types of pumped-hydro storage plants, highlights the advantages and disadvantages of each configuration and proposes innovative arrangements in order to increase the possibility to find suitable locations for building large-scale reservoirs for long-term energy and water storage [19]. Α global analysis identifies 616,000 sites for closed-loop off-river hydro-pumped storage, based on high resolution global digital elevation models [20]. Off-river pumped hydro energy storage together is also proposed as an effectual solution to support 100% renewable energy in East Asia [21]. Finally, underwater pumped storage has been proposed as an alternative emerging technology with significant potential [22].

1.2. Recent Situation and Trends

In 2019, 60 GW of wind power capacity was added globally, with the cumulative capacity reaching 650 GW. Costs have fallen rapidly for both onshore and offshore wind power, increasing dramatically the amount of bid prices in auctions around the world, especially in the past year. This development can be explained considering the constant technology innovation, the reduced financing costs and the ever-growing competition in the industry, with electric utilities and large oil and gas companies continuing to invest further in that direction. Additionally, incentives such as robust regulatory reforms, wind energy’s cost-competitiveness and its potential environmental benefits show that there is no expected deceleration in the wind power sector progress. Finally, the world’s first commercial floating wind park has been commissioned in Scotland, while the sizes of turbines continued to increase, with some manufacturers producing turbines of up to 10 MW.
Meanwhile, development in solar PV sector is even faster, with almost 100 GW of new capacity added and increased the global capacity to 580 GW at the end of 2019. This growth can be explained mainly due to the raised awareness of the technology’s potential to alleviate pollution, reduce carbon dioxide emissions and provide energy access to developing countries. Subsequently, intense competition, increasing efficiencies and reduction in energy costs have led to record-low auction prices.
Hydro-pumped storage advancements over the past few years continue to upgrade an already proven and reliable technology that represented more than 95% of all energy storage solutions globally, in terms of cumulative capacity. These include improved efficiencies with modern reversible pump-turbines, adjustable-speed pumped turbines, advanced equipment controls such as static frequency converters and generator insulation systems, as well as innovative underground construction methods and design capabilities, leading to faster response times of load follow for intermittent renewables more efficiently and cost effectively. Globally, there are approximately 270 pumped storage plants either operating or under construction, representing a combined generating capacity of over 127,000 MW. Of these total installations, 36 units consist of adjustable speed machines, 17 of which are currently in operation, totaling 3569 MW and 19 of which are under construction, totaling 4558 MW [23].

2. The Greek Power System

2.1. Current Power System Situation in Greece

The annual electricity demand in the Interconnected System of Greece, with reference year 2019, was 52.17 TWh. The total nominal capacity of conventional plants was 8806 MW (December 2019), comprising 3904 MW of lignite power plants and 4902 MW of natural gas [24]. Conventional power plants possess a significant share of electricity production which reaches approximately 51% on the annual electricity production (2019). Wind installations represent a capacity of 3283 MW, while the capacity of photovoltaics including roof-top PVs reaches 2639 MW [25]. Both technologies contributed in 2019 with 14% of generated power [24]. Moreover, the nominal capacity of large and small hydroelectric power plants was 3411 MW, biomass units accounted for 87 MW, while Combined Heat and Power (CHP) 105.47 MW [25]. During 2019, the interconnections balance, i.e., net imports, contributed to the 19% of electricity consumption in Greece. Overall, lignite units are gradually being phased out, while the share of electricity produced by natural gas and lignite power plants combined has been reduced compared to past years. Renewable sources have a smaller share in the energy mix, increased compared to the past, and will further increase in the future [25].

2.2. Prospects for the Future

The National Energy and Climate Planning (NECP) was issued in 2019 with the view to present the long-term energy targets set for the country’s energy sector, in accordance with the recent European Directives. Among the targets set is the reduction of greenhouse gases up to 56% (with reference levels of year 2005), the gradual decommissioning of lignite power plants by 2028 and the increase of the share of Renewable Energy Sources (RES) in gross electricity consumption up to 60% [26].
The installed capacity of hydropower plants is not expected to increase significantly, since hydropotential has been already exploited to a great extent and environmental constraints prevent its further development in Greece. However, there is a potential for development of reverse hydro-pumped storage, since reverse pumped storage units could be constructed within the facilities of existing hydropower plants without raising major environmental issues. The installation of storage facilities is essential, in view of the excess energy due to the higher penetration of intermittent renewable energy sources and may provide more flexibility to the system. The interconnection of mainland’s power system with the small autonomous ones on the islands is essential, in order to construct a unified system, exploit further the abundant Renewable Energy Sources (RES) potential, withdraw local oil stations and secure power supply on the islands. In parallel, it is expected that the power supply in Greece will be based more on renewable energy sources, while the role of lignite will be reduced and eventually eliminated by 2028. Overall, the main target set towards 2050 is the gradual decarbonization of the power generation sector and its transition to a more sustainable future through the higher integration of renewable sources [26].

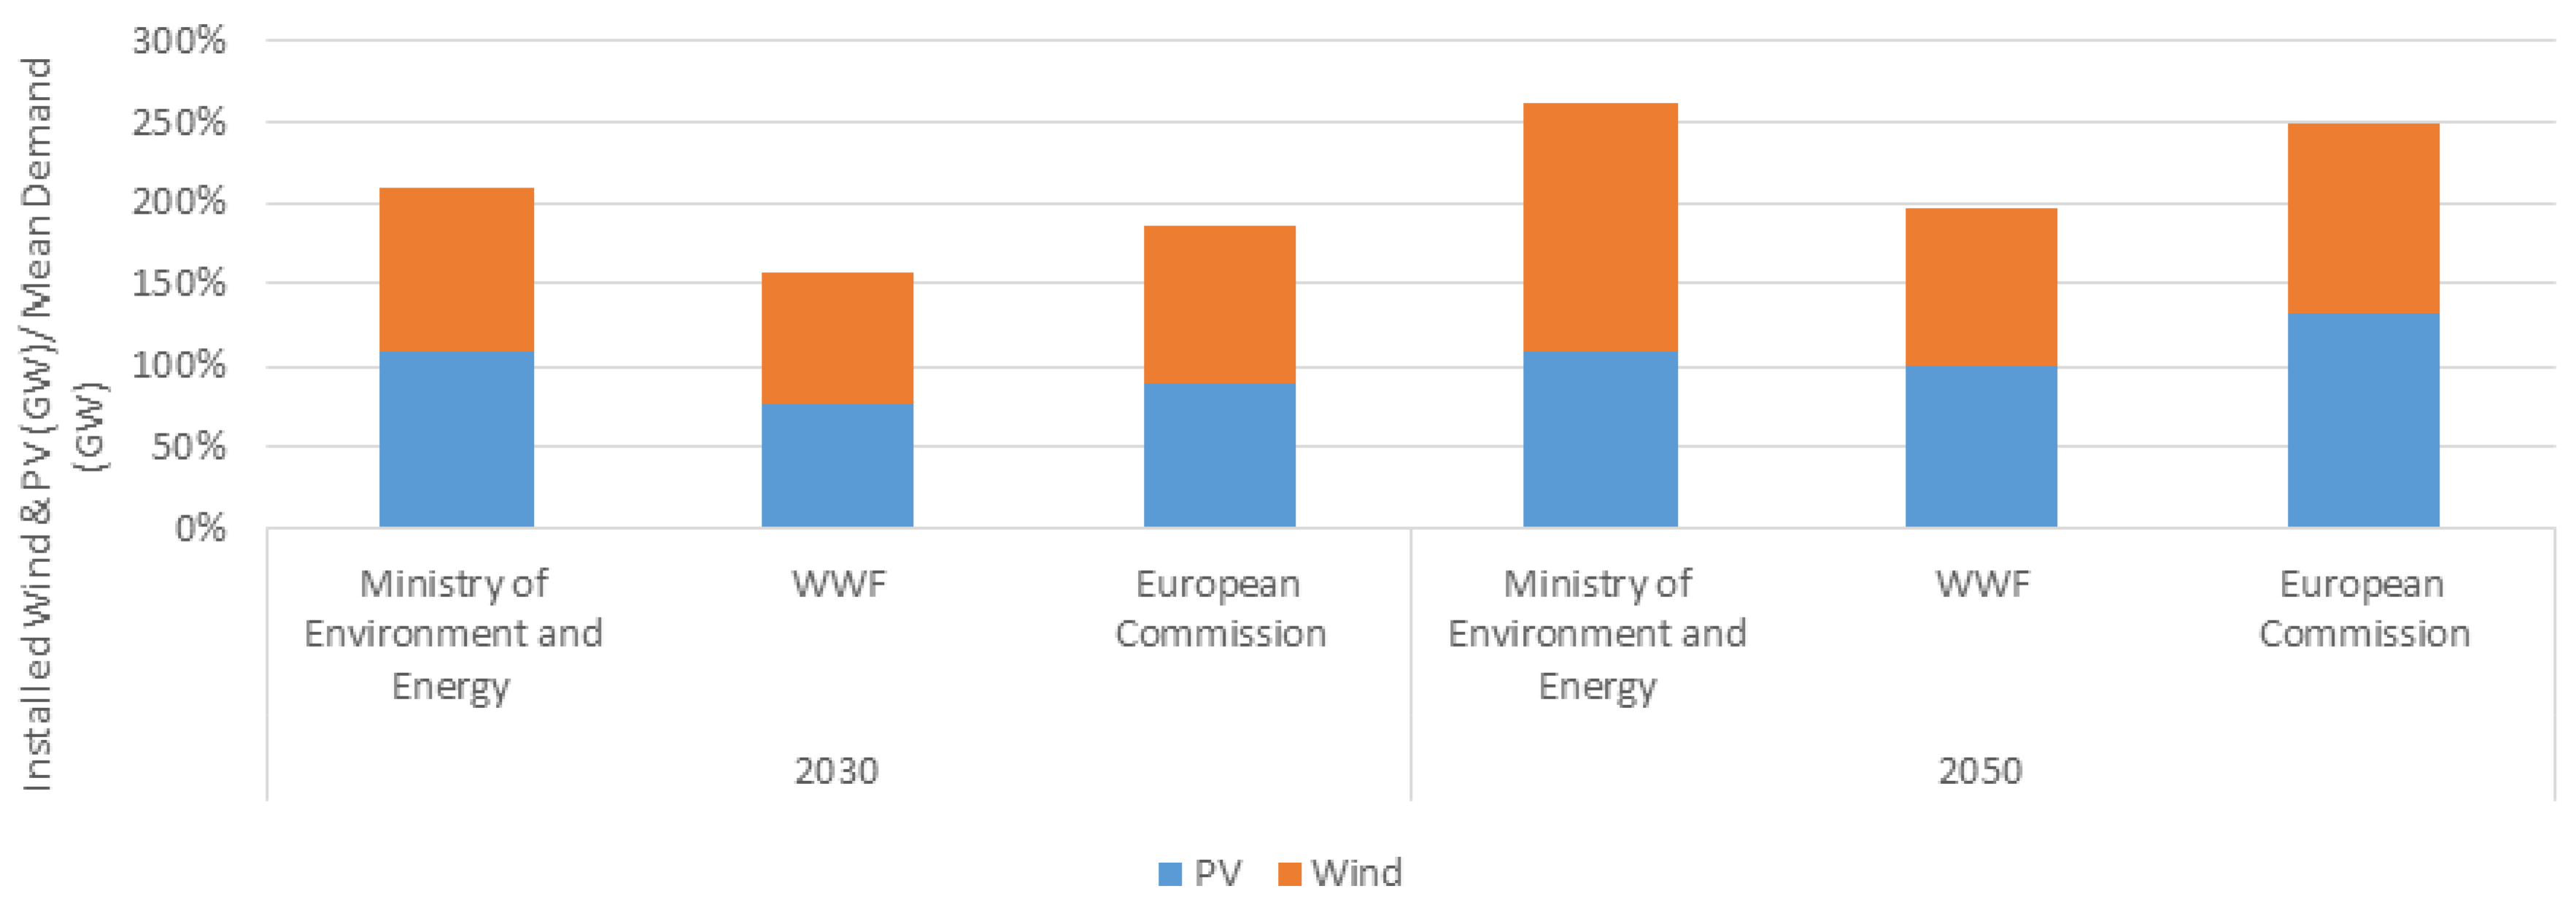
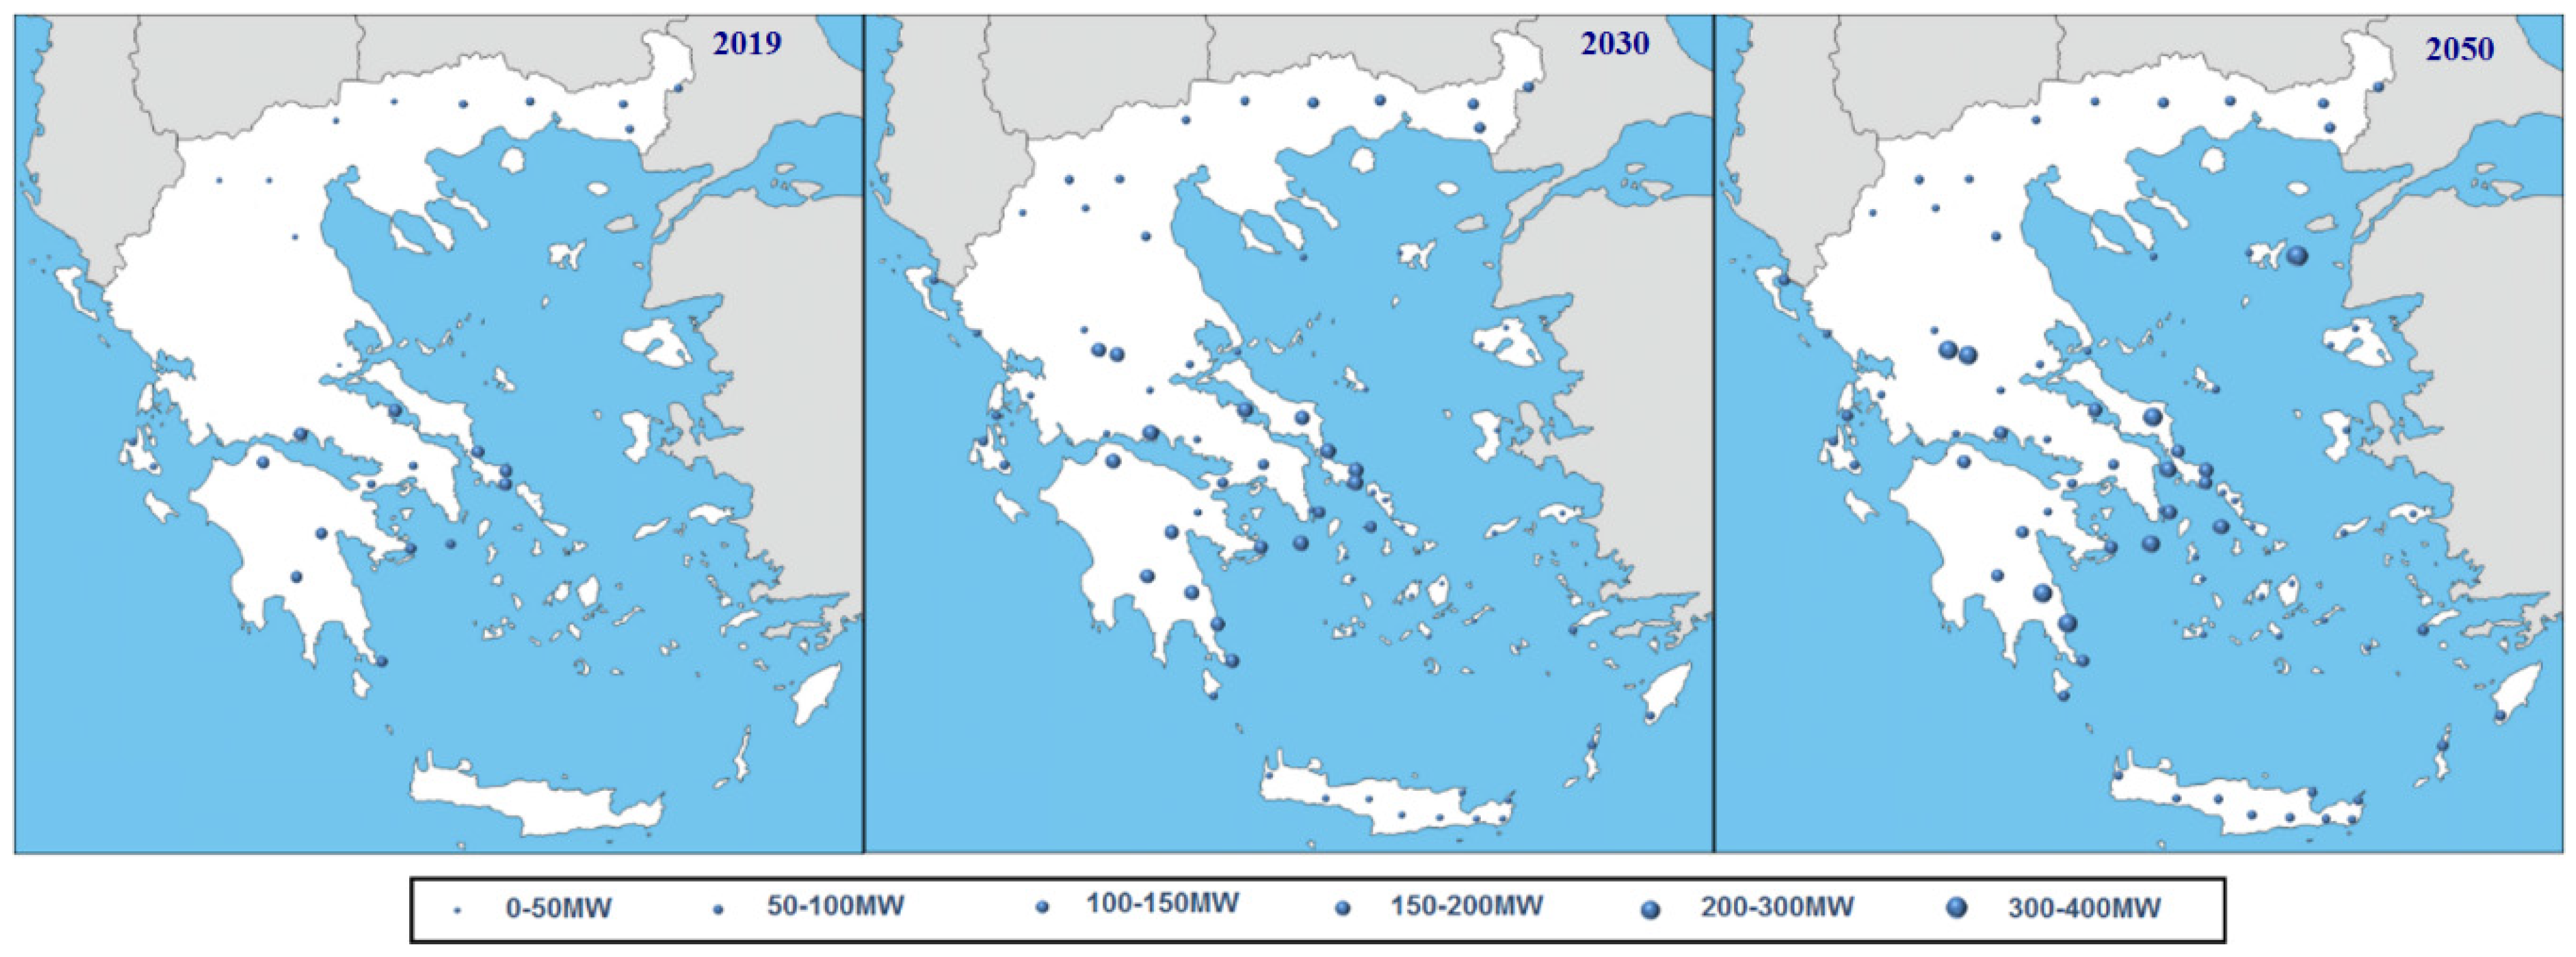
2.3. Wind and PV Development

Renewable energy sources shall substantially contribute towards the achievement of decarbonization targets set for the energy sector. One of the main objectives of energy planning is the increase of renewable energy sources’ share in the energy mix, in order to substitute part of the conventional units’ production. In the renewable sources capacity development scenarios, reference is mainly made to large penetration of wind and photovoltaic systems. In the corresponding studies, wind installations’ capacity is projected to reach, according to Ministry of Environment and Energy in 2030, approximately 7 GW, while by 2050 11–18 GW (off-shore wind installation included) [27]. According to a study conducted by European Commission, by 2030, wind installations’ capacity may reach 6 GW and by 2050 7.8 GW [28]. In addition, World Wide Fund for Nature (WWF) estimates that the wind installations will account for 5 GW, in 2030, and 6.7 GW, in 2050 [29]. Moreover, the increase of PV capacity is projected, according to the Energy Roadmap by the Ministry of Energy (the National Energy and Climate Plan and the Long-term strategy towards 2050), for 2030 at 7.7 GW, while for 2050 it is estimated at 8–12 GW, depending on the scenario considered [26,27]. According to a study conducted by the European Commission for Greece, in 2030, it is estimated that 5.6 GW of PV will have been constructed, while by 2050 9 GW [28]. Furthermore, according to WWF’s projections, PV capacity will reach 4.8 GW by 2030 and 7.1 GW by 2050 [29]. Table 1 presents forecasts on the cumulative capacity of PV and Wind in Greece by 2030 and 2050 [26,27,28,29].
There are significant differences between the figures predicted for wind and PV capacity by the competent bodies. In order to achieve a comparative assessment of the various development scenarios, the ratio of the forecasted wind and photovoltaic capacity by the annual mean load of the country is presented in Figure 1. In 2030 the wind and PV capacity lies between 150–205% of the annual mean load demand, while in 2050 between 200–255%. The ratio between Wind and PV in terms of installed capacity is almost 1 by 1 in most of the forecasts. More PV than Wind capacity is expected by 2050 according to the Energy Roadmap of the Ministry of Energy.

3. Methodological Approach

3.1. A Simplified Simulation of the Greek Power System

In this connection, a simplified simulation of the Greek power system is proposed to calculate the RES electricity that can be absorbed directly, the energy surplus and the ability of Hydro-pumped storage to exploit it.
Methods for solving units commitment and optimization algorithms for economic dispatch in power systems with high wind penetration have been extensively analysed and proposed in previous works [30,31,32,33]. In most of these cases, wind generation is obtained by the use of forecasting tools and unit scheduling is estimated in order to meet demand with a high probability over the scheduling horizon. It is out of the aims of the current approach to optimize the load dispatch and units commitment. The proposed methodology is based on the analysis of the steady-state operation of the Greek power system and takes into account the specific characteristics of demand, the technical features of conventional and hydropower plants and the technical constraints for the smooth and safe operation of the system. Hourly time series are used instead of a probabilistic approach [34], due to the fact that the sequence of events is essential for the simulation of hydro-pumped storage [35].
The large-scale Wind and PV integration is challenging for the power system operator due to their variable power output, the difficulty to predict wind power output accurately and the limited capacity of Greek power system with neighboring countries. However, flexible conventional and hydro units are able to cover any sudden or expected deficit, which may occur to the system. Additionally, the landscape of Greece constitutes an ideal topography for the construction of hydro-pumped storage units which could contribute significantly to the stability of the system and increase renewable peak demand supply.
For the simulation of the Greek power system a steady state analysis is performed based on hourly timeseries data. Alternative scenarios for reference years 2019, 2030 and 2050 are comparably presented in terms of energy flows and Levelized Cost of Energy (LCOE).
For the simplified simulation all the corresponding data of the power units (load factors, technical constraints, maintenance periods, stochasticity) are taken into consideration. The main target of this simulation is the accomplishment of energy balance, giving priority to renewable energy sources. All the relative assumptions are conservative in order to ensure the safe operation of the power system, with respect to all the technical constraints. The contribution of interconnections is not taken into consideration due to their limited capacity, and the Greek power system is considered as a remote power system. This assumption gives results on the safe side, while in reality, the management of the system could be easier with interconnections.
The innovation of the analysis is based on the use of simultaneous mesoscale typical wind year data for the representation of the wind resource in the whole Greek territory. Ninety points are used to provide high geographical resolution and cover current and future possible sites for wind farms. At each point, hourly wind power output is calculated for one year on the basis of hourly wind speed and wind power installed capacity. Then the aggregated hourly wind power in the whole Greek territory is used as an input for the simulation of the Greek power system. Typical wind turbines power curves are used to calculate wind power output, given the wind installed capacity and the time series of wind speed at each point under consideration. Then the aggregated wind power output ( P W p r o d ) for every hour is resulted.
The main principles of the methodology, units’ commitment and load dispatch are presented in this section in four steps. In the first step PV power is absorbed in priority; in the second one, conventional units commitment is defined; in the third one, wind power absorption is calculated, and in the last one, Hydro and Hydro-pumped storage output is resulted.

3.1.1. Step 1. PV Power Absorbed in Priority

In the step 1 PV power is absorbed in priority. Wind and PV will gradually represent the mainstream of electricity in the Greek power system; then the management rules and operational principles of the power system should be reformed in comparison with the recent practices [35]. One of the prime assumptions of the current approach is that PV energy is absorbed in priority. PV production is considered as a predictable source of energy, and it is allowed to be absorbed in priority without any constraints, unless it surpasses the load demand. In a large area under consideration, like Greece, geographical distribution of PV has a positive effect on the smoothing of PV power output fluctuations and on the predictability of PV aggregated power output. For every hour i of the year (i = 1 to 8760), given the initial actual demand PD and subtracting the PV power output PPV, the residual load PD-PV is calculated (Equation (1)) to be used as the basis for the commitment of conventional units:
P D - P V ( i ) = P D ( i ) P P V ( i )

3.1.2. Step 2. Conventional Units Commitment

Lignite power plants are used today as a base load units. They are not flexible to switch on and switch off, and their operation should be scheduled in medium term. The number of lignite power plants to be committed is estimated with respect to the expected demand of next days, taking into consideration their non-flexible features and their high technical minimums of the order of 50%. The criterion is that the technical minimums of lignite units to be committed should not exceed the minimum expected residual load of the following seven days. Initially, there are set to operate at their technical minimums or more in case of power deficit. Given this simulation approach, the operation of lignite power units in the Greek power system will be gradually reduced as far as the PV capacity increases. It should be noted that lignite power plants are considered only for reference year 2019, since by 2028 according to national targets the lignite units shall have been decommissioned.
Natural gas units are more flexible than the lignite units, and as a result, they are dispatched in order to support the balance between supply and demand in the short term. The number of natural gas units operating is defined in order to be able to cover the mean residual load of the next twenty-four hours. Initially, they are set to operate at their technical minimums (30% of the nominal output) or more in case of power deficit. The flexibility of natural gas units allows the efficient and rapid response to the fluctuations of power supply.
The combined heat and power (CHP) plants and the biomass units are dispatched hereafter. The total nominal power of these units is relatively small, and their contribution is limited. The produced energy of both is defined using an average capacity factor of 70%.

3.1.3. Step 3. Wind Power Absorbed and Curtailed

After the definition of conventional units commitment, the absorbed PWabs and curtailed PWcurt wind energy are calculated. The wind power allowed to be absorbed by the system is limited by technical restrictions, in order to ensure the stability of the system. A percentage of instantaneous penetration δ of wind power to the grid is applied in the calculations [35,36]. This is a dynamic limit which ensures the safe operation of the system in case that all the wind power is lost, and it is related with the ability of other units (i.e., conventional, hydro and storage) to supply load demand [36]. On the other hand, wind power absorption should respect the technical minimums of the committed conventional power plants [35]. Technical minimums of lignite, natural gas, CHP and biomass are taken into consideration. These two technical restrictions are related with power system and define the ability of the power system to absorb wind power. Finally, the actual wind power absorbed ( P W a b s ) cannot exceed the available wind power ( P W p r o d ) , as it has been calculated using the mesoscale data. Then, the actual absorbed wind energy is resulted (Equation (2)):
P W a b s ( i ) = min { δ · P D - P V ( i ) P D - P V ( i ) P T M ( i ) P W p r o d ( i ) }
Meanwhile, the wind energy curtailment is calculated (Equation (3)):
P W c u r t ( i ) = P W p r o d ( i ) P W a b s ( i )

3.1.4. Step 4. Hydropower Output and Hydro-Pumped Storage

Hydropower plants supply the peaks of the load curve. The power produced annually from hydropower plants is highly dependent on the hydrological year. In a good year in terms of hydrological conditions, the annual production could reach 5 TWh. A special methodological approach is used for hydropower [35]. Before the integration of PV in the Greek power system, hydropower was used for peak demand supply. At that time peak demand occurred especially in summer period. Today, hydropower has a more complex role. The integration of PV has shifted the need for peak supply from summer to winter. Hydropower will continue to provide peak power supply whenever peak load demand occurs. Additionally, hydropower will balance the variability of rest RES power generation. Renewable power surplus and wind curtailment may occur in low demand periods or in windy ones. During low demand hours hydropower plants are switched off. During peak demand periods, if there is wind power surplus, hydropower plants may reduce their operation saving water for peak demand periods of low wind. So, wind power plants could save water in the hydro plants’ reservoirs and hydro generation will not constrain wind power absorption. Good and bad hydrologic years occur in Greece, with an average annual hydro energy output in Greece of 5 TWh. This energy amount is split into the hours of peak demand using a simplified iterative approach, which finally defines the threshold of power demand for hydropower generation. The operation of hydroelectric power plants is defined by the “peak-shaving” method; it is defined by a minimum power demand threshold (PT_H), when this load demand limit is surpassed hydroelectric power is produced. This limit is determined after an iterative procedure (goal seek function in MS Excel is used) for the whole year, so that the integral of hydro annual production will be equal with 5 TWh (typical hydraulic year). In this step, the remaining load demand after subtracting PV, lignite, natural gas, CHP, biomass and wind power absorbed is used (PD-PV-CONV-W). Then, hydropower output is defined for every hour of the year (Equations (4) and (5)) with respect to the nominal power of hydro plants in Greece. This approach is very close to the reality, since existing hydro-plants are operated today in the way of seasonal storage and peak supply. Additionally, the PV’s summer peak supply match well with the dry period of Greece from May to September.
P H ( i ) = { 0 ,   i f   P D - P V - C O N V - W ( i ) < P T _ H M i n { P H _ n o m ,   P D - P V - C O N V - W ( i ) P T _ H } ,   i f   P D - P V - C O N V - W ( i ) > P T _ H
i = 1 8760 P H ( i ) = 5   TWh
By this approach, the power surplus (wind curtailment and PV surplus) P s u r p l u s is minimized in most of the conservative scenarios. Obviously, for large-scale wind and PV integration, due to the technical constraints, power surplus occurs and could be transformed through hydro-pumped storage to useful peak demand supply. The aforementioned excess energy is stored in hydro-pumped storage units, by pumping water to the upper reservoir when there is a surplus of energy, while it is recovered through the hydro-turbines operation when other renewable sources are not available.
Due to the distribution of the curtailed power, it is not economically feasible to exploit 100% of this energy. Such a scenario would require enormous installed capacity of pumps and volume of the upper reservoirs which would be used only few hours per year. A sufficient degree of annual exploitation of excess system’s power can be considered to be 70% [6]. On this basis, the required installed capacity of pumps PP_nom is defined in order to achieve the target of 70% exploitation of the annual energy surplus. The hydro turbines capacity is considered to be equal with the pumps’ nominal output. Therefore, the nominal power of the pumps is calculated (Equations (6) and (7)):
P P u m p ( i ) = M i n { P P _ n o m ,   P s u r p l u s ( i ) }
i = 1 8760 P P u m p ( i ) = 70 % · i = 1 8760 P s u r p l u s ( i )
where Ppump is the power used for pumping, PP_nom is the nominal power of pumps and Psurplus is the available power surplus (wind curtailment and PV surplus). The volume of the upper reservoir is defined to ensure a 24-h operation of the turbines at their nominal capacity.

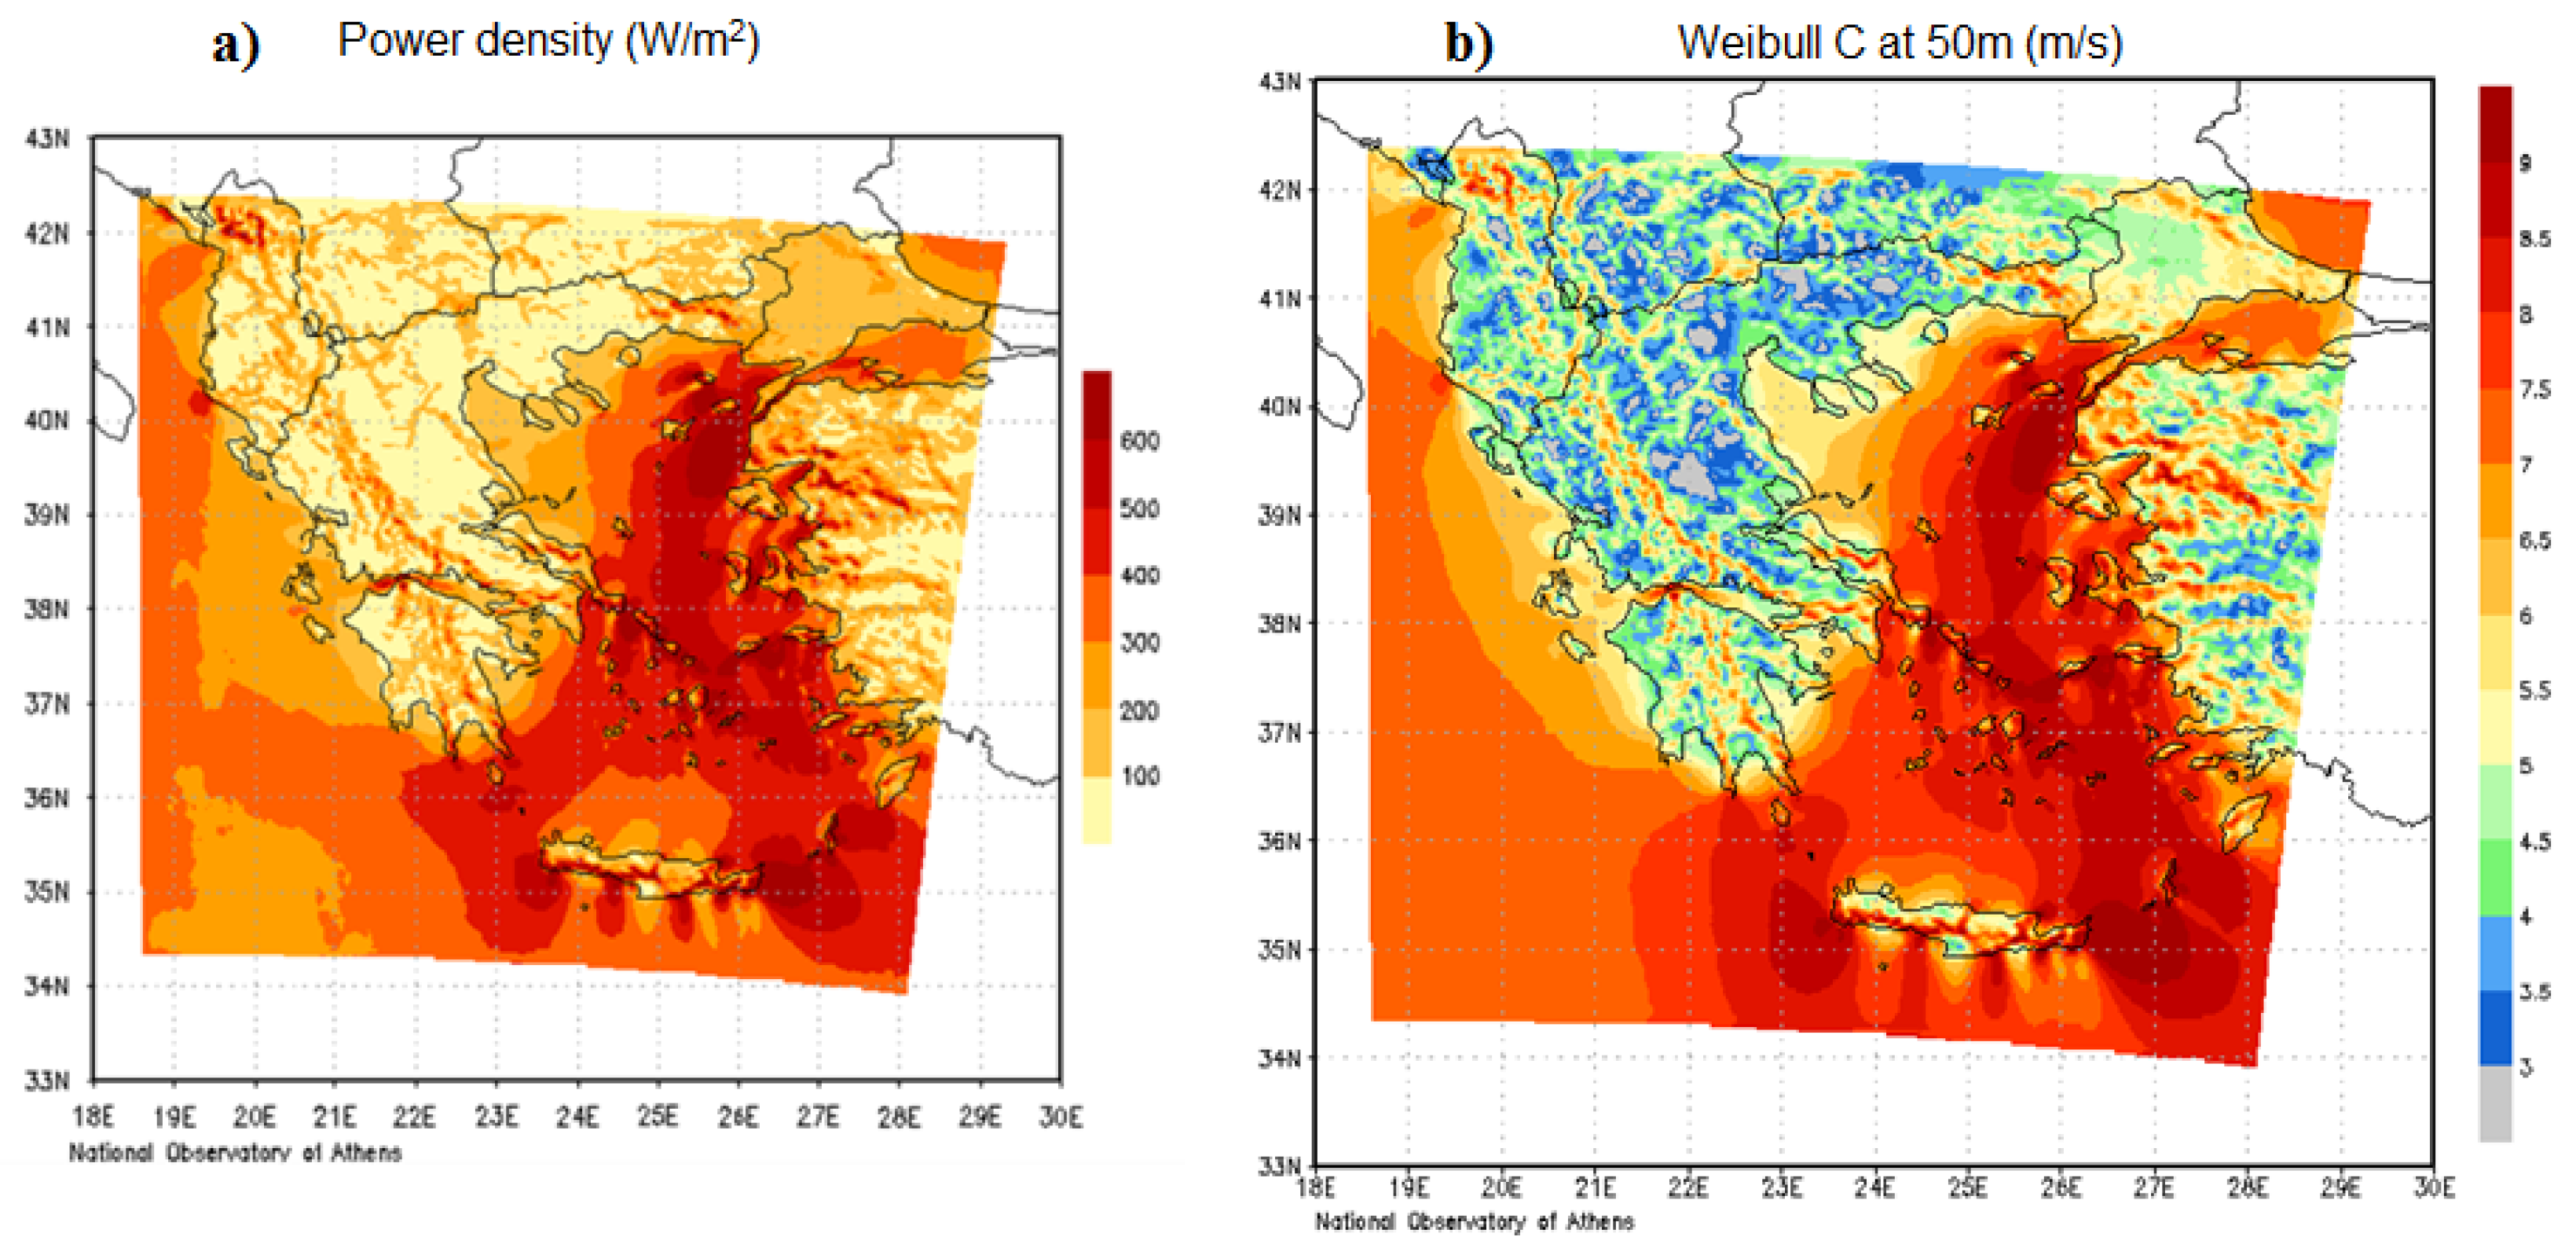
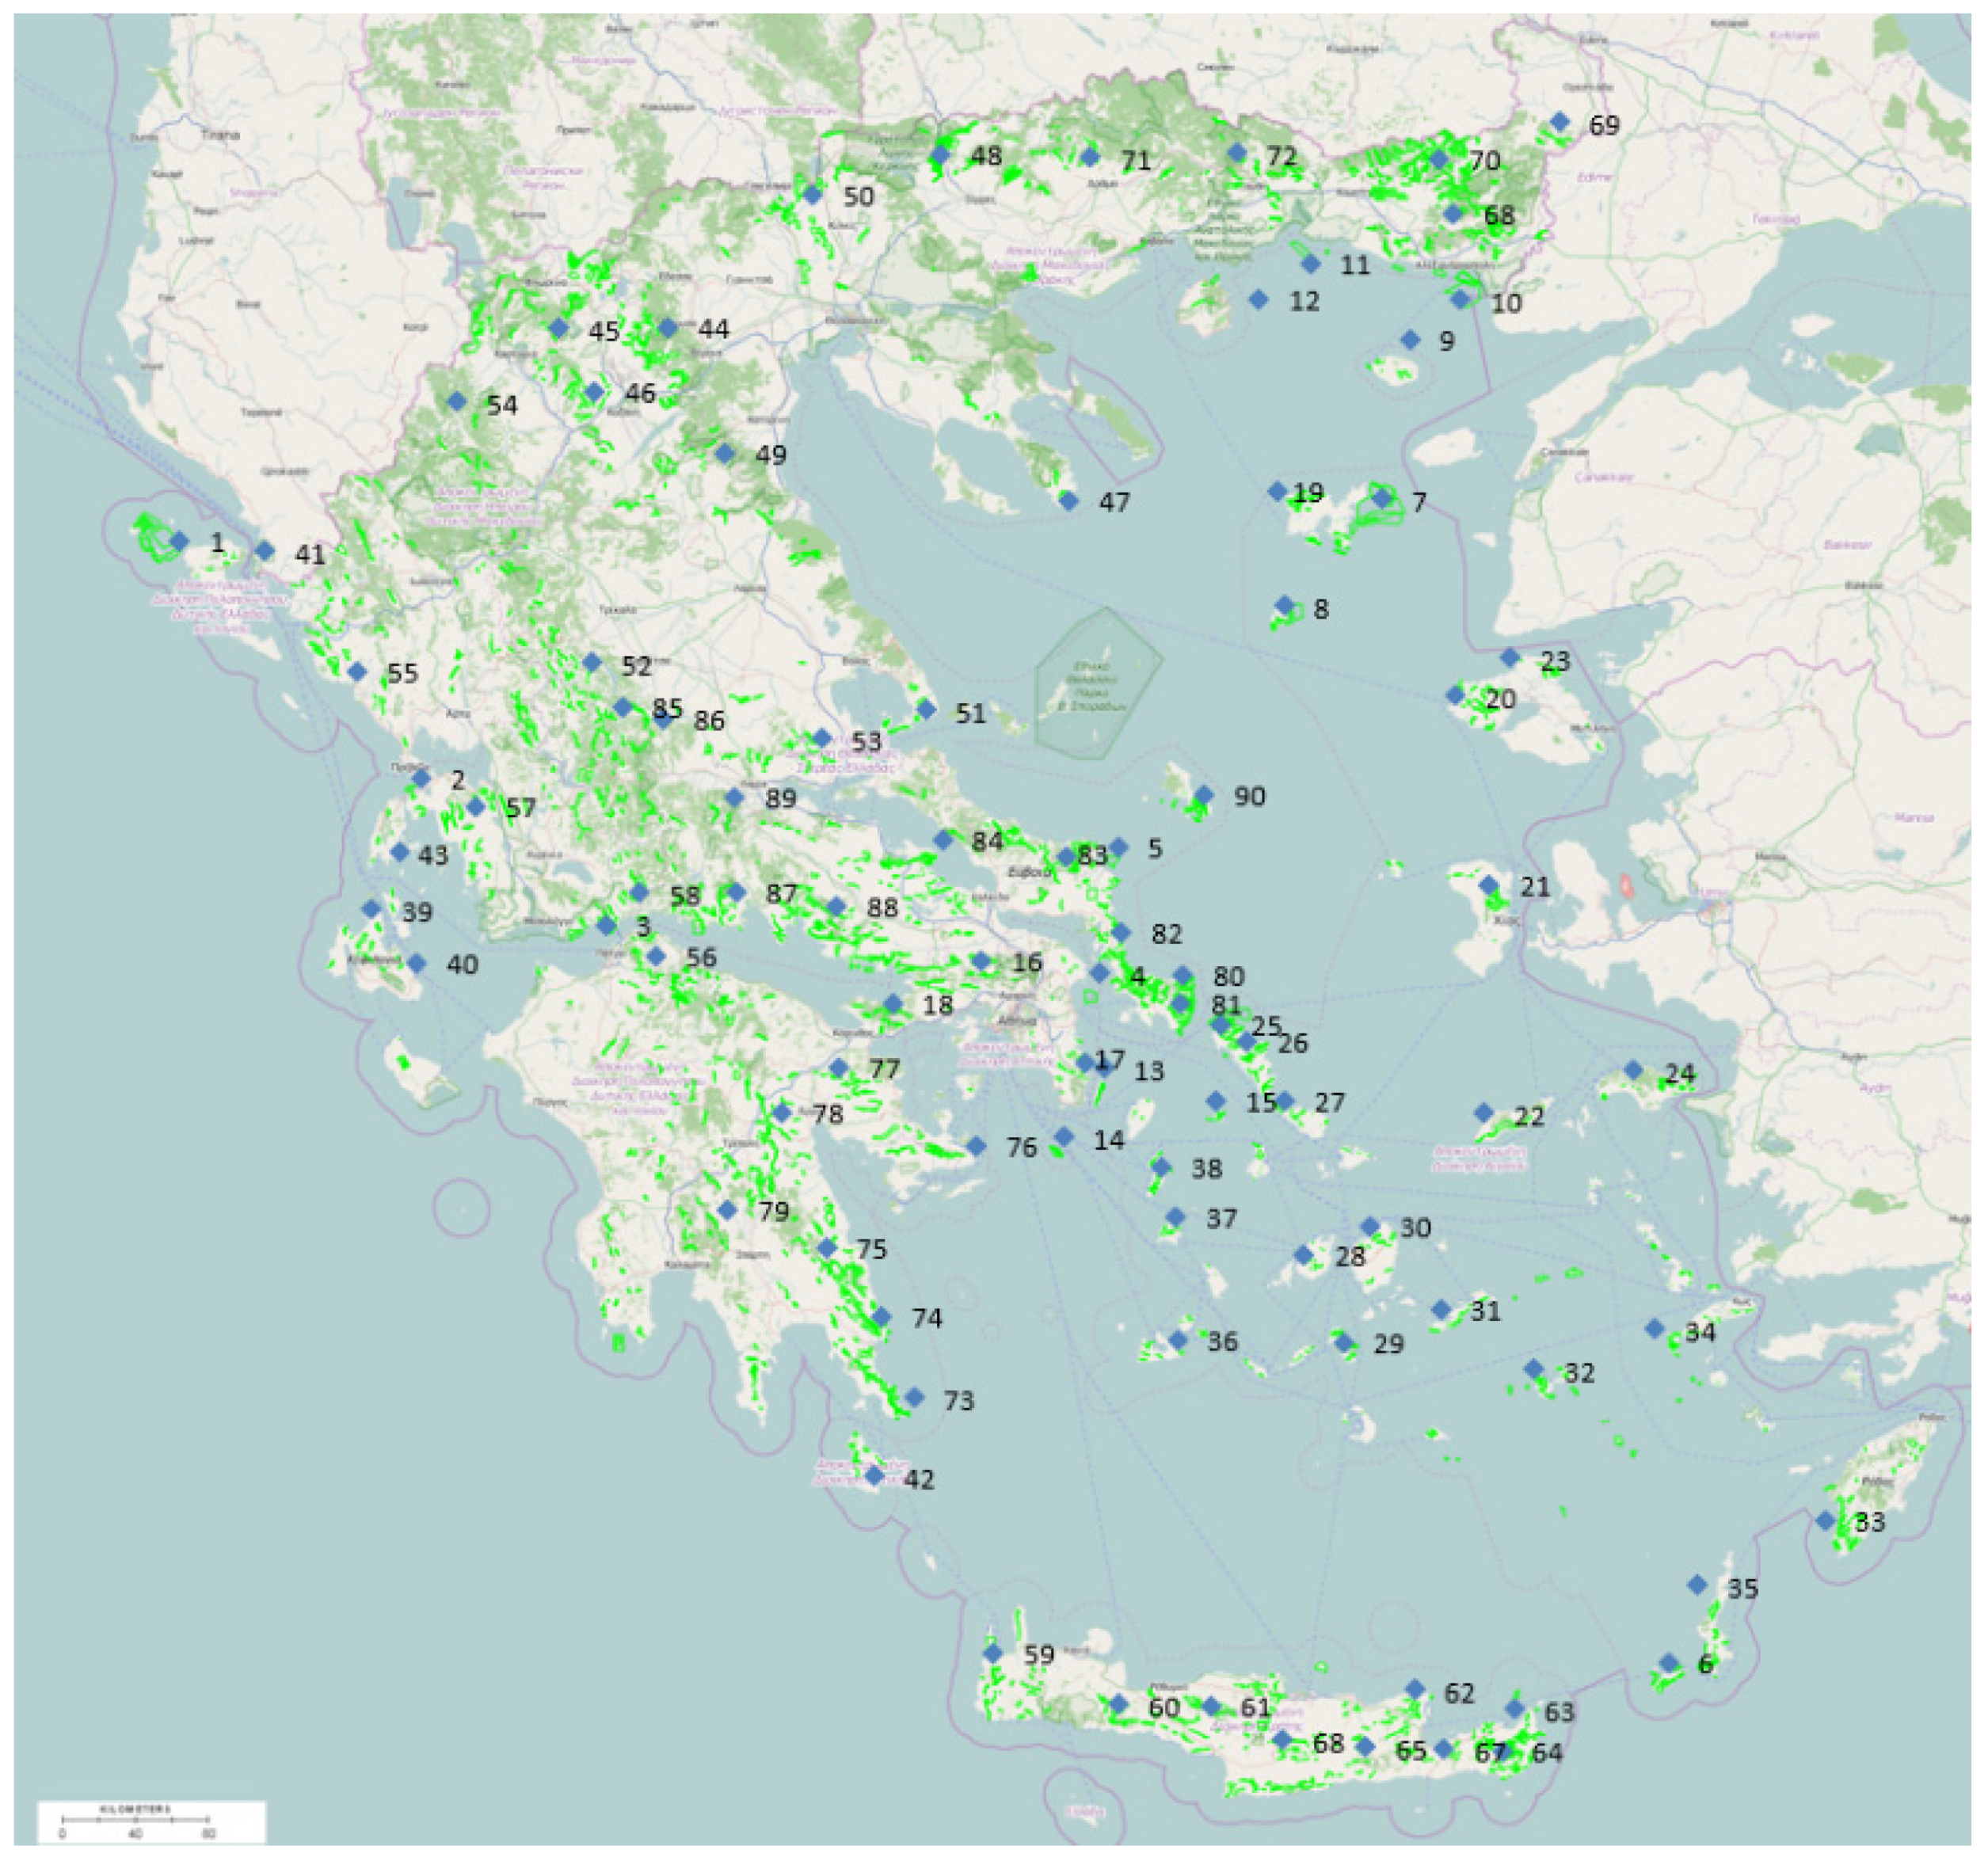
3.2. Wind Data—Mesoscale Modeling

Simultaneous information on wind statistics over every potential area for wind farm development is required for this analysis. Even if a large number of wind measurements are available, it is practically difficult to represent simultaneous data series and cover every potential area of interest. Installation of a mast network for this purpose could lead to rather prohibitive technical and economic restrictions. Additionally, existing wind monitoring networks are relatively large and can provide large spatial coverage but not necessarily high resolution [37]. On the other hand, use of wind potential maps is not a solution since they only provide an estimation of the spatial distribution of the mean wind speed without any information on its temporal variation. Application of a Numerical Weather Prediction (NWP) model can effectively provide the information required.
In this connection, high resolution analytical wind data timeseries for typical wind year are used. These data have been produced by the systematic application of a numerical weather prediction model. Analytical presentation and description of the approach was given in [38]. In Figure 2, the relative high resolution wind atlas of Greece is presented in terms of power density and parameter c of Weibull distribution, which are the most common ways to present Aeolian maps. The wind atlas of Greece was based on a typical wind year and 12 months of weather model simulations for grid boxes 2 × 2 km2 in size. The numerical weather prediction model used is “MM5” which is run operationally at the National Observatory of Athens since 2002 [39] and has been verified [40,41] for its forecast skill over the area of interest.
The selection of 90 representative points in the Greek territory is based on the location of wind farms as it is expressed by investors’ interest and it is depicted in the Regulatory Authority for Energy (RAE) geographical information system in the Greek territory (Figure 3). For future scenarios, spatial dispersion of wind farms and existing plans for interconnections of Greek islands with the power system of mainland Greece are considered. Data for the selected 90 points are presented in Table 2. The duration curve of wind power output is dependent on the spatial distribution of wind farms. Historical data of single wind turbine power production typically show extended time periods with zero or rated production. However, as the spatial dispersion is increased and more wind farms are introduced, the time periods with cumulative zero or rated production are reduced [34]. The aggregated hourly wind power output is calculated on the basis of the mesoscale wind data, and the selected points in the whole Greek territory for the current wind energy development (2019) and the scenarios of installed capacity in each point under consideration for 2030 and 2050 (Figure 4). In Figure 2, high resolution wind atlas are presented for the typical wind year [38]. The indexes of Power density (W/m2) and Parameter c of Weibull distribution (m/s) are presented. Both are widely used in Aeolian maps for representation of the wind potential [42,43]
Figure 3 shows the overview of wind farms applications in the Greek territory and selection of 90 representative points in the whole Greek territory.
In Table 2 the details of the 90 representative points are presented (name, location, k and c of the Weibull distribution and wind power density) [38].

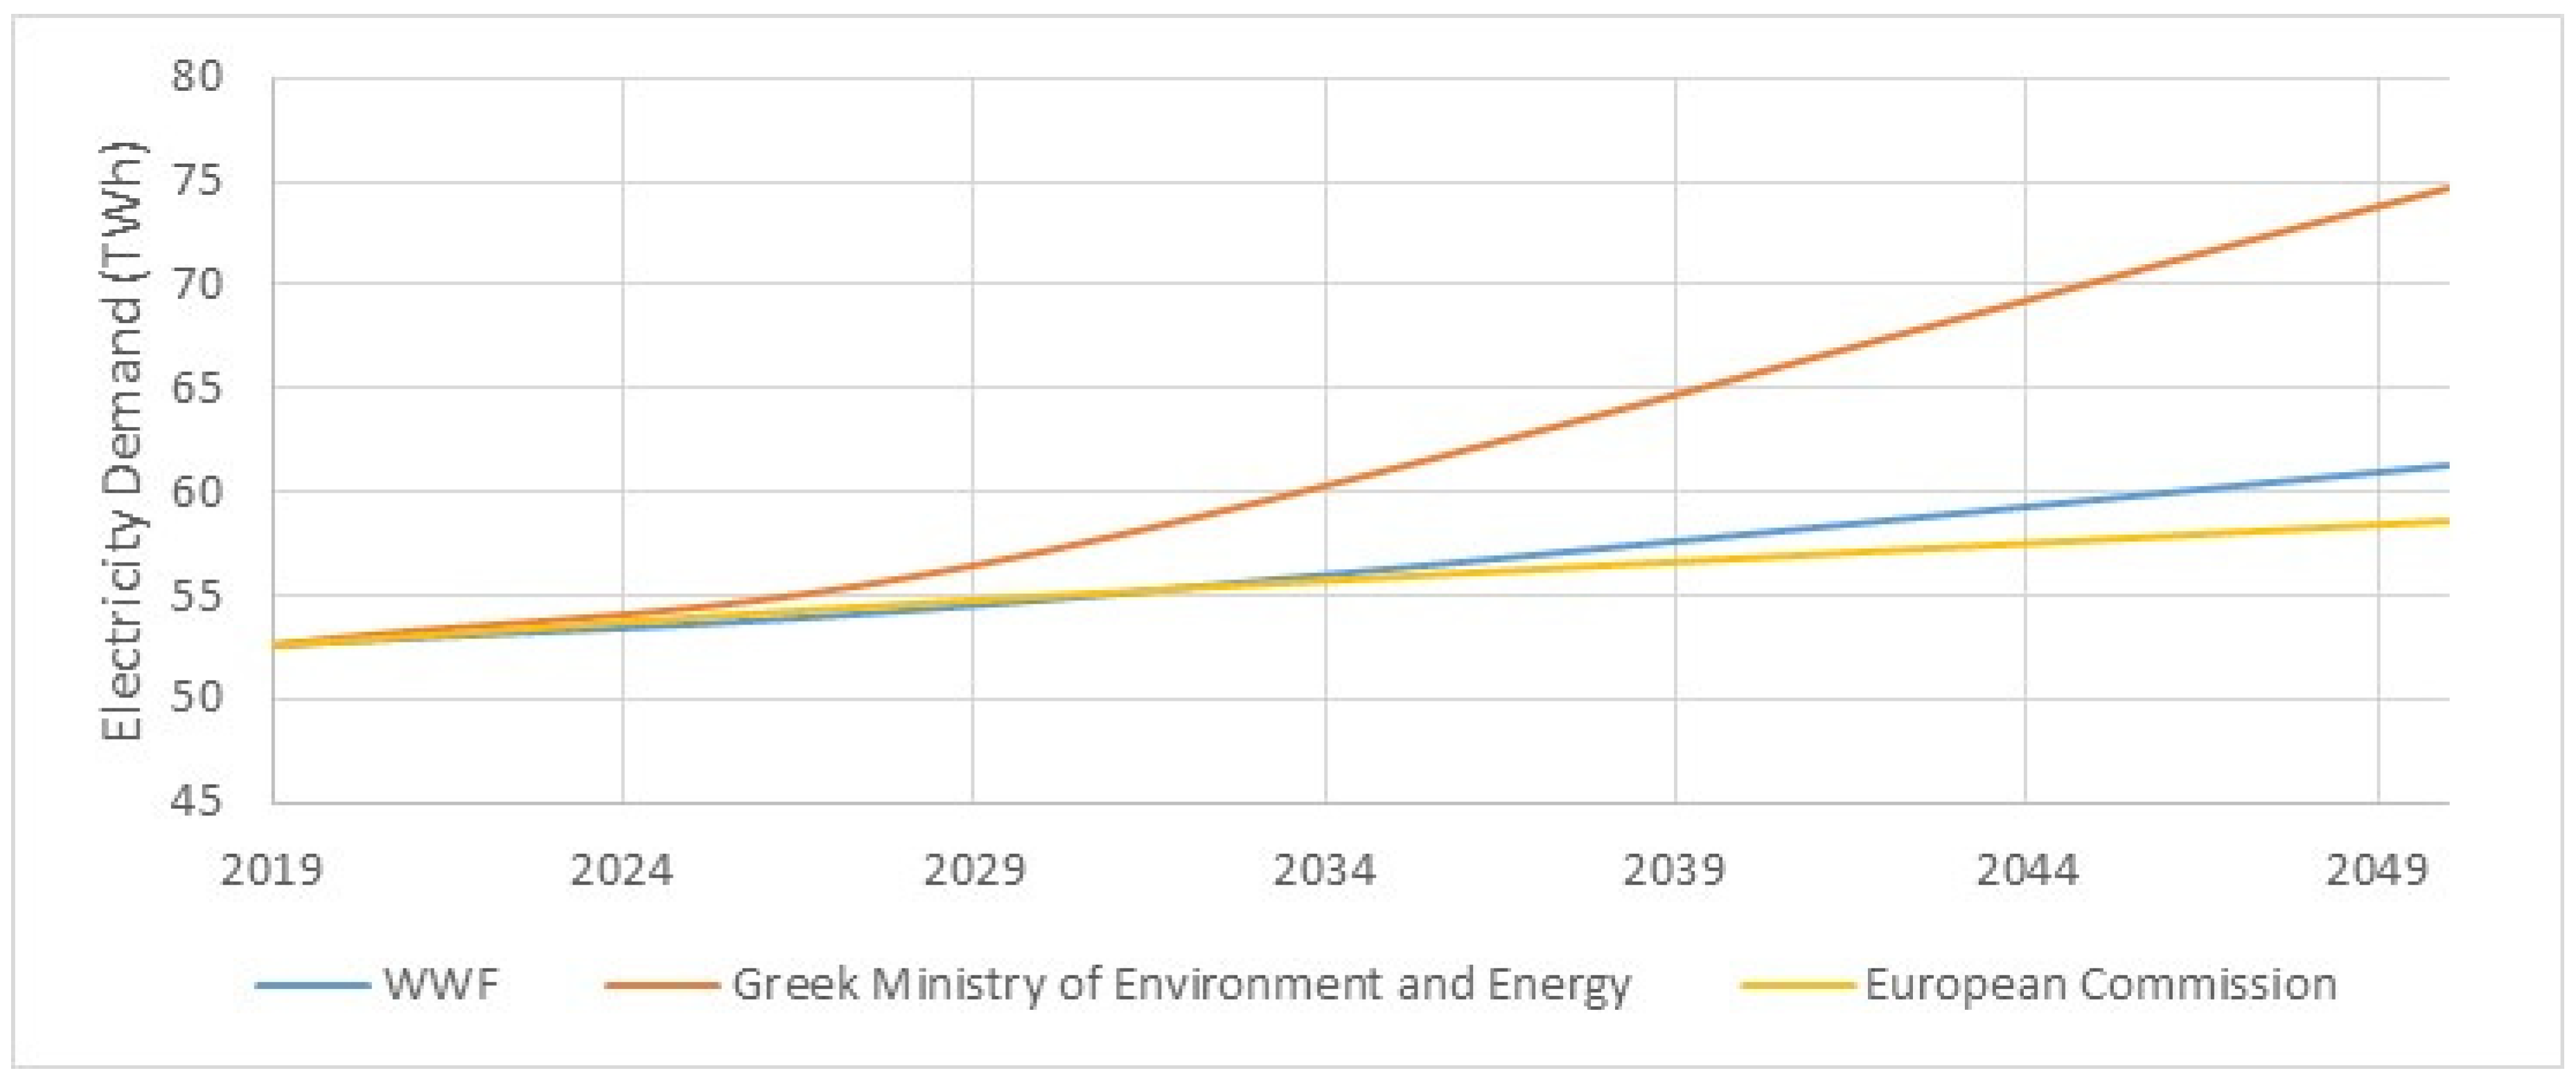
3.3. Load Demand Data

Actual time series of load demand data for the interconnected power system have been used (Power Public Corporation S.A. data, https://www.dei.gr/en, accessed on 15 January 2021). Corresponding adjustments to the demand time series were realized in order to formulate the corresponding timeseries for the years 2030 and 2050. The base year for the load demand time-series is 2006. This is the last year before the start-up of PV development in Greece. The forecasts for annual electricity demand and peak power demand are based on relevant studies that have been conducted for the power system of Greece. The comparative study of the researches carried out for Greece’s future demand concludes that, in 2030, a modest estimation is considered to be 57.2 TWh with a peak demand of 10.5 GW, while for 2050, 74 TWh with a peak demand of 13 GW. The studies that were taken into consideration were conducted by the Ministry of Environment and Energy [27], the European Commission [28] and WWF [29]. A comparative representation of the electricity demand forecasts is presented in Figure 5.

3.4. PV Data

In terms of PV production, actual time series provided by CRES (Centre of Renewable Energy Sources) were used with the appropriate adjustments. The adjustment is based on PVGIS estimated annual output [44]. Table 3 present the information used from PVGIS and representative duration curves of PV power output for four cases.

4. Application—Results

4.1. Scenarios

By 2030, the electricity demand in the country is expected to reach 57.15 TWh, with a peak of 10 GW and by 2050, 74 TWh with a peak of 11.3 GW [27].
Lignite power plants are expected to be decommissioned by 2028, in view of the achievement of decarbonization targets. The nominal output of natural gas units for reference years 2030 and 2050 is expected to reach 6.97 GW [27] and 7.1 GW [29].
In this connection, the reference scenario by 2030 for wind and PV capacity refers to a cumulative capacity of up to 16 GW (8 GW wind, 8 GW PV). By 2050, it is assumed that the renewable energy sources’ capacity, i.e., wind and PV, will account for 18 GW aggregated, with wind installations of 9 GW and photovoltaic of 9 GW. The normalized wind and PV capacities (by the average annual demand) are 1.83 by 2030 and 2.48 by 2050, close to the relative normalized capacities in the corresponding studies discussed and presented in Figure 1.
The percentage of instantaneous wind penetration (δ) is considered to be 50% for 2030 and 60% for 2050. The increase of the instantaneous penetration (δ) in 2050 is based on the fact that the management of the grid renewable energy will have matured, and weather load forecast models will be widely used operationally. However, both figures are considered as very conservative approaches, which will keep the results on the safe side.
According to IPTO adequacy study for 2020–2030, as of December 2019, 700 MW of hydroelectric plants have been licensed, including 590 MW of hydro-pumped storage facilities [45].
The nominal output of power plants using as feedstock biomass is considered to reach 300 MW by 2030 and 600 MW by 2050 [27].

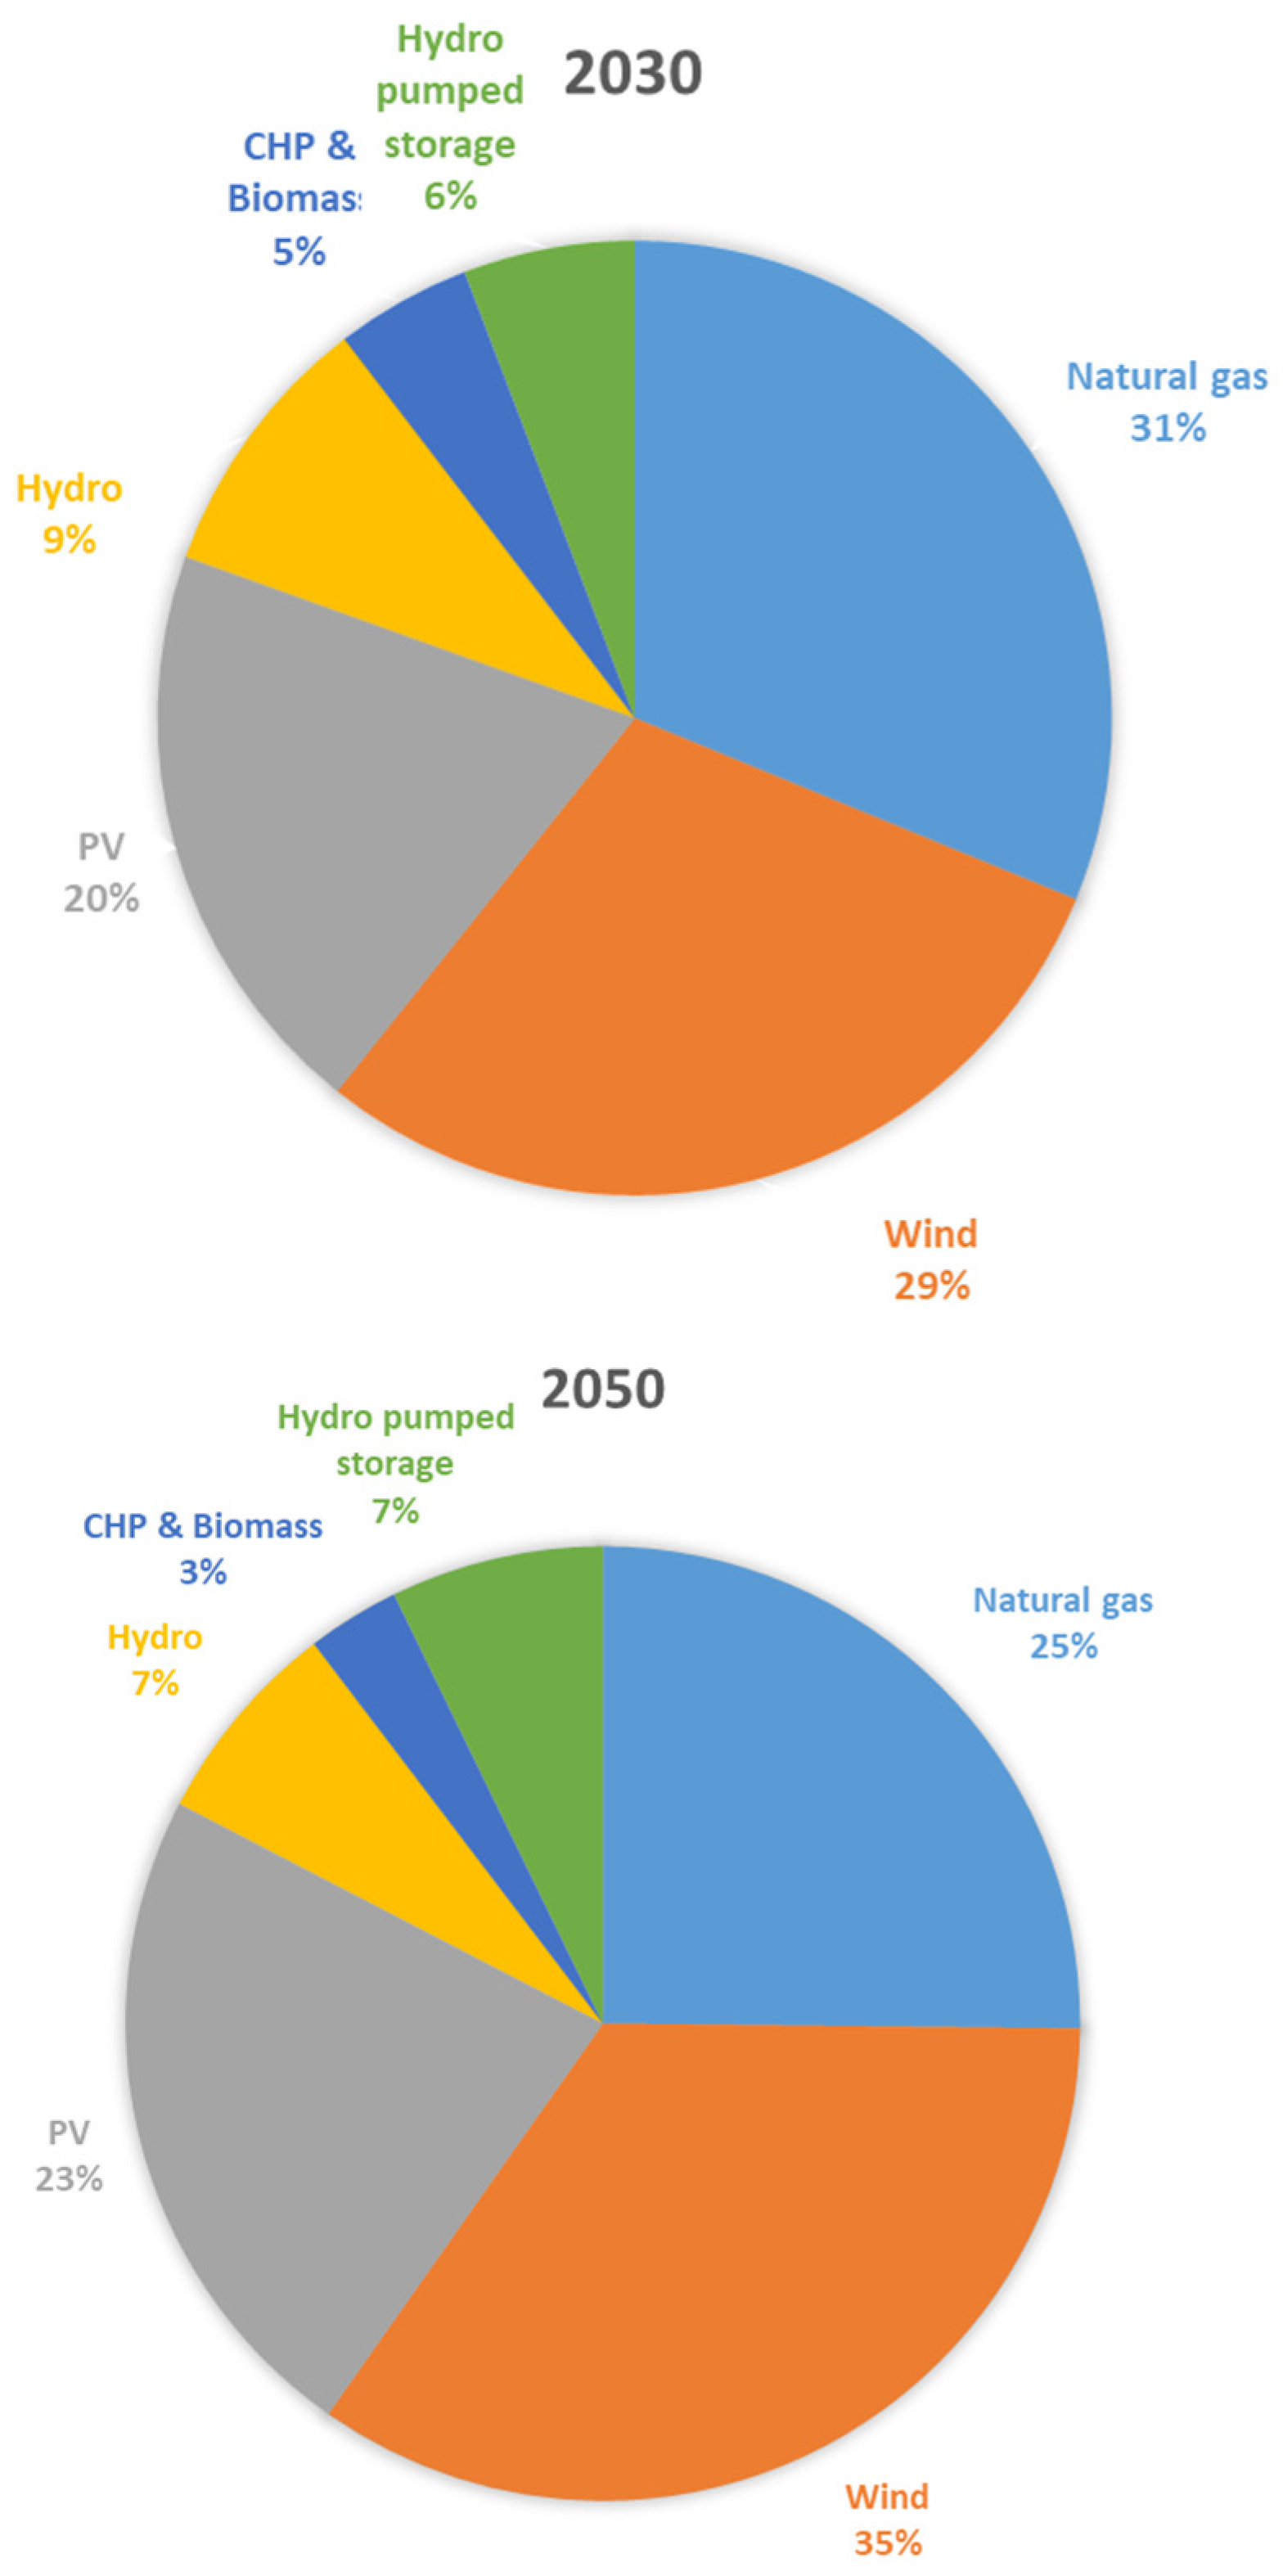
4.2. Energy Mix by 2030 and 2050

By 2030 and 2050, considering the developments and assumptions mentioned above, the final energy mix could be formed as depicted in Figure 6.
The estimated nominal output of hydro-pumped storage units reaches 1500 MW for the reference year 2030. The capacity factor of pumped-storage units, expressed by the rated power of the turbines, reaches 19%. This value of capacity factor is below the lower acceptable limit which renders the investment economically viable (a benchmark of the capacity factor could be 25% [6]). In this study, this value is considered acceptable, since, according to current data for Greece, large hydro units’ capacity factor varies to similar levels (15–17%); therefore, this value could also be considered for reverse hydro-pumped storage projects. The capacity factor of hydropower units may be lower than benchmark, because they are used as a safety net, for cases of emergency, so they are over-dimensioned in order to be able to support the system when a deficit occurs.
The energy contribution of wind and PV installations reaches 49%, and the energy contribution of conventional units is lowered to 31%. The electricity sector is characterized by a higher renewable share, and electricity production is partially decarbonized, compared to the current situation. Hydro-pumped storage units contribute with 6% to the annual electricity demand, by exploiting 70% of curtailed energy.
In 2050, the installed capacity of wind and photovoltaic installations is considered to be 24 GW in total, which results in a reduction of the conventional power plants energy contribution to 25%. Renewable energy sources possess the highest share of production, accounting for approximately 60%. The energy surplus increases due to the higher integration of renewables, and the hydro-pumped storage capacity is estimated at 2700 MW. The share of hydro-pumped storage projects reaches 7% of the total energy produced. The capacity factor of hydro-pumped storage units is estimated at 23%. This higher capacity factor could be attributed to the higher integration of RES, which results in the increase of curtailed power. Consequently, the higher integration of RES contributes to the enhancement of the economically viable operation of hydro-pumped storage units.

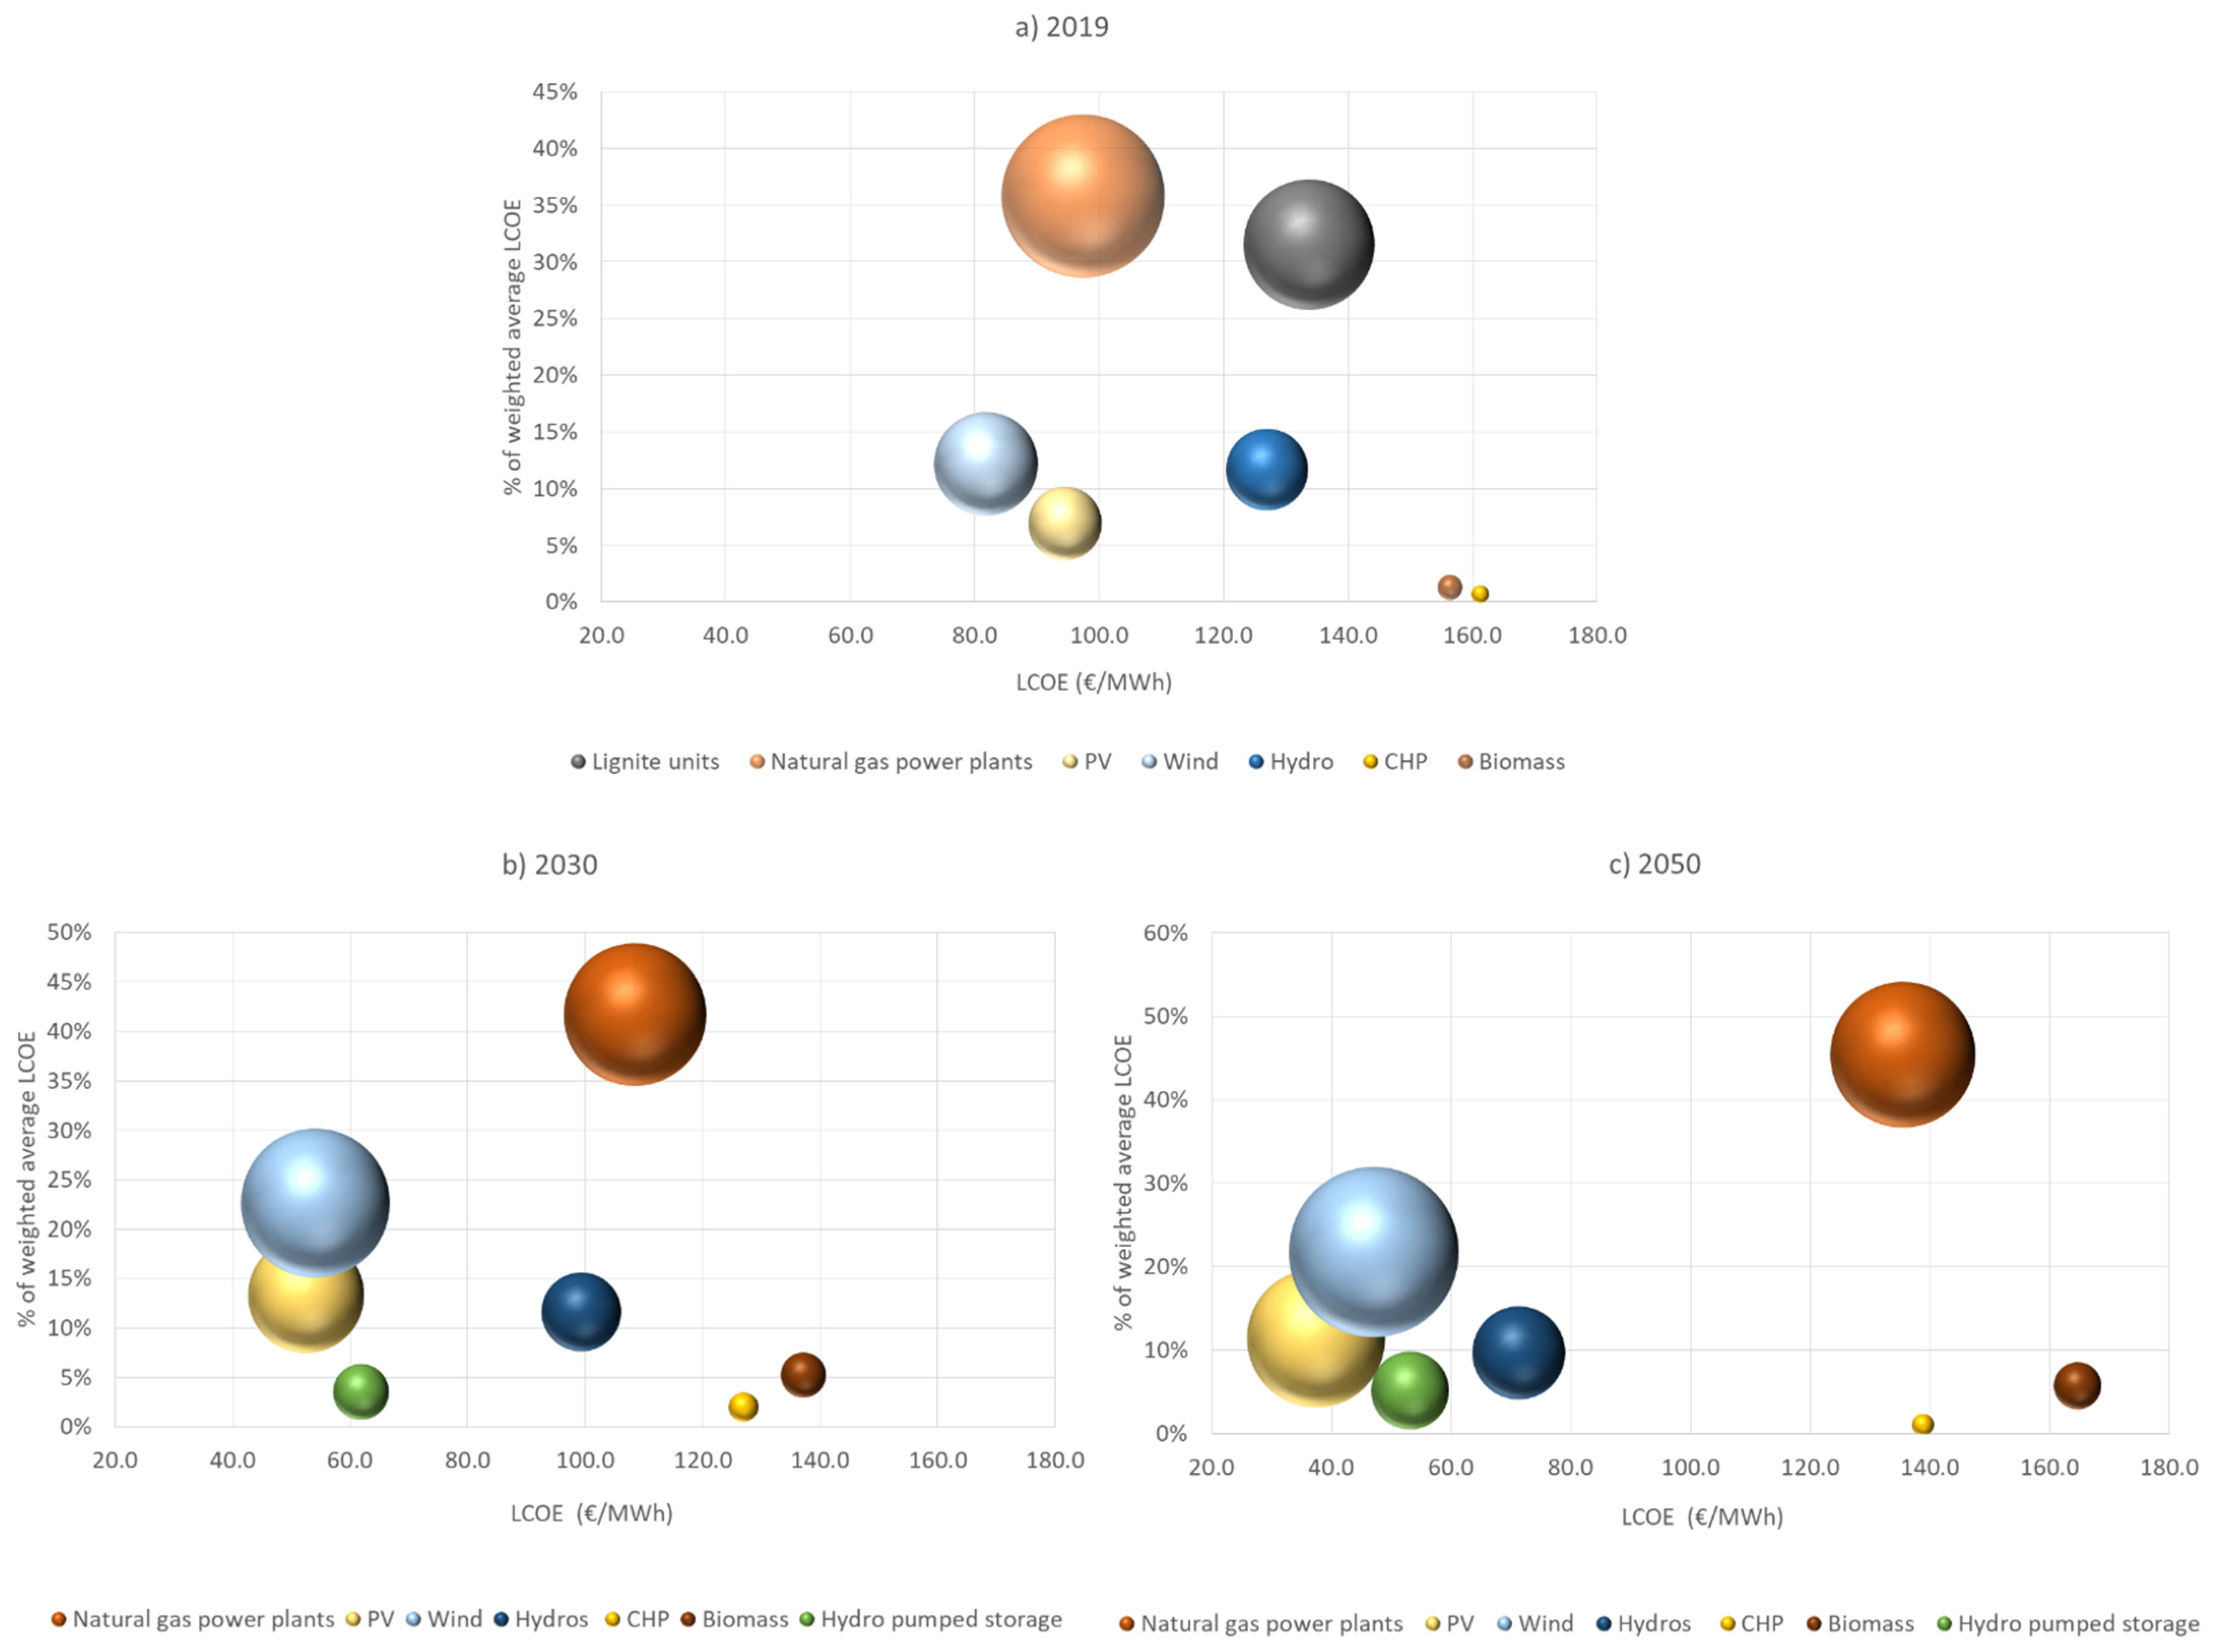
4.3. Economic Assessment

To answer the question whether large-scale integration of Wind—PV with the parallel development of hydro-pumped storage is feasible, the levelized cost of energy is used. The levelized cost of energy is calculated as follows:
LCOE = CAPEX · CRF + OPEX E ,   CRF = DR 1 ( 1 + DR ) N
where, CAPEX is the capital expenditure, CRF the annuity factor, E the annual energy produced, OPEX the operation and maintenance (O&M) expenditures, DR the discount rate and N the lifetime of the investment.
The levelized cost of energy is a valuable cost indicator because of its relative simplicity which allows the comparison of different technologies. At the same time, it is a useful tool for benchmarking the cost of different technology units, considering the lifetime of the units.
The levelized cost of energy has been calculated for the current power supply system and for the examined scenarios for 2030 and 2050, based on the simulation results and the data collected [26,27,28,29,46,47,48,49,50,51,52,53,54,55,56,57,58,59,60,61,62,63,64,65]. Studies conducted and demonstrating projections for costs data, such as CAPEX and OPEX, have been considered for the calculation of the LCOE. The final values used constitute an average value of the costs identified in other publications. A discount rate DR equal to 7% is considered in all cases to secure that estimations of LCOE are modest and relative risks are considered. After a long period of economic uncertainty in Greece due to the economic crisis, in the last 3 years, Greek government bonds had constantly relatively low rates, less than 3%. Table 4, Table 5 and Table 6 show the details about LCOE components, data, assumptions and results for the years 2019, 2030 and 2050, respectively. All the prices presented in the three tables are not harmonized. In some cases, different sources are available and mean values are used. The extracted value of LCOE evaluates not only the relative CAPEX and OPEX for each type of units but also their utilization, as it is introduced by the energy output in the denominator. Then, the results of LCOE are useful for the specific cases studies in Greece, under the assumptions of the current methodological approach and conclusions cannot be universalized. Additionally, the various parameters of cost in case of hydro and hydro-pumped storage are site dependent, and then, results are not useful for other case studies.
In Figure 7, the size of the bubbles corresponds to the amount of energy generated by each type of technology, whereas on the horizontal axis the LCOE of each unit type is presented, and on the vertical axis, the share of the cost of the different types of technologies in the total cost of the system is depicted.
In the current power supply system, the participation of lignite and natural gas units is crucial in order to meet electricity demand. The LCOE of the system is estimated to 107.59 €/MWh, and the largest share of the cost is due to the conventional units. Although CHP and biomass units are characterized by high levelized costs due to their limited nominal capacity, they do not participate significantly to the final composition of the cost of the system.
The weighted average LCOE of the power system in Greece by 2030, according to the calculations, is decreased to 79 €/MWh. This reduction could be attributed to the decommissioning of lignite units, which present a higher LCOE compared to RES (wind and PV installations) in 2019. Natural gas units gradually replace lignite ones by 2030. Carbon dioxide allowances are expected to rise to a higher level by 2030; therefore, the operational expenditures of conventional units are increased, resulting in a higher LCOE for natural gas units. The expected decrease of the CAPEX required for RES installations contribute to the significant decrease of the weighted average LCOE of the system.
By 2050, a further reduction of the system’s cost is expected; the levelized cost is approximately 75 €/MWh, reduced by 30% compared to current levels. Increasing the participation of renewable energy sources in the energy production with the simultaneous significant reduction of their CAPEX leads to a decrease in the levelized cost of the system. Hydro-pumped storage is among the technologies presenting the lowest LCOE, following wind and PV. The CO2 prices are significantly higher compared to 2030 resulting in the increase of the levelized cost of energy of natural gas power plants.

5. Discussion and Conclusions

High renewable penetration could lead to a significant reduction of the system’s cost, while hydro-pumped storage systems may contribute to the peak demand supply.
The size of the reverse hydro units should be proportional to the development of Wind and PV installed capacity. The over-dimensioning of reverse hydroelectric projects may lead to installed hydroelectric pumps and turbines which will be used only for a few hours per year without ensuring their economic feasibility, while under-dimensioning will lead to insufficient exploitation of the potential. Furthermore, the higher integration of renewable sources (wind and PV) across the country (spatial dispersion) results in significant energy surplus and curtailment during the year, therefore energy that could be stored in hydro-pumped storage systems is increased. In this case, hydro-pumped storage units can contribute significantly to the energy balance, as analyzed in the scenarios.
The economic assessment of the future power system of Greece, based on the scenarios examined in this connection, demonstrates that the increase of RES contribution may lead to lower costs for the system. Greater penetration of photovoltaic and wind installations results in a reduction of the levelized cost of energy of the system, since capital expenditures required for wind and PV systems are expected to decrease significantly over the years. The cost of thermal units in reference years 2030 and 2050 is expected to be higher due to the increase in the cost of carbon dioxide emission allowances. The reduction of the energy production share of the latter in combination with the higher integration of RES prevents the increase of the weighted average LCOE of the power system.

Author Contributions

Conceptualization, G.C. and A.Z.; methodology, G.C. and A.D.; software and formal analysis, A.D.; investigation, A.D.; data curation, V.K. and K.L.; writing—original draft preparation, A.D., T.C.; writing—review and editing, A.D. and G.C.; supervision, G.C.; All authors have read and agreed to the published version of the manuscript.

Funding

This research received no external funding.

Institutional Review Board Statement

Not applicable.

Informed Consent Statement

Not applicable.

Data Availability Statement

Not applicable.

Conflicts of Interest

The authors declare no conflict of interest.

References

  1. Weitemeyer, S.; Kleinhans, D.; Vogt, T.M.; Agert, C. Integration of Renewable Energy Sources in future power systems: The role of storage. Renew. Energy 2015, 75, 14–20. [Google Scholar] [CrossRef] [Green Version]
  2. Loisel, R.; Mercier, A.; Gatzen, C.; Elms, N.; Petric, H. Valuation framework for large scale electricity storage in a case with wind curtailment. Energy Policy 2010, 38, 7323–7337. [Google Scholar] [CrossRef]
  3. Tuohy, A.; O’Malley, M. Pumped storage in systems with very high wind penetration. Energy Policy 2011, 39, 1965–1974. [Google Scholar] [CrossRef]
  4. Zhang, N.; Lu, X.; McElroy, M.B.; Nielsen, C.P.; Chen, X.; Deng, Y.; Kang, C. Reducing curtailment of wind electricity in China by employing electric boilers for heat and pumped hydro for energy storage. Appl. Energy 2016, 184, 987–994. [Google Scholar] [CrossRef] [Green Version]
  5. Kong, Y.; Kong, Z.; Liu, Z.; Wei, C.; Zhang, J.; An, G. Pumped storage power stations in China: The past, the present, and the future. Renew. Sustain. Energy Rev. 2017, 71, 720–731. [Google Scholar] [CrossRef]
  6. Anagnostopoulos, J.S.; Papantonis, D.E. Study of pumped storage schemes to support high RES penetration in the electric power system of Greece. Energy 2012, 45, 416–423. [Google Scholar] [CrossRef]
  7. Caralis, G.; Rados, K.; Zervos, A. On the market of wind with hydro-pumped storage systems in autonomous Greek islands. Renew. Sustain. Energy Rev. 2010, 14, 2221–2226. [Google Scholar] [CrossRef]
  8. Tigas, K.; Giannakidis, G.; Mantzaris, J.; Lalas, D.; Sakellaridis, N.G.; Nakos, C.; Vougiouklakis, Y.; Theofilidi, M.; Pyrgioti, E.; Alexandridis, A.T. Wide scale penetration of renewable electricity in the Greek energy system in view of the European decarbonization targets for 2050. Renew. Sustain. Energy Rev. 2015, 42, 158–169. [Google Scholar] [CrossRef]
  9. Cannistraro, G.; Cannistraro, M.; Trovato, G. Island “Smart Energy” for Eco-Sustainable Energy—A Case Study “Favignana Island”. Int. J. Heat Technol. 2017, 35. [Google Scholar] [CrossRef]
  10. Lopes, A.S.; Castro, R.; De Jesus, J.F. Contributions to the preliminary assessment of a Water Pumped Storage System in Terceira Island (Azores). J. Energy Storage 2016, 6, 59–69. [Google Scholar] [CrossRef]
  11. Padrón, S.; Medina, J.F.; Rodriguez, A. Analysis of a pumped storage system to increase the penetration level of renewable energy in isolated power systems. Gran Canaria: A case study. Energy 2011, 36, 6753–6762. [Google Scholar] [CrossRef]
  12. Bueno, C.; Carta, J. Technical–economic analysis of wind-powered pumped hydrostorage systems. Part II: Model application to the island of El Hierro. Sol. Energy 2005, 78, 396–405. [Google Scholar] [CrossRef]
  13. Caralis, G.; Zervos, A. Analysis of the combined use of wind and pumped storage systems in autonomous Greek islands. IET Renew. Power Gener. 2007, 1, 49–60. [Google Scholar] [CrossRef]
  14. Katsaprakakis, D.A.; Christakis, D.G.; Zervos, A.; Papantonis, D.; Voutsinas, S. Pumped storage systems introduction in isolated power production systems. Renew. Energy 2008, 33, 467–490. [Google Scholar] [CrossRef]
  15. Krajačić, G.; Duić, N.; Tsikalakis, A.; Zoulias, M.; Caralis, G.; Panteri, E.; da Graça Carvalho, M. Feed-in tariffs for promotion of energy storage technologies. Energy Policy 2011, 39, 1410–1425. [Google Scholar] [CrossRef] [Green Version]
  16. Hu, J.; Harmsen, R.; Crijns-Graus, W.; Worrell, E.; Broek, M.V.D. Identifying barriers to large-scale integration of variable renewable electricity into the electricity market: A literature review of market design. Renew. Sustain. Energy Rev. 2018, 81, 2181–2195. [Google Scholar] [CrossRef]
  17. Child, M.; Bogdanov, D.; Breyer, C. The role of storage technologies for the transition to a 100% renewable energy system in Europe. Energy Procedia 2018, 155, 44–60. [Google Scholar] [CrossRef]
  18. Rasmussen, M.G.; Andresen, G.B.; Greiner, M. Storage and balancing synergies in a fully or highly renewable pan-European power system. Energy Policy 2012, 51, 642–651. [Google Scholar] [CrossRef]
  19. Hunt, J.D.; Zakeri, B.; Lopes, R.; Barbosa, P.S.F.; Nascimento, A.; De Castro, N.J.; Brandão, R.; Schneider, P.S.; Wada, Y. Existing and new arrangements of pumped-hydro storage plants. Renew. Sustain. Energy Rev. 2020, 129, 109914. [Google Scholar] [CrossRef]
  20. Stocks, M.; Stocks, R.; Lu, B.; Cheng, C.; Blakers, A. Global Atlas of Closed-Loop Pumped Hydro Energy Storage. Joule 2021, 5, 270–284. [Google Scholar] [CrossRef]
  21. Cheng, C.; Blakers, A.; Stocks, M.; Lu, B. Pumped hydro energy storage and 100 % renewable electricity for East Asia. Glob. Energy Interconnect. 2019, 2, 386–392. [Google Scholar] [CrossRef]
  22. Dubbers, D. Comparison of underwater with conventional pumped hydro-energy storage systems. J. Energy Storage 2021, 35, 102283. [Google Scholar] [CrossRef]
  23. Challenges and Opportunities for New Pumped Storage Development—A White Paper Developed by NHA’s Pumped Storage Development Council. Available online: http://www.hydro.org/wp-content/uploads/2012/07/NHA_PumpedStorage_071212b1.pdf (accessed on 15 September 2017).
  24. Greek Operator of Electricity Market. DAS Monthly Report; Greek Operator of Electricity Market: Athens, Greece, 2019. (In Greek) [Google Scholar]
  25. DAPEEP. RES and CHP Report; DAPEEP: Athens, Greece, 2019. [Google Scholar]
  26. Ministry of Environment and Energy. National Energy and Climate Plan; Ministry of Environment and Energy: Athens, Greece, 2019.
  27. Greek Ministry of Energy and Environment. National Energy Planning, 2050 Energy Roadmap; Greek Ministry of Energy and Environment: Athens, Greece, 2019.
  28. Capros, P.; de Vita, A.; Tasios, N.; Siskos, P.; Kannavou, M.; Petropoulos, A.; Evangelopoulou, S.; Zampara, M.; Papadopoulos, D.; Nakos, L.; et al. EU Reference Scenario 2016, Energy, transport and GHG emissions Trends to 2050; European Commission: Luxembourg, 2016. [Google Scholar]
  29. Moirasgentis, S.; Sarafidis, G.; Georgopoulou, E. Long Term Plan for the Greek Energy System; WWF: Athens, Greece, 2017. (In Greek) [Google Scholar]
  30. Tuohy, A.; Meibom, P.; Denny, E.; O’Malley, M. Unit Commitment for Systems with Significant Wind Penetration. IEEE Trans. Power Syst. 2009, 24, 592–601. [Google Scholar] [CrossRef] [Green Version]
  31. Ruiz, P.A.; Philbrick, C.R.; Sauer, P.W. Modeling approaches for computational cost reduction in stochastic unit commitment formulations. IEEE Trans. Power Syst. 2010, 25, 588–589. [Google Scholar] [CrossRef]
  32. Lujano-Rojas, J.; Osório, G.; Catalão, J. New probabilistic method for solving economic dispatch and unit commitment problems incorporating uncertainty due to renewable energy integration. Int. J. Electr. Power Energy Syst. 2016, 78, 61–71. [Google Scholar] [CrossRef]
  33. Osório, G.; Lujano-Rojas, J.; Matias, J.; Catalão, J.P.S. A probabilistic approach to solve the economic dispatch problem with intermittent renewable energy sources. Energy 2015, 82, 949–959. [Google Scholar] [CrossRef]
  34. Caralis, G.; Perivolaris, Y.; Rados, K.; Zervos, A. On the Effect of Spatial Dispersion of Wind Power Plants on the Wind Energy Capacity Credit in Greece. Environ. Res. Lett. 2008, 3, 015003. [Google Scholar] [CrossRef]
  35. Caralis, G.; Papantonis, D.; Zervos, A. The role of pumped storage systems towards the large scale wind integration in the Greek power supply system. Renew. Sustain. Energy Rev. 2012, 16, 2558–2565. [Google Scholar] [CrossRef]
  36. Papathanassiou, S.A.; Boulaxis, N.G. Power limitations and energy yield evaluation for wind farms operating in island systems. Renew. Energy 2006, 31, 457–479. [Google Scholar] [CrossRef]
  37. Archer, C.L.; Jacobson, M.Z. Spatial and temporal distributions of U.S. winds and wind power at 80 m derived from measurements. J. Geophys. Res. Space Phys. 2003, 108, 9. [Google Scholar] [CrossRef]
  38. Kotroni, V.; Lagouvardos, K.; Lykoudis, S. High-resolution model-based wind atlas for Greece. Renew. Sustain. Energy Rev. 2014, 30, 479–489. [Google Scholar] [CrossRef]
  39. Kotroni, V.; Lagouvardos, K. Evaluation of MM5 High-Resolution Real-Time Forecasts over the Urban Area of Athens, Greece. J. Appl. Meteorol. 2004, 43, 1666–1678. [Google Scholar] [CrossRef]
  40. Kotroni, V.; Lagouvardos, K. Precipitation forecast skill of different convective parameterization and micro-physical schemes: Application for the cold season over Greece. Geoph. Res. Let. 2001, 108, 1977–1980. [Google Scholar] [CrossRef]
  41. Akylas, E.; Kotroni, V.; Lagouvardos, K. Sensitivity of high-resolution operational weather forecasts to the choice of the planetary boundary layer scheme. Atmos. Res. 2007, 84, 49–57. [Google Scholar] [CrossRef]
  42. Troen, I.; Lundtang Petersen, E. European Wind Atlas. Risø National Laboratory. 1989. Available online: Orbit.dtu.dk/files/112135732/European_Wind_Atlas.pdf (accessed on 15 February 2021).
  43. Caralis, G.; Gao, Z.; Yang, P.; Huang, M.; Zervos, A.; Rados, K. Development of Aeolian map of China using mesoscale atmospheric modelling. Renew. Energy 2015, 74, 60–69. [Google Scholar] [CrossRef]
  44. Photovoltaic Geographical Information System (PVGIS). Geographical Assessment of Solar Resource and Performance of Photovoltaic Technology. Available online: http://re.jrc.ec.europa.eu/pvgis/ (accessed on 15 September 2017).
  45. Independent Power Transmission Operator. Power Adequacy Study for Years 2020–2030; Independent Power Transmission Operator: Athens, Greece, 2019. [Google Scholar]
  46. Papaefthymiou, G.; Grave, K.; Dragoon, K. Flexibility Options in Electricity Systems; Ecofys: Berlin, Germany, 2014. [Google Scholar]
  47. Larsson, S. Reviewing Electricity Generation; Uppsala Universitet: Uppsala, Sweden, 2012. [Google Scholar]
  48. Schröder, A.; Kunz, F.; Meiss, J.; Mendelevitch, R.; Hirschhausen, C.V. Current and Prospective Costs of Electricity Generation until 2050; DIW: Berlin, Germany, 2013. [Google Scholar]
  49. Joint Research Centre. Energy Technology Reference Indicator Projections for 2010–2050; European Union: Luxembourg, 2014. [Google Scholar]
  50. International Energy Agency; Nuclear Energy Agency. Projected Costs of Generating Electricity; IEA: Paris, France; NEA: Paris, France, 2015.
  51. Zach, K.; Auer, H.; Lettner, G. Report summarizing the current Status, Role and Costs of Energy Storage Technologies; WIP Renewable Energies: Munich, Germany, 2012. [Google Scholar]
  52. ECOFYS. Subsidies and Costs of EU Energy, Annex 4–5; European Commission: Brussels, Belgium, 2014. [Google Scholar]
  53. Ministry of Environment & Energy. Description of Functional Support Scheme in the Renewable Energy Sources and Cogeneration Power and Heat High Performance; Ministry of Environment & Energy: Athens, Greece, 2016.
  54. Official Government Gazette of Hellenic Republic. Determination of the Minimum Bid Price of Auctioned Energy for the Year 2017; n. Β’ 2278/04.07.2017; Government of Greece: Athens, Greece, 2017; p. 23014. (In Greek)
  55. International Renewable Energy Agency (IRENA). Renewable Energy Technologies: Cost Analysis Series, Wind Power; IRENA: Bonn, Germany, 2012.
  56. Lako, P. Hydropower; IEA ETSAP: Paris, France, 2010. [Google Scholar]
  57. IEA ETSAP. Combined Heat and Power, Technology Brief E04; IEA ETSAP: Paris, France, 2010. [Google Scholar]
  58. International Renewable Energy Agency. Renewable Energy Technologies: Cost Analysis Series, Biomass for Power Generation; IRENA: Bonn, Germany, 2012.
  59. Booz & Company. Understanding Lignite Generation Costs in Europe; Public Power Corporation S.A.: Athens, Greece, 2012. [Google Scholar]
  60. Eleutheriadis, I. Biomass Potential and Solid Biofuels; Center for Renewable Energy Sources and Saving: Athens, Greece, January 2013. [Google Scholar]
  61. EUBIA, European Biomass Industry Association. 2017. Available online: http://www.eubia.org/cms/wiki-biomass/biomass-characteristics/ (accessed on 15 June 2017).
  62. Official Government Gazette of Hellenic Republic. Measures to Support and Develop the Greek Economy in the Framework of Application of Law 4046/2012 and Other Provisions; n. 4254/07.04.2014; Government of Greece: Athens, Greece, 2014. (In Greek)
  63. IEA. IEA Energy Technology Essentials; IEA: Paris, France, 2007.
  64. Chiantore, P.V.; Gordon, I.; Hoffmann, W.; Perezagua, E.; Philipps, S.; Roman, E.; Sandre, E.; Sink, W.; Simonot, E.; Martínez, A. Future Renewable Energy Costs: Solar Photovoltaics; KIC InnoEnergy: Eindhoven, The Netherlands, 2015. [Google Scholar]
  65. Mayer, J.N. Current and Future Cost of Photovoltaics; Agora Energiewende: Berlin, Germany, 2015. [Google Scholar]
Figure 1. Normalized PV and Wind capacity (by the annual mean load) [26,27,28,29].
Applsci 11 02368 g001
Figure 2. High resolution wind atlas for a typical wind year [38]: (a) power density (W/m2), (b) parameter c (m/s) of Weibull distribution.
Applsci 11 02368 g002
Figure 3. Overview of wind farms applications in the Greek territory and selection of representative points in the whole Greek territory.
Applsci 11 02368 g003
Figure 4. Location of wind farms by 2019, 2030 and 2050.
Applsci 11 02368 g004
Figure 5. Electricity demand development scenarios [27,28,29].
Applsci 11 02368 g005
Figure 6. Energy share by technology for reference years 2030 and 2050.
Applsci 11 02368 g006
Figure 7. Levelized Cost of Energy and contribution to the weighted average cost of the system by technology (the size of the bubbles corresponds to power generation by each type of technology).
Applsci 11 02368 g007
Table 1. Forecasts for the cumulative capacity of PV and Wind capacity in Greece by 2030 and 2050 [26,27,28,29].
Ministry of Environment and Energy WWFEuropean Commission
PV (GW)Wind (GW)PV (GW)Wind (GW)PV (GW)Wind (GW)
20307.774.85.05.66
20508–1211–187.16.78.97.8
Table 2. Mesoscale typical wind year data of the representative points [38].
PointSiteLat
(°)
Long
(°)
k (-)c (m/s)Wind Power Density (W/m2)PointSiteLat
(°)
Long
(°)
k
(Weibull Coefficient)
c (m/s)Wind Power Density (W/m2)
1Othonoi39.78619.4221.595.9923246Kozani40.36821.5451.584.78116
2Lefkada38.86720.6521.715.3714647Chalkidiki39.94723.9721.735.35143
3Krioneri38.29221.6021.215.7833948Serres41.29623.3171.494.63116
4Petalioi38.10324.1331.87.4136949Veroia40.12722.2141.594.4792
5Kimi38.59924.2211.756.6827850Kilkis41.13422.6631.394.53127
6Karpathos35.41727.0391.918.9259251Trikeri39.12623.2371.775.33137
7Lemnos39.95125.5731.697.6243152Trikala39.31221.5251.516.16273
8Ai-Stratis39.53625.0711.87.2534453Anavra39.01722.7051.655.06128
9Samothraki40.57525.7141.55.9625154Ioannina40.32720.8371.725.8186
10Alexandroupoli40.72625.9771.636.427255Perdika39.27820.3281.524.2183
11Fanari40.86725.2051.525.0715056Kalavrita38.75120.9331.55.18164
12Thasos40.73324.9461.555.0914557Mitikas38.41721.7731.755.2129
13Makronisos37.73224.1501.667.2237958Naupaktos38.17421.8561.555.81221
14Ai-Giorgis37.46523.9421.686.7730759Kissamos35.45523.5871.636.55290
15Gyaros37.60924.7231.617.442260Sfakia35.25824.2251.437.78554
16Erithres38.15123.5251.566.2326861Psiloreitis35.25024.6971.597.39429
17Lavrio37.75524.0581.77.2537262Elounta35.31225.7401.78.2526
18Geraneia37.98523.0671.435.8726163Toplou35.23926.2501.747.34374
19Lemnos (Mirina)39.98325.0431.735.9519964Ziros35.07826.1881.598.6638
20Lesvos (Eresos)39.18325.9471.866.5223965Malia35.09025.4921.548.24594
21Chios38.44726.1261.857.4536366Irakleio (south)35.11725.0681.596.52299
22Ikaria37.55926.0961.378.2666267Mochlos35.08025.8961.498.73699
23Lesvos (Mantamados)39.33126.2281.766.5726368Alexandroupoli41.06325.9421.786.74280
24Samos37.72426.8651.667.3740269Orestiada41.41826.4811.454.39104
25Andros (Kalivbarni)37.90324.7501.777.2334970Dokos41.27325.8671.916.36214
26Andros (Arnas)37.84024.8851.567.8651871Drama41.28024.0831.494.1280
27Tinos37.60725.0731.647.4241772Xanthi41.29824.8281.635.52173
28Paros37.00925.1781.617.0737273Velanidi36.44823.1761.667.4408
29Ios36.66425.3751.757.7443374Monemvasia36.76823.0131.526.9374
30Naxos37.11725.5141.817.5438675Kosmas37.03822.7301.496.37308
31Amorgos36.79725.8731.828.3251076Argolida37.43123.4971.616.48286
32Astipalaia36.55926.3541.817.5438577Sofiko37.73722.7941.445.02161
33Rodos35.97627.8401.726.6828578Tripoli37.56222.5041.445.81252
34Kos36.71526.9721.877.7940879Kalamata37.18422.2291.644.95121
35Karapthos (Mesochori)35.71827.1901.848.8961080Kavo Doro38.09924.5561.627.31405
36Milos36.67824.5251.847.1732481Potami37.98924.5461.717.64430
37Sifnos37.15824.5201.587.4944682Stira38.26424.2401.626.64305
38Serifos37.34724.4441.737.3437683Kimi38.55623.9571.76.92322
39Kefalonia (Atheras)38.35220.4021.635.2214584Larimna38.62223.3221.634.98125
40Kefalonia (Ainos)38.14620.6331.555.2115885Karpenisi39.14121.6861.666.35258
41Kerkira39.74719.8561.374.3411486Fourna39.09821.8991.754.7798
42Kithira36.14422.9741.727.8145587Lidoriki38.42122.2691.395.88277
43Lefkada38.57220.5491.745.9619888Thisvi38.36622.7851.685.6173
44Naousa40.61821.9221.694.9111289Mpralos38.79122.2641.725.63169
45Florina40.61421.3601.695.4815990Skyros38.79824.6661.887.13311
Table 3. Annual PV production [44].
PeloponneseCentral GreeceThessaly-EpirusMacedonia
Annual PV production (kWh/kWp)1510155013001360
C.F.17%18%15%15%
Table 4. Data used for LCOE calculation for 2019.
2019
TechnologyLigniteNatural GasPVWind HydroCHPBiomass
Nominal power Pnom (MW)3904 [27]4900 [27] 2639 [27] 3283 [27]3411 [27]105 [27]86.89 [27]
Produced Energy (GWh)10,41816,228324965654052186362
CAPEX (€/kW)1850 [46,47,48] 700 [46,47] 1100 [48,49,50]1300 [47,49,50] 1800 [49,53]1100 [53]2650 [53]
Fixed O&M (€/KW)35 [54]21 [49]22 [49]52 [49,55]18 [49,56]40 [57] 79.5 [58]
Variable O&M (€/MWh)2 [48]2 [49]--2.05 [54]24 [58]
Cost (€/tlignite | €/m3 Natural gas)17.7 [59] 0.3---0.3130 [58,60]
Lower Heating Value (GJ/ tlignite | GJ/ m3 Natural gas)5.3 [59] 0.03---0.0319 [58,61]
Efficiency (%)45% [46]60% [46]---35% [62] 30% [63]
Heat rate (GJ/MWh)8.06.0---10.312.0
Fuel unit cost (€/MWh)2760---10382
CO2 emissions (t/Mwh)1.50.5 [49]-----
CO2 cost (€/t)24 [26] 5-----
Carbon Cost (€/MWh)362.5-----
Life time (years) 30302525503030
CRF0.0810.0810.0860.0860.0720.0810.081
LCOE (€/MWh)133.797.394.581.8127.0161.2156.3
Weighted average LCOE (€/MWh)107.59
Table 5. Data used for LCOE calculation for 2030.
2030
TechnologyNatural GasPVWind PHSHydroCHPBiomass
Nominal power
Pnom (MW)
69708000800015003411125300
Produced Energy (GWh)17,08611,29318,624254552037051692
CAPEX (€/kW)700700 [64,65] 1000 [49]1200 [51]180011002650
Fixed O&M (€/KW)21144018184079.5
Variable O&M (€/MWh)2---2.0523.2
Cost (€/tlignite | €/m3 Natural gas)0.3----0.3130
Lower Heating Value (GJ/ tlignite | GJ/ m3 Natural gas)0.03----0.0319
Efficiency (%)60%----35%30%
Heat rate (GJ/MWh)6.0----10.312.0
Fuel unit cost (€/MWh)60----10382
CO2 emissions (t/Mwh)0.5----0.5-
CO2 cost (€/t)30 [27]----0-
Carbon Cost (€/MWh)15----0-
Life time (years) 30252550503030
CRF0.0810.0860.0860.0720.0720.0810.081
LCOE (€/MWh)108.552.55461.999.4127137.2
Weighted average LCOE (€/MWh)77.86
Table 6. Data used for LCOE calculation for 2050.
2050
TechnologyNatural GasPVWindPHSHydroCHPBiomass
Nominal power
Pnom (MW)
710012,00012,00027003565125600
Produced Energy (GWh)1863816,92425,620533452034021929
CAPEX (€/kW)700500 [64,65] 800 [49]1200180011002650
Fixed O&M (€/KW)21103218184079.5
Variable O&M (€/MWh)2---2.0523.2
Cost (€/tlignite | €/m3 Natural gas)0.3----0.3130
Lower Heating Value (GJ/ tlignite | GJ/ m3 Natural gas)0.03----0.0319
Efficiency (%)60%----35%35%
Heat rate (GJ/MWh)6.0----10.310.3
Fuel unit cost (€/MWh)60----10370
CO2 emissions (t/Mwh)0.5----0.5-
CO2 cost (€/t)88 [27]----0-
Carbon Cost (€/MWh)44----0-
Life time (years) 30252550503030
CRF0.0810.0860.0860.0720.0720.0810.081
LCOE (€/MWh)135.537.547.153.1102.6138.9164.6
Weighted average LCOE (€/MWh)75.06
Publisher’s Note: MDPI stays neutral with regard to jurisdictional claims in published maps and institutional affiliations.

