
A Correlation-Based Sensing Scheme for Outlier Detection in Cognitive Radio Networks

 ,
,  , , ,
, , , 
Abstract
1. Introduction
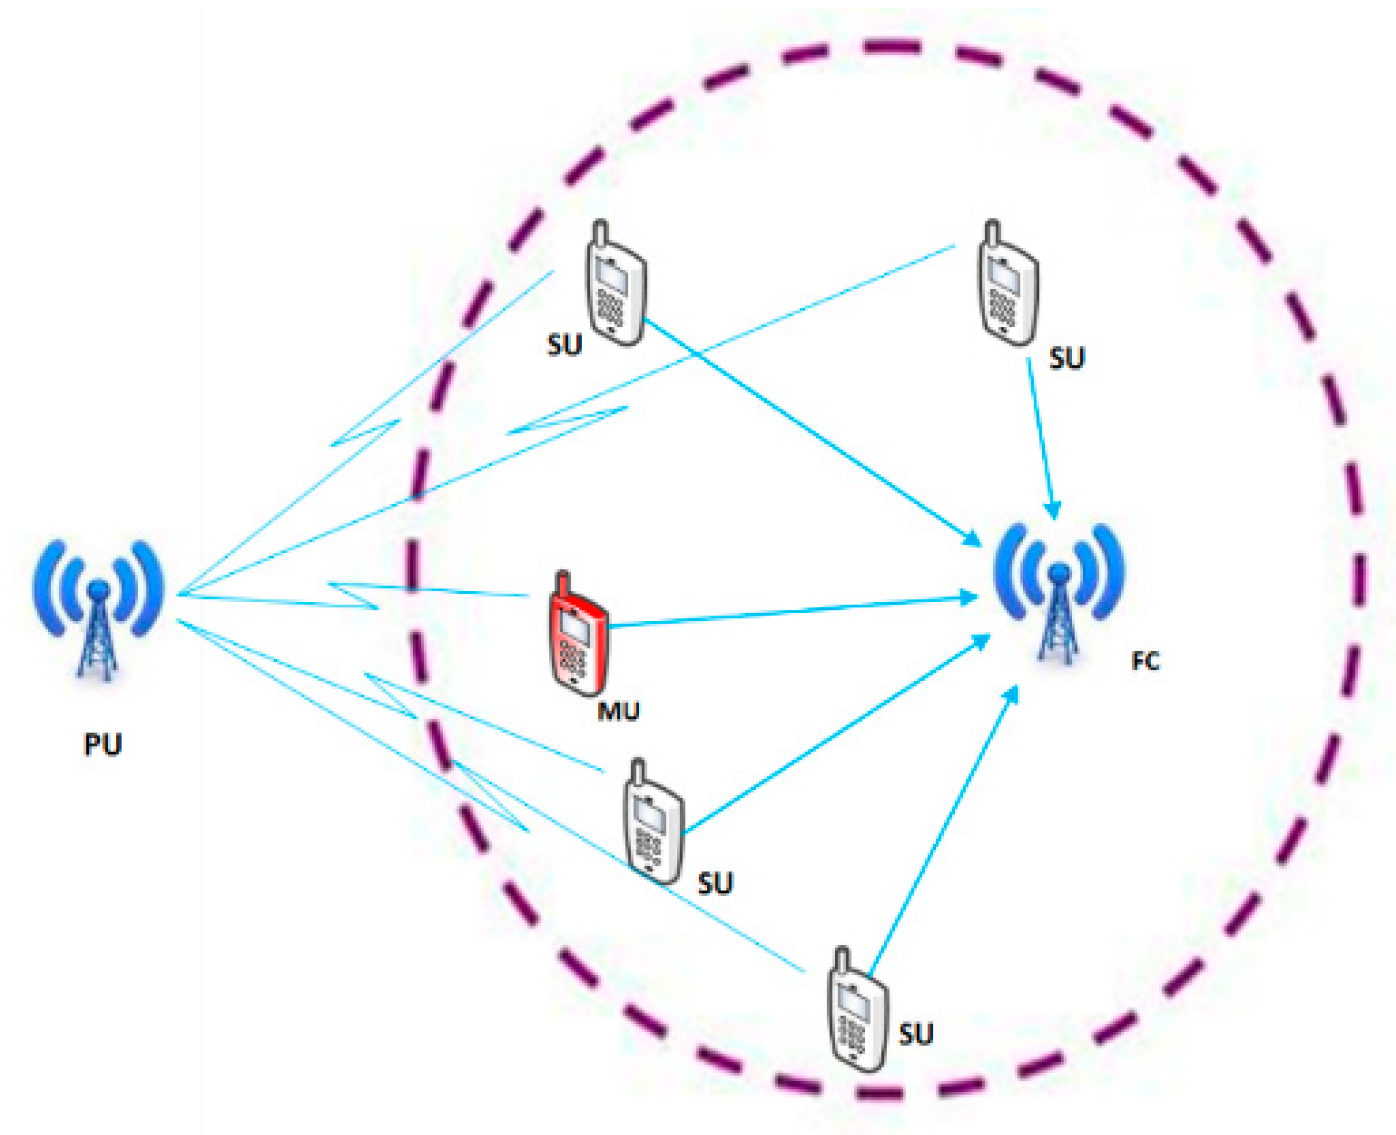
2. System Model
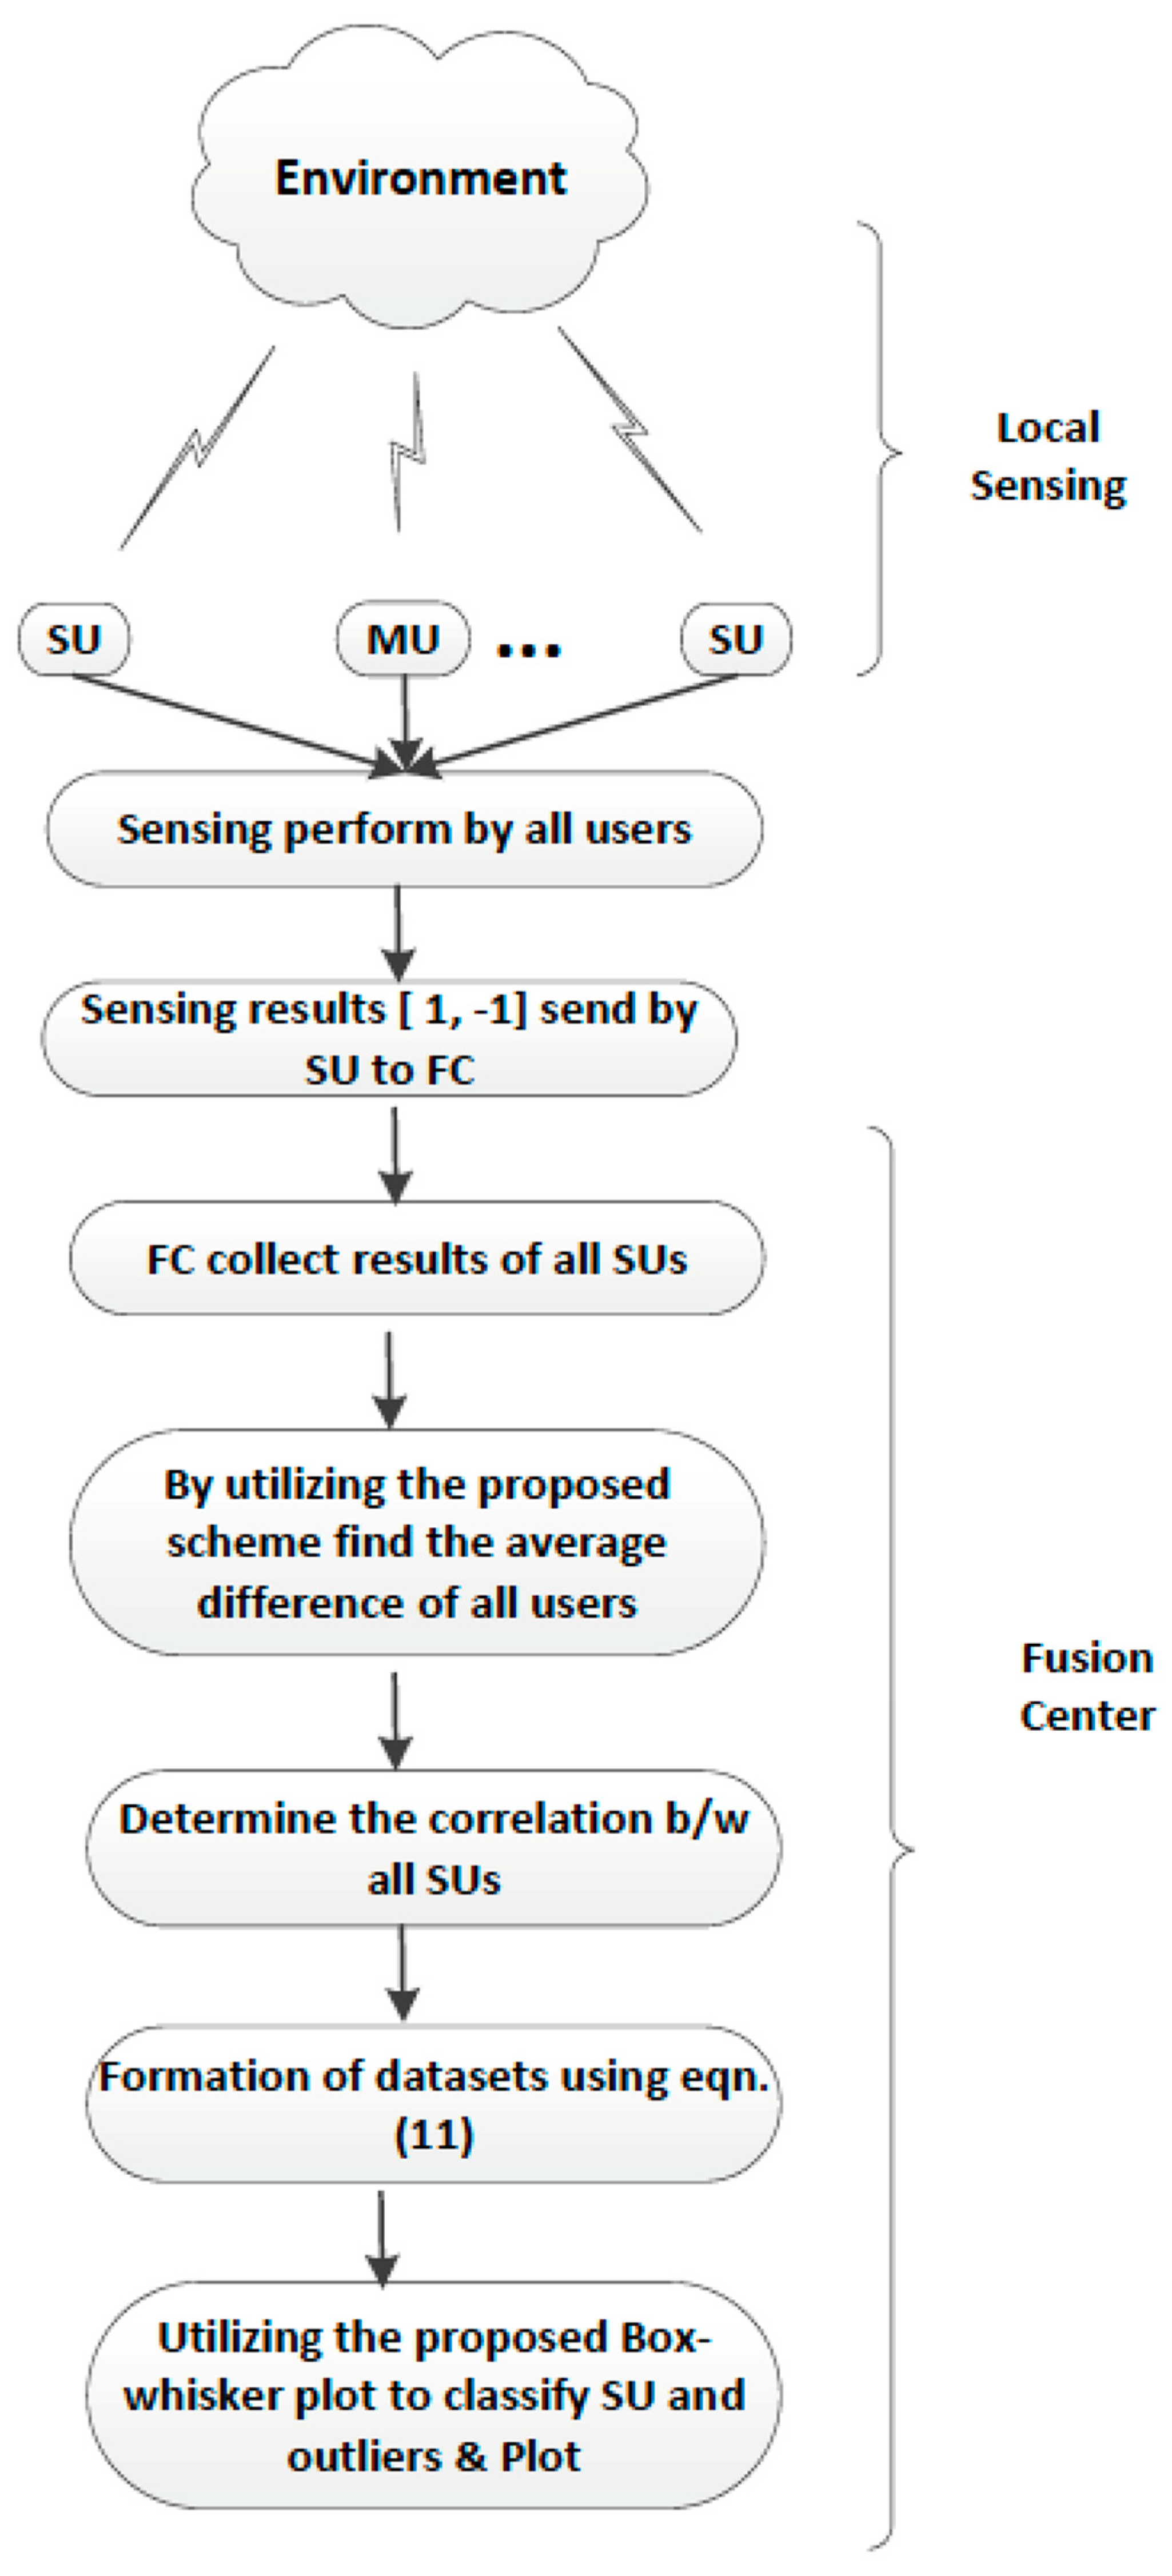
3. Proposed Scheme
3.1. Outlier Detection
3.1.1. Step One: Averaging Differences of the SUs
3.1.2. Step Two: SUs’ Correlation
3.1.3. Step Three: Outlier Classification Using the Box-Whisker Plot
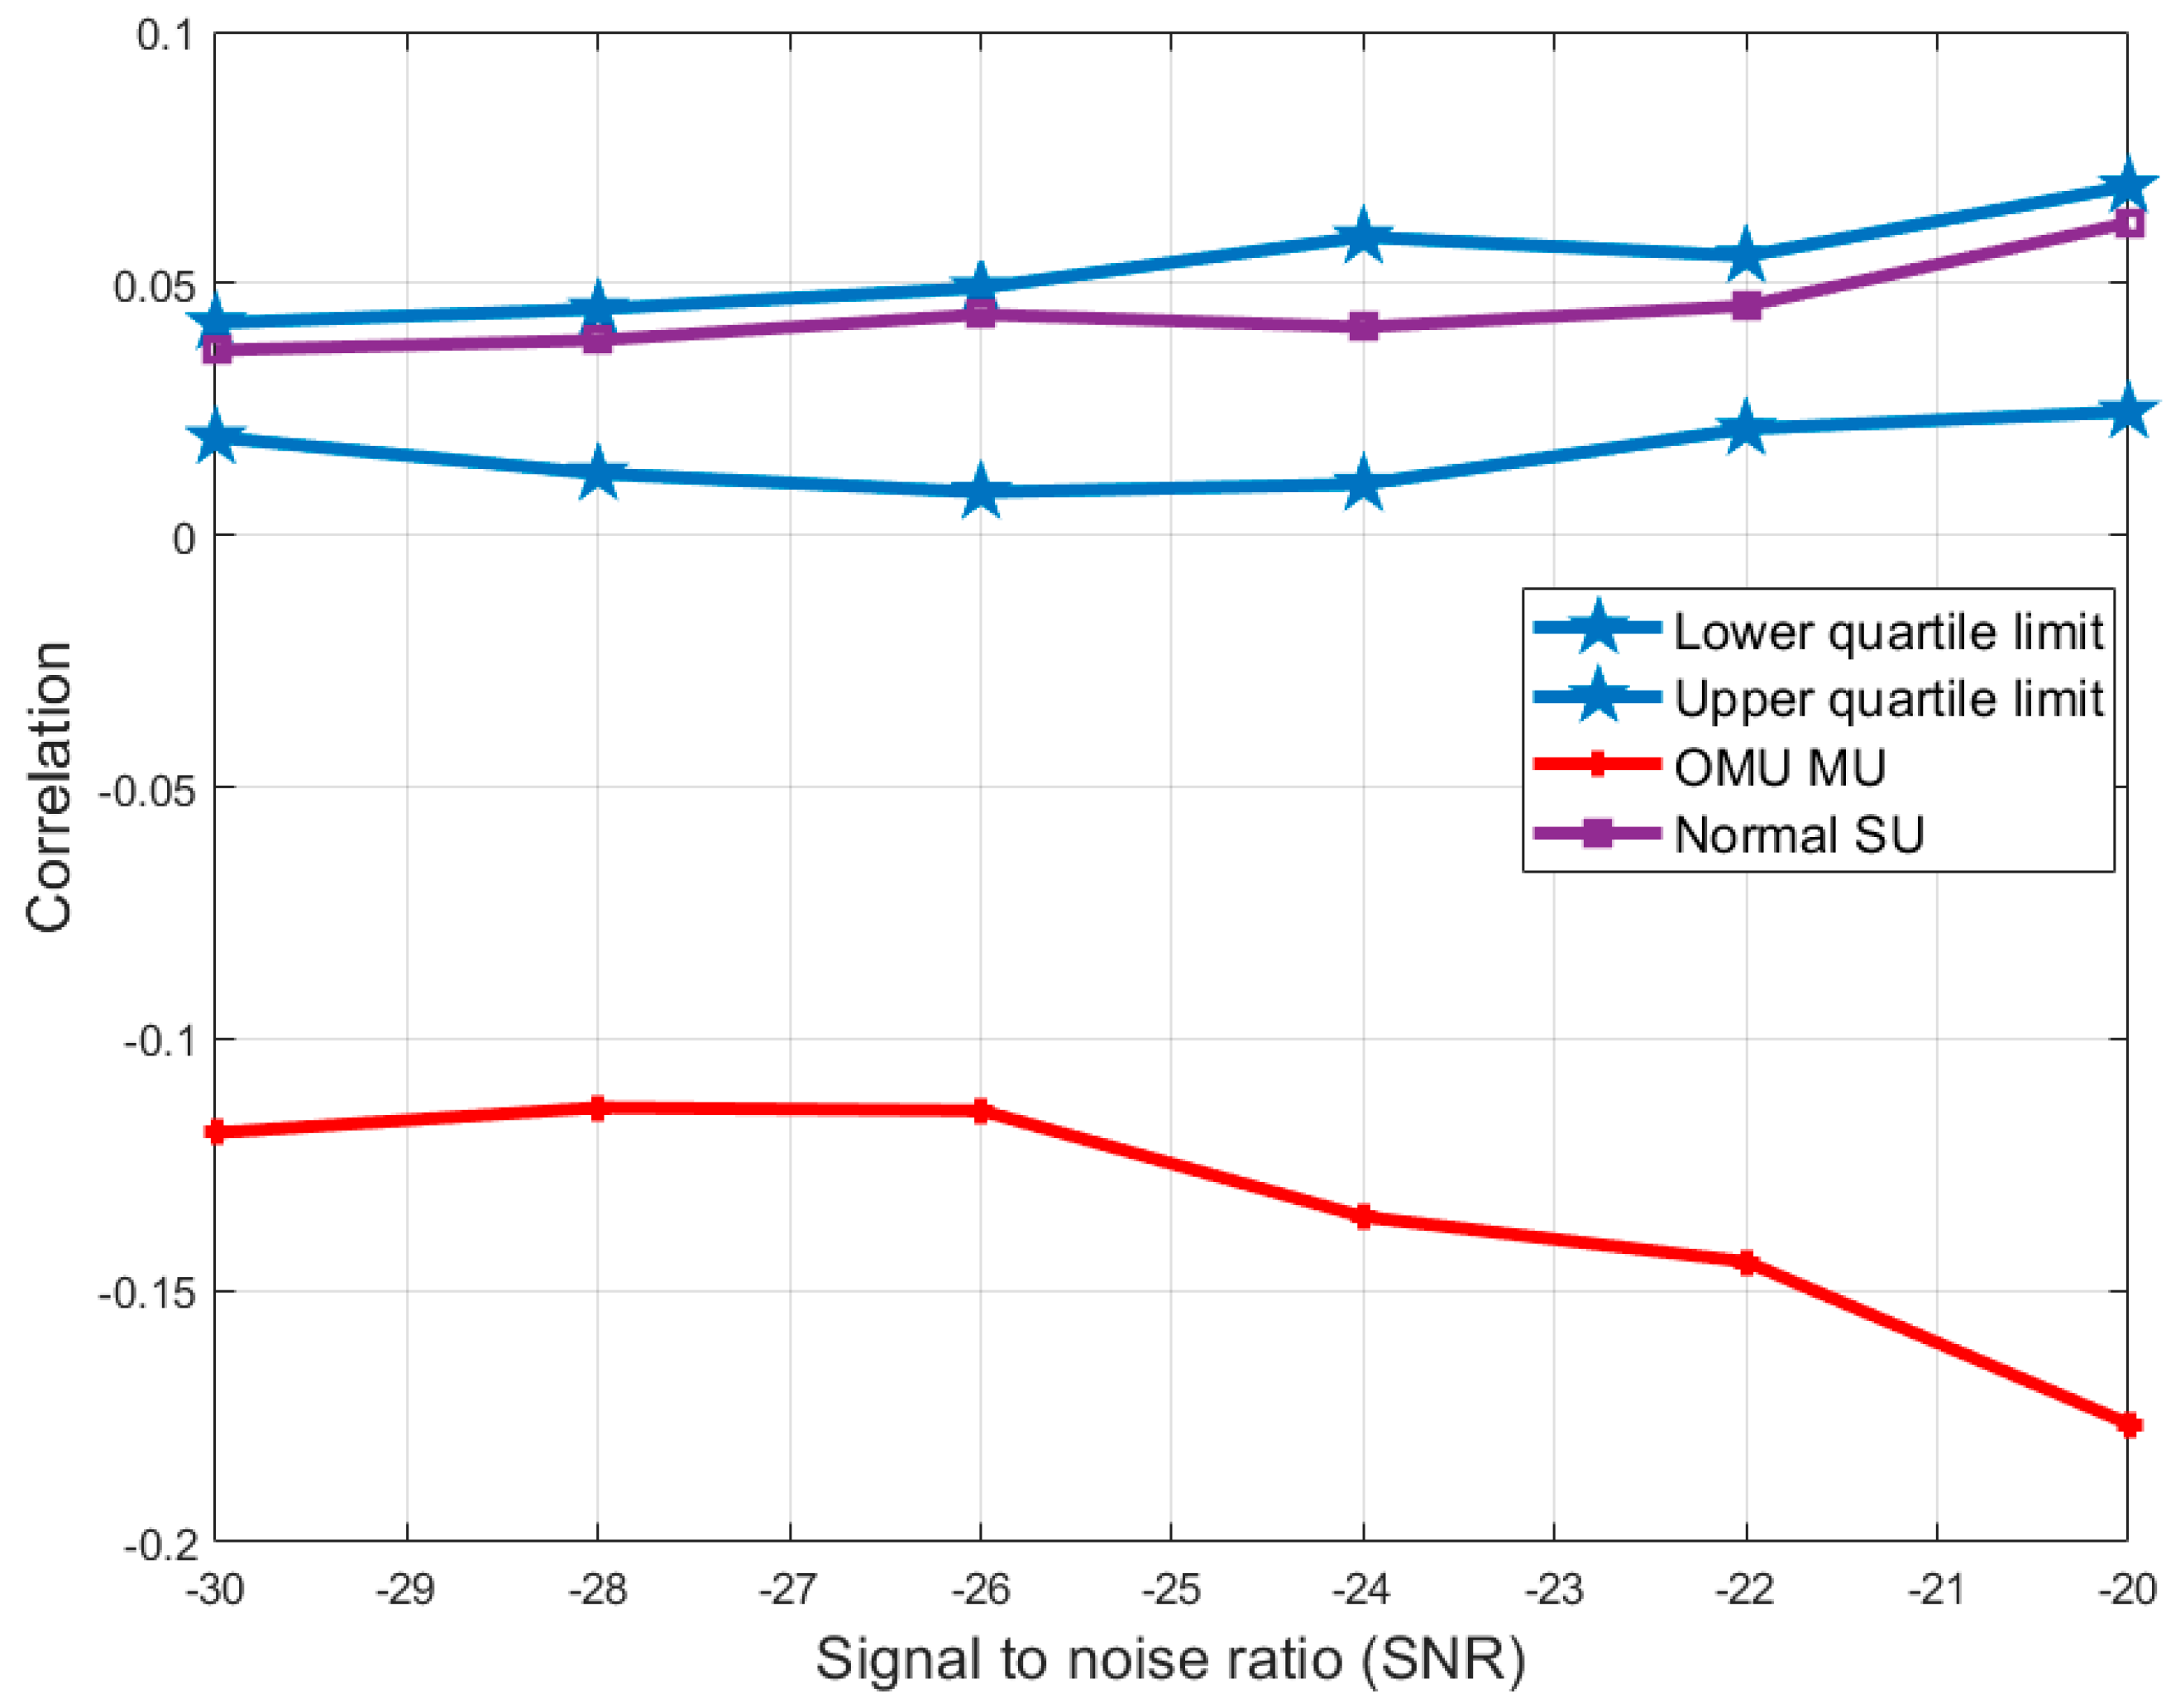
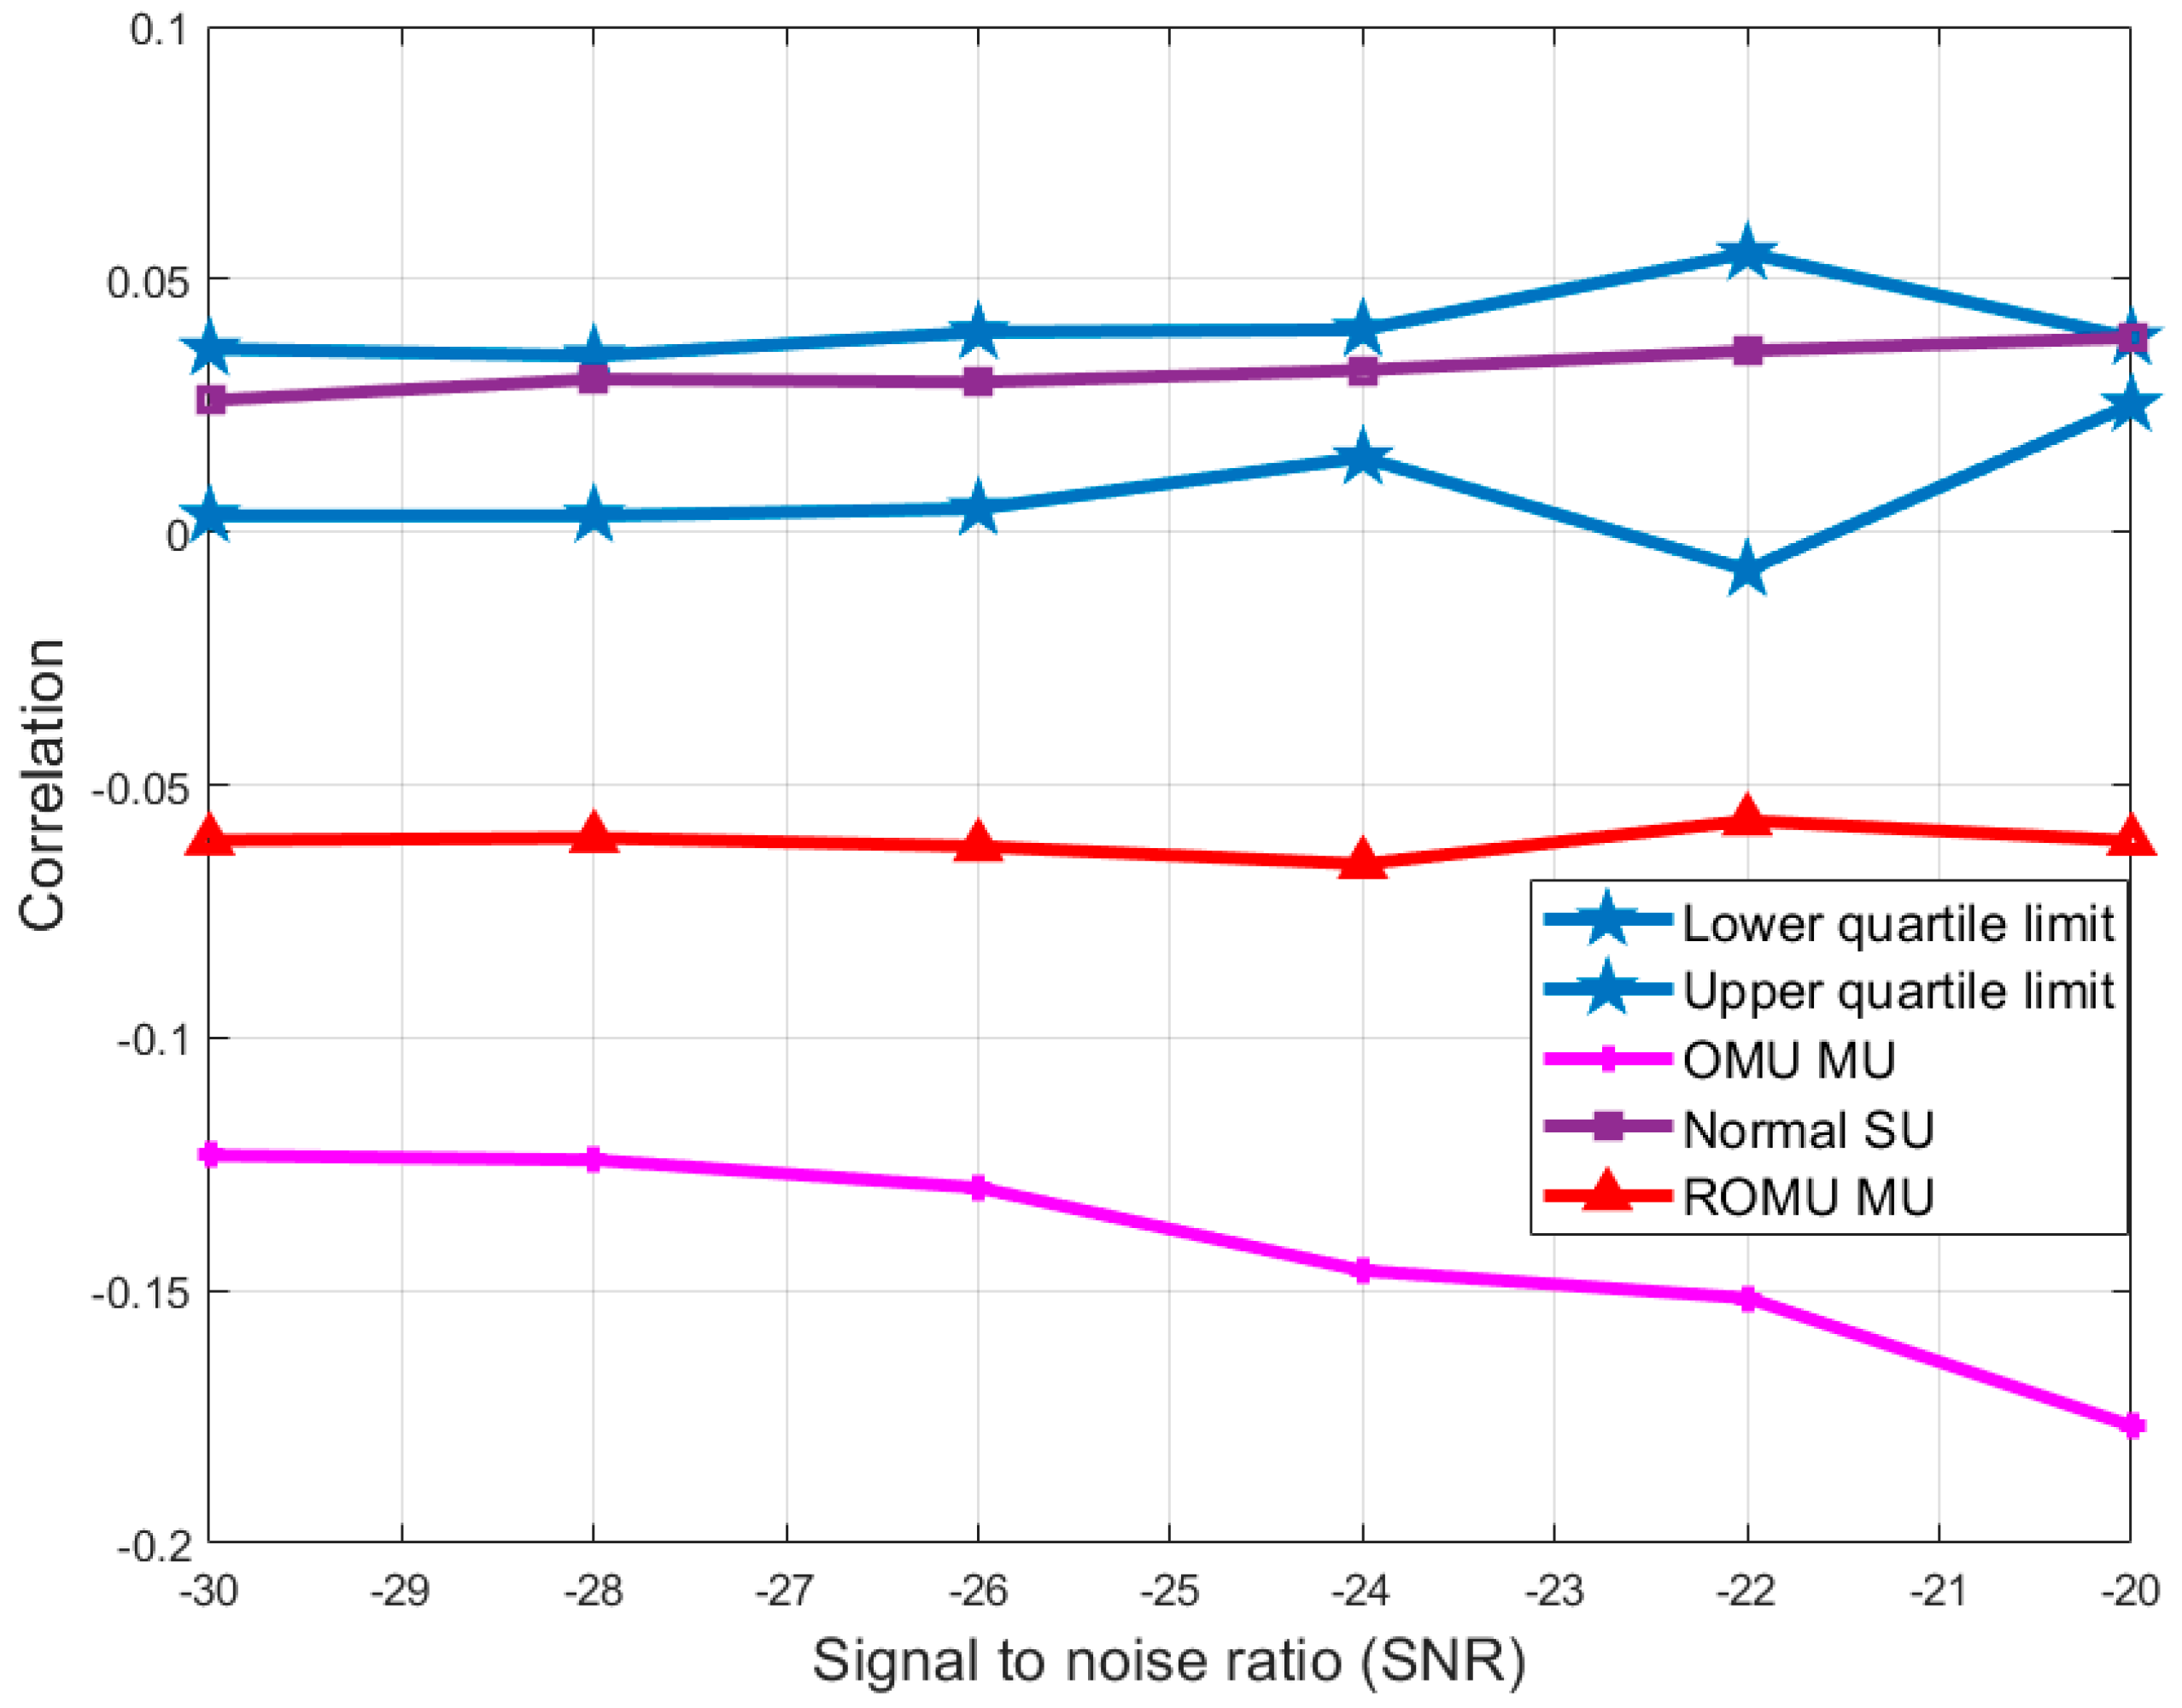
4. Numerical Evaluation
5. Conclusions
Author Contributions
Funding
Data Availability Statement
Acknowledgments
Conflicts of Interest
References
- FCC. Spectrum Policy Task Force (ET Docket no. 02-135); Federal Communications Commission: Washington DC, USA, 2002. [Google Scholar]
- Hayken, S. Cognitive Radio, Brain-Empowered Wireless Communications. IEEE J. Sel. Area Commun. 2005, 23, 201–220. [Google Scholar] [CrossRef]
- Ghasemi, A.; Sousa, E.S. Spectrum Sensing in Cognitive Radio Networks. IEEE Commun. Mag. 2008, 46, 32–39. [Google Scholar] [CrossRef]
- Simon Haykin, D.J.T.; Reed, J.H. Spectrum Sensing for Cognitive Radio. Proc. IEEE 2009, 97, 849–877. [Google Scholar]
- Sahal, A.; Hoven, N.; Tandra, R. Some Fundamental Limits in Cognitive Radio. In Proceedings of the Allerton Conference on Communication, Control, and Computing, Monticello, IL, USA, September 29–October 1 2004. [Google Scholar]
- Kaur, R.; Buttar, A.S.; Jayant, A. Methods of Hybrid Cognitive Radio Network: A Survey. In Proceedings of the Electronics, Communication and Aerospace Technology (ICECA), Coimbatore, India, 29–31 March 2018. [Google Scholar]
- Tandra, A.; Sahai, A. Fundamental Limits on Detection in Low SNR under Noise Uncertainty. In Proceedings of the Wireless Networks Communication and Mobile Computing, Maui, HI, USA, 13–16 June 2005. [Google Scholar]
- Cabric, D.; Mishra, S.M.; Brodersen, R.W. Implementation Issues in Spectrum Sensing for Cognitive Radios. In Proceedings of the 38th Asilomar Conference on Signals, Systems and Computers, Pacific Grove, CA, USA, 7–10 November 2004; pp. 772–776. [Google Scholar]
- Letaief, K.B.; Zhang, W. Cooperative Communications for Cognitive Radio Networks. Proc. IEEE 2009, 97, 878–893. [Google Scholar] [CrossRef]
- Mishra, S.M.; Sahai, A.; Bridersen, R.W. Cooperative Sensing Among Cognitive Radios. In Proceedings of the Conference CC’06, 2006 International Conference on Communications, Istanbul, Turkey, 11–15 June 2006; pp. 1658–1663. [Google Scholar]
- Peh, E.; Liang, Y.C. Optimization for Cooperative Sensing in Cognitive Radio Networks. In Proceedings of the Wireless Communication and Wireless Network, Hong Kong, China, 11–15 March 2007; pp. 27–32. [Google Scholar]
- Muhammad, S.K.; Noor, G.; Junsu, K.; Ijaz, M.Q.; Su Min, K. A Genetic Algorithm Based Soft Decision Fusion Scheme in Cognitive IoT Networks with Malicious Users. Wirel. Commun. Mob. Comput. 2020, 2020, 2509081. [Google Scholar]
- Marinho, J.; Granjal, J.; Monterio, E. A Survey on Security Attacks and Counter Measures with Primary User Detection in Cognitive Radio Networks. EURASIP J. Inf. Secur. 2015, 15, 4. [Google Scholar] [CrossRef]
- Muhammad, S.K.; Jibran, M.; Insoo, K.; Su Min, K.; Junsu, K. A Double Adaptive Approach to Tackle Malicious Users in Cognitive Radio Networks. Wirel. Commun. Mob. Comput. 2019, 2019, 2350694. [Google Scholar]
- Sarala, B.; Devi, S.R.; Suganthy, M.; Ida, S.J. A Novel Authentication Mechanism for Cognitive Radio Networks. Int. J. Recent Technol. Eng. 2019, 8, 713–718. [Google Scholar]
- Wan, R.; Ding, L.; Xiong, N.; Zhou, X. Mitigation Strategy against Spectrum Sensing Data Falsification Attack in Cognitive Radio Sensor Networks. Int. J. Distrib. Sens. Netw. 2019, 9, 1–12. [Google Scholar] [CrossRef]
- Farmani, F.; Jannatabad, M.A.; Berangi, R. Detection of SSDF Attack using SVDD Algorithm in Cognitive Radio Networks. In Proceedings of the 2011 Third International Conference on Computational Intelligence, Communication Systems and Networks, Bali, Indonesia, 26–28 July 2011. [Google Scholar]
- Liu, S.Q.; Hu, B.J. Analysis of Sensing Efficiency for Cooperative Spectrum Sensing with Malicious Users in Cognitive Radio Networks. IEEE Commun. Lett. 2014, 18, 1645–1648. [Google Scholar] [CrossRef]
- Lavanis, N. Improving Detection of Primary User in Cognitive Radio Networks with Malicious User. In Proceedings of the Wireless Communication, Signal Processing and Networking (WiSPNET), Chennai, India, 23–25 March 2016. [Google Scholar]
- Pei, Q.; Li, H.; Liu, X. Neighbor Detection-Based Spectrum Sensing Algorithm in Distributed Cognitive Radio Network. Chin. J. Electron. 2017, 26, 399–406. [Google Scholar] [CrossRef]
- Ngomane, I.; Velempini, M.; Dlamini, S.V. The Detection of Spectrum Sensing Data Falsification Attacks in Cognitive Radio Ad hoc Networks. In Proceedings of the Information Communication Technology and Society (ICTAS), Durban, South Africa, 8–9 March 2018. [Google Scholar]
- Ngomane, I.; Velempini, M.; Dlamini, S.V. Trust Based System to Defend Against the Spectrum Sensing Data Falsification Attack in Cognitive Radio Ad hoc Network. In Proceedings of the Advances in Big Data, Computing and Data Communication Systems (icABCD), Durban, South Africa, 6–7 August 2018. [Google Scholar]
- Ngomane, I.; Velempini, M.; Dlamini, S.V. The Design of a Defense Mechanism to Mitigate the Spectrum Sensing Data Falsification Attack in Cognitive Radio Ad hoc Network. In Proceedings of the Advances in Computing and Communication Engineering (ICACCE), Durban, South Africa, 8–29 November 2016. [Google Scholar]
- Nath, S.; Marchang, N.; Taggu, A. Mitigating SSDF Attack using K-Mediods Clustering in Cognitive Radio Networks. In Proceedings of the Wireless and Mobile Computing, Networking and Communication (WiMob), Abu Dhabi, United Arab Emirates, 19–21 October 2015. [Google Scholar]
- Sabuj, S.R.; Hamanura, M.; Kuwamura, S. Detection of Malicious User in Cognitive Radio Network by using Friend or Foe (FOF) Detection Technique. In Proceedings of the Telecommunication Network and Application Conference (ITNAC), Sydney, Australia, 18–20 November 2015. [Google Scholar]
- Aisha, A.U.; Qadir, J.; Baig, A. Mitigating the Effect of Malicious Users in Cognitive Radio Networks. In Proceedings of the 11th Frontier of Information Technology, Islamabad, Pakistan, 16–18 December 2013. [Google Scholar]
- Wu, H.; Sun, X.; Guo, C.; Ren, S. Malicious User Detection for Wide-Band Cognitive Radio Network. In Proceedings of the Asia Pacific Microwave Conference (APMC), New Delhi, India, 5–9 December 2016. [Google Scholar]
- Noor, G.; Muhammad, S.K.; Junsu, K.; Su Min, K. Robust Spectrum Sensing via Double Sided Neighbor Distance Based Genetic Algorithm in Cognitive Radio Networks. Mob. Inf. Syst. 2020, 2020, 8876824. [Google Scholar]
- Althunibat, S.; Denise, B.J.; Granelli, F. Identification and Punishment Policies for Spectrum Sensing Data Falsification Attacker Using Delivery-Based Assessment. Trans. Veh. Technol. 2016, 65, 7308–7321. [Google Scholar] [CrossRef]
- Arshad, A.; Muhammad, S.K.; Noor, G.; Irfan, U.; Su Min, K.; Junsu, K. A Comparative Analysis of Different Outlier Detection Techniques in Cognitive Radio Networks with Malicious Users. Wirel. Commun. Mob. Comput. 2020, 2020, 8832191. [Google Scholar]
- Kalamkar, S.S.; Singh, P.K.; Banerjee, A. Block Outlier Methods for Malicious User Detection in Cooperative Spectrum Sensing. In Proceedings of the 79th Vehicular Technology Conference (VTC Spring), Seoul, Korea, 18–21 May 2014. [Google Scholar]
- Zeng, K.; Pawelczak, P.; Cabric, D. Reputation Based Cooperative Spectrum Sensing with Trusted Node Assistance. Commun. Lett. 2008, 14, 226–228. [Google Scholar] [CrossRef]
- Vu Van Hiep, I.K. A Sequential Cooperative Spectrum Sensing Scheme Based on Cognitive User Reputation. Trans. Consum. Electron. 2012, 58, 1147–1152. [Google Scholar] [CrossRef]
- Sajjad, K.M.; Insoo, K. Mitigation Adverse Effect of Malicious User on Cooperative Spectrum Sensing by Using Hausdorff Distance in Cognitive Radio Networks. J. Inf. Commun. Converg. Eng. 2015, 13, 74–80. [Google Scholar]
- Penna, F.; Sun, Y.; Dolecek, L.; Cabric, D. Detecting and Couter-Acting Statistical Attacks in Cooperative Spectrum Sensing. Trans. Signal Process 2012, 60, 1806–1822. [Google Scholar] [CrossRef]


| Parameters | Values |
|---|---|
| Number of SUs | 10 |
| Number of OMUs | 1 |
| Number of ROMUs | 1 |
| Signal-to-noise ratio (SNR) [dB] | −30 to −20 |
| Number of iteration | 10,000 |
| Samples in each sensing interval | 270 |
| Sensing time | 1 ms |
| SNR (dB) | Min | Q1 | Median | Q3 | Max | IQR | Lower Limit | Upper Limit |
|---|---|---|---|---|---|---|---|---|
| −30 | −0.11872 | 0.027923 | 0.029733 | 0.033575 | 0.036673 | 0.005652 | 0.019445 | 0.042053 |
| −28 | −0.11368 | 0.024431 | 0.029003 | 0.032603 | 0.038683 | 0.008172 | 0.012172 | 0.044861 |
| −26 | −0.1143 | 0.023746 | 0.026274 | 0.033884 | 0.043767 | 0.010139 | 0.008538 | 0.049092 |
| −24 | −0.13541 | 0.028492 | 0.035867 | 0.040777 | 0.041255 | 0.012285 | 0.010063 | 0.059205 |
| −22 | −0.14429 | 0.03397 | 0.040021 | 0.042547 | 0.045457 | 0.008577 | 0.021104 | 0.055413 |
| −20 | −0.17651 | 0.04133 | 0.048643 | 0.052537 | 0.061966 | 0.011206 | 0.024521 | 0.069346 |
| SNR (dB) | Min | Q1 | Median | Q3 | Max | IQR | Lower Limit | Upper Limit |
|---|---|---|---|---|---|---|---|---|
| −30 | −0.04204 | 0.004687 | 0.00771 | 0.013285 | 0.020143 | 0.008598 | −0.00821 | 0.026181 |
| −28 | −0.04186 | 0.006307 | 0.009428 | 0.011756 | 0.016341 | 0.005449 | −0.00187 | 0.019929 |
| −26 | −0.05041 | 0.003967 | 0.010962 | 0.01545 | 0.021564 | 0.011483 | −0.01326 | 0.032674 |
| −24 | −0.0499 | 0.01026 | 0.01173 | 0.013742 | 0.018565 | 0.003482 | 0.005036 | 0.018966 |
| −22 | −0.05722 | 0.007603 | 0.013448 | 0.017124 | 0.022818 | 0.009521 | −0.00668 | 0.031406 |
| −20 | −0.06726 | 0.009589 | 0.017555 | 0.019618 | 0.021469 | 0.010028 | −0.00545 | 0.03466 |
| SNR (dB) | Min | Q1 | Median | Q3 | Max | IQR | Lower Limit | Upper Limit |
|---|---|---|---|---|---|---|---|---|
| −30 | −0.1233 | 0.01559183 | 0.02097 | 0.023847249 | 0.025981888 | 0.008255 | 0.003209 | 0.03623 |
| −28 | −0.12418 | 0.01502566 | 0.02049 | 0.022928377 | 0.03319715 | 0.007903 | 0.003172 | 0.034782 |
| −26 | −0.12967 | 0.01767262 | 0.02225 | 0.0264105 | 0.029608583 | 0.008738 | 0.004566 | 0.039517 |
| −24 | −0.14605 | 0.02419445 | 0.02566 | 0.030521757 | 0.031995221 | 0.006327 | 0.014703 | 0.040013 |
| −22 | −0.15155 | 0.01600466 | 0.02709 | 0.031661185 | 0.035777566 | 0.015657 | −0.00748 | 0.055146 |
| −20 | −0.1768 | 0.0300924 | 0.03288 | 0.033382178 | 0.038434105 | 0.00329 | 0.025158 | 0.038317 |
Publisher’s Note: MDPI stays neutral with regard to jurisdictional claims in published maps and institutional affiliations. |
© 2021 by the authors. Licensee MDPI, Basel, Switzerland. This article is an open access article distributed under the terms and conditions of the Creative Commons Attribution (CC BY) license (http://creativecommons.org/licenses/by/4.0/).
Share and Cite
Khan, M.S.; Faisal, M.; Kim, S.M.; Ahmed, S.; St-Hilaire, M.; Kim, J. A Correlation-Based Sensing Scheme for Outlier Detection in Cognitive Radio Networks. Appl. Sci. 2021, 11, 2362. https://doi.org/10.3390/app11052362
Khan MS, Faisal M, Kim SM, Ahmed S, St-Hilaire M, Kim J. A Correlation-Based Sensing Scheme for Outlier Detection in Cognitive Radio Networks. Applied Sciences. 2021; 11(5):2362. https://doi.org/10.3390/app11052362
Chicago/Turabian StyleKhan, Muhammad Sajjad, Mohammad Faisal, Su Min Kim, Saeed Ahmed, Marc St-Hilaire, and Junsu Kim. 2021. "A Correlation-Based Sensing Scheme for Outlier Detection in Cognitive Radio Networks" Applied Sciences 11, no. 5: 2362. https://doi.org/10.3390/app11052362
APA StyleKhan, M. S., Faisal, M., Kim, S. M., Ahmed, S., St-Hilaire, M., & Kim, J. (2021). A Correlation-Based Sensing Scheme for Outlier Detection in Cognitive Radio Networks. Applied Sciences, 11(5), 2362. https://doi.org/10.3390/app11052362