
Experimental Evaluation of the Durability of Concrete Repair Materials


Abstract
1. Introduction
2. Materials and Methods
2.1. Concrete Mixture Proportions
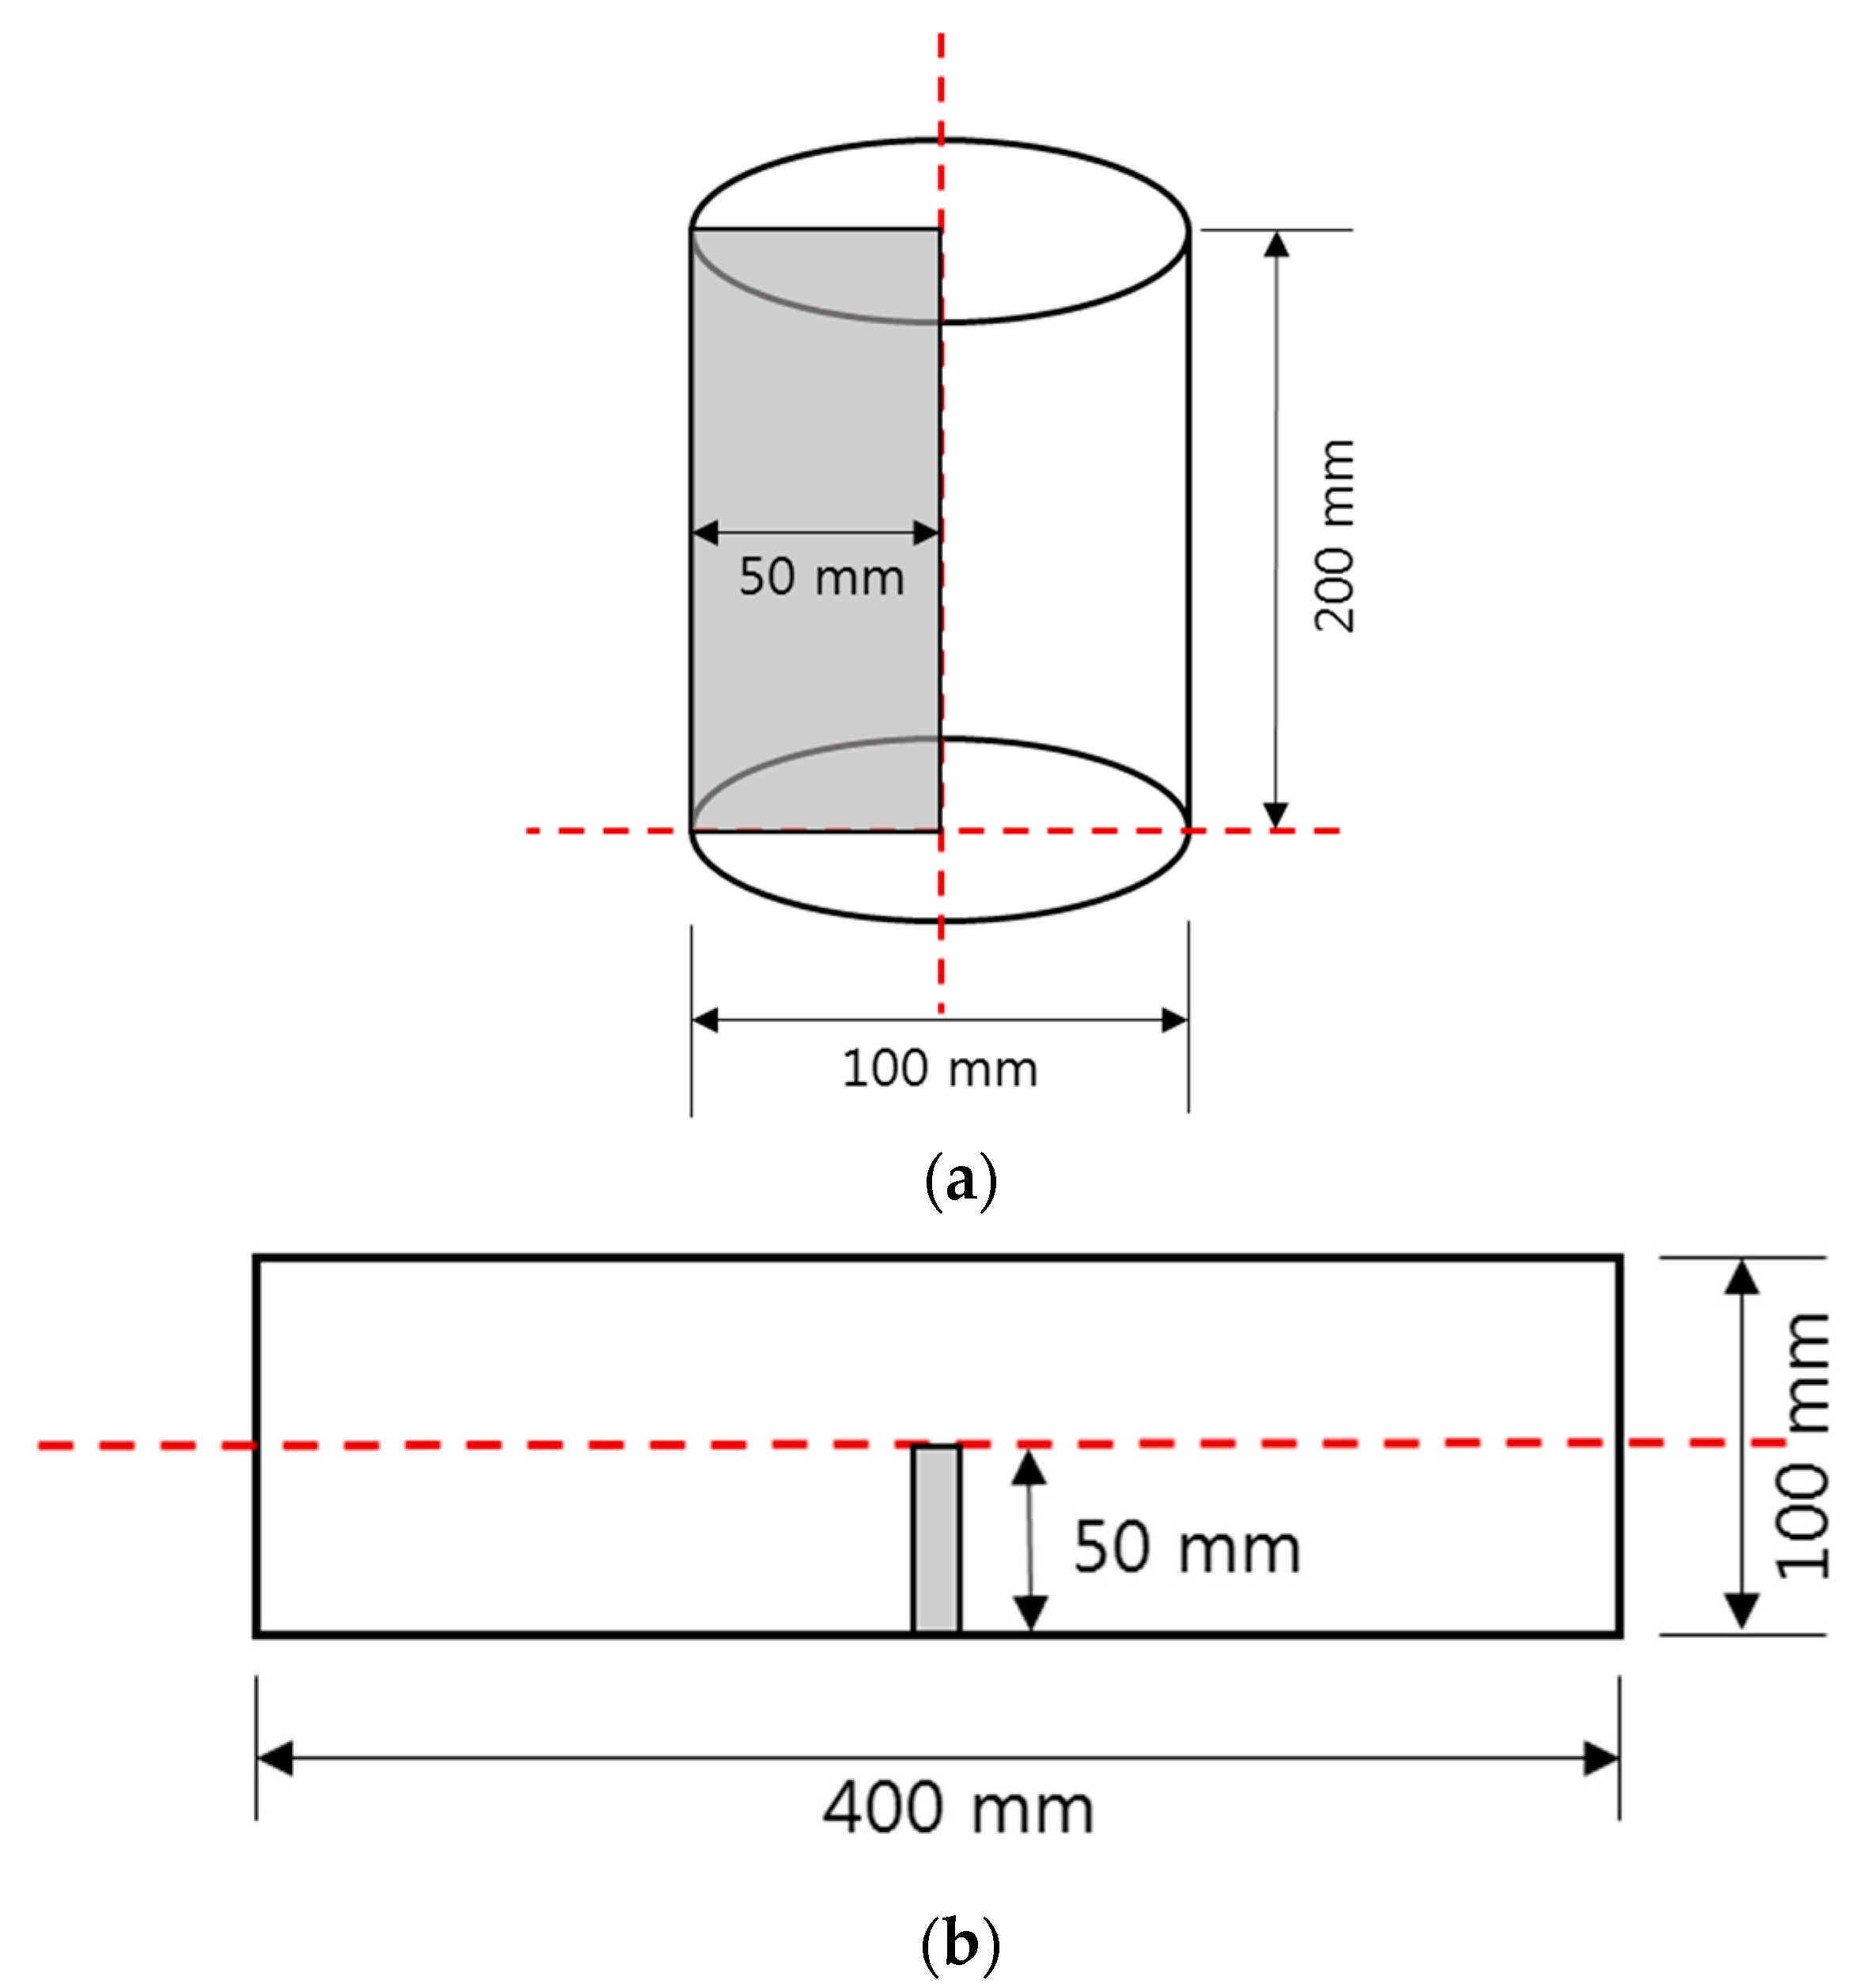
2.2. Test Specimens
2.3. Compressive and Flexural Strength Tests
2.4. Accelerated Carbonation Test
2.5. Chloride Tests
2.6. Freeze–Thaw Test
3. Results and Discussion
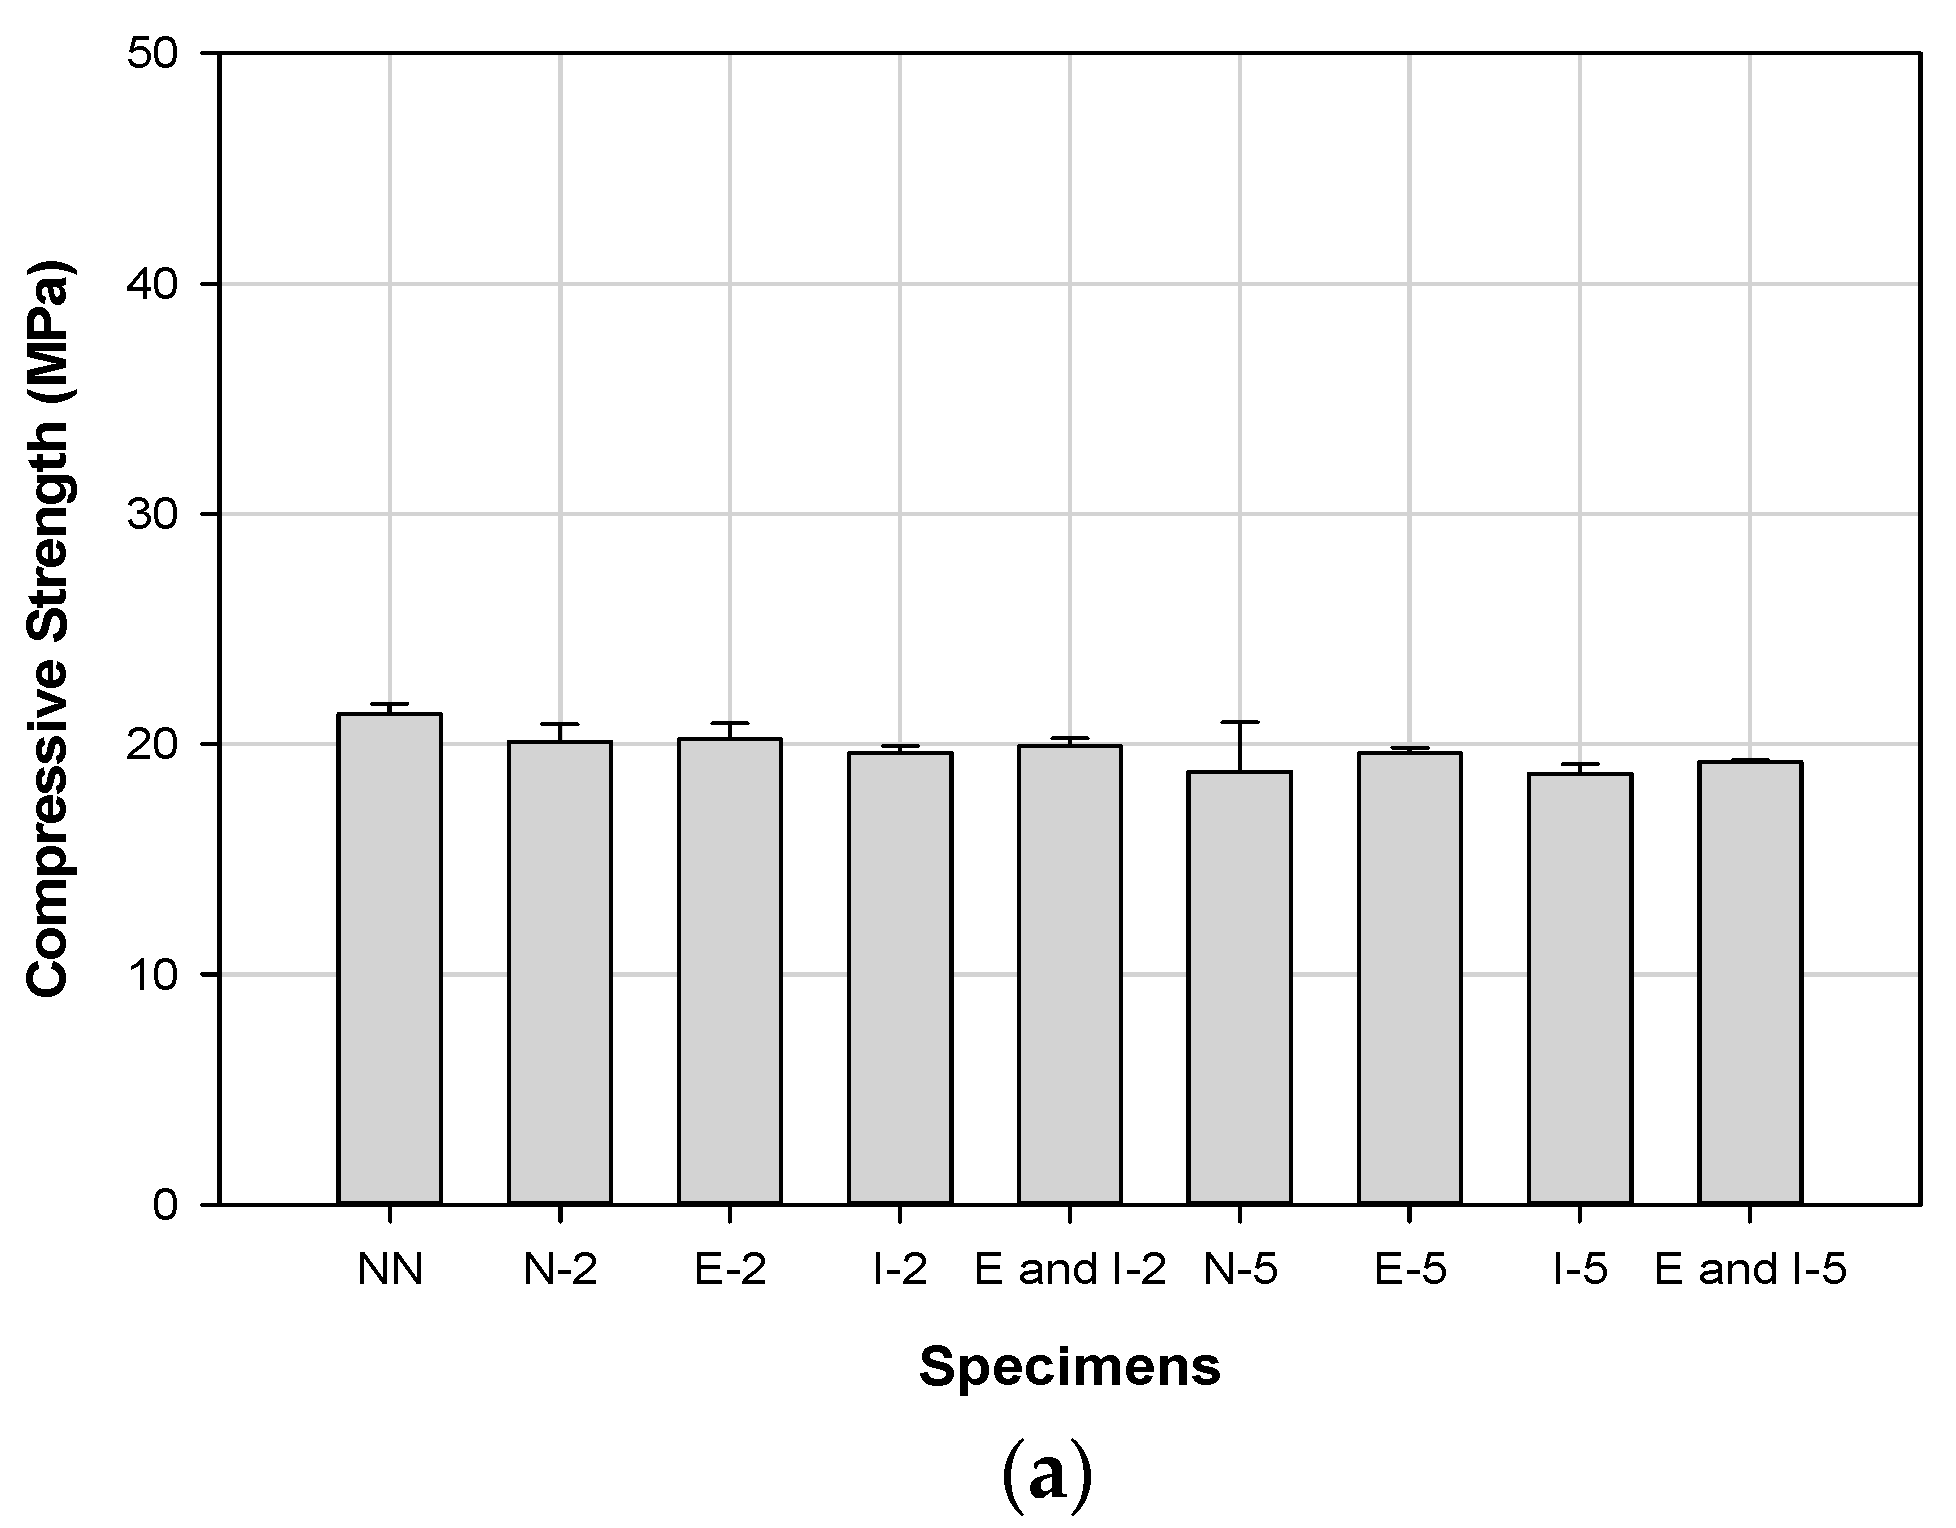
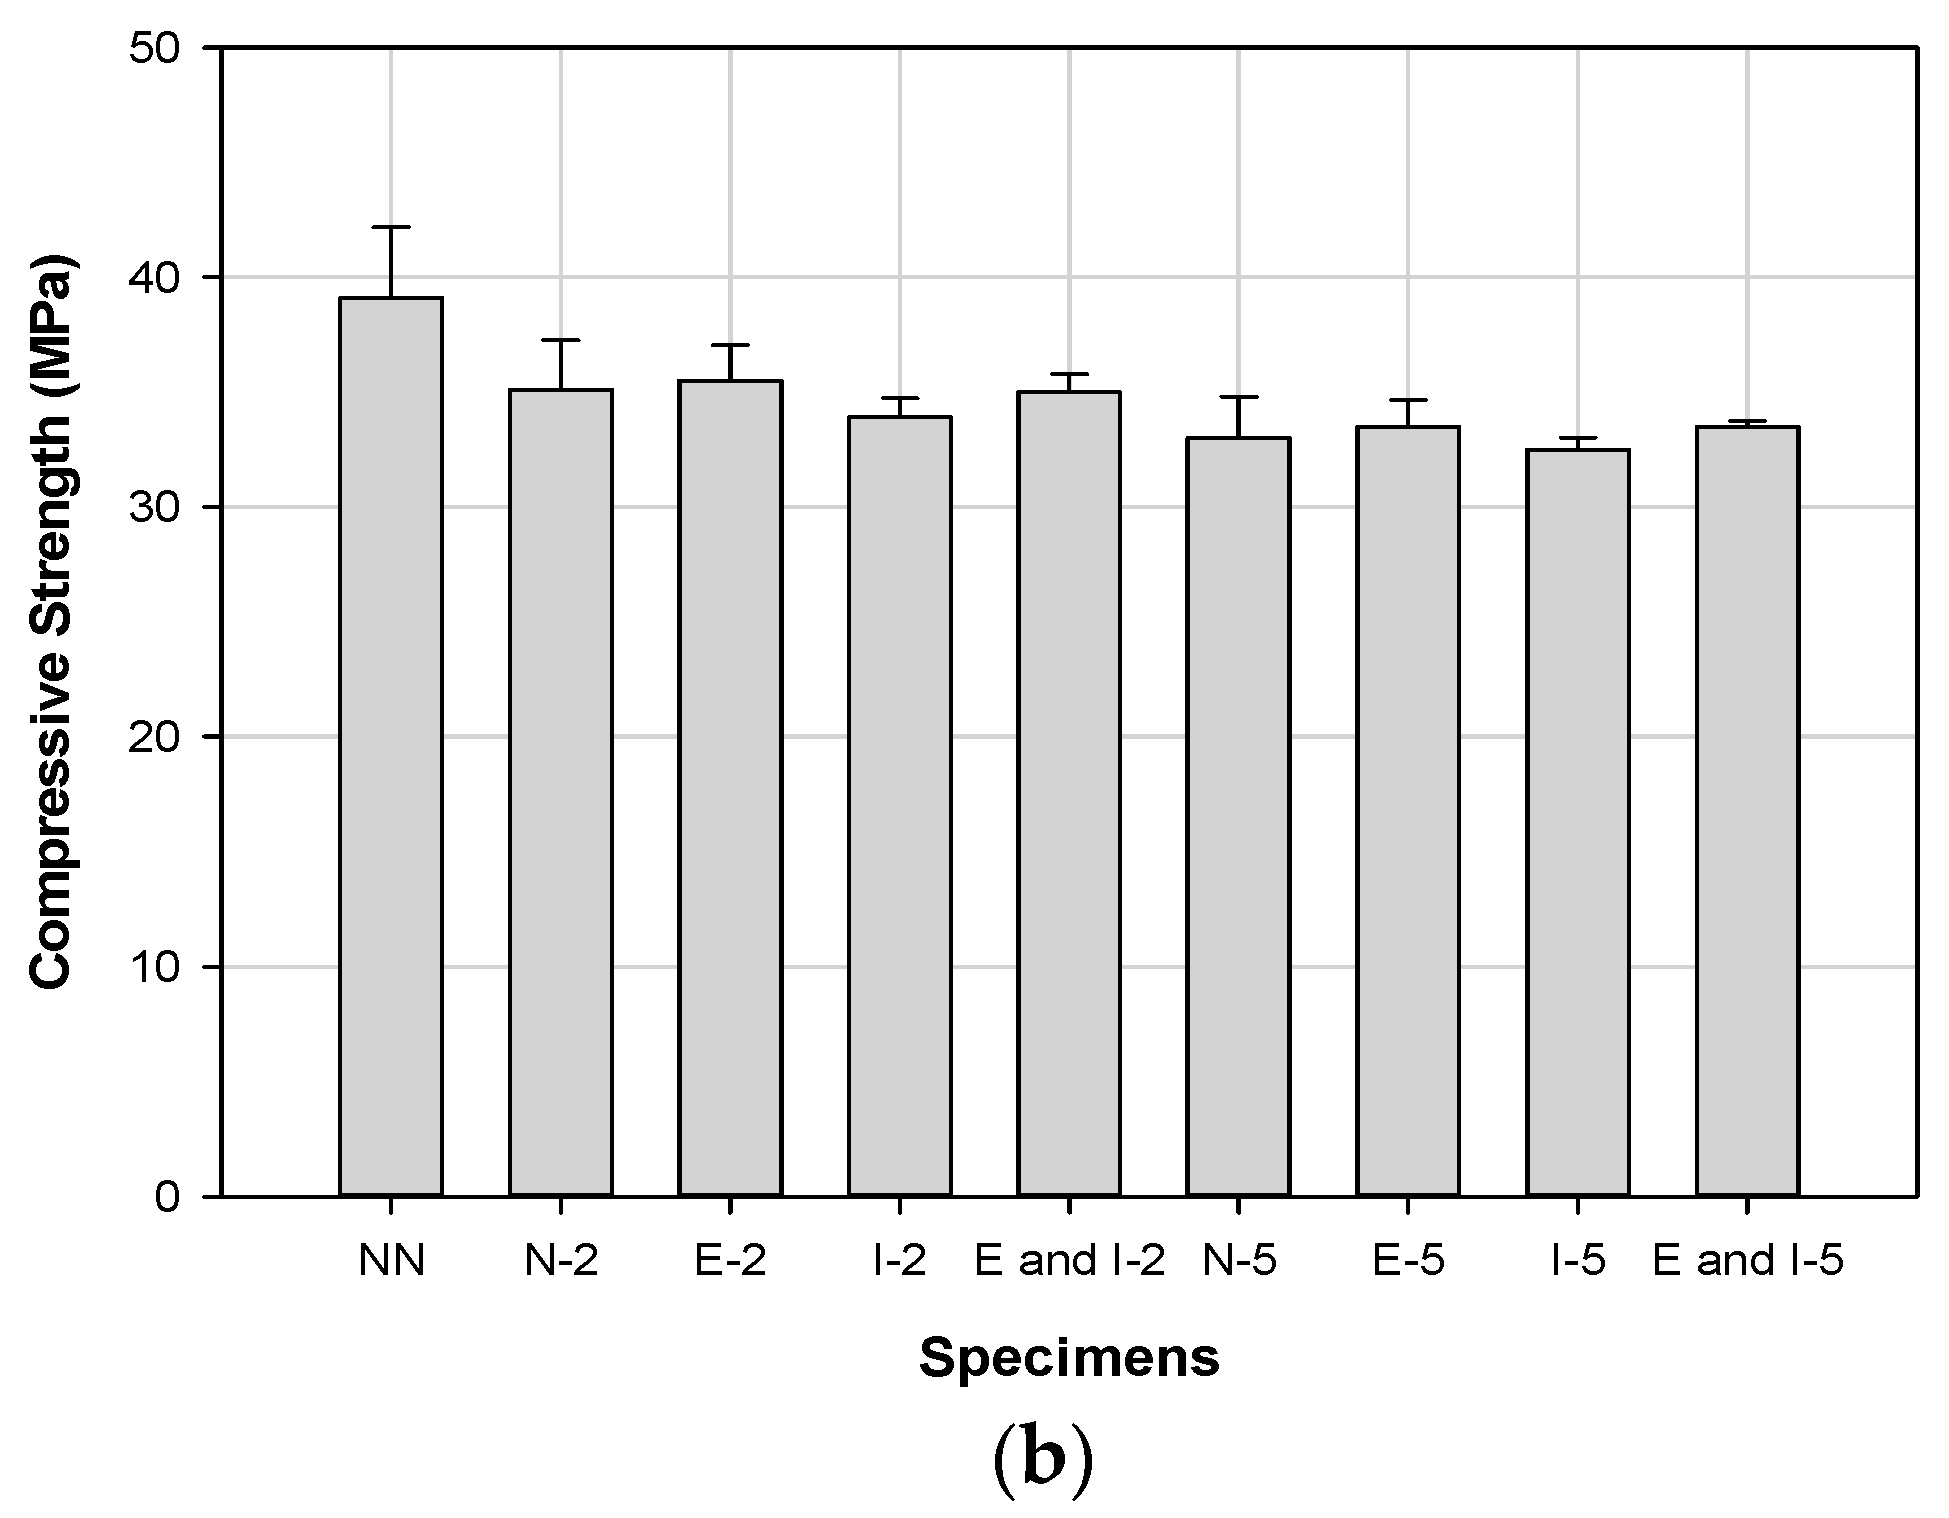
3.1. Compressive and Flexural Strength
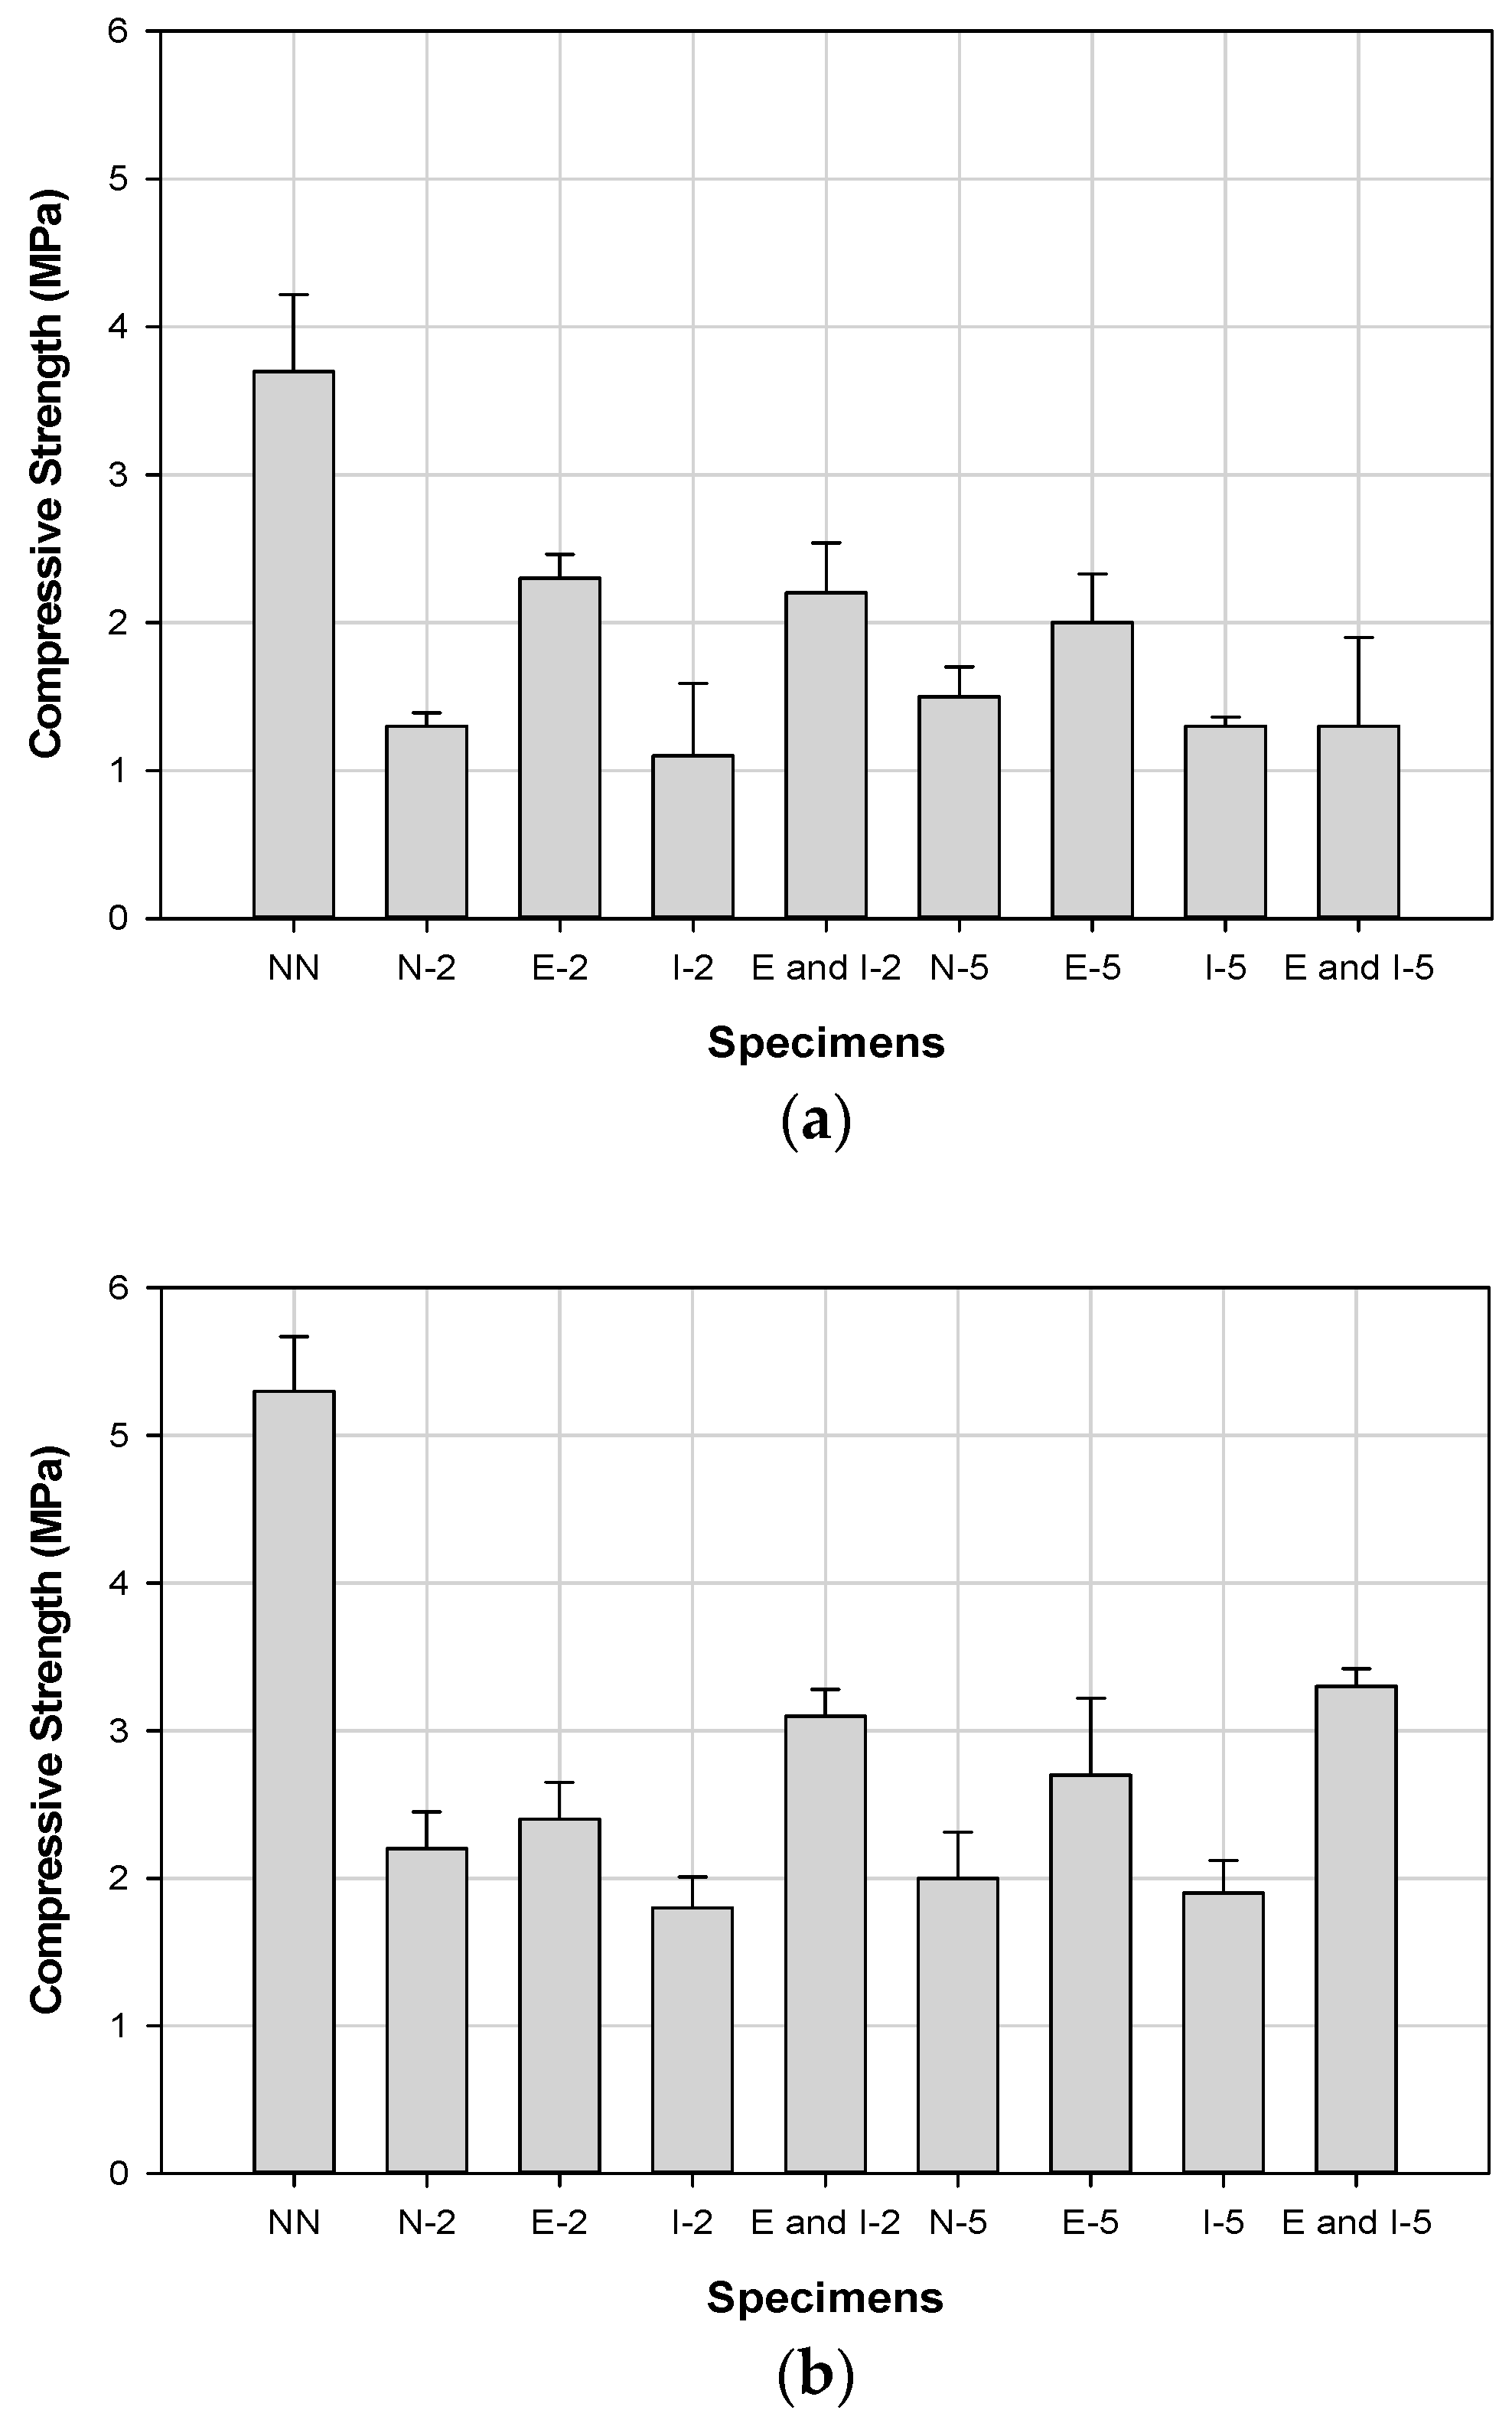
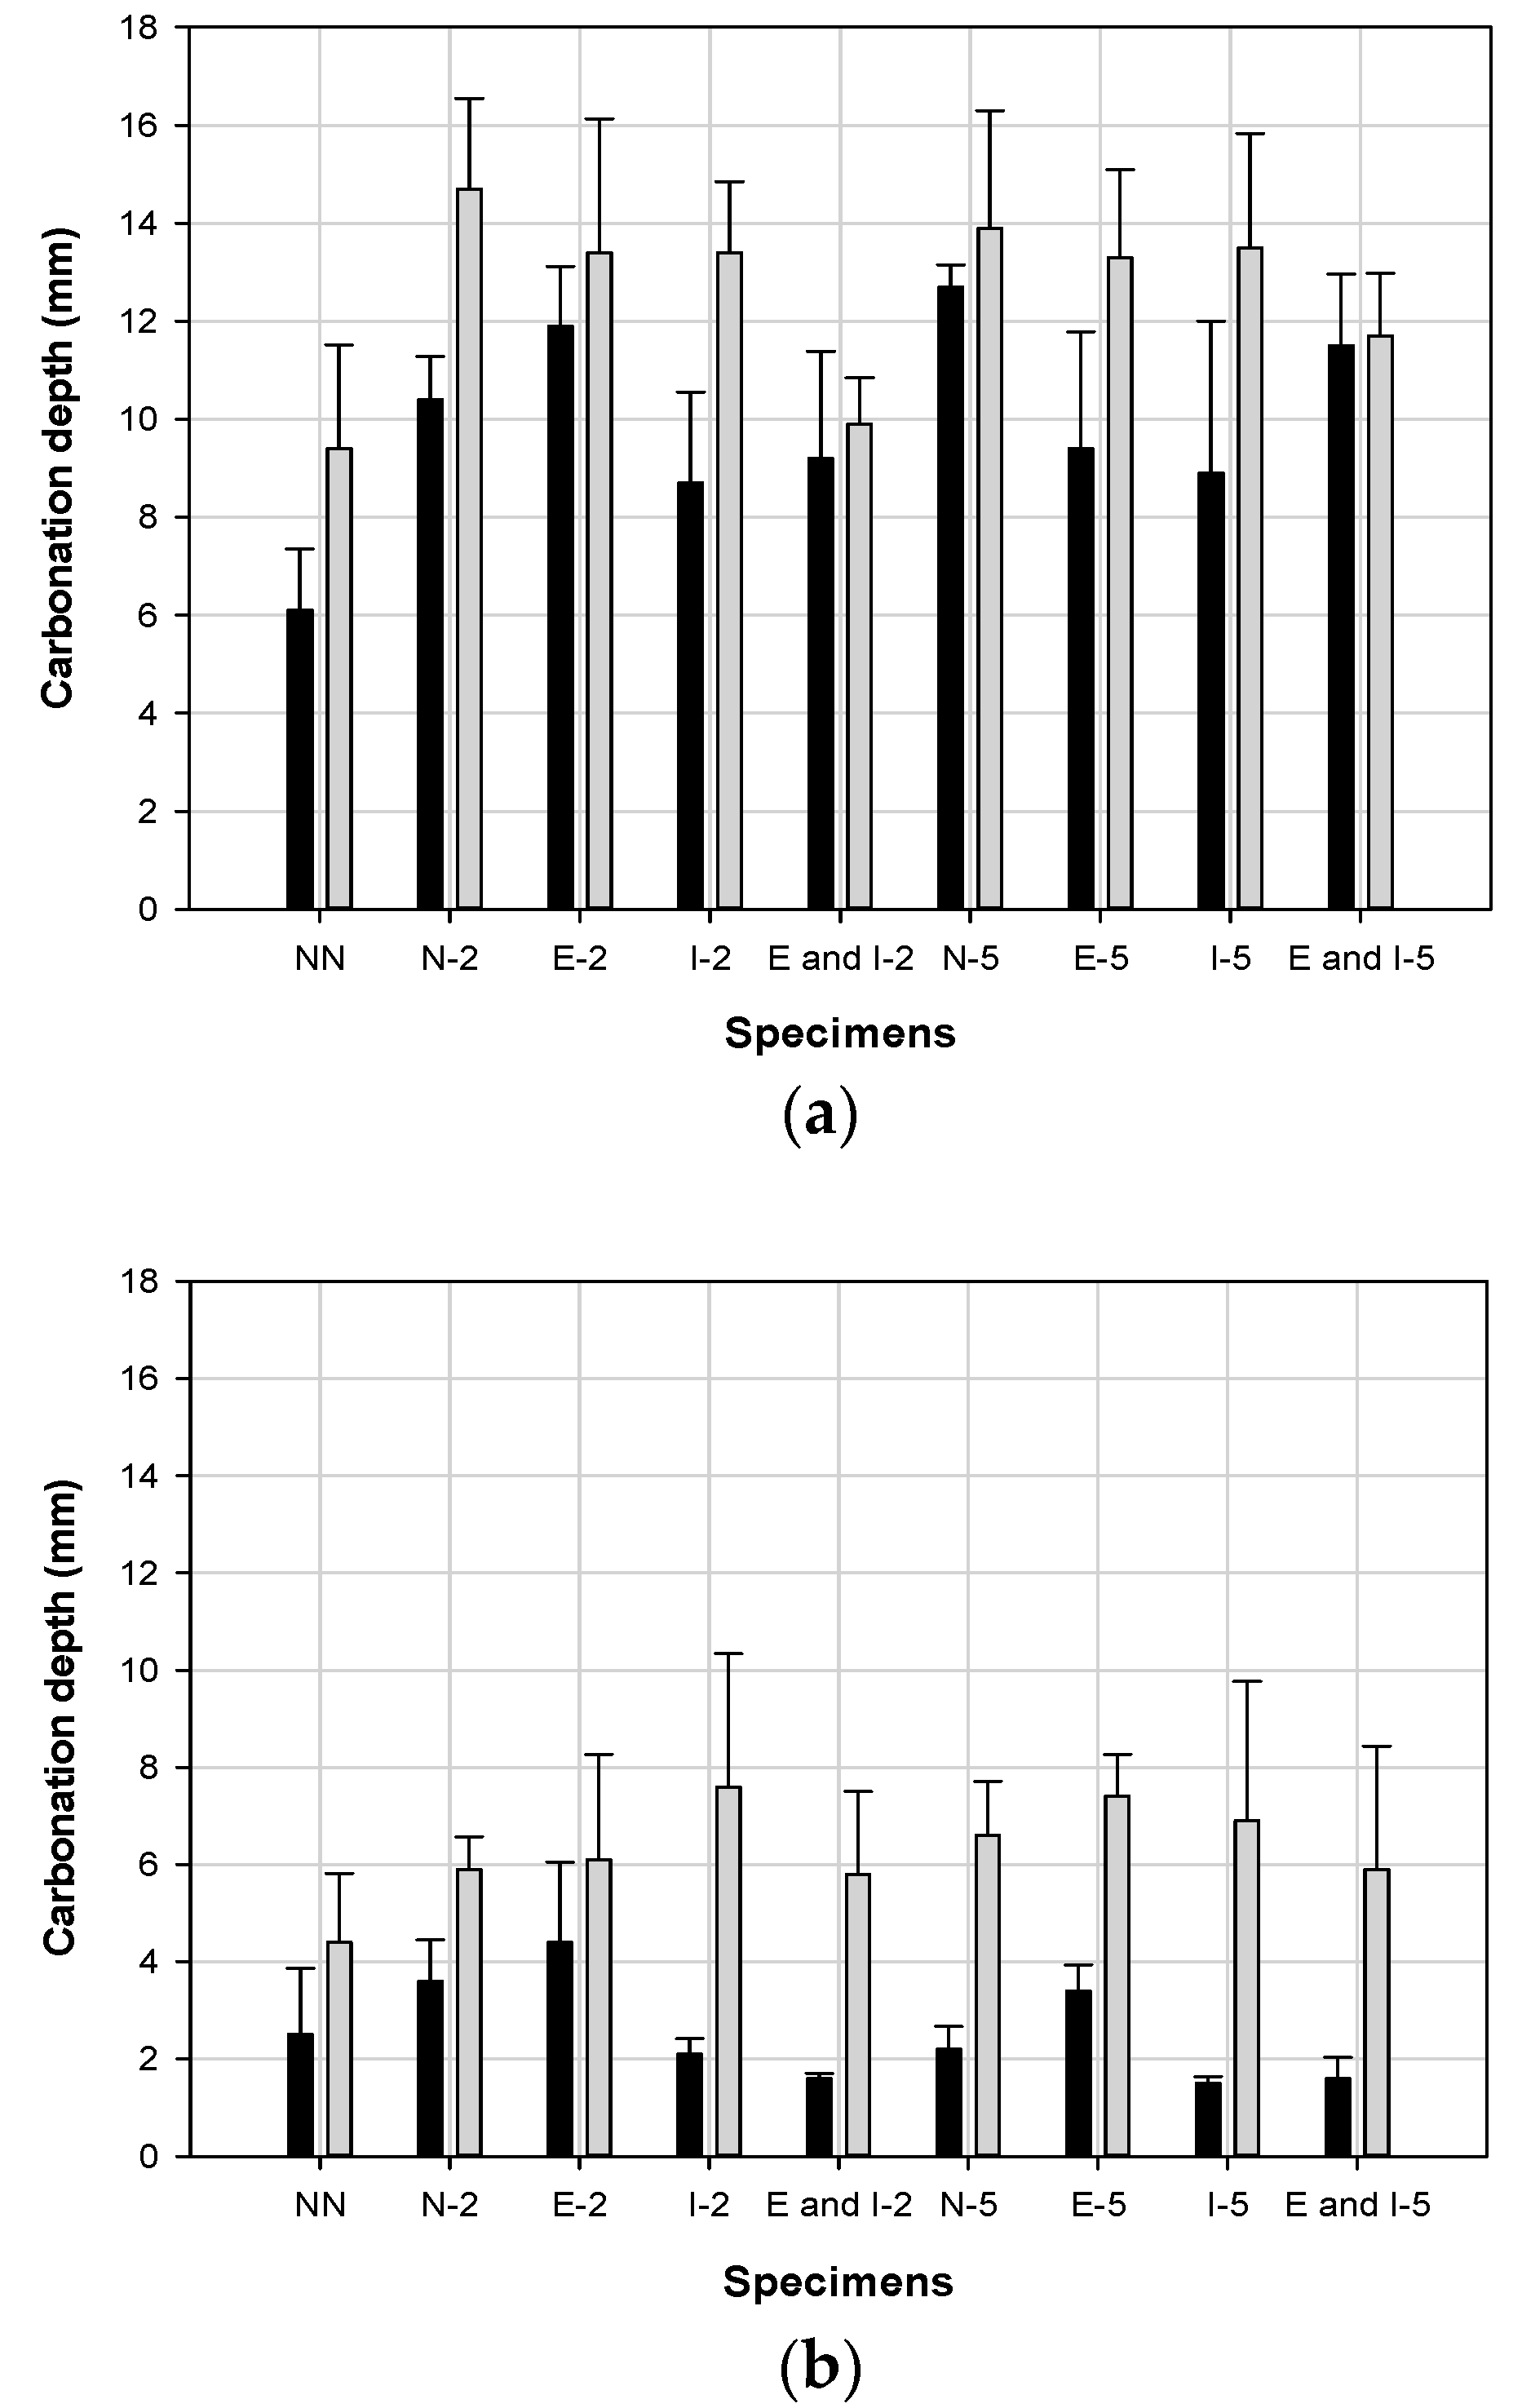
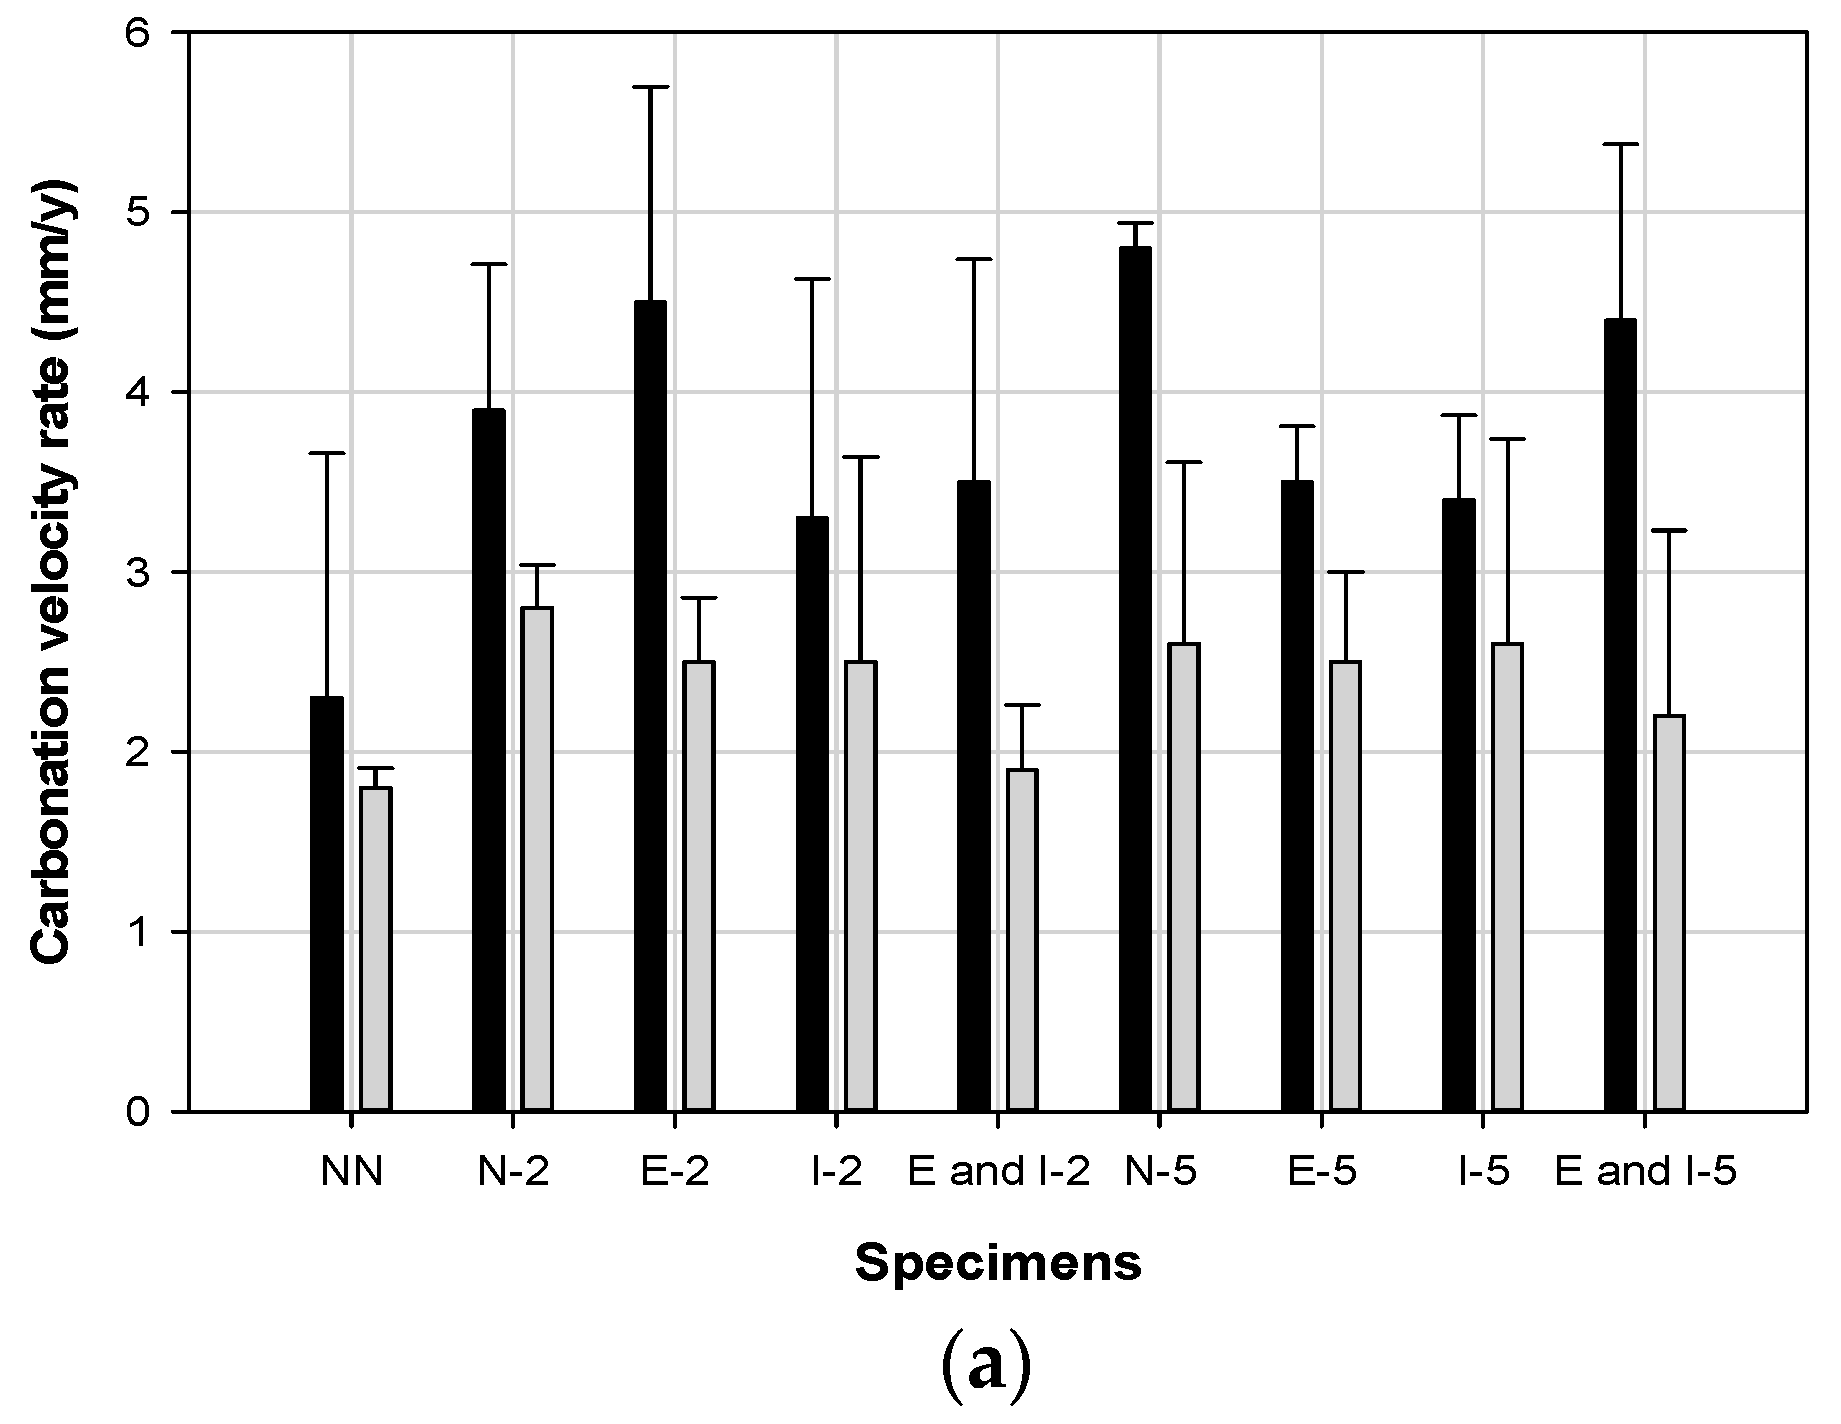
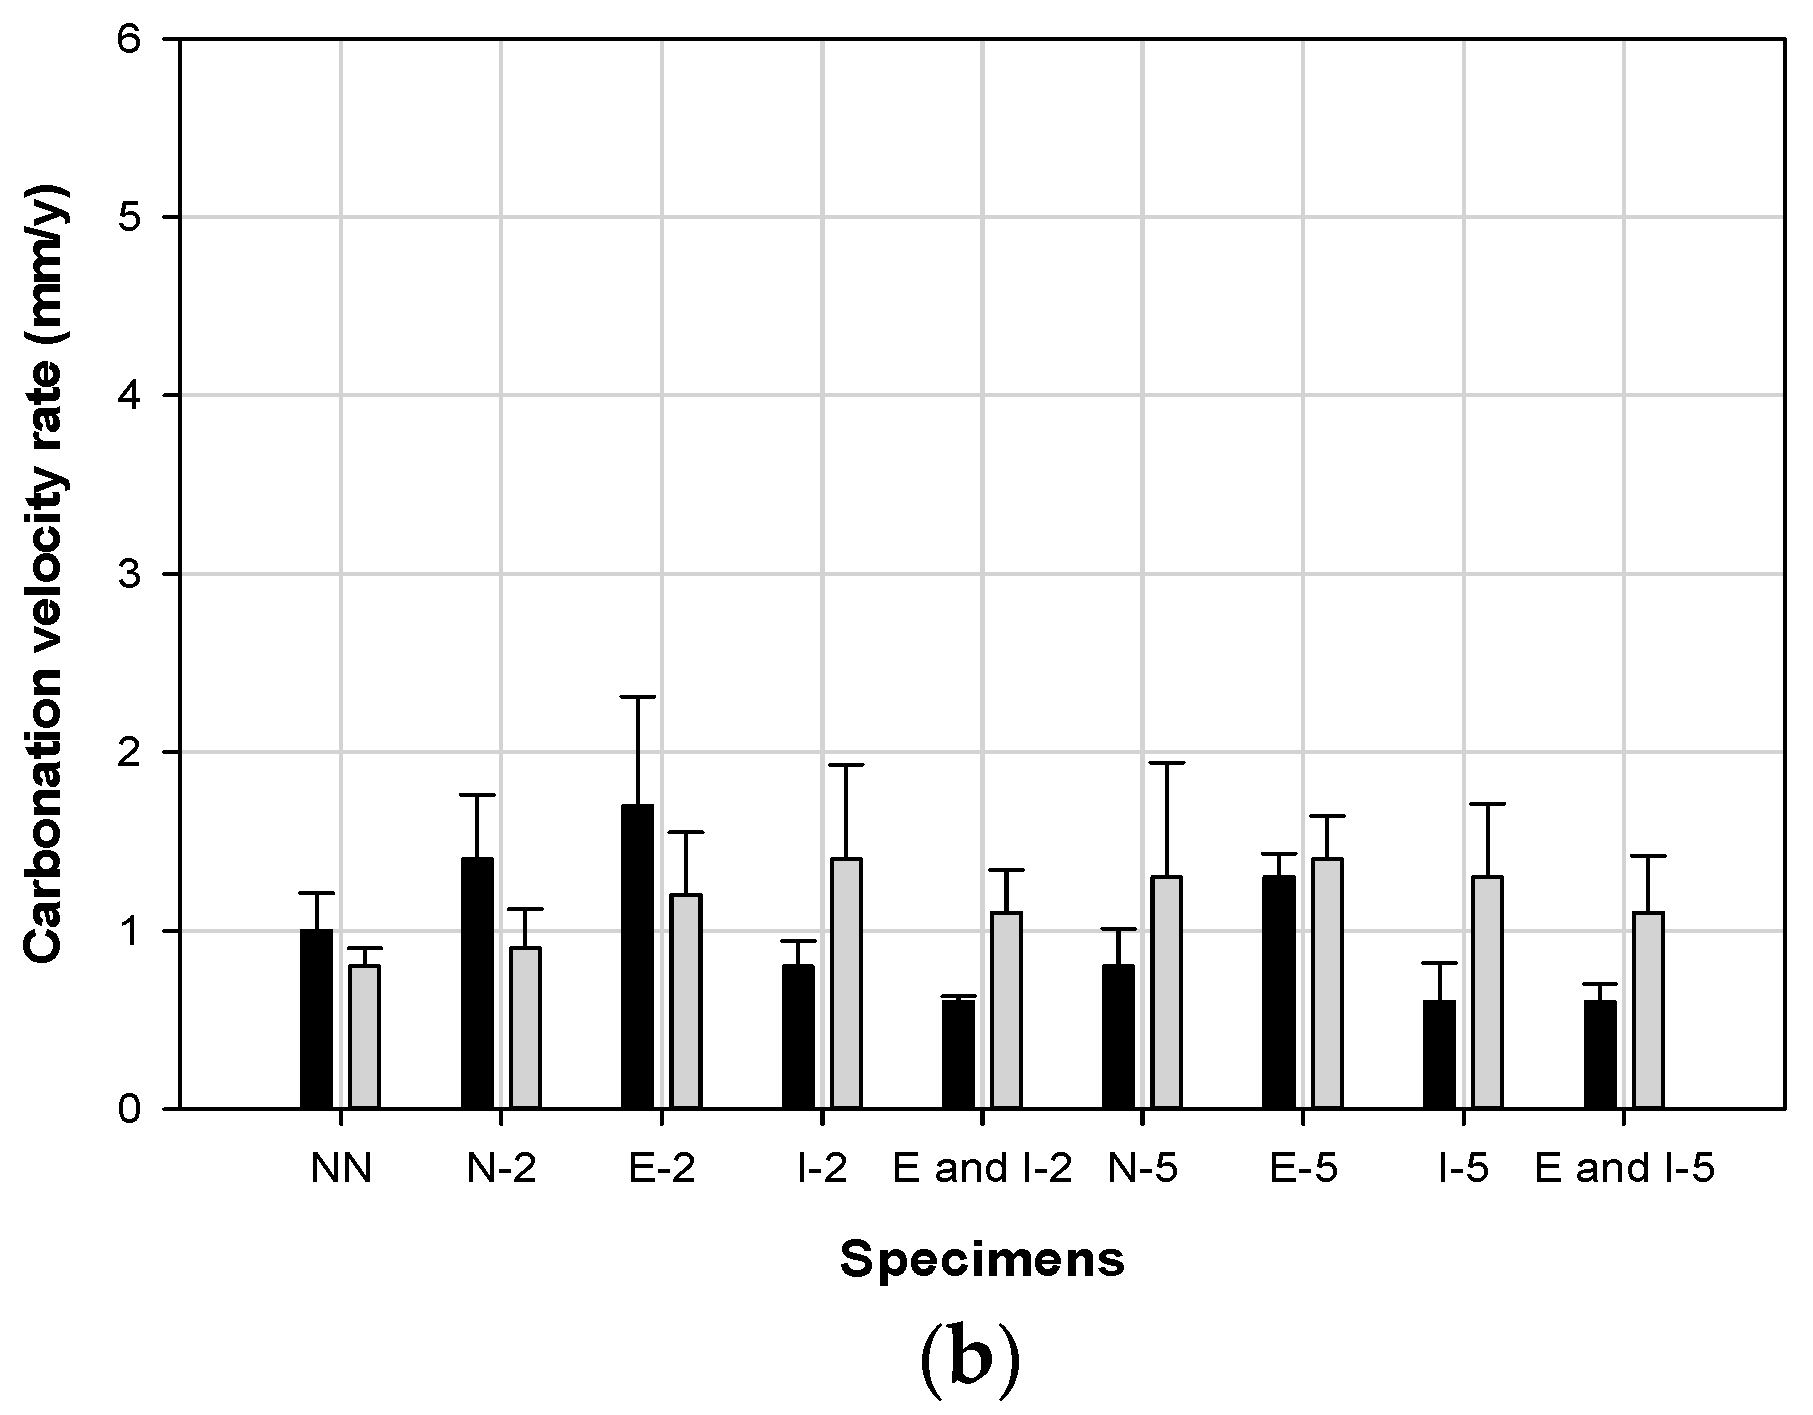
3.2. Accelerated Carbonation
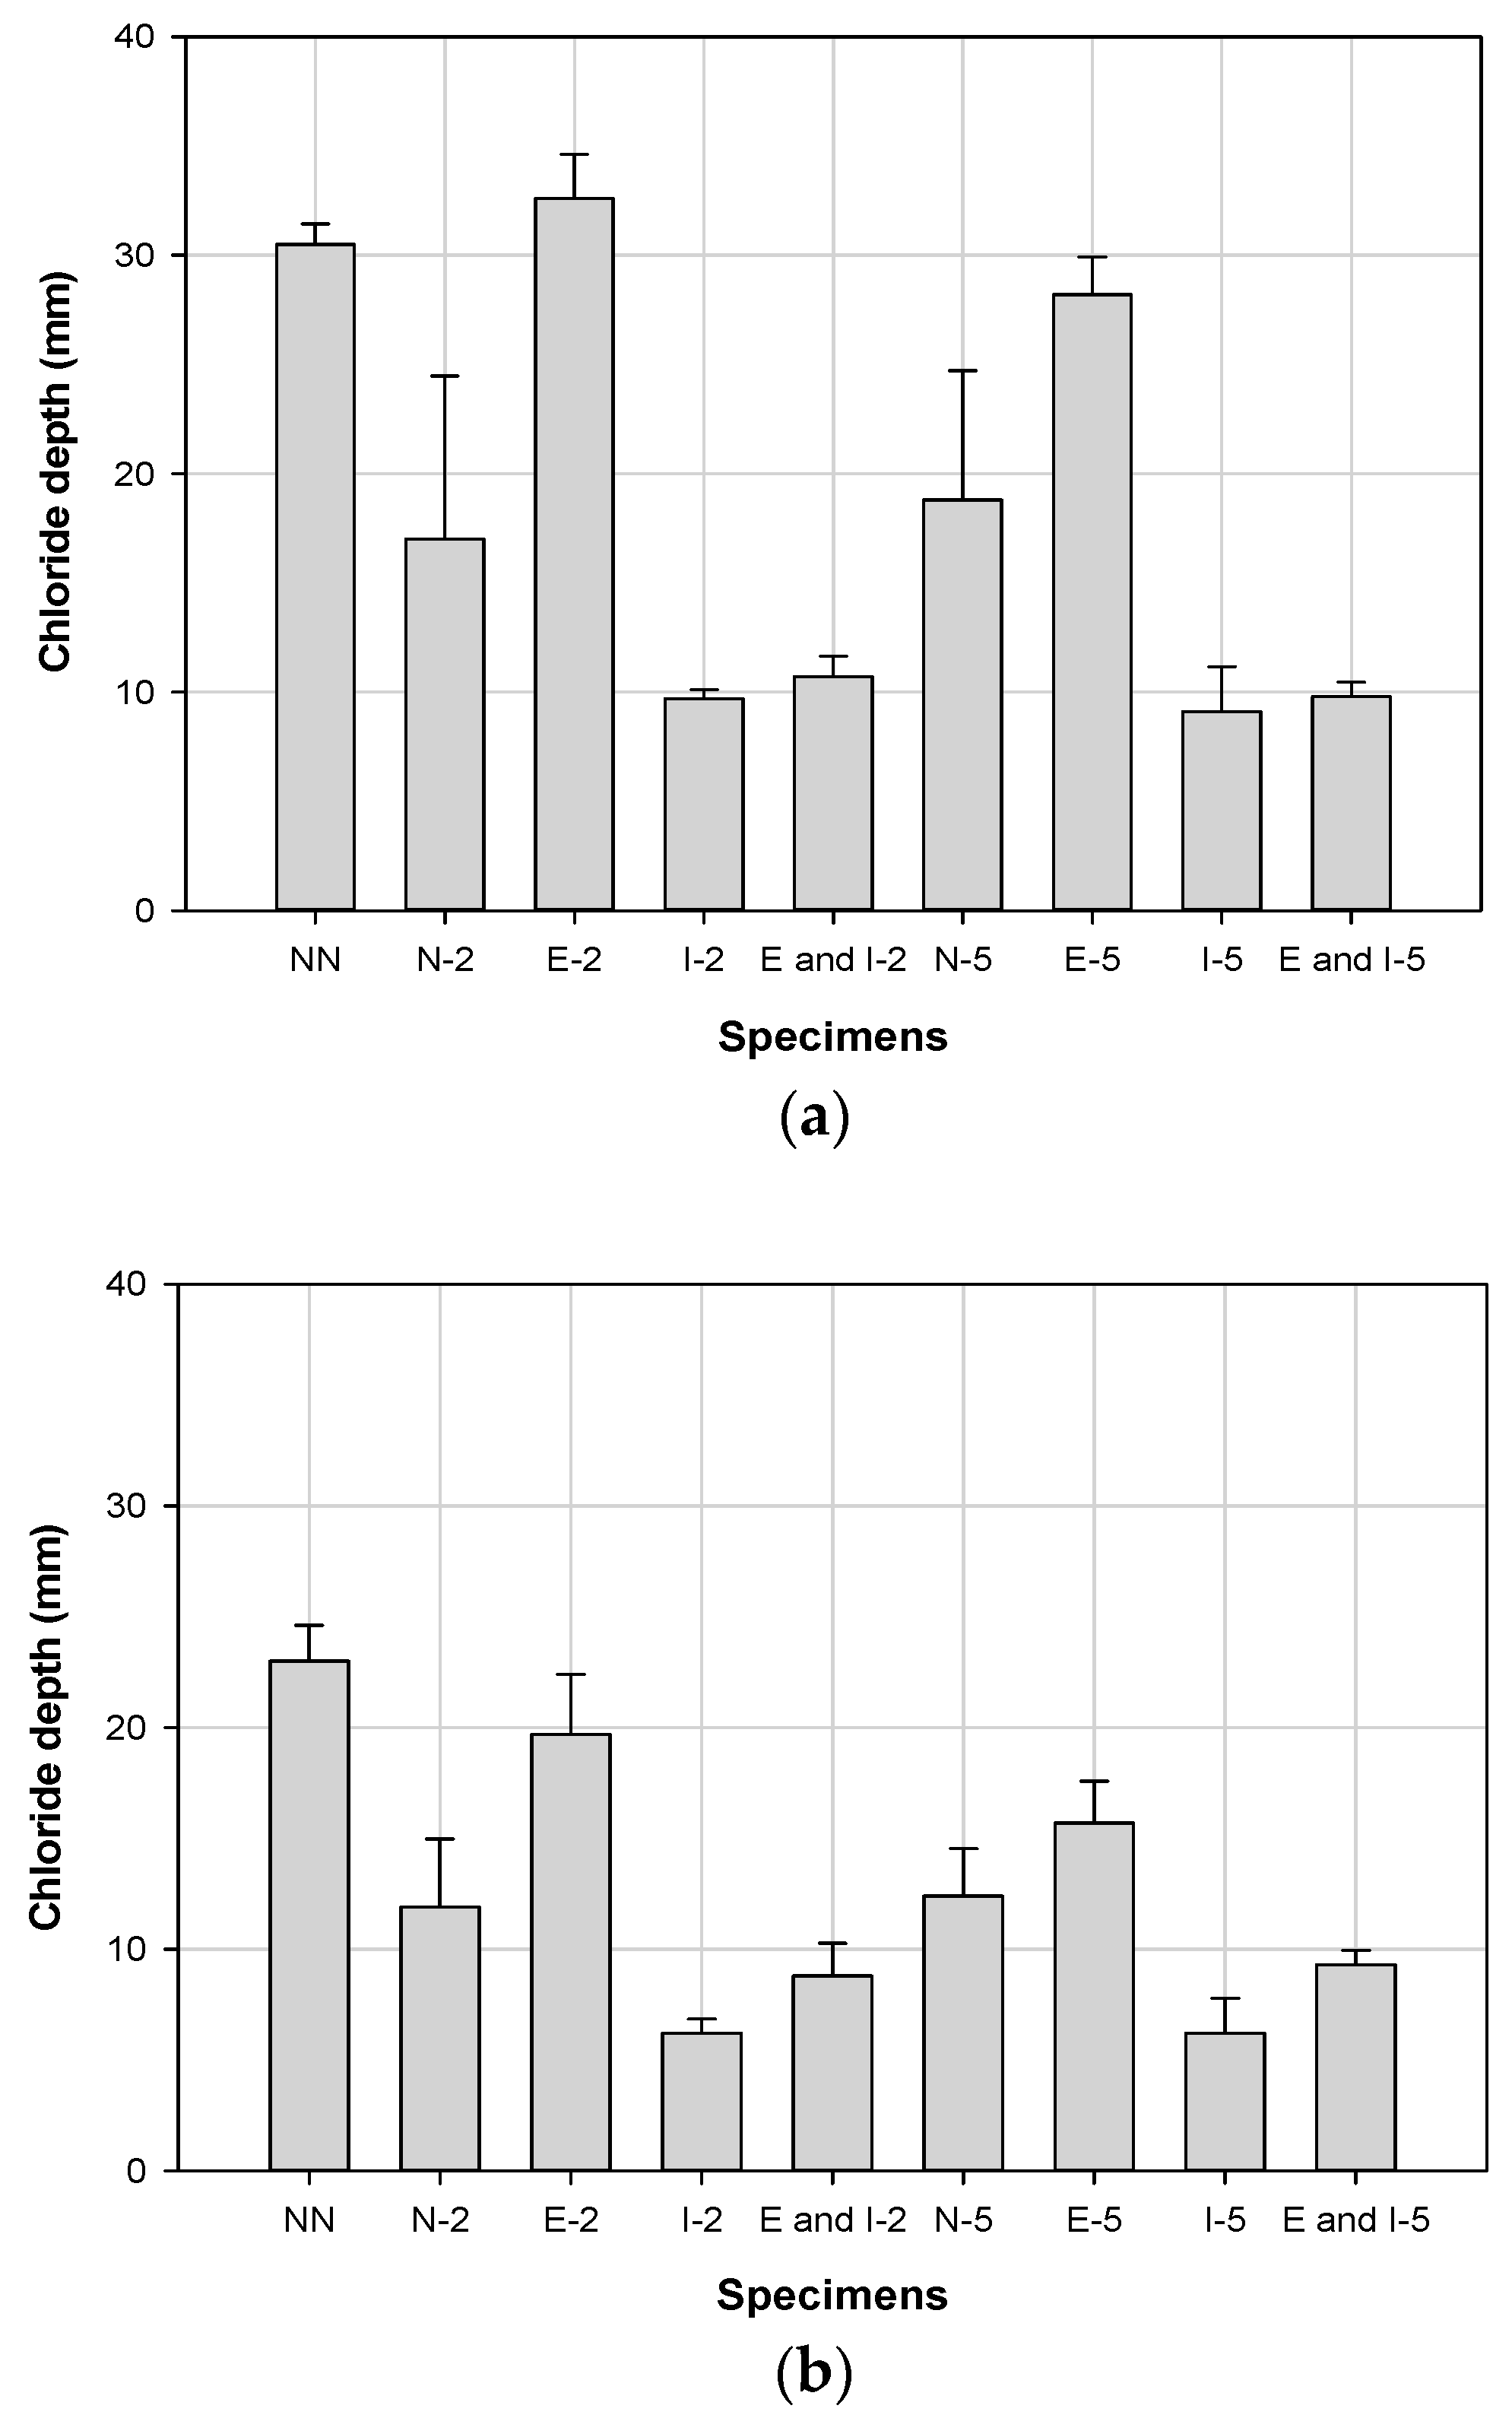
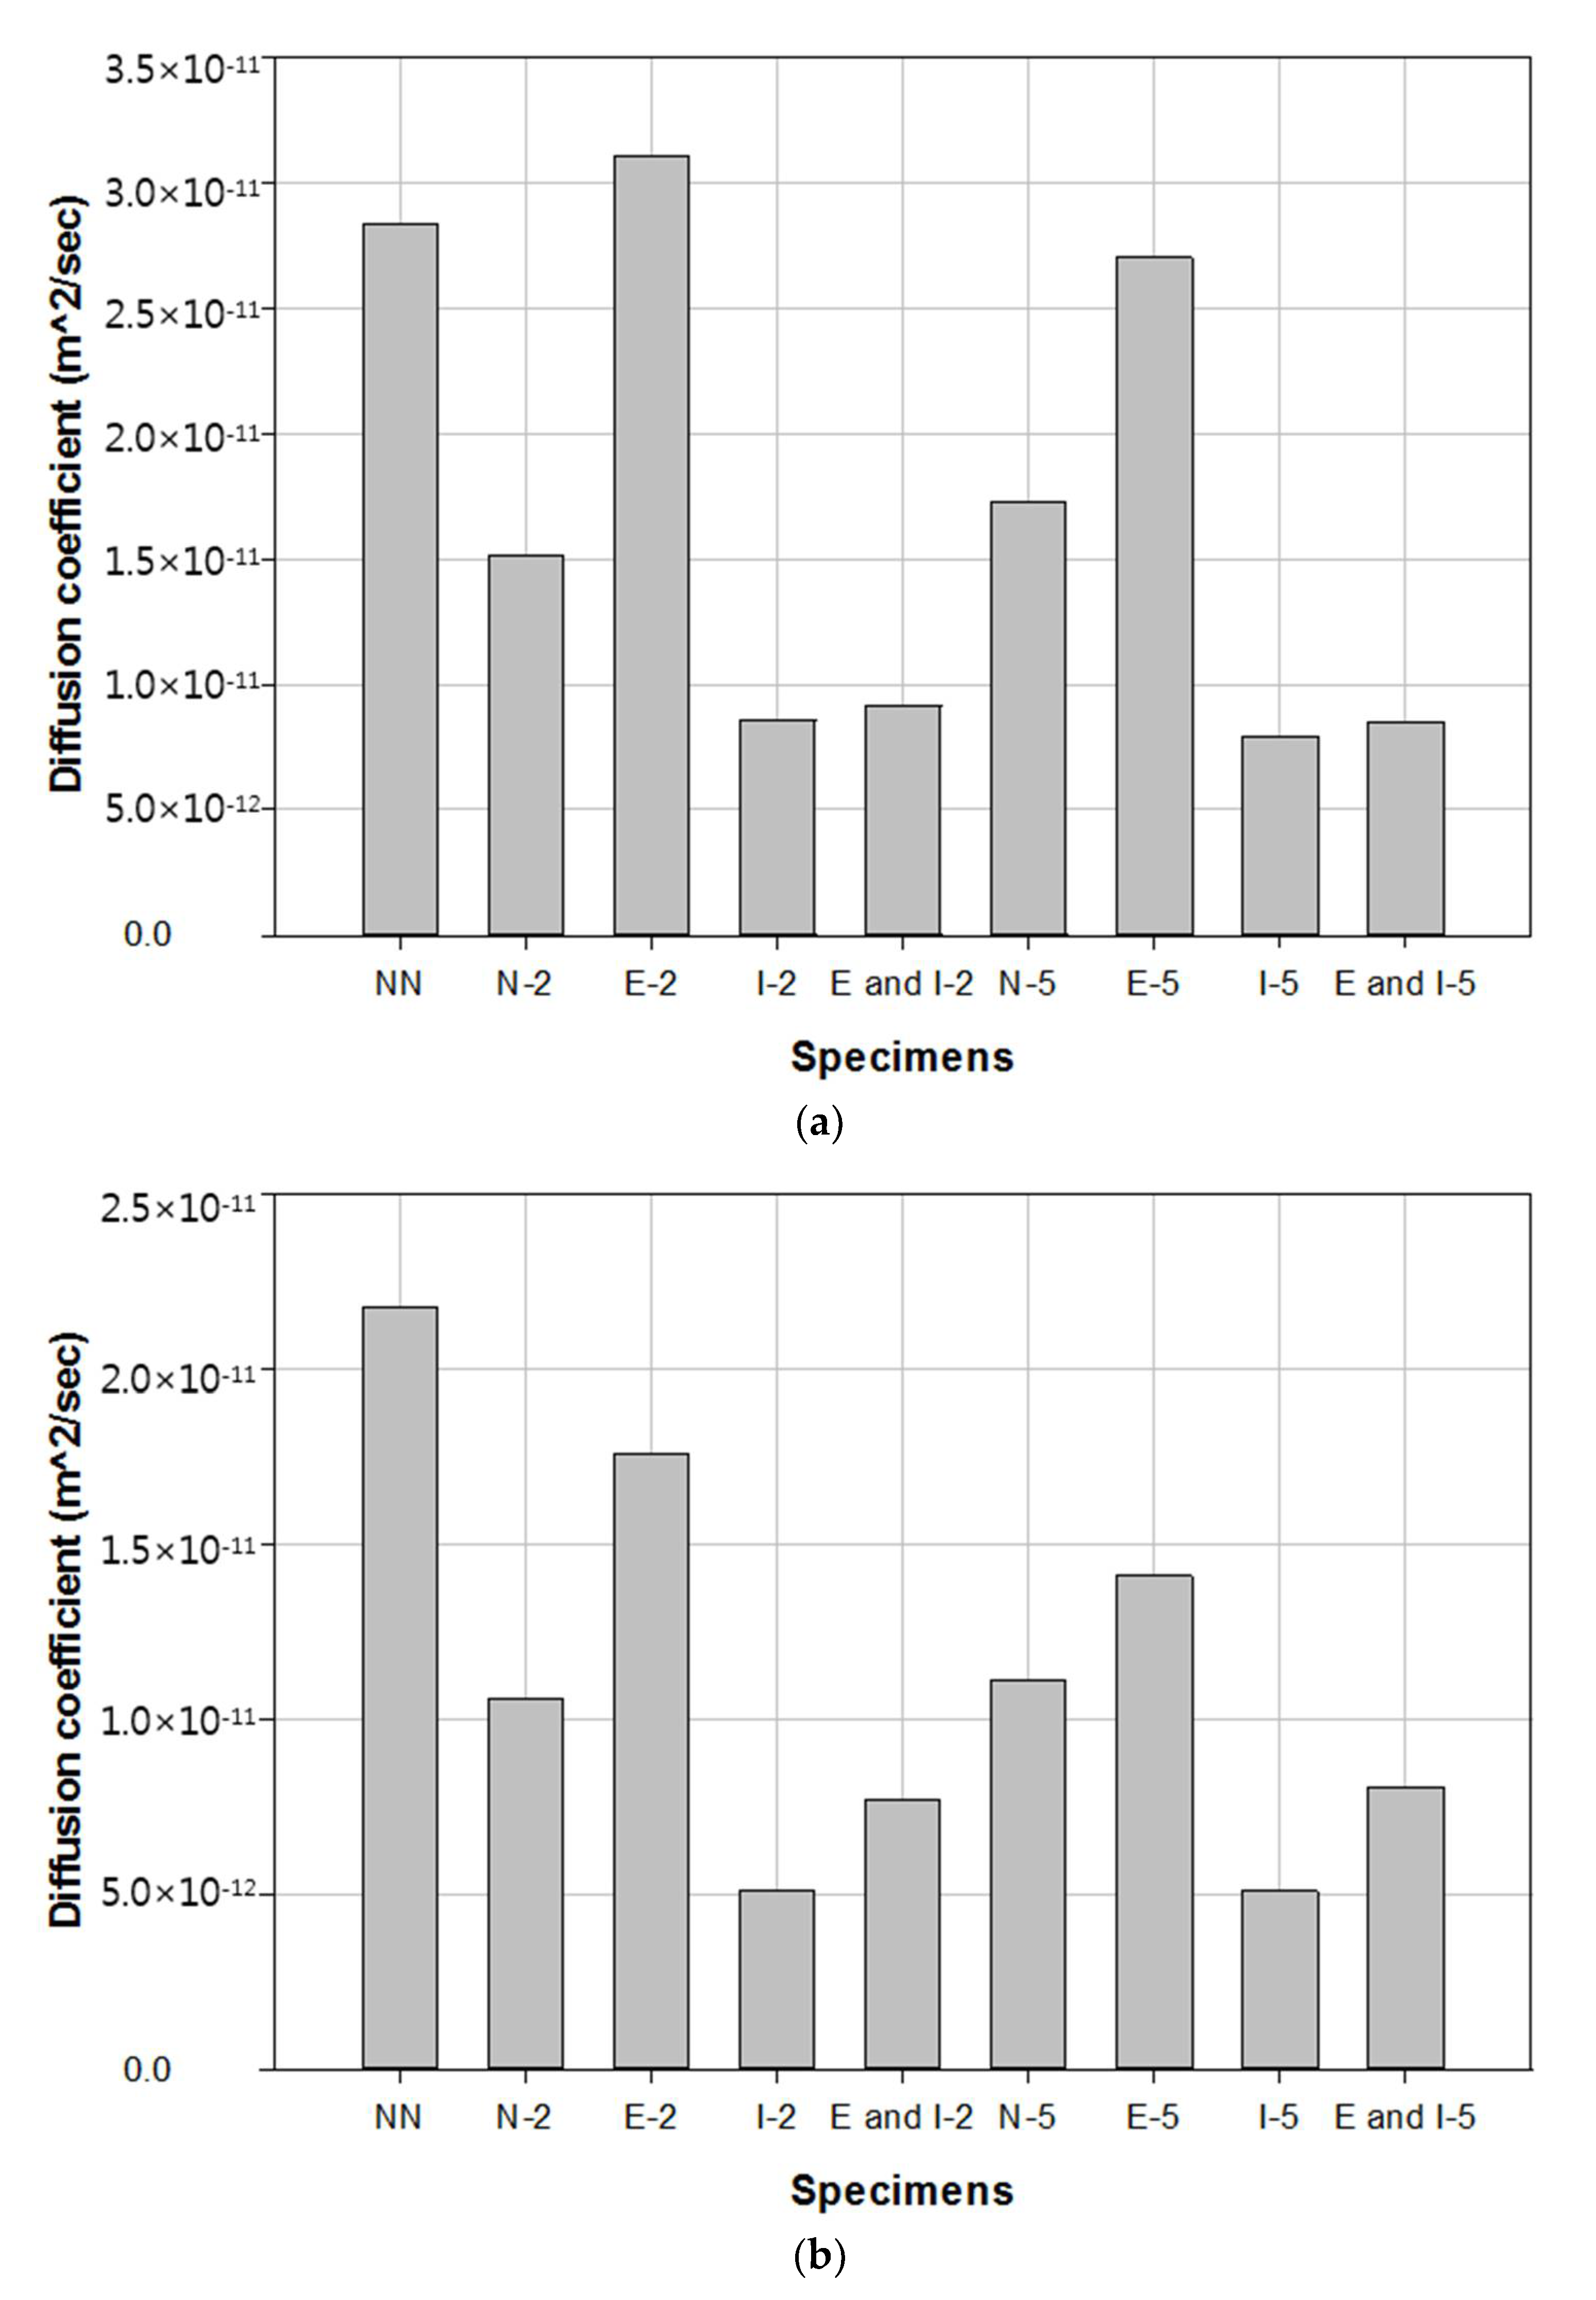
3.3. Chloride
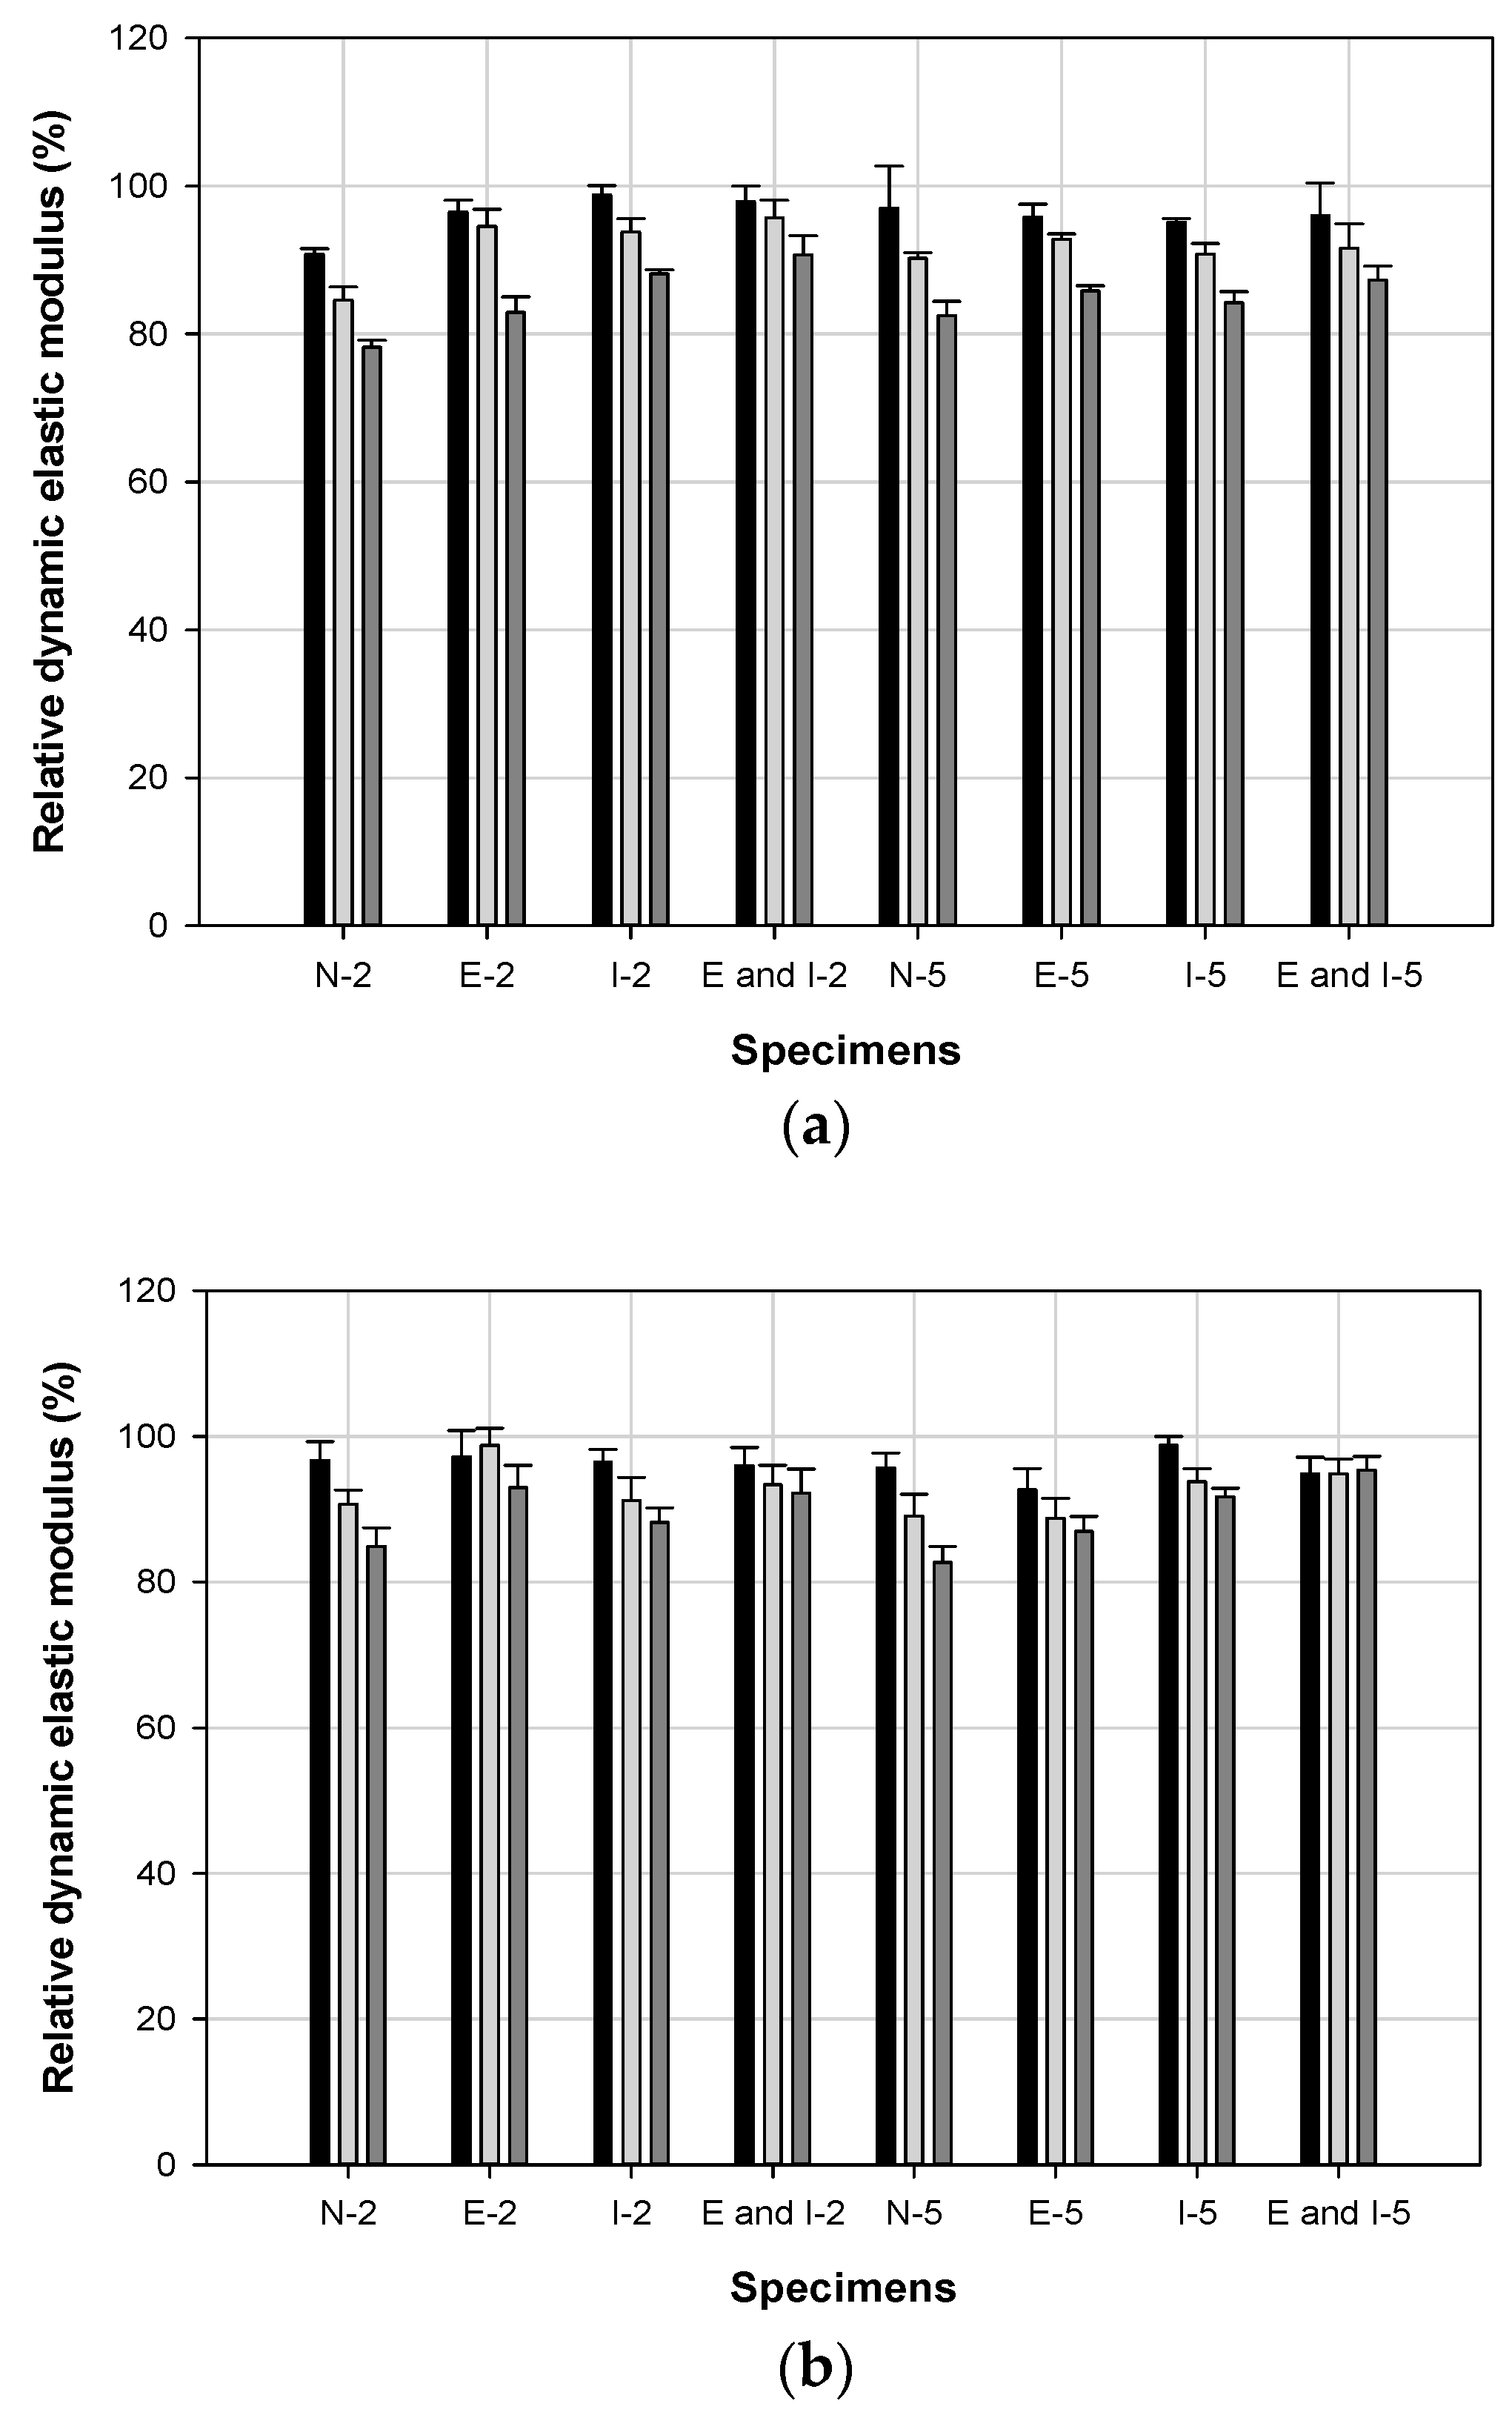
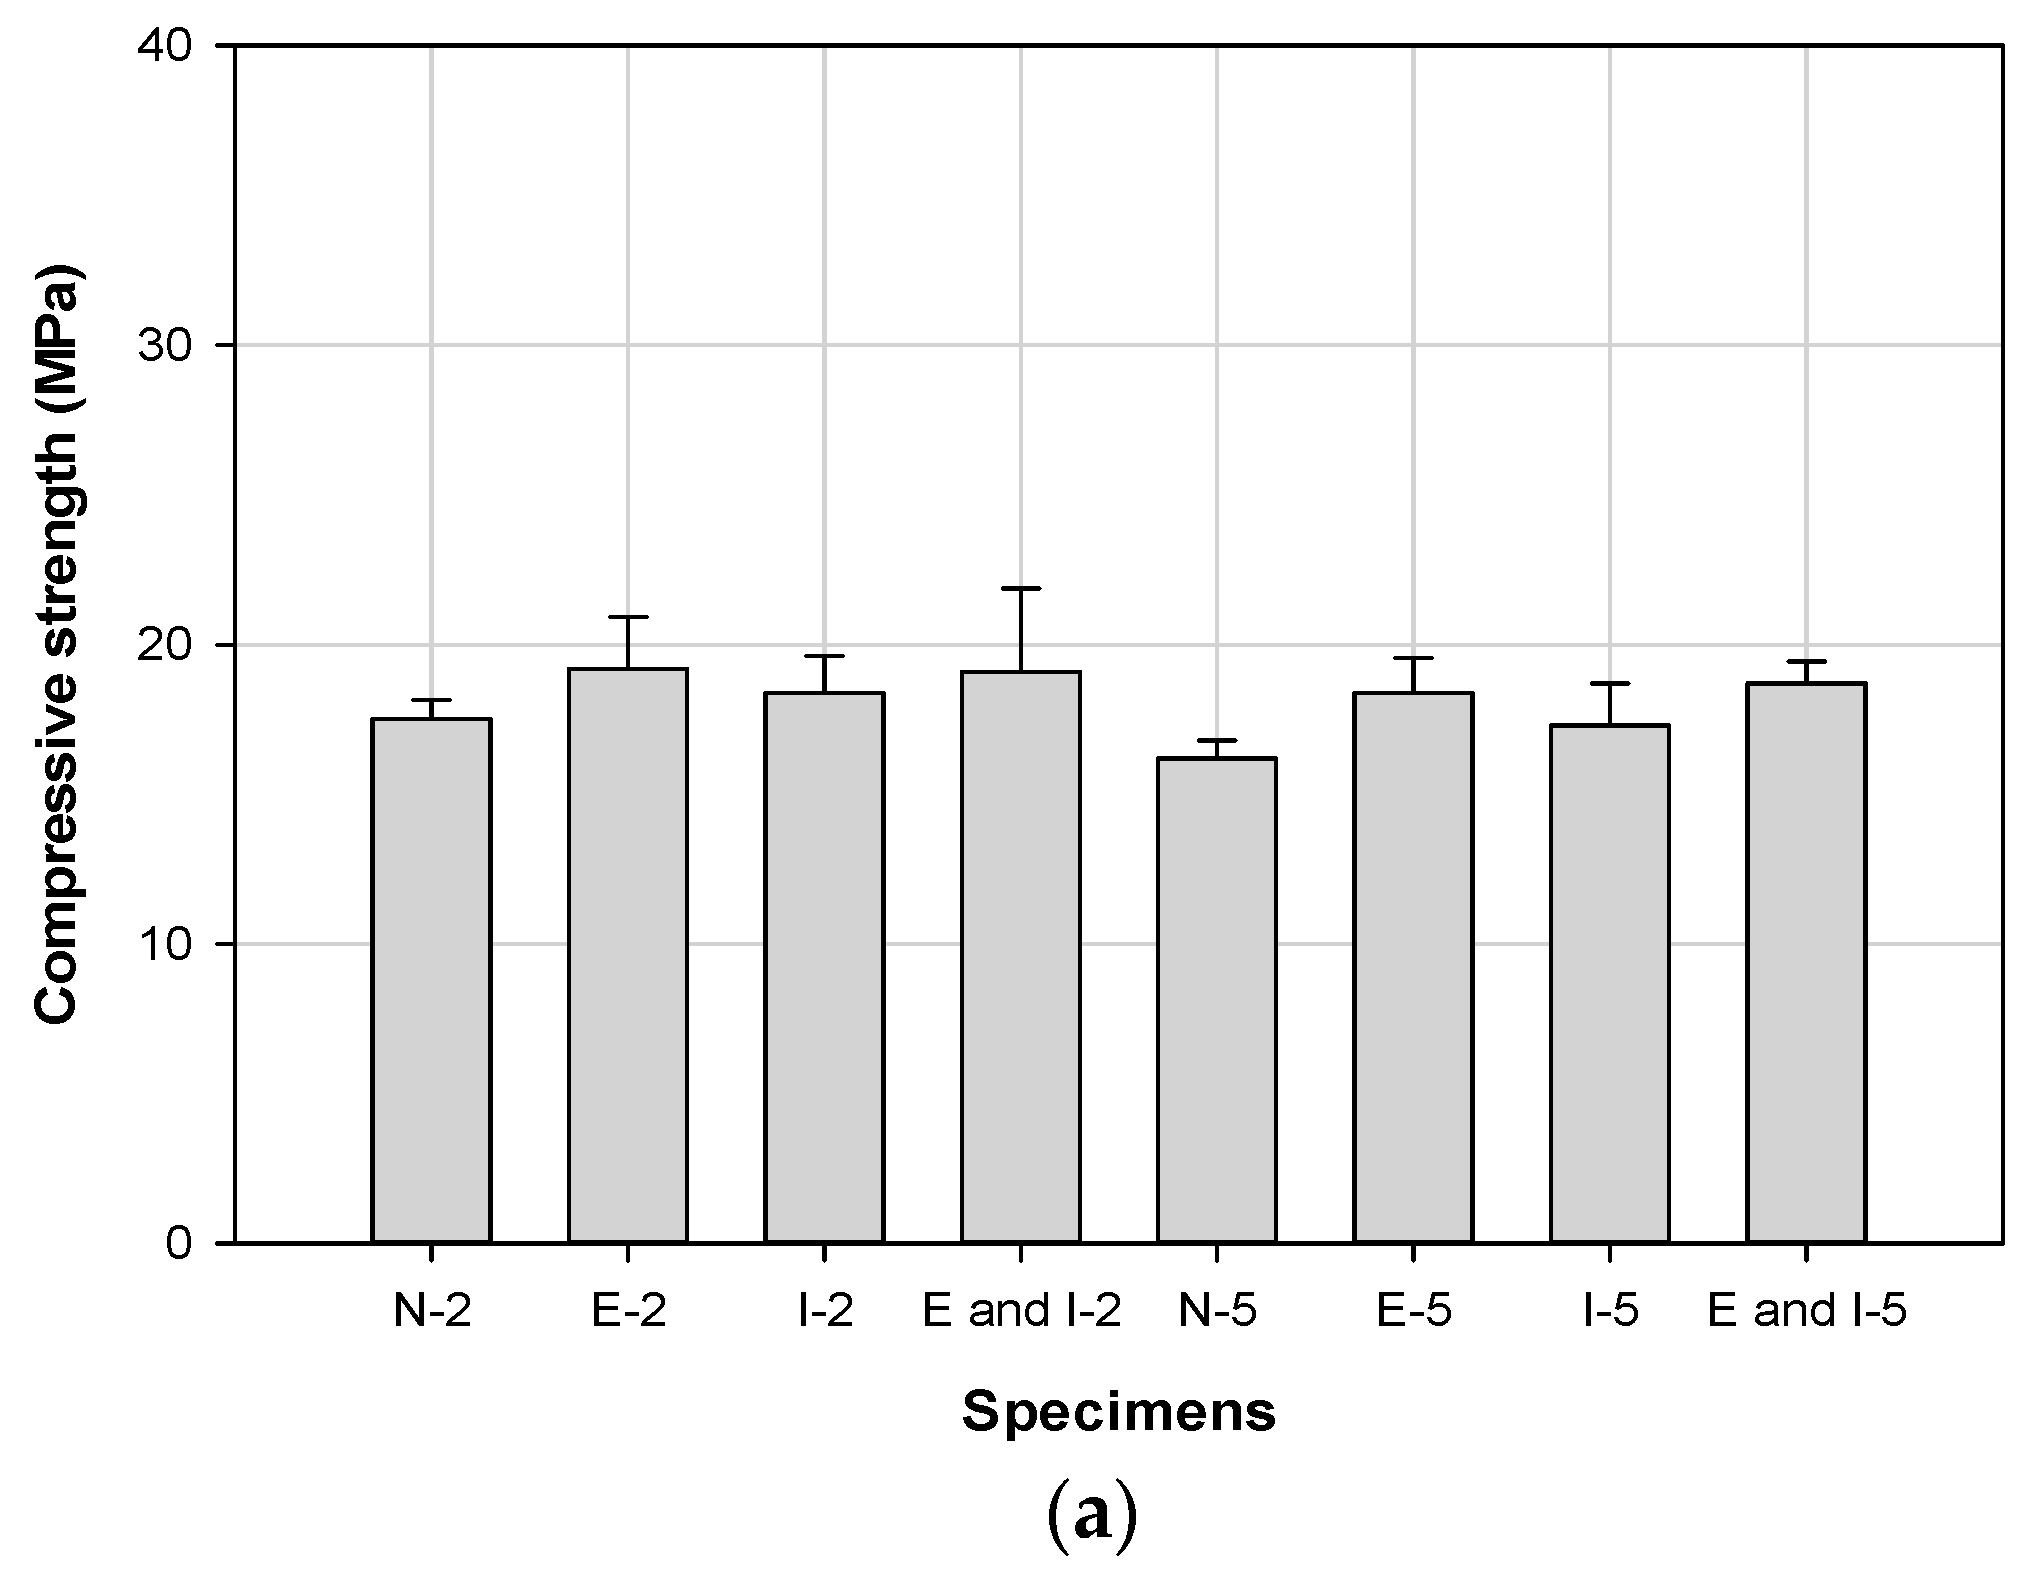
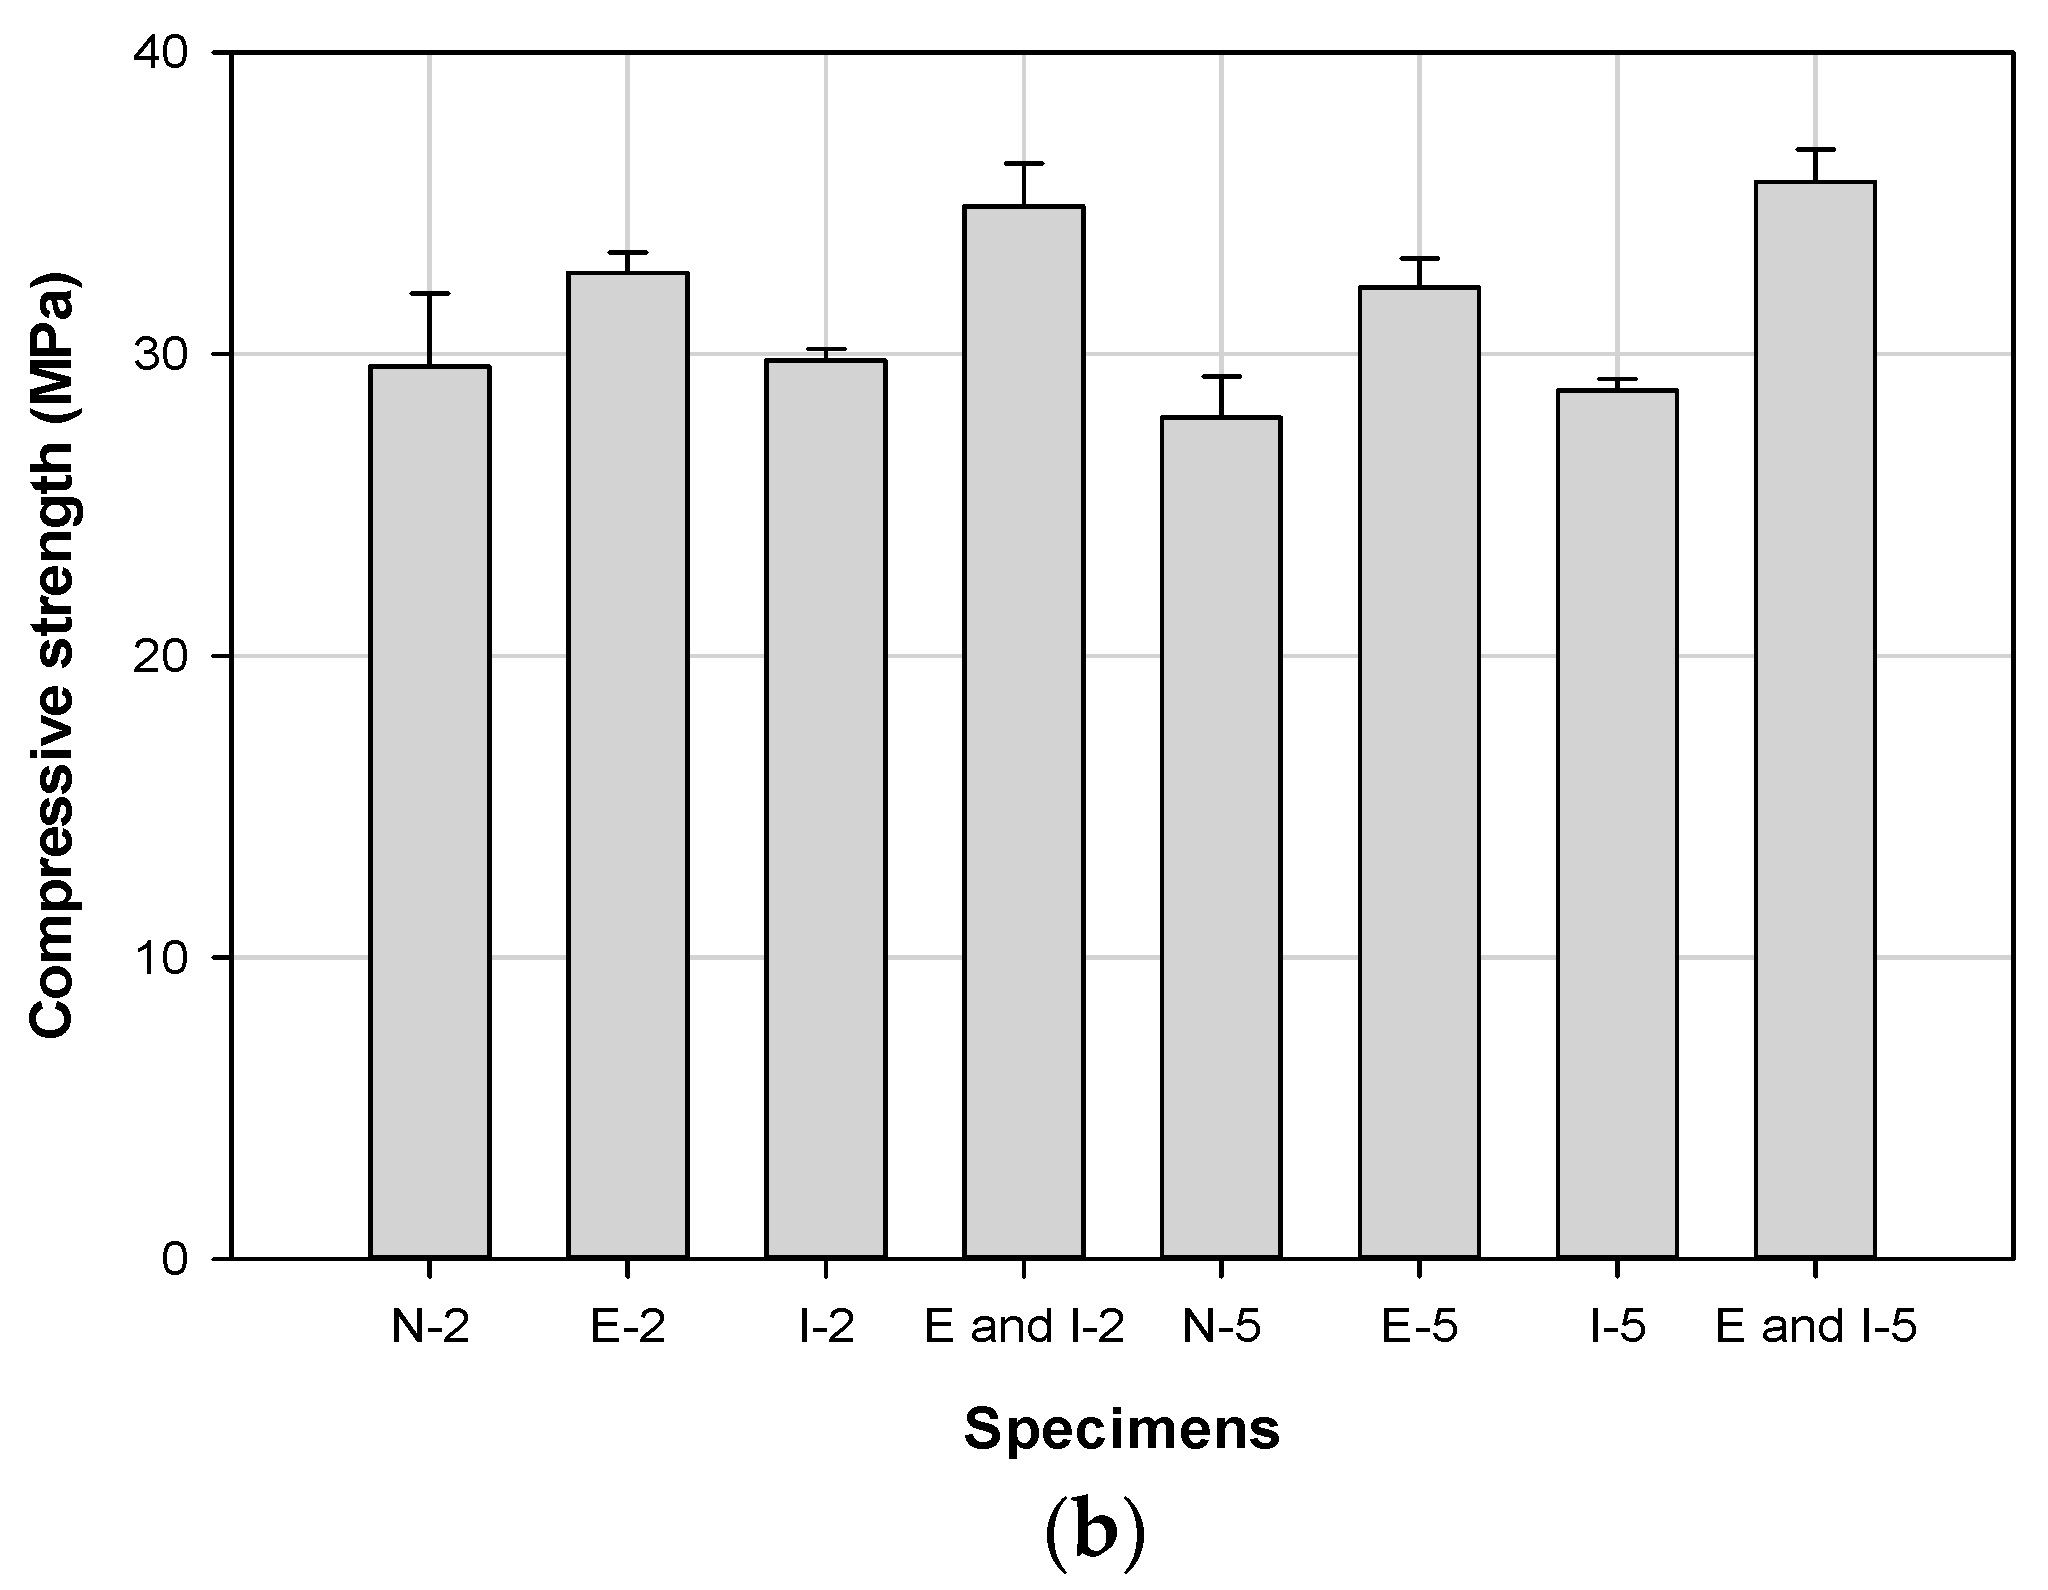
3.4. Freeze–Thaw
4. Conclusions
- (1).
- Repairs that included epoxy exhibited the highest compressive strength. Specimens repaired using epoxy and epoxy/impregnant were approximately 2–5% stronger than those repaired using impregnant. This is because the epoxy filled the cracks with high adhesion. The flexural strength showed a similar trend.
- (2).
- The carbonation resistance test results showed that impregnant and epoxy had the greatest repair effect after one week, but epoxy/impregnant showed approximately 10% higher performance after four weeks. The performance of the impregnant repair decreased over time, and it is concluded that epoxy/impregnant repairs are most effective for concrete structures exposed to carbonation over a long period of time.
- (3).
- The chloride resistance test results confirmed that repair methods including impregnant had a penetration effect 2–3.5 times greater than the epoxy repair method. This is because epoxy repairs involve penetration at the concrete interface, whereas impregnant blocks chloride penetration from the outside due to its interface protection and waterproofing.
- (4).
- For freeze–thaw, both the relative dynamic elastic modulus and durability index were greater than 80% after 300 cycles when the exposure ended for all the specimens. For impregnant repairs, the relative dynamic elastic modulus exhibited a greater reduction rate as the number of freeze–thaw cycles increased. The reduction rate was low when the cracks were repaired using epoxy or epoxy/impregnant. As for the compressive strength after freeze–thaw, the reduction rate was less than 20% for all the repair methods. The methods that included epoxy were strongest.
- (5).
- As discussed, the crack size is an important factor when concrete structures are repaired. However, the strength and environmental factors also have a significant effect.
Author Contributions
Funding
Institutional Review Board Statement
Informed Consent Statement
Data Availability Statement
Acknowledgments
Conflicts of Interest
References
- Mehta, P.K.; Paulo, J.M.M. CONCRETE (Microstructure, Properties, and Materials), 3rd ed.; McGraw Hill: New York, NY, USA, 2006. [Google Scholar]
- Sidney, M.; Francis, Y.; David, D. CONCRETE, 2nd ed.; Prentice Hall: Upper Saddle River, NJ, USA, 2003. [Google Scholar]
- Chang, C.-F.; Chen, J.-W. The experimental investigation of concrete carbonation depth. Cem. Concr. Res. 2006, 36, 1760–1767. [Google Scholar] [CrossRef]
- Khunthongkeaw, J.; Tangtermsirikul, S.; Leelawat, T. A study on carbonation depth prediction for fly ash concrete. Constr. Build. Mater. 2006, 20, 744–753. [Google Scholar] [CrossRef]
- Cho, H.-C.; Ju, H.; Oh, J.-Y.; Lee, K.J.; Hahm, K.W.; Kim, K.S. Estimation of Concrete Carbonation Depth Considering Multiple Influencing Factors on the Deterioration of Durability for Reinforced Concrete Structures. Adv. Mater. Sci. Eng. 2016, 2016, 1–18. [Google Scholar] [CrossRef]
- Han, S.-H.; Park, W.-S.; Yang, E.-I. Evaluation of concrete durability due to carbonation in harbor concrete structures. Constr. Build. Mater. 2013, 48, 1045–1049. [Google Scholar] [CrossRef]
- Silva, R.; Neves, R.; De Brito, J.; Dhir, R. Carbonation behaviour of recycled aggregate concrete. Cem. Concr. Compos. 2015, 62, 22–32. [Google Scholar] [CrossRef]
- Nemecek, J.; Kruis, J.; Koudelka, T.; Krejčí, T. Simulation of chloride migration in reinforced concrete. Appl. Math. Comput. 2018, 319, 575–585. [Google Scholar] [CrossRef]
- Wang, J.; Basheer, P.M.; Nanukuttan, S.V.; Long, A.E.; Bai, Y. Influence of service loading and the resulting micro-cracks on chloride resistance of concrete. Constr. Build. Mater. 2016, 108, 56–66. [Google Scholar] [CrossRef]
- Farahani, A.; Taghaddos, H.; Shekarchi, M. Prediction of long-term chloride diffusion in silica fume concrete in a marine environment. Cem. Concr. Compos. 2015, 59, 10–17. [Google Scholar] [CrossRef]
- Sun, G.W.; Zhang, Y.S.; Sun, W.; Liu, Z.Y.; Wang, C.H. Multi-scale prediction of the effective chloride diffusion coefficient of concrete. Constr. Build. Mater. 2011, 25, 3820–3831. [Google Scholar] [CrossRef]
- Kim, T.-K.; Choi, S.-J.; Kim, J.-H.J.; Chu, Y.-S.; Yu, E. Performance Based Evaluation of Carbonation Resistance of Concrete According to Various Curing Conditions from Climate Change Effect. Int. J. Concr. Struct. Mater. 2017, 11, 687–700. [Google Scholar] [CrossRef]
- Jiang, L.; Niu, D.; Yuan, L.; Fei, Q. Durability of concrete under sulfate attack exposed to freeze–thaw cycles. Cold Reg. Sci. Technol. 2015, 112, 112–117. [Google Scholar] [CrossRef]
- Ma, Z.; Zhu, F.; Ba, G. Effects of freeze-thaw damage on the bond behavior of concrete and enhancing measures. Constr. Build. Mater. 2019, 196, 375–385. [Google Scholar] [CrossRef]
- Ministry of Land, Infrastructure and Transport. Detailed Guidelines on Safety Inspection and Precision Safety Diagnosis; Report No. RD-12-E6-024; Korea Authority of Land & Infrastructure Safety: Jinju, Gyeongnam, 2017. (In Korean)
- Christodoulou, C.; Goodier, C.I.; Austin, S.A.; Webb, J.; Glass, G.K. Long-term performance of surface impregnation of reinforced concrete structures with silane. Constr. Build. Mater. 2013, 48, 708–716. [Google Scholar] [CrossRef]
- El-Hawary, M.; Al-Khaiat, H.; Fereig, S. Performance of epoxy-repaired concrete in a marine environment. Cem. Concr. Res. 2000, 30, 259–266. [Google Scholar] [CrossRef]
- Dai, J.-G.; Akira, Y.; Wittmann, F.; Yokota, H.; Zhang, P. Water repellent surface impregnation for extension of service life of reinforced concrete structures in marine environments: The role of cracks. Cem. Concr. Compos. 2010, 32, 101–109. [Google Scholar] [CrossRef]
- Kim, H.J.; Kim, Y.K.; Kwon, S.J. Evaluation of Durability and Self-clearing in Concrete Impregnated with Photocatalyst-colloidal Silica. J. Korea Inst. Concr. Struct. Maint. Inspe. 2018, 22, 47–54. (In Korean) [Google Scholar]
- Bae, J.S.; Kim, H.J.; Park, G.J.; Han, J.W. A Study on Characteristics of Concrete Impregnated with the Inorganic Surface Penetration Agents. J. Korea Inst. Concr. Struct. Maint. Inspe. 2010, 14, 71–77. (In Korean) [Google Scholar]
- Kwon, S.J.; Park, S.S.; Lee, S.M.; Kim, J.W. Selection of Concrete Surface Impregnant through Durability Tests. J. Korea Inst. Concr. Struct. Maint. Inspe. 2007, 11, 77–87. (In Korean) [Google Scholar]
- Korea Concrete Institute (KCI). Standard Concrete Specification and Commentary; Korea Concrete Institute (KCI): Seoul, Korea, 2009. [Google Scholar]
- Korea Standards Association (KSA). Standard Test Method for Making Concrete Specimens; KS F 2403; Korea Standards Association (KSA): Seoul, Korea, 2019.
- Korea Standards Association (KSA). Standard Test Method for Compressive Strength of Concrete; KS F 2405; Korea Standards Association (KSA): Seoul, Korea, 2017.
- Korea Standards Association (KSA). Standard Test Method for Flexural Strength of Concrete; KS F 2408; Korea Standards Association (KSA): Seoul, Korea, 2016.
- Korea Standards Association (KSA). Standard Test Method for Accelerated Carbonation of Concrete; KS F 2584; Korea Standards Association (KSA): Seoul, Korea, 2020.
- Korea Standards Association (KSA). Standard Test Method for Measuring Carbonation Depth of Concrete; KS F 2596; Korea Standards Association (KSA): Seoul, Korea, 2019.
- Nordtest. Chloride Migration Coefficient from Non-Steady-State Migration Experiments; NT Build 492; Nordtest: Espoo, Finland, 1999. [Google Scholar]
- Korea Standards Association (KSA). Standard Test Method for Resistance of Concrete to Rapid Freezing and Thawing; KS F 2456; Korea Standards Association (KSA): Seoul, Korea, 2013.
- Choi, S.; Lee, K.-M.; Jung, S.-H.; Kim, J.-H. A Study on the Carbonation Characteristics of Fly Ash Concrete by Accelerated Carbonation Test. J. Korea Concr. Inst. 2009, 21, 449–455. [Google Scholar] [CrossRef][Green Version]
- Kwon, S.J.; Park, S.S.; Lee, S.M.; Kim, J.W. A Study on Durability Improvement for Concrete Structures Using Surface Impregnant. J. Korea Inst. Concr. Struct. Maint. Inspe. 2007, 11, 79–88. (In Korean) [Google Scholar]
- Li, Y.; Liu, X.; Li, J. Experimental Study of Retrofitted Cracked Concrete with FRP and Nanomodified Epoxy Resin. J. Mater. Civ. Eng. 2017, 29, 04016275. [Google Scholar] [CrossRef]
- Dong, Y.; Su, C.; Qiao, P.; Sun, L. Microstructural damage evolution and its effect on fracture behavior of concrete subjected to freeze-thaw cycles. Int. J. Damage Mech. 2018, 27, 1272–1288. [Google Scholar] [CrossRef]
- Shang, H.-S.; Yi, T.-H. Freeze-Thaw Durability of Air-Entrained Concrete. Sci. World J. 2013, 2013, 1–6. [Google Scholar] [CrossRef] [PubMed]


| Target Strength (MPa) | Water/Cement Ratio (%) | Unit (kg/m3) | |||
|---|---|---|---|---|---|
| Water | Cement | Sand | Gravel | ||
| 20 | 56 | 170 | 305 | 906 | 924 |
| 40 | 36 | 155 | 425 | 813 | 958 |
| Target Strength (MPa) | Notch Width (mm) | Repair Method | Compressive Strength (MPa) | Flexural Strength (MPa) |
|---|---|---|---|---|
| 20 | - | Intact (no notch)-NN | 21.3 ± 0.45 | 3.7 ± 0.52 |
| 2 | Notched (unrepaired)-N | 20.1 ± 0.77 | 1.3 ± 0.09 | |
| Epoxy-E | 20.2 ± 0.69 | 2.3 ± 0.16 | ||
| Impregnant-I | 19.6 ± 0.33 | 1.1 ± 0.49 | ||
| Epoxy/impregnant-E and I | 19.9 ± 0.36 | 2.2 ± 0.34 | ||
| 5 | Notched (unrepaired)-N | 18.8 ± 2.15 | 1.5 ± 0.2 | |
| Epoxy-E | 19.6 ± 0.24 | 2.0 ± 0.33 | ||
| Impregnant-I | 18.7 ± 0.43 | 1.3 ± 0.06 | ||
| Epoxy/impregnant-E and I | 19.2 ± 0.12 | 1.3 ± 0.60 | ||
| 40 | - | Intact (no notch)-NN | 39.1 ± 3.09 | 5.3 ± 0.37 |
| 2 | Notched (unrepaired)-N | 35.1 ± 2.16 | 2.2 ± 0.25 | |
| Epoxy-E | 35.5 ± 1.55 | 2.4 ± 0.25 | ||
| Impregnant-I | 33.9 ± 0.84 | 1.8 ± 0.21 | ||
| Epoxy/impregnant-E and I | 35.0 ± 0.78 | 3.1 ± 0.18 | ||
| 5 | Notched (unrepaired)-N | 33.0 ± 1.79 | 2.0 ± 0.31 | |
| Epoxy-E | 33.5 ± 1.15 | 2.7 ± 0.52 | ||
| Impregnant-I | 32.5 ± 0.52 | 1.9 ± 0.22 | ||
| Epoxy/impregnant-E and I | 33.5 ± 0.25 | 3.3 ± 0.12 |
| Target Strength (MPa) | Notch Width (mm) | Repair Method | Carbonation Depth (mm) | Carbonation Velocity (mm/y) | ||
|---|---|---|---|---|---|---|
| 1 Week | 4 Weeks | 1 Week | 4 Weeks | |||
| 20 | - | Intact (no notch)-NN | 6.1 ± 1.25 | 9.4 ± 2.12 | 2.3 ± 1.36 | 1.8 ± 0.11 |
| 2 | Notched (unrepaired)-N | 10.4 ± 0.88 | 14.7 ± 1.85 | 3.9 ± 0.81 | 2.8 ± 0.24 | |
| Epoxy-E | 11.9 ± 1.22 | 13.4 ± 2.73 | 4.5 ± 1.20 | 2.5 ± 0.36 | ||
| Impregnant-I | 8.7 ± 1.86 | 13.4 ± 1.45 | 3.3 ± 1.33 | 2.5 ± 1.14 | ||
| Epoxy/impregnant-E and I | 9.2 ± 2.19 | 9.9 ± 0.95 | 3.5 ± 1.24 | 1.9 ± 0.36 | ||
| 5 | Notched (unrepaired)-N | 12.7 ± 0.45 | 13.9 ± 2.40 | 4.8 ± 0.14 | 2.6 ± 1.01 | |
| Epoxy-E | 9.4 ± 2.39 | 13.3 ± 1.79 | 3.5 ± 0.31 | 2.5 ± 0.5 | ||
| Impregnant-I | 8.9 ± 3.10 | 13.5 ± 2.33 | 3.4 ± 0.47 | 2.6 ± 1.14 | ||
| Epoxy/impregnant-E and I | 11.5 ± 1.46 | 11.7 ± 1.28 | 4.4 ± 0.98 | 2.2 ± 1.03 | ||
| 40 | - | Intact (no notch)-NN | 2.5 ± 1.36 | 4.4 ± 1.42 | 1.0 ± 0.21 | 0.8 ± 0.10 |
| 2 | Notched (unrepaired)-N | 3.6 ± 0.85 | 5.9 ± 0.67 | 1.4 ± 0.36 | 0.9 ± 0.22 | |
| Epoxy-E | 4.4 ± 1.65 | 6.1 ± 2.17 | 1.7 ± 0.61 | 1.2 ± 0.35 | ||
| Impregnant-I | 2.1 ± 0.32 | 7.6 ± 2.74 | 0.8 ± 0.14 | 1.4 ± 0.53 | ||
| Epoxy/impregnant-E and I | 1.6 ± 0.11 | 5.8 ± 1.70 | 0.6 ± 0.03 | 1.1 ± 0.24 | ||
| 5 | Notched (unrepaired)-N | 2.2 ± 0.47 | 6.6 ± 1.11 | 0.8 ± 0.21 | 1.3 ± 0.64 | |
| Epoxy-E | 3.4 ± 0.54 | 7.4 ± 0.87 | 1.3 ± 0.13 | 1.4 ± 0.24 | ||
| Impregnant-I | 1.5 ± 0.14 | 6.9 ± 2.87 | 0.6 ± 0.22 | 1.3 ± 0.41 | ||
| Epoxy/impregnant-E and I | 1.6 ± 0.43 | 5.9 ± 2.54 | 0.6 ± 0.10 | 1.1 ± 0.32 | ||
| Target Strength (MPa) | Notch Width (mm) | Repair Method | Chloride Depth (mm) | Diffusion Coefficient (m2/s) |
|---|---|---|---|---|
| 20 | - | Intact (no notch)-NN | 30.5 ± 0.94 | |
| 2 | Notched (unrepaired)-N | 21.8 ± 7.48 | ||
| Epoxy-E | 31.6 ± 2.02 | |||
| Impregnant-I | 9.5 ± 0.41 | |||
| Epoxy/impregnant-E and I | 10.0 ± 0.95 | |||
| 5 | Notched (unrepaired)-N | 19.3 ± 5.92 | ||
| Epoxy-E | 29.4 ± 1.72 | |||
| Impregnant-I | 7.7 ± 2.07 | |||
| Epoxy/impregnant-E and I | 9.4 ± 0.66 | |||
| 40 | - | Intact (no notch)-NN | 23.0 ± 1.62 | |
| 2 | Notched (unrepaired)-N | 13.4 ± 3.07 | ||
| Epoxy-E | 18.5 ± 2.71 | |||
| Impregnant-I | 6.5 ± 0.66 | |||
| Epoxy/impregnant-E and I | 8.1 ± 1.47 | |||
| 5 | Notched (unrepaired)-N | 13.7 ± 2.14 | ||
| Epoxy-E | 15.0 ± 1.87 | |||
| Impregnant-I | 7.9 ± 1.59 | |||
| Epoxy/impregnant-E and I | 9.5 ± 0.65 |
| Target Strength (MPa) | Notch Width (mm) | Repair Method | Relative Dynamic Elastic Modulus (%) | Compressive Strength (MPa) | ||
|---|---|---|---|---|---|---|
| 100 Cycle | 200 Cycle | 300 Cycle | ||||
| 20 | - | Intact (no notch)-NN | - | - | - | - |
| 2 | Notched (unrepaired)-N | 90.8 ± 0.74 | 84.6 ± 1.80 | 78.2 ± 0.96 | 17.5 ± 0.66 | |
| Epoxy-E | 96.5 ± 1.62 | 94.5 ± 2.36 | 82.9 ± 2.14 | 19.2 ± 1.74 | ||
| Impregnant-I | 98.8 ± 1.22 | 93.8 ± 1.81 | 88.1 ± 0.57 | 18.4 ± 1.23 | ||
| Epoxy/impregnant-E and I | 97.9 ± 2.10 | 95.7 ± 2.41 | 90.7 ± 2.59 | 19.1 ± 2.77 | ||
| 5 | Notched (unrepaired)-N | 97.0 ± 5.67 | 90.2 ± 0.78 | 82.5 ± 1.93 | 16.2 ± 0.59 | |
| Epoxy-E | 95.8 ± 1.73 | 92.8 ± 0.74 | 85.8 ± 0.71 | 18.4 ± 1.16 | ||
| Impregnant-I | 95.1 ± 0.45 | 90.8 ± 1.40 | 84.2 ± 1.53 | 17.3 ± 1.40 | ||
| Epoxy/impregnant-E and I | 96.0 ± 4.41 | 91.6 ± 3.27 | 87.3 ± 1.90 | 18.7 ± 0.74 | ||
| 40 | - | Intact (no notch)-NN | - | - | - | - |
| 2 | Notched (unrepaired)-N | 96.7 ± 2.58 | 90.7 ± 1.93 | 84.9 ± 2.57 | 29.6 ± 2.41 | |
| Epoxy-E | 97.2 ± 3.62 | 98.8 ± 2.36 | 93.0 ± 3.05 | 32.7 ± 0.68 | ||
| Impregnant-I | 96.5 ± 1.75 | 91.2 ± 3.13 | 88.2 ± 2.00 | 29.8 ± 0.37 | ||
| Epoxy/impregnant-E and I | 96.0 ± 2.48 | 93.4 ± 2.63 | 92.2 ± 3.33 | 34.9 ± 1.41 | ||
| 5 | Notched (unrepaired)-N | 95.7 ± 2.00 | 89.1 ± 2.98 | 82.7 ± 2.22 | 27.9 ± 1.37 | |
| Epoxy-E | 92.7 ± 2.90 | 88.8 ± 2.73 | 87.0 ± 2.04 | 32.2 ± 0.97 | ||
| Impregnant-I | 98.8 ± 1.22 | 93.8 ± 1.81 | 91.7 ± 1.19 | 28.8 ± 0.38 | ||
| Epoxy/impregnant-E and I | 94.9 ± 2.25 | 94.9 ± 2.02 | 95.4 ± 1.86 | 35.7 ± 1.09 | ||
Publisher’s Note: MDPI stays neutral with regard to jurisdictional claims in published maps and institutional affiliations. |
© 2021 by the authors. Licensee MDPI, Basel, Switzerland. This article is an open access article distributed under the terms and conditions of the Creative Commons Attribution (CC BY) license (http://creativecommons.org/licenses/by/4.0/).
Share and Cite
Kim, T.-K.; Park, J.-S. Experimental Evaluation of the Durability of Concrete Repair Materials. Appl. Sci. 2021, 11, 2303. https://doi.org/10.3390/app11052303
Kim T-K, Park J-S. Experimental Evaluation of the Durability of Concrete Repair Materials. Applied Sciences. 2021; 11(5):2303. https://doi.org/10.3390/app11052303
Chicago/Turabian StyleKim, Tae-Kyun, and Jong-Sup Park. 2021. "Experimental Evaluation of the Durability of Concrete Repair Materials" Applied Sciences 11, no. 5: 2303. https://doi.org/10.3390/app11052303
APA StyleKim, T.-K., & Park, J.-S. (2021). Experimental Evaluation of the Durability of Concrete Repair Materials. Applied Sciences, 11(5), 2303. https://doi.org/10.3390/app11052303