Abstract
The program material is of great importance for the results of the listening tests on loudspeakers, while the process of how to select the program material remains ambiguous. This paper investigates the criterion for selecting programs suitable for low-frequency perceptual evaluation based on the audio features of the program. A listening test was conducted to identify the more discriminating and revealing programs in the low-frequency range. Based on the listening test results, various characteristics of the programs, including dynamic, timbral, rhythmic, and spectral features, were extracted. Their relationships with the program’s discrimination ability are discussed. The results suggest that programs with a slow and clear rhythm and a smooth and even spectrum in the whole band are more discriminating in detecting the spectral differences in the low frequencies. By using these significant features, a discriminant analysis was performed to predict the ability of the program to reveal the spectral irregularities. The predictive accuracy of the derived discriminant function was 95% in separating the discriminating and undiscriminating programs.
1. Introduction
The selection of program material plays an essential role in designing a listening test on loudspeakers [1,2,3]. Usually, the programs are controlled by the experimenter, as independent variables accounting for the main variation in the experimental data set. In this context, an improper selection of program material may have trouble exciting the interested perceptual differences between the loudspeakers under test, leading to inconclusive results. Or in other cases, some bias may be introduced, causing unreliable conclusions in the subsequent analysis [4]. In order to choose suitable programs, a careful examination of the programs is often needed in the pilot experiment. However, the selection process is usually laborious and time-consuming and is difficult to conduct systematically given the wide variety of listening tests with various purposes [4,5].
The low-frequency performance of loudspeakers proves to be a significant factor affecting the subjective evaluation of sound quality. Previous research [6,7] has shown that about 30% of the listener preference rating of loudspeakers is attributed to factors associated with low-frequency performance. In order to deliver good low-frequency reproduction to the listeners, there has been a lot of research [8,9,10,11,12] into the reproduction of audio at low frequencies in the room, including analyzing the effects of room modes [9,10], developing different bass correction methods [11], and so on. For all these studies, subjective evaluation of the low-frequency reproduction is often needed, which raises the question of how to select proper program material in such subjective evaluation work. The current program selection often applies two criteria. Firstly, the program signal should contain enough energy in the low-frequency range to excite the interested attributes. Secondly, the program signal can reveal the perceptual differences between the loudspeakers under test [1,2,3]. The first criterion is easy to meet by checking the spectrum of the signal, while the second one is much more complicated.
Previous studies [9,10,13,14,15] have demonstrated the important program effects on listeners’ perception of low frequencies. Some programs are better at revealing the perceptual differences among the devices under test, and several features of the program (e.g., spectral, temporal, and musical characteristics) seem to be responsible for it. Olive’s early work [13] reported a method for selecting the most revealing program material among music excerpts, speech signals, and pink noise to evaluate the sound quality. He applied equalizations at four different central frequencies (100 Hz, 500 Hz, 2 kHz, 5 kHz) to the programs, and asked the listeners to match the timbre of the equalized program to the correct equalization curve. The results showed that the long-term average spectrum of a music program is strongly related to the program’s ability to reveal spectral irregularities. Listeners could more easily detect the equalizations added in those programs with broad bandwidth. Recently, Olive has conducted another study on the program effects on sound quality ratings of headphones [14]. Again, the long-term average spectra of the program prove to be a good indicator of the program’s effectiveness as a test signal. Fazenda [9,10] used music samples containing different temporal and tonal content in the subjective evaluation of room modes below 120 Hz. It is found that the content of music stimuli has a significant effect on the detection of modal problems. The music sample with fast-paced notes had trouble revealing perceptual differences between different room control methods [10]. Fazenda attributed this result to the differences in temporal and musical characteristics between the two samples. He also stressed the importance of establishing a proper selection strategy of test samples to extract meaningful and reliable results. Other research [15] regarding the audibility of resonances at low frequencies also provides evidence that the temporal structure of the signal is important for hearing peaks and dips at low frequencies. These results suggest that the features of programs are related to the program’s ability to discriminate between different devices in the listening test. In this respect, by selecting programs with suitable features, the perceptual difference of the interested attributes between different loudspeakers under test could be excited. Moreover, a prediction model based on the features may be built to assess if a program is suitable for the listening test. This approach has already been applied in the field of speech quality evaluation where different models were built based on the audio and video features to enhance speech from a noisy environment [16,17].
Compared with noise signals or some specific synthetic signals, musical signals are more preferred in many listening tests to simulate real-world situations. In recent years, a large number of audio features have been extracted to characterize musical signals from different aspects [18,19,20]. In this work, by using various audio features of the music programs, the program selection criteria for those listening tests regarding the low-frequency evaluation of loudspeakers are investigated. The main research questions are summarized as follows.
(1) Which program materials are better at revealing the spectral differences in the low-frequency range?
(2) What are the common features of these programs?
(3) Is it possible to build a model based on the audio features to predict if the program is suitable for the listening test?
The work methodology was divided into two parts. In the first part, a discrimination test was conducted to evaluate the ability of the programs to reveal the spectral differences in the low-frequency range. Based on the discrimination test results, cluster analysis was performed to separate the programs into two groups: one group contains the more discriminating and revealing programs while the other group is composed of programs with poor performance. In the second part, a discriminant analysis was used to explain and predict the membership of programs to the two groups based on various characteristics of the programs, including dynamic, timbral, rhythmic, and spectral features. The result of the discriminant analysis was validated using the cross-validation method.
The paper is organized as follows: Section 2 describes the listening test used to evaluate the discrimination ability of the programs. Section 3 presents the listening test results and performs cluster analysis on the programs. Section 4 analyzes the relationship between the revealing ability and the characteristics of the programs using discriminant analysis, followed by discussion and conclusions in Section 5 and Section 6 respectively.
2. Materials and Methods
In order to evaluate the ability of programs revealing the spectral irregularities in the low-frequency range, different equalizations were applied to the programs to add the spectral irregularity. A discriminant test was performed where listeners were required to judge if the test signal had been equalized.
2.1. Program Selections
In total, this work examined 20 programs consisting of 19 excerpts of music and one pink noise. Table 1 gives a detailed description of these programs, including the timing of the section, record information, and so on.

Table 1.
Specifications of the program excerpts.
The music excerpts were chosen from various genres and were prescreened to ensure that they all contain sufficient bass content. Most of these program excerpts were commonly used as test signals in previous listening tests. The pink noise was also included as a comparison signal for its well-known ability to reveal spectral defects [21]. Each music excerpt was extracted from the original audio file in the length of 8 or 16 beats to preserve the integrity of phrases. With the tempo of songs being different, the duration of each sample was slightly different around 10 s. According to ITU-R BS.1770-3 [22], all the programs were pretreated by adjusting the average loudness to −17 ± 0.1 LUFS.
2.2. Equalizations
A total of six equalizations in the low-frequency range were used, whose frequency response curves are shown in Figure 1. These equalizations were performed through peak and dip parametric equalizer filters with a constant Q value of 1 at three different central frequencies: 40 Hz, 80 Hz, and 160 Hz. The gain of the filters was set as 6 dB, which was above the audible threshold according to our pilot experiment results.
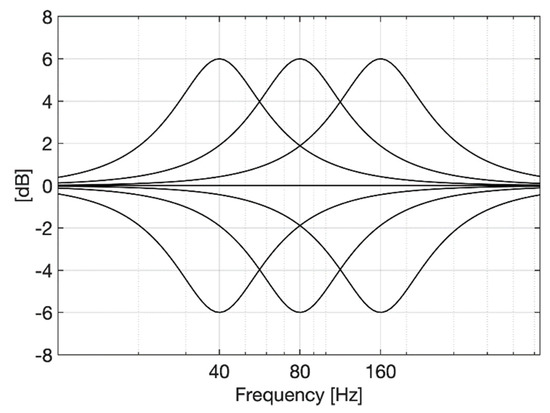
Figure 1.
Frequency responses of the equalizations.
2.3. Listening Panel
The selection of program material was an activity that demanded trained subjects to make reliable judgments [1]. The listening panel was composed of 11 experienced listeners, including eight males and three females. These listeners were all postgraduates majoring in Electro-acoustics at Nanjing University. The average age of the listeners was 24 years, ranging from 23 to 27 years. All of the test subjects reported no hearing damage, and they were all trained through Harman “How to Listen” listener training software [23], reaching high skill levels in identifying the spectral irregularities (8–16 levels, mean 10 levels). All the listeners had extensive previous listening experience, taking part in at least two controlled listening tests in the last year.
2.4. Listening Environment and Loudspeaker
The listening test was performed in a rectangular listening room with a volume of 130.24 m3 (7.4 m × 5.5 m × 3.2 m). The listening room was designed in accordance with the requirements of the IEC/TR 60268-13 [1]. The acoustical treatment of the room consists of a combination of broadband absorption and reflective and diffusive surfaces. The measured reverberation time RT60 falls from 0.6 s to 0.3 s between 63 Hz and 4 kHz.
A pair of JBL Studio S312 and a powered subwoofer JBL Digital 10 were used for reproduction. Figure 2 shows the averaged frequency response curve of three repeated measurements of the loudspeakers. The frequency response was measured at the listening position in the listening room using a log-sweep signal. A CHZ-216 diffuse-field microphone was used for the measurement.
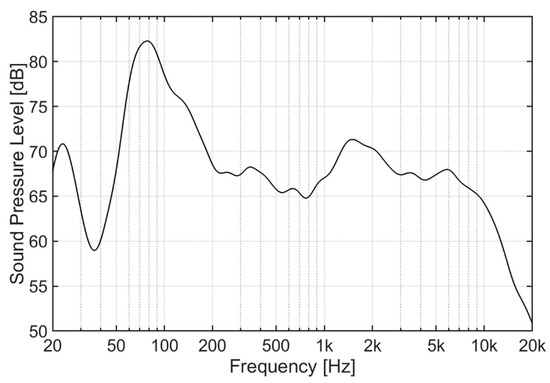
Figure 2.
In-room response of the loudspeakers at the listening location.
The playback level should be representative of normal listening levels. In this work, the playback level was set to 80 dB (B-weighted), which is a typical value for loudspeakers in domestic rooms based on the literature [12].
2.5. Test Procedure
The discrimination test was implemented with a Yes-No experiment design [24]. Figure 3 shows the graphic user interface (GUI) used in the test. In each trial, the reference signal and the test signal are both presented on the GUI, indicated by button A and button B, respectively. The subject’s task was to compare the test signal with the reference signal and determine whether the test signal was the same as the reference signal. Listeners could freely switch between the two signals to compare until they made a choice.
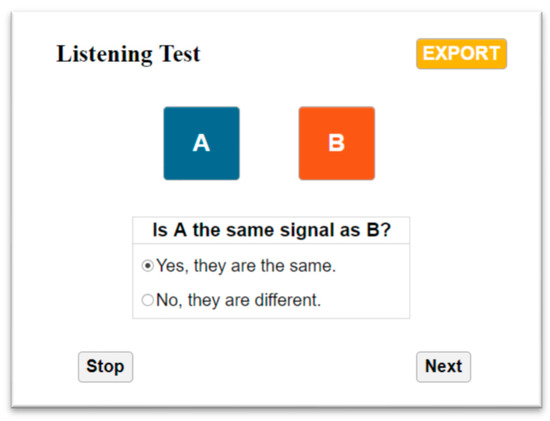
Figure 3.
Graphical user interface used for collecting the test data. Button A represents the reference signal (original program) while button B, as the test signal, is randomly assigned as one of the six equalized versions or the unprocessed version of the program.
In this work, the original program was referred to as the reference signal, and the test signal was randomly assigned as the equalized or unprocessed version of the program. The equalizations could include one of the six peak or dip filters described in Section 2.2. To eliminate the error or bias caused by listeners choosing the “different” answer by default, an equal number of “lures”—test signals that were unprocessed were introduced. Therefore, each program was presented in 12 trials where six equalizations and six repeated original programs were separately used as the test signal.
The test was double-blind, and the order of the trials and the order of the programs presented were randomized. Before the formal test, a training phase was conducted where listeners could get familiar with the GUI and the program material. At a time, only one listener took part in the test in the listening room. After completing the test, listeners were also asked to name the programs they thought difficult or easy to make judgments on during the listening process.
To minimize the impact of test duration on listener fatigue and reliability [25], the whole experiment was composed of four listening sessions with repeated observations performed for each program. Listeners only completed one listening session per day. In total, the listening test was composed of 480 trials (20 programs × 12 trials × 2 observations) for each subject. On average the listening panel spent about 35 min finishing one session. All listeners completed four sessions within one week.
3. Results
3.1. Describing the Discrimination Ability of the Program
According to the signal detection theory [24], measures of performance in the discrimination test are called sensitivity measures: High sensitivity refers to good ability to discriminate while low sensitivity corresponds to poor ability. In this work, the purpose of the Yes-No experiment is to evaluate the program’s sensitivity to the spectral irregularities below 200 Hz.
The Yes-No experiment concerns two kinds of stimulus and two possible responses, leading to four possible types of events, as shown in Table 2. These four events are conventionally termed as Hit, Miss, False alarm, and Correct rejection in the detection theory [24]. Correctly recognizing an equalized test signal is termed a Hit while failing to recognize it is called a Miss. Mistakenly identifying an unprocessed test signal as equalized is termed a False alarm while correctly responding “unprocessed” is a Correct rejection. High sensitivity is indicated by a concentration of trials counted in the upper left and lower right of the table, that is, more Hits and more Correct rejections.

Table 2.
Four types of events in the Yes-No experiment.
For each program, the number of trials of each type was tabulated in Table 2. It could be found that, in this experimental design, the sum of each row was a constant, which is 132 (11 subjects × 6 trials × 2 observations). Hence, of the four numbers of trials of each type in the table, only two provided independent information about the program’s performance. By dividing each number by the sum of the row, two independent variables were obtained to summarize the table: EQ Score (EQ stands for Equalized) and Flat Score. The EQ Score was the proportion of Equalized trials to which the subject responded “A and B are different. (indicating that the test signal is equalized)”, and the Flat Score was the proportion of Unprocessed trials to which the subject responded “A and B are the same. (indicating that the test signal is unprocessed)”. By definition, a higher EQ Score and a higher Flat Score are related to a better discrimination ability of the program.
The EQ Score and Flat Score were calculated for each program to describe the discrimination ability of the program. In addition, the times when the program mentioned was difficult or easy to complete the test in the post-test questionnaire were measured for each program, and then normalized to its upper limit, i.e., 22 (11 subjects × 2 observations), in order to describe the listeners’ subjectively perceived difficulty of the program when conducting the test.
3.2. Cluster Analysis
To further investigate the performance difference between the programs, a cluster analysis [26] was conducted to group the programs based on the similarities in their discrimination ability. Using the EQ Scores and Flat Scores of the programs, an agglomerative hierarchical clustering (AHC) analysis with Ward’s method [26] was performed. The clustering process was illustrated in the dendrogram, as shown in Figure 4. Two major clusters were derived, marked as C1 and C2 separately on the left side of the dendrogram. Among the 20 programs tested, C1 contained 14 programs and C2 contained the remaining six programs.
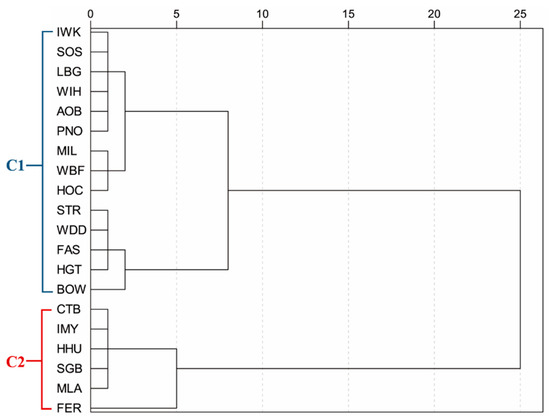
Figure 4.
Dendrogram of the agglomerative hierarchical clustering (AHC) analysis of programs. C1 and C2 represent the two clusters.
According to the cluster results, Figure 5 demonstrates the EQ Score, Flat Score, and listeners’ subjectively perceived difficulty for each program in the two clusters. For the Flat Score, it can be seen that programs in both clusters had high values (all above 85%). While for the EQ Score, the differences between the two clusters were apparent. Programs in C1 showed much higher EQ Scores than the programs in C2. Even the lowest EQ Score in C1 (73.5% for PNO (“Pink Noise”)) was higher than the highest EQ Score in C2, which was 72.0% for HHU (“Heaven Help Us All”) and SGB (“Sweet Georgia Brown”). This result suggested that when the programs in C2 were equalized, listeners usually had trouble detecting the equalizations that applied to these programs. In other words, these programs were poor signals for revealing the low-frequency equalizations.
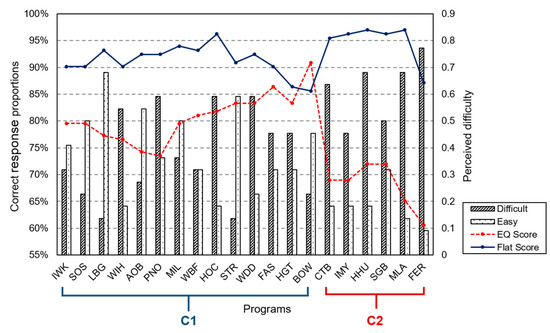
Figure 5.
The EQ Score, Flat Score, and listener’s perceived difficulty for each program. “Difficult” and “Easy” indicate the times of the program mentioned as difficult or easy to conduct the test in the post-test questionnaire. C1 and C2 represent the two clusters.
It was also worth noting that the six programs in C2 were all nominated multiple times as being difficult to make judgments on, as the histograms in Figure 5 shown. In order to examine whether there was a significant difference between the subjectively perceived difficulty of the two program clusters, a one-way analysis of variance (ANOVA) was performed. The result showed that the effect of the cluster was significant at a significance level of 0.01 (Difficult: F(1,18) =10.821, p = 0.004; Easy: F(1,18) = 10.665, p = 0.004), indicating that programs in C2 were significantly distinguished from programs in C1 in the listeners’ subjective assessment of the task difficulty.
Considering both the EQ Score performance and listeners’ assessment of the task difficulty for each program, programs in C1 were regarded as the more revealing programs for detecting low-frequency spectral irregularities whereas those in C2 were not.
4. Analysis of Program Clusters Based on Audio Features
In Section 3, the programs are separated into two groups: group C1 contains the more discriminating and revealing programs while group C2 is composed of programs with poor discrimination ability, which answers the first research question.
The purpose of the following analysis is to answer the second and third research questions, that is, to identify the significant features which relate to the program’s discrimination ability and also to build a model to predict if the program is suitable for the listening test.
In order to investigate the relationship between the program cluster results and the audio features of the programs, various features of these programs were extracted. Those features that significantly differed across the program clusters were teased out and then used in the discriminant analysis to build a predictive model.
4.1. Feature Extraction
In total, 25 features in different dimensions including dynamics, rhythm, timbre, and spectrum were extracted for each program excerpt. Many feature extraction tasks were aided by the MIRtoolbox [18]. Table 3 presents the list of the extracted features, and also the ANOVA results evaluating if significant differences in these features exist between different program clusters.

Table 3.
The list of extracted features and one-way analysis of variance (ANOVA) results.
These features are often used to characterize a segment of audio [18,19,20,27,28,29,30,31,32]. In the dynamic dimension, the root-mean-square (RMS) and peak value were measured to describe the amplitude of the signal. The crest factor, which is the ratio of peak to RMS value, was calculated to evaluate how dynamic the program is. The low energy rate [28] is the percentage of frames showing less-than-average energy, which assesses the temporal distribution of energy. In the rhythmic dimension, tempo describes the periodicities of the signal, and pulse clarity [32] estimates the rhythmic clarity, suggesting how easily listeners can perceive the underlying pulsation of the program. In the timbral dimension, several features (e.g., attack time, attack slope, decay time, decay slope) were calculated based on the temporal energy envelope [19], describing the attack phase and decay phase separately. The duration feature [20] estimates the duration of each successive event, distinguishing percussive sounds from sustained sounds. The zero-crossing rate measures the number of times the signal crosses the zero axis. In the spectral dimension, the energy distribution was determined using a bank of filters. The full band was divided into seven bands: frequencies below 50 Hz, 50 Hz to 100 Hz, 100 Hz to 200 Hz, 200 Hz to 400 Hz, 400 Hz to 800 Hz, 800 Hz to 1600 Hz, and frequencies above 1600 Hz. The proportion of the energy of each filtered output to the total energy was calculated. In Table 3, these features are labeled with the prefix BE, which stands for Band Energy. In addition, some statistical features describing the shape of the spectrum (e.g., skewness, kurtosis, flatness, centroid, spread, roll-off) were also extracted.
As listed in Table 3, among the 25 features, seven features (highlighted in bold) were found significantly differentiated between the two clusters (where p < 0.05, marked with an asterisk), namely the rhythmic features tempo and pulse clarity, and the spectral features BE 400–800, BE 800–1600, BE > 1600, skewness, and kurtosis. The skewness and kurtosis measure the asymmetry and flatness of the spectrum around its mean value, respectively. The significant effects of these features indicate that these features are possibly related to the ability of the program to reveal spectral irregularities in the low-frequency range. The other features that do not differ across the groups would be of little use in the following discriminant analysis and therefore ignored.
4.2. Principal Component Analysis
The Principal Component Analysis (PCA) is a classic dimension-reduction technique, which can create an entirely new set of variables with a reduced number but also retain the nature and character of the original variables [26]. PCA is often used in the preprocessing of the data. In this work, the predictive model of the program’s discrimination ability is built by using the linear discriminant analysis (LDA). Before using the seven significant features as the independent variables in the discriminant analysis, it was found that some of these features were highly correlated (e.g., skewness and kurtosis: r = 0.945, p < 0.001; BE > 1600 and skewness: r = −0.864, p < 0.001). The strong correlation indicates that multicollinearity exists among the seven features, which contradicts the assumption of discriminant analysis [26]. To solve the problem, a PCA was performed to reduce the dimensions of the feature space so that the assumption of discriminant analysis could be met.
The appropriateness of PCA was examined by the Bartlett test of sphericity and the Kaiser-Meyer-Olkin measure of sampling adequacy. The Bartlett test of sphericity tests the overall significance of the correlation matrix, which finds that the correlations between these features are significant at the 0.001 level ( = 101.04, p < 0.001). The Kaiser-Meyer-Olkin measure of sampling adequacy (MSA) quantifies the degree of intercorrelations among the features. The MSA value is 0.613, which is above the recommended value of 0.5 [26]. Both test results indicated that the PCA would be useful.
In order to determine the number of components extracted, both the latent root criterion and the scree test criterion were used, and the results were the same. The latent root criterion only keeps components having eigenvalues greater than 1. The scree test criterion determines the cutoff point from the shape of the scree plot. Figure 6 shows the scree plot which plots the eigenvalue against the number of components in their extraction order. Obviously, the first two components have eigenvalues greater than 1, and from the third component, the curve begins to straighten out. Therefore, the first two principal components are considered significant and shall be kept.
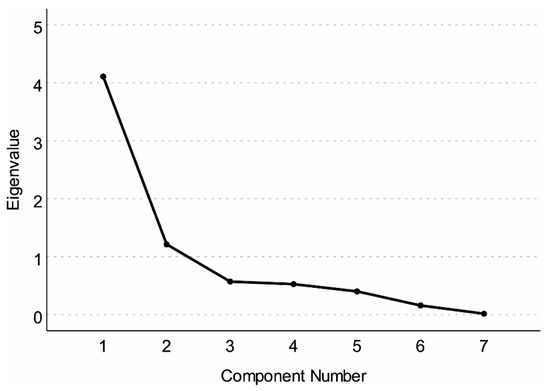
Figure 6.
The scree plot of Principal Component Analysis (PCA).
The Varimax rotation method was applied to interpret the two components better. The result of PCA shows that the first two principal components explain 76.04% of the variance across features in which the first component accounts for 53.67%, and the second component explains the left 22.37%. Table 4 presents the coefficient matrix to compute the two principal component scores.

Table 4.
The coefficient matrix of PCA.
Figure 7 shows the correlation between the seven features and the two principal components. A longer vector represents that the feature is more correlated with the two components. By comparing the projections of the feature vector on Component 1 and Component 2 axes, the component to which the feature is more correlated can be determined. In addition, when two features are close in the correlation map, they are highly correlated (e.g., skewness and kurtosis). It can be seen that five features (i.e., BE > 1600, pulse clarity, kurtosis, skewness, and BE 400–800) are more associated with Component 1. In particular, BE > 1600 and pulse clarity show negative correlations with Component 1 while others are positively related to the component. BE 800–1600 is correlated to both components. It is also notable that tempo shows a strong correlation with Component 2 and is barely related to Component 1. As described above, BE > 1600, BE 400–800, and BE 800–1600 represent the proportion of energy in that specific band. Kurtosis and skewness describe the shape of the spectrum. Pulse clarity, although as a rhythmic feature, indicates the strength of the beats in the music. Hence, it can be safely drawn that the first principal component (Component 1) represents features describing the energy distribution of the program from different aspects. In contrast, the second principal component (Component 2) mainly represents the rhythm of the program.
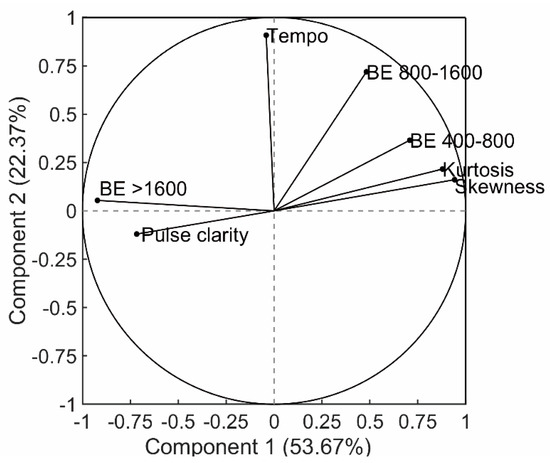
Figure 7.
The correlation between the original features and the two principal components.
The distribution of all 20 programs in the component map is demonstrated in Figure 8. The two program clusters are distributed on different parts of the map, suggesting that the two program clusters can be separated using the two principal components.
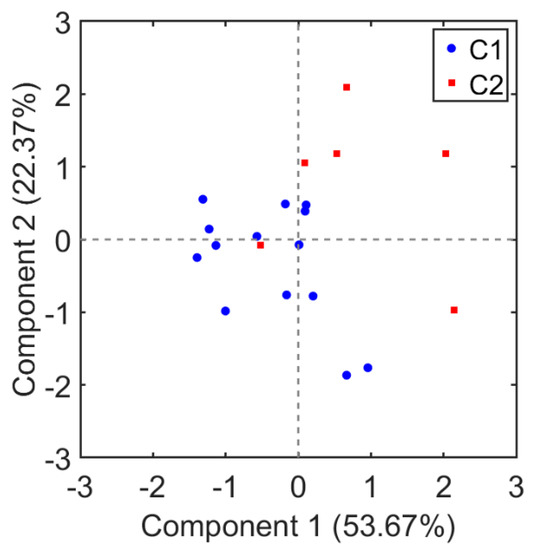
Figure 8.
Distribution of the two program clusters in the component map.
4.3. Discriminant Analysis
Discriminant analysis is often used to differentiate among groups based on a combination of independent variables [26]. The discriminant function is formed to create scores for each observation that maximally distinguishes between groups of observations.
In this work, a two-group discriminant analysis was performed in SPSS using the program group as the dependent variable and the two principal components as the independent variables. One discriminant function was formed to predict and explain each program’s membership.
The underlying assumptions of discriminant analysis were tested and met at acceptable levels. The equality of covariance matrices of the independent variables across the groups was supported by the Box’s M (p = 0.486). The normality of the independent variables was tested by the Kolmogorov-Smirnov method (p = 0.2).
One discriminant function was derived, taking the following form:
where
- Discriminant score for the program i
- , Discriminant function coefficients (Here , )
- , The two component scores for the program i
According to the function, the discriminant score of each program can be calculated. The group mean of the discriminant score, defined as the group centroid, is also calculated, shown in Table 5. The membership of the program can be determined by comparing the discriminant score to the cutting score which represents the dividing point used to classify programs. The cutting score is measured based on the group centroid and the relative size of the two groups [20]. In this case, the cutting score was calculated as 0.9371. Thus, programs with a discriminant score less than 0.9371 were classified into C1, and programs with a discriminant score greater than 0.9371 were classified into C2.

Table 5.
The group centroids of the discriminant function.
The discriminant function was validated by the cross-validation approach. Table 6 shows the classification results for both original grouped cases and cross-validated grouped cases.

Table 6.
Classification results.
As can be seen, the predictive accuracy was 95% for the original grouped samples and 90% for the cross-validated grouped samples. The achieved accuracy was evaluated using the proportional chance criterion [26]. Usually, the predictive accuracy should exceed the proportional chance by 25% to prove its effectiveness. In this case, the proportional chance criterion is calculated as (14/20)^2 + (6/20)^2 = 58%, and the comparison threshold value is 72.5% (58% × 1.25 = 72.5%). In both the original analysis sample and the cross-validated sample, the predictive accuracy level is above the threshold value, which validates the discriminant function.
The Wilks’ Lambda test examined the significance of the discriminant function, showing that the function is statistically significant in separating the clusters (Wilks’ Lambda = 0.445, p = 0.001).
In summary, using the two principal components extracted from the seven significant features, one discriminant function was derived, which could significantly separate the discriminating and undiscriminating program clusters with 95% classification accuracy.
5. Discussion
The present work investigates the criterion for selecting programs for those listening tests focusing on the low-frequency evaluation of loudspeakers. The hypothesis of this work is that some features of the program are related to its ability to reveal the perceptual differences between different devices under test. Therefore, by analyzing the relationship between the program features and the discrimination ability of the program, a predictive model could be built to estimate if the program is suitable for the task.
Figure 9 summarizes the whole work methodology. The methodology can be divided into two parts. In the first part, a listening test was conducted to assess the discrimination ability of the programs in the low-frequency range. The examined programs were classified into two groups: C1 with programs better at revealing the spectral equalization in the low-frequency range and C2 with programs poor at detecting the equalizations. In the second part, some statistical analysis methods were applied to identify the significant audio features related to the discrimination ability of the program, and also to build a predictive model which could estimate if the program is suitable for the listening tests. Seven features were found to significantly differentiate between the two program groups. In order to minimize the effect of multicollinearity in these significant features on the result of discriminant analysis, a PCA was first performed, extracting two independent principal components that represent the energy-related features and the rhythmic features respectively. Based on the two components, a statistically significant discriminant function was derived, which calculates the discriminant score for each program. By comparing the discriminant score to the cutting score, the group membership of the program could be predicted.

Figure 9.
Schematic representation of the work methodology.
It should be noted that the whole methodology shown in Figure 9 could be used for selecting program material for other perceptual evaluation tasks with different purposes, such as evaluating the quality of high-frequency or across-all-frequency reproductions of the loudspeakers or other time-domain related parameters like clarity. The point is that for evaluation tasks with different purposes, the first part of the methodology should be carefully designed accordingly. The objective of the listening test in the first part is to evaluate the ability of the programs to reveal differences among the devices under test. In this work, six equalizations in the low-frequency range were applied to the programs. For other perceptual evaluation tasks, the experiment setup should be modified to fit the research objective.
In this section, the effects of the two principal components and the seven features on characterizing the two program groups are discussed.
5.1. The Effects of the Two Principal Components
As discussed above, the first principal component describes the energy-related features of the program while the second principal component represents the rhythmic features. To understand the effect of the two principal components in separating the discriminating and undiscriminating program clusters, the discriminant loadings of the two components are shown in Table 7.

Table 7.
Discriminant loadings of the two principal components.
Discriminant loading measures the correlation between the independent variables and the discriminant score, which assesses the contribution of each variable to the discriminant function. According to a rule of thumb [26], the variables with loadings above ±0.4 are thought to be substantively discriminating. Additionally, by comparing the discriminant loadings of the two components, the relative importance of the components in differentiating between the groups can be determined.
As shown in Table 7, both components have a strong effect, although Component 1 is more important. The result indicates that both the energy-related features and the rhythmic features have notable effects in explaining the program classification, and the energy-related features have more influence than the rhythmic features.
5.2. The Effects of the Seven Audio Features
In order to characterize the two program clusters, the group means of each feature are presented in Table 8. The profiles of the two program clusters described by these features can be summarized. Compared to the C2 group which contains programs with poor discrimination ability, the C1 group has a lower tempo and higher pulse clarity. This suggests that programs whose rhythm is slow and clear are possibly the right test signals for revealing the spectral irregularities in the low-frequency range, which supports previous research findings by Fazenda [10].

Table 8.
Group means of the seven features.
To more clearly show the effects of BE 400–800, BE 800–1600, and BE > 1600, the average one-third octave spectral curves of the two program clusters are presented in Figure 10. The C2 group has higher BE 400–800 and BE 800–1600 values and smaller BE > 1600 value, shown in Figure 10 as the more energy distribution in the band 400 Hz to 1600 Hz, and less high-frequency content. By contrast, the C1 group has a smoother and uniform spectrum in the whole band. The result is consistent with previous work [13] which demonstrates that programs with flat and extended-spectrum can reveal the spectral irregularities more easily.
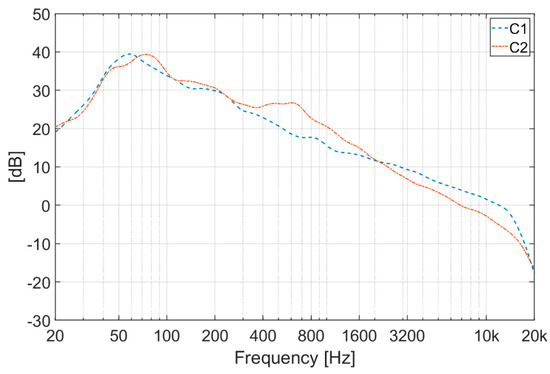
Figure 10.
One-third octave spectral averages of the programs in C1 and C2.
Kurtosis and skewness describe the shape of the spectrum, and higher values suggest that there are more extreme values far away from the mean in the spectral distribution. As shown in Table 8, the C2 group has higher values on the two features, indicating that the programs in C2 have a leptokurtic and asymmetric spectral energy distribution.
Therefore, the profile of the two program clusters based on the features are as follows:
C1 (the discriminating program cluster) has a slower and clearer rhythmic feature, with a smooth and even spectrum.
C2 (the undiscriminating program cluster) has a quicker tempo, lower pulse clarity, and uneven spectral energy distribution.
The three research questions raised in Section 1 could now be answered.
Question 1: Among the 20 programs analyzed, the programs in the C1 group are better at revealing the spectral differences in the low-frequency range.
Question 2: The more discriminating programs have some common characteristics in the energy-related features and rhythmic features. To be specific, these programs have a slower and clearer rhythmic feature and a smooth and even spectrum.
Question 3: It is possible to apply a predictive model to estimate the program’s revealing ability. This method would be helpful in the selection of program material.
6. Conclusions
This work analyzes the program selection criterion based on the audio features of the programs for the listening tests evaluating the low-frequency reproduction of loudspeakers. Twenty programs were classified into two groups based on their performance in the discrimination test. In order to characterize the two program clusters using features of the program, a discriminant analysis was performed. The relationships between the revealing ability of the program and the program features are also discussed.
The main findings are as follows:
- Some programs were more revealing in detecting the spectral irregularities in the low-frequency range and could ease the task difficulty for the listeners. Both the percentage of correct responses from the discrimination test and the listeners’ subjectively perceived difficulty of conducting the test confirm it. This finding emphasizes the importance of choosing suitable programs for the perceptual evaluation task.
- Of the 25 audio features examined in this work, only seven features have significant differences between the two program groups. The more discriminating group has a slow and clear rhythmic feature and a smooth and even spectrum. In contrast, the undiscriminating group has a quicker tempo with lower pulse clarity and an uneven spectrum. Such information would hopefully help the selection of programs for listening tests focusing on low frequencies in future work.
- Based on the seven significant features, a discriminant function is presented, which could predict the group membership of the programs with an accuracy of 95%. This discriminant function would also be expected to aid the selection of programs in future studies.
Author Contributions
Conceptualization, P.Y., X.F., Z.L. and Y.S.; methodology, P.Y., S.Z., X.F. and Z.L.; formal analysis, P.Y.; investigation, P.Y. and S.Z.; visualization, P.Y.; writing—original draft preparation, P.Y.; writing—review and editing, P.Y., S.Z., X.F., Z.L. and Y.S.; supervision, project administration, funding acquisition, Y.S. All authors have read and agreed to the published version of the manuscript.
Funding
This work was supported by National Key R&D Program of China 2018YFB1403800.
Institutional Review Board Statement
Not applicable.
Informed Consent Statement
Not applicable.
Data Availability Statement
Not applicable.
Acknowledgments
The authors would like to thank the listeners who participated in this study.
Conflicts of Interest
The authors declare no conflict of interest.
References
- IEC/TR 60268-13. Sound System Equipment Part 13: Listening Tests on Loudspeakers; International Electrotechnical Commission (IEC): Geneva, Switzerland, 1998. [Google Scholar]
- Recommendation ITU-R BS 1116-3. Methods for the Subjective Assessment of Small Impairments in Audio Systems; International Telecommunication Union (ITU): Geneva, Switzerland, 2015. [Google Scholar]
- Recommendation ITU-R BS 1534-3. Method for the Subjective Assessment of Intermediate Quality Level of Audio Systems; International Telecommunication Union (ITU): Geneva, Switzerland, 2015. [Google Scholar]
- Bech, S.; Zacharov, N. Perceptual Audio Evaluation- Theory, Method and Application; John Wiley & Sons Ltd.: Sussex, UK, 2006. [Google Scholar]
- Ekeroot, J.; Berg, J.; Nykänen, A. Selection of audio stimuli for listening tests. In Proceedings of the 130th AES Convention, London, UK, 13–16 May 2011. [Google Scholar]
- Olive, S.E. A multiple regression model for predicting loudspeaker preference using objective measurements: Part II—Development of the model. In Proceedings of the 117th AES Convention, San Francisco, CA, USA, 28–31 October 2004. [Google Scholar]
- Olive, S.E. A multiple regression model for predicting loudspeaker preference using objective measurements: Part I—Listening test results. In Proceedings of the 116th AES Convention, Berlin, Germany, 8–11 May 2004. [Google Scholar]
- Toole, F.E. Sound Reproduction: Loudspeakers and Rooms; Elsevier Ltd.: Burlington, MA, USA, 2008. [Google Scholar]
- Fazenda, B.M.; Stephenson, M.; Goldberg, A. Perceptual thresholds for the effects of room modes as a function of modal decay. J. Acoust. Soc. Am. 2015, 137, 1088–1098. [Google Scholar] [CrossRef] [PubMed]
- Fazenda, B.M.; Wankling, M.; Hargreaves, J.; Elmer, L.; Hirst, J. Subjective preference of modal control methods in listening rooms. J. Audio Eng. Soc. 2012, 60, 338–349. [Google Scholar]
- Cecchi, S.; Carini, A.; Spors, S. Room response equalization-A review. Appl. Sci. 2018, 8, 16. [Google Scholar] [CrossRef]
- Bech, S. Requirements for low-frequency sound reproduction, part I: The audibility of changes in passband amplitude ripple and lower system cutoff frequency and slope. J. Audio Eng. Soc. 2002, 50, 564–580. [Google Scholar]
- Olive, S.E. A method for training listeners and selecting program material for listening tests. In Proceedings of the 97th AES Convention, San Francisco, CA, USA, 10–13 November 1994. [Google Scholar]
- Olive, S.E.; Welti, T.; Khonsaripour, O. The influence of program material on sound quality ratings of in-ear headphones. In Proceedings of the 142nd AES Convention, Berlin, Germany, 20–23 May 2017. [Google Scholar]
- Olive, S.E.; Schuck, P.L.; Ryan, J.G.; Sally, S.L.; Bonneville, M.E. The detection thresholds of resonances at low frequencies. J. Audio Eng. Soc. 1997, 45, 116–128. [Google Scholar]
- Gogate, M.; Dashtipour, K.; Adeel, A.; Hussain, A. CochleaNet: A robust language-independent audio-visual model for real-time speech enhancement. Inf. Fusion 2020, 63, 273–285. [Google Scholar] [CrossRef]
- Gogate, M.; Dashtipour, K.; Hussain, A. Visual speech in real noisy environments (VISION): A novel benchmark dataset and deep learning-based baseline system. Proc. Interspeech 2020, 2020, 4521–4525. [Google Scholar]
- Lartillot, O.; Toiviainen, P.; Eerola, T. A Matlab toolbox for music information retrieval. In Data Analysis, Machine Learning and Applications; Springer: Berlin/Heidelberg, Germany, 2008; pp. 261–268. [Google Scholar]
- Peeters, G.; Giordano, B.L.; Susini, P.; Misdariis, N.; McAdams, S. The timbre toolbox: Extracting audio descriptors from musical signals. J. Acoust. Soc. Am. 2011, 130, 2902–2916. [Google Scholar] [CrossRef] [PubMed]
- Peeters, G. A large set of audio features for sound description (similarity and classification) in the CUIDADO project. CUIDADO IST Proj. Rep. 2004, 54, 1–25. [Google Scholar]
- Toole, F.E.; Olive, S.E. The modification of timbre by resonances: Perception and measurement. J. Audio Eng. Soc. 1988, 36, 122–142. [Google Scholar]
- Recommendation ITU-R BS 1770-3. Algorithms to Measure Audio Programme Loudness and True-Peak Audio Level; International Telecommunication Union (ITU): Geneva, Switzerland, 2012. [Google Scholar]
- Harman How to Listen: A Listener Training Software Application. Available online: http://harmanhowtolisten.blogspot.com/2011/01/welcome-to-how-to-listen.html (accessed on 30 January 2021).
- Macmillan, N.A.; Creelman, C.D. Detection Theory: A User’s Guide, 2nd ed.; Lawrence Erlbaum Associates: Mahwah, NJ, USA, 2005. [Google Scholar]
- Schatz, R.; Egger, S.; Masuch, K. The impact of test duration on user fatigue and reliability of subjective quality ratings. J. Audio Eng. Soc. 2012, 60, 63–73. [Google Scholar]
- Hair, J.F.; Black, W.C.; Babin, B.J.; Anderson, R.E. Multivariate Data Analysis, 7th ed.; Pearson Education Limited: Essex, UK, 2013. [Google Scholar]
- Chapman, P.J. Programme material analysis. In Proceedings of the 100th AES Convention, Copenhagen, Denmark, 11–14 May 1996. [Google Scholar]
- Tzanetakis, G.; Cook, P. Musical genre classification of audio signals. IEEE Trans. Speech Audio Proc. 2002, 10, 293–302. [Google Scholar] [CrossRef]
- Benjamin, E. Characteristics of musical signals. In Proceedings of the 97th AES Convention, San Francisco, CA, USA, 10–13 November 1994. [Google Scholar]
- Wilson, A.; Fazenda, B.M. Perception of audio quality in productions of popular music. J. Audio Eng. Soc. 2016, 64, 23–34. [Google Scholar] [CrossRef]
- Dorochowicz, A.; Kostek, B. A study on of music features derived from audio recordings examples—A quantitative analysis. Arch. Acoust. 2018, 43, 505–516. [Google Scholar]
- Lartillot, O.; Eerola, T.; Toiviainen, P.; Fornari, J. Multi-Feature modeling of pulse clarity: Design, validation and optimization. In Proceedings of the 9th International Conference on Music Information Retrieval, Philadelphia, PA, USA, 14–18 September 2008. [Google Scholar]
Publisher’s Note: MDPI stays neutral with regard to jurisdictional claims in published maps and institutional affiliations. |
© 2021 by the authors. Licensee MDPI, Basel, Switzerland. This article is an open access article distributed under the terms and conditions of the Creative Commons Attribution (CC BY) license (http://creativecommons.org/licenses/by/4.0/).