1. Introduction
The full tensile response of reinforced concrete, within service limit state (Laterza et al., 2014 [
1], Rousakis and Karabinis 2012 [
2]), includes, but is not limited to, plain concrete softening, which relates the reduction in tensile stresses to the extension of cracks, reinforced concrete stiffening and shrinkage effects. Other parameters might be aggregate size, concrete-steel bond slip mechanism, creep effects and cyclic loading. However, most of the researchers consider the tension stiffening to be the main parameter when describing the reinforced concrete tensile behavior beyond the cracking strain. Therefore, these other parameters were considered beyond the scope of the present paper. Plain concrete tension softening was first presented by Hillerborg et al. (1976) [
3] who introduced the softening phenomenon through discrete crack model based on fracture mechanics. A series of analytical approaches were introduced after that based on the smeared crack approach, which is more applicable than the discrete crack approach for efficient implementation in nonlinear analysis. In addition, a number of experimental studies were performed to qualify concrete in tensile uniaxial tests.
On the other hand, many researchers proposed empirical functions to estimate the tension stiffening effects. Leonhardt (1977) [
4] presented a model for computing the mean strains. Between two cracked sections, the average steel strain over the entire length (ɛ
sm), is less than the bare bar strain (ɛ
s) which is the strain developed by the steel alone after cracking. The difference between (ɛ
s) and (ɛ
sm) is referred to as “tension stiffening”. Several structural codes followed Leonhardt approach with different parameters like British standards BS 8110-1997 [
5] and Eurocode2 (2004) [
6].
A different approach is to estimate the tension stiffening effects by assuming a stress–strain profile beyond the cracking point of concrete. This profile includes numerical parameters calibrated against the global experimental response of beams or tensile specimens. Scanlon and Murray (1974) [
7] were the first to model the tension stiffening in terms of the degraded concrete modulus. Vebo and Ghali (1977) [
8] proposed a linear and a bilinear descending curve in their analysis of concrete slabs. Nayal and Rasheed (2006) [
9] adopted a bilinear descending function with a sudden drop of 20% of the cracking strength right at the cracking strain—see
Figure 1. It is important to note here that all of the earlier tension stiffening models completely degrade the concrete contribution at a multiple of the cracking strain while this parameter seems to be related to the yielding strain of steel.
In this study, the latter approach to the modeling of the tension stiffening effects is adopted to develop a newly calibrated model composed of a single mathematical expression. The controlling parameters, of a mathematical function postulated herein, are calibrated based on close agreements (minimized error) between the nonlinear numerical and the experimental load–deflection response of a set of tested beams. The mathematical function is descending in nature, like all known tension stiffening models, but the present one is fully controlled by two parameters—namely, the initial drop in stress due to fracture energy released upon cracking as well as the vanishing effect of tension stiffening contribution, as it correlates to steel yielding strain. The resulting analysis procedure lends itself to analytical formulation of the entire nonlinear sectional response as presented in this paper.
2. Flexural Formulation
2.1. Constitutive Models Used
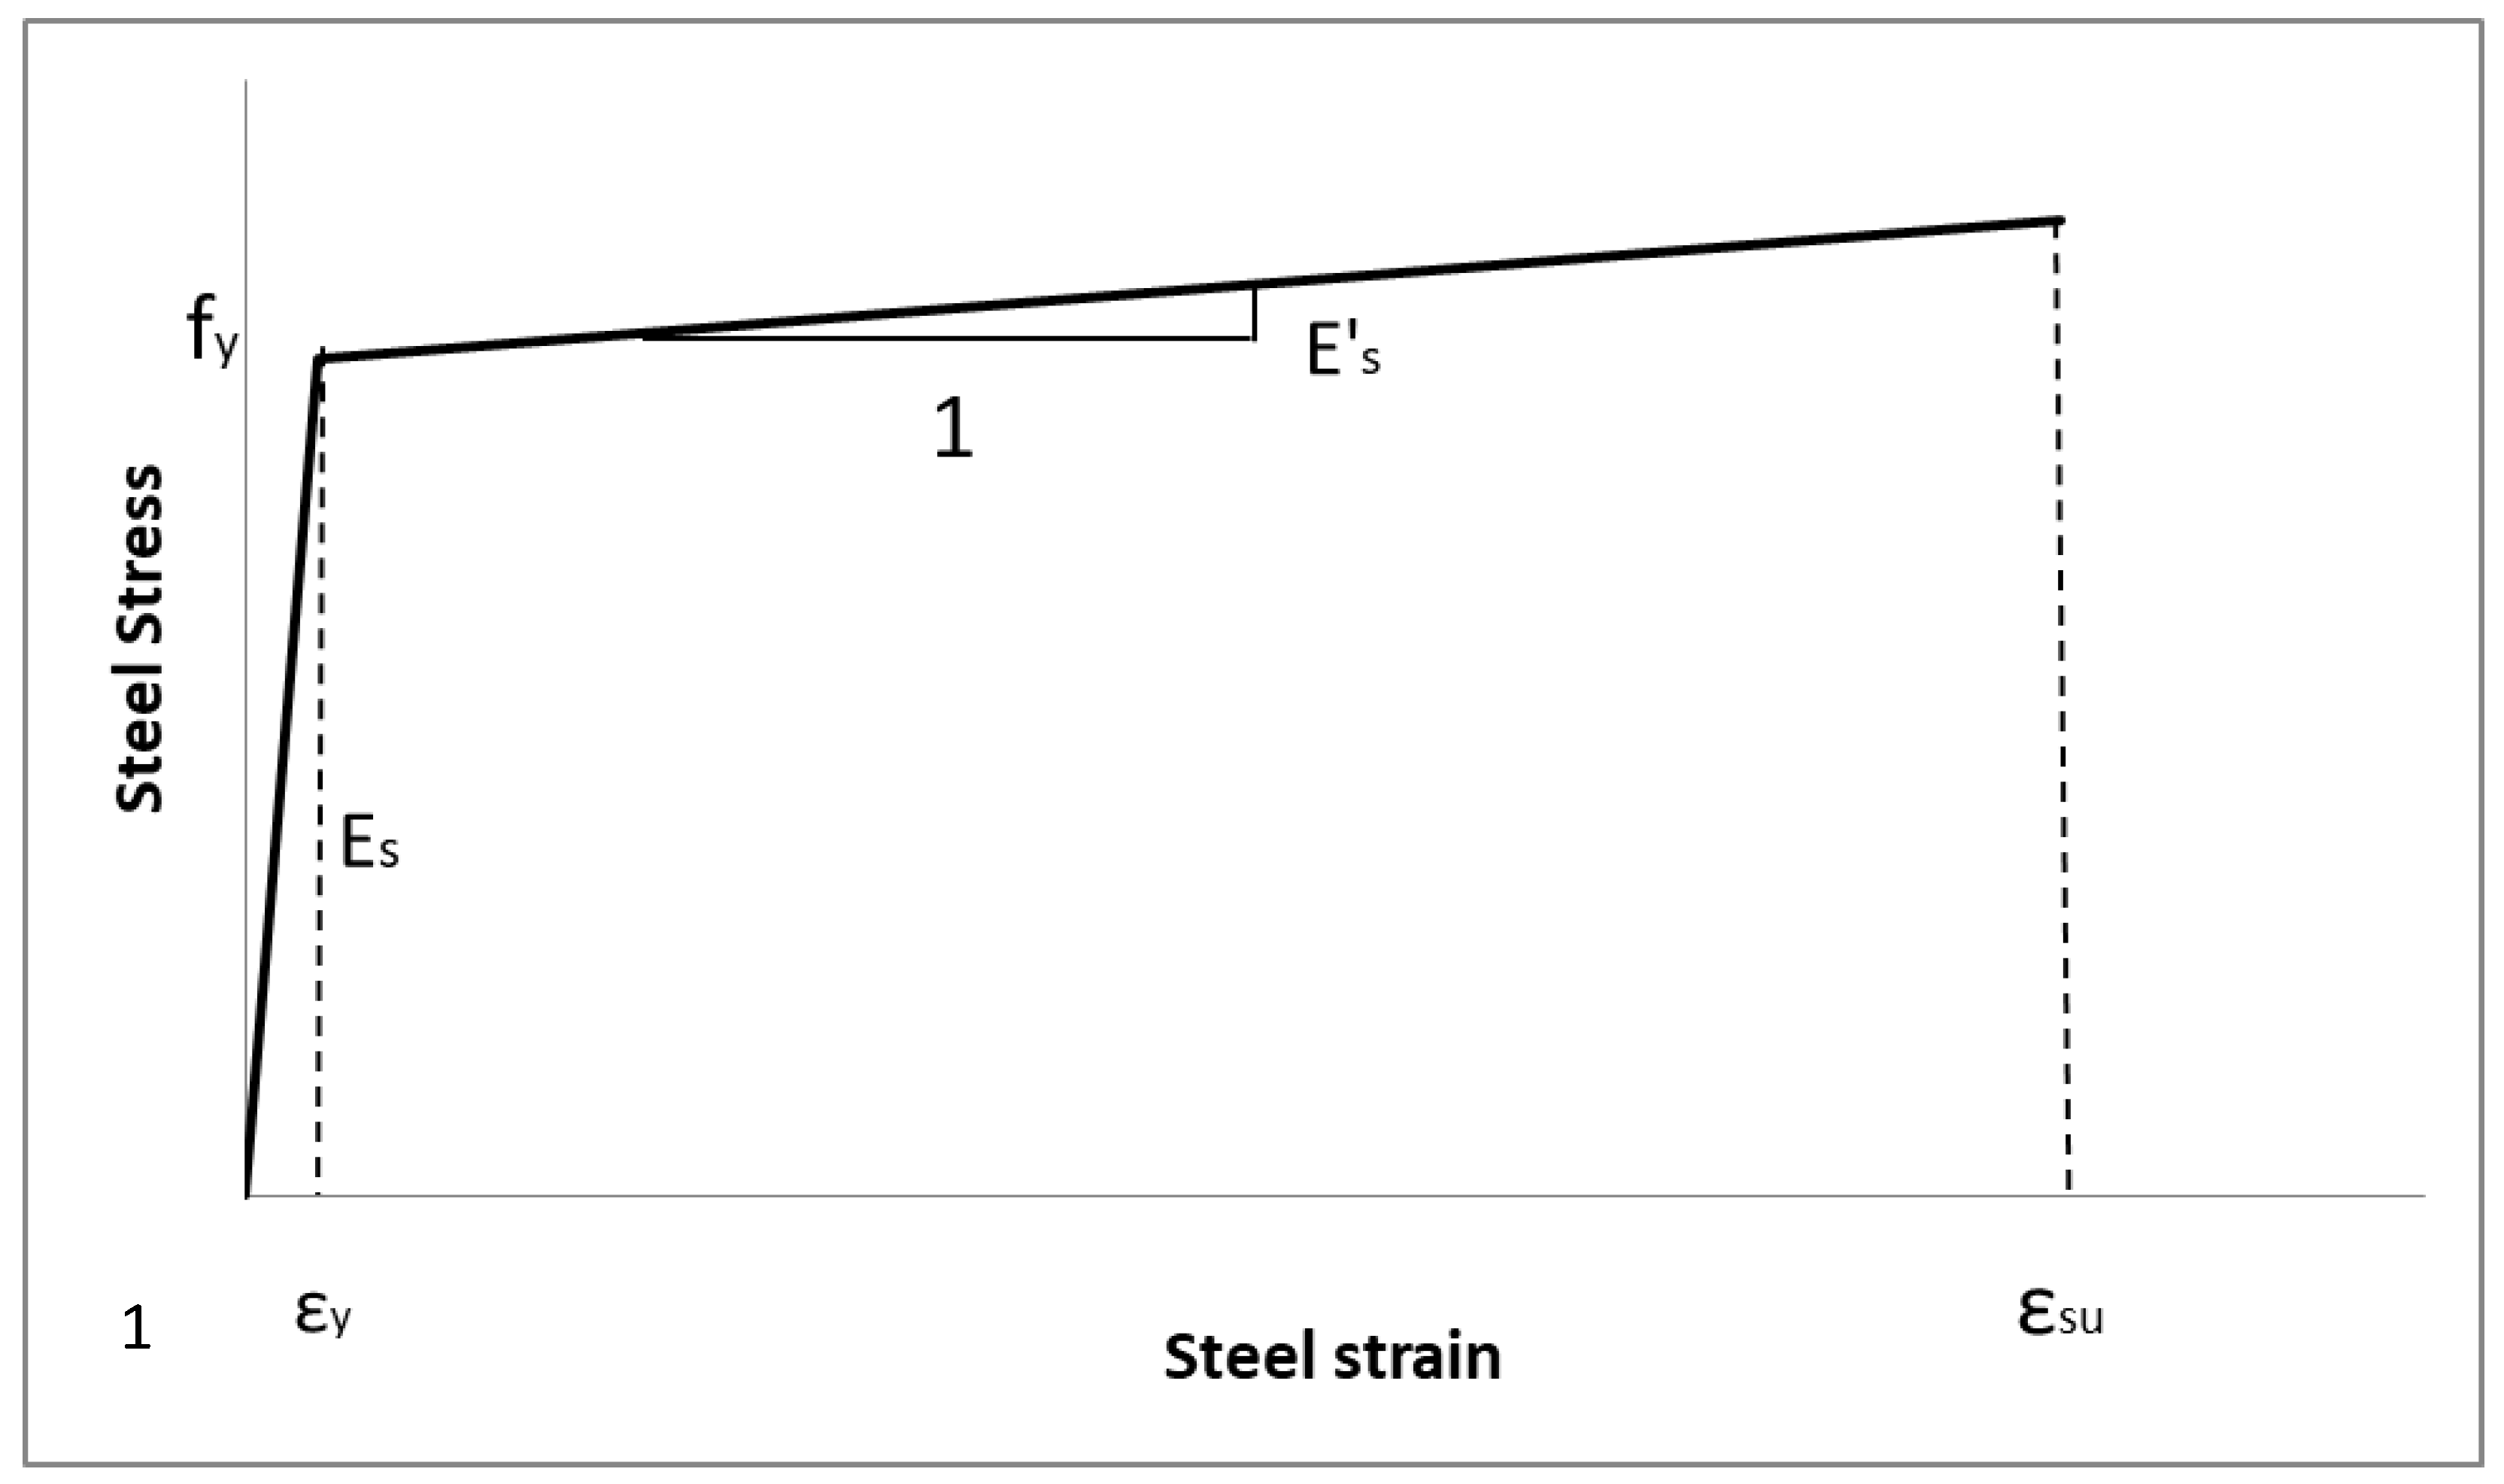
The stress–strain relationships for the concrete and the reinforcing steel are assumed to be independent of each other. The axial stress in steel would be only a result of the axial strain in the steel. Additionally, shear stresses in the steel bars on a plane perpendicular to their longitudinal axis are assumed to be negligible. The steel axial stress–axial strain relationship is idealized by a bilinear function, which is the same in tension and compression—see
Figure 2.
where (
fs) is the steel stress corresponding to the axial strain (
ɛs), (
Es) is the modulus of elasticity of steel, (
fy) is the yielding strength of steel. The steel is assumed to start hardening once exceeding the yielding strength (
fy) according to Equation (2). (
E′s) is the slope of steel hardening line after yielding. It is determined based on an equal area under the strain hardening region in the actual experimental curve and the analytical model.
Table 1 shows the relationship between the estimated (
E′s) and the corresponding (
fy) as correlated by Rasheed (1990) [
10].
The concrete stress–strain relationship is assumed to follow the Hognestad’s curve [
11], Equation (3), for compressive stresses (
fc)—see
Figure 3.
where (
fc) is the concrete compressive stress and (
f′c) is the concrete compressive strength, (
εc) is the concrete compressive strain and (
ε′c) is concrete compressive strain corresponding to (
f′c). A linear relationship with a slope equal to the concrete modulus of elasticity (
Ec) up to cracking strain (
ɛcr) in tension is assumed. This linear relationship is then followed by a descending curve as a function of (
fr) and the steel yielding strain (
ɛy), which will be further developed in the paper—see
Figure 4.
The concrete tensile rupture strength (
fr) is taken as the lower bound value given by ACI 318-14 [
12].
where (
λ) is taken as (1.0) for normal weight concrete, 0.85 for sand-lightweight concrete and 0.75 for all-lightweight concrete.
2.2. Analysis Assumptions
In this study, the following assumptions were made:
Plane sections before bending remain plane after bending (i.e., linear strain profile across the section depth is assumed before and after cracking);
Perfect bond exists between steel bars and the surrounding concrete;
Plane sections after bending are assumed to be perpendicular to the mid surface (i.e., shear deformations are negligible);
Smeared crack approach (i.e., averaged tensile strains are continuous in concrete in tension);
Dowel action effect is neglected.
2.3. Flexural Analysis
2.3.1. Forces
Compressive Forces
Compressive concrete contribution:
By integrating the Hognestad’s profile [
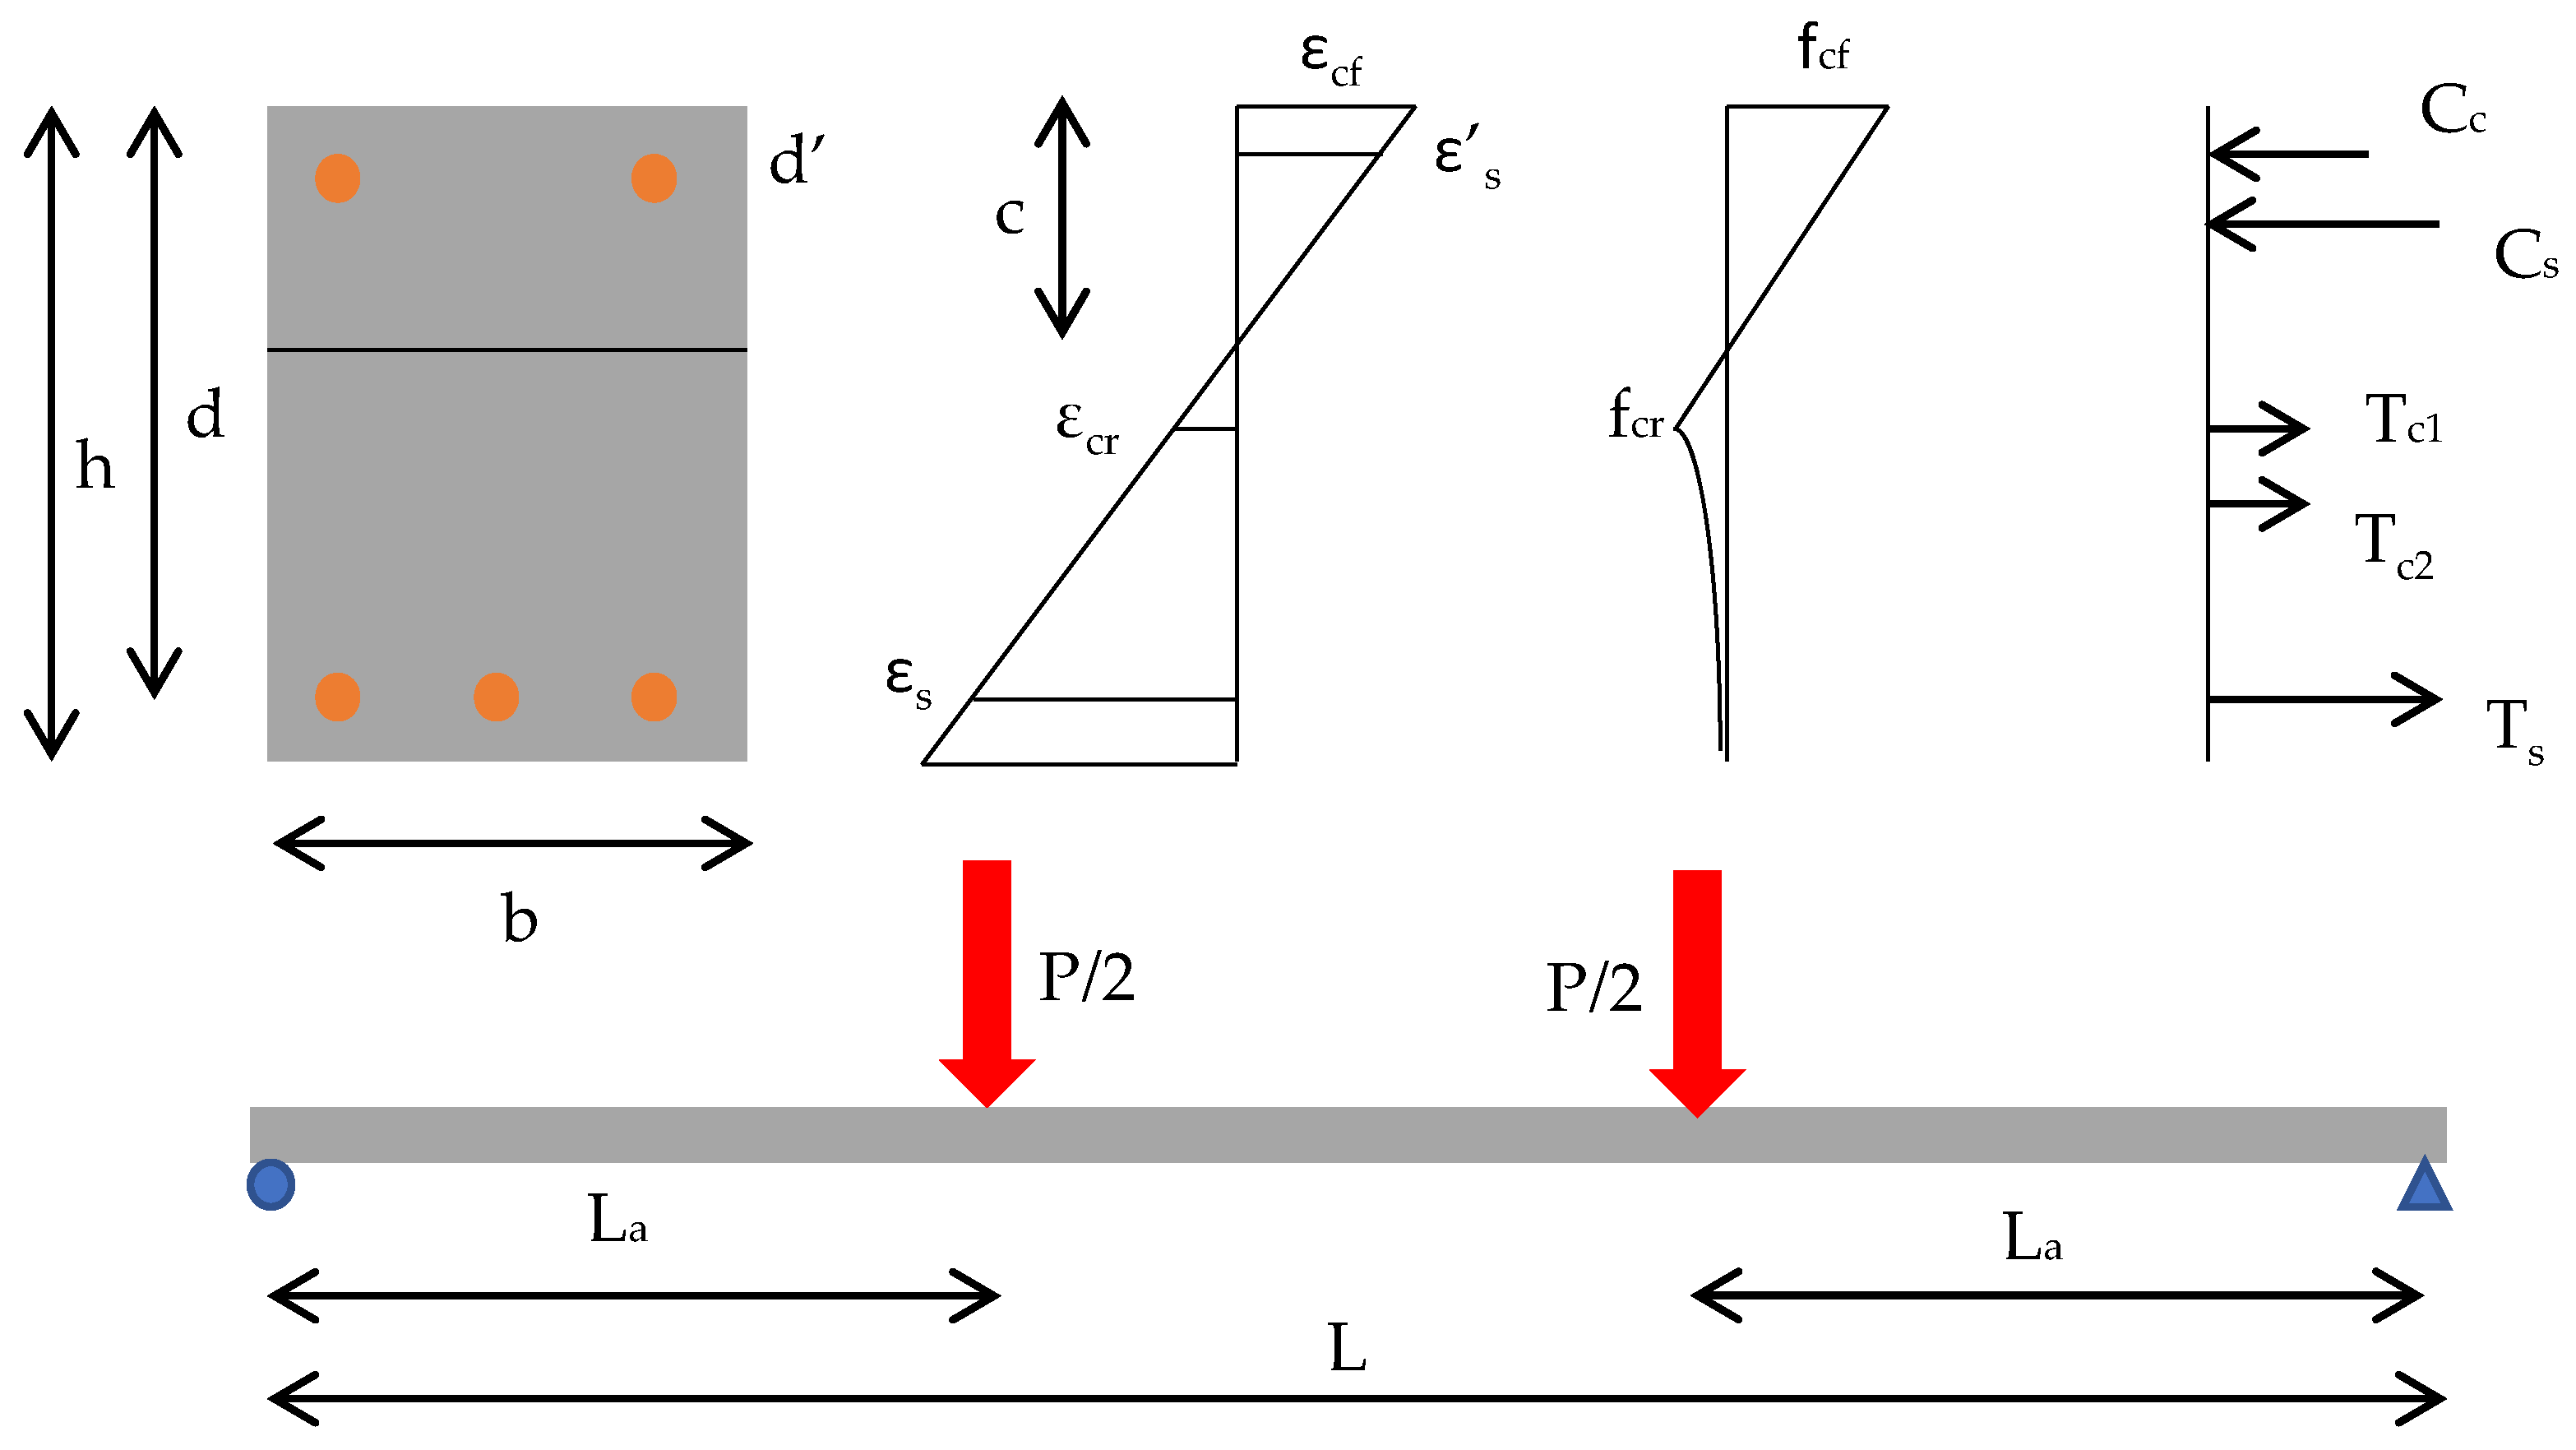
11] over the area from the neutral axis up to the maximum compressive concrete fiber strain, the concrete compressive force (
Cc) is determined for the section, see
Figure 5, based on the following equations:
Compressive Steel Contribution:
The compressive steel force (
Cs) is a direct linear relationship with the corresponding steel strain (
ɛs′) in addition to subtracting the contribution of the concrete in compression occupied by the compression steel bars. This relationship was determined based on the assumption of the bilinear response of steel bars.
where
is computed from Equations (1) and (2) by substituting
for
.
Tensile Forces
Tensile Concrete contribution:
The concrete tensile contribution is divided into two main profiles,
Figure 4. The first profile is a linear relationship up to the cracking strain (
ɛcr), with a slope equal to the concrete modulus of elasticity (
Ec). This profile leads to a tensile force (
Tc1) equals to:
The second profile is a descending curve, which mainly contributes to the total concrete tensile force. This profile is a result of the concrete softening, concrete stiffening due to the steel bond as well as the residual stresses due to shrinkage effect. The tensile force due to this profile (
Tc2) is calibrated against global experimental response to be a function of the concrete cracking strength (
fr) and the steel yielding strain (
ɛy). The tensile constitutive model and its calibration against experimental results are presented in
Section 3 of this paper. The equation for (
Tc2) is presented there.
Tensile steel Contribution:
The tensile steel force (
Ts) follows the same bilinear behavior based on Equations (1) and (2):
where
is taken from the uncracked or post-cracked parts of the concrete tensile constitutive functions. Note that
.
2.3.2. Moments
Compressive concrete contribution:
The point of application of concrete compressive force is measured from the extreme compressive fiber (
ɣ·c) based on the centroid location of the area under the Hognestad’s parabola [
11].
where (
c) is the depth of the compression zone to the position of neutral axis and (
ɣ) is the ratio of the centroid depth to the neutral axis depth, both measured from the top compression fiber.
Compressive Steel Contribution:
The compression steel moment is calculated according to the following equation:
Tensile Concrete contribution:
(
Mtc1) is the moment induced due to the concrete contribution up to the cracking point. While (
Mtc2) is the moment induced due to the descending constitutive tensile model.
The equation for (
Mtc2) is presented in
Section 3 of this paper.
Tensile steel Contribution:
The contribution of the moment induced due to the tensile steel reinforcement at any stage of loading is determined as follows:
where the tension force of steel is defined according to Equations (10) and (11).
2.4. Numerical Moment–Curvature Calculations
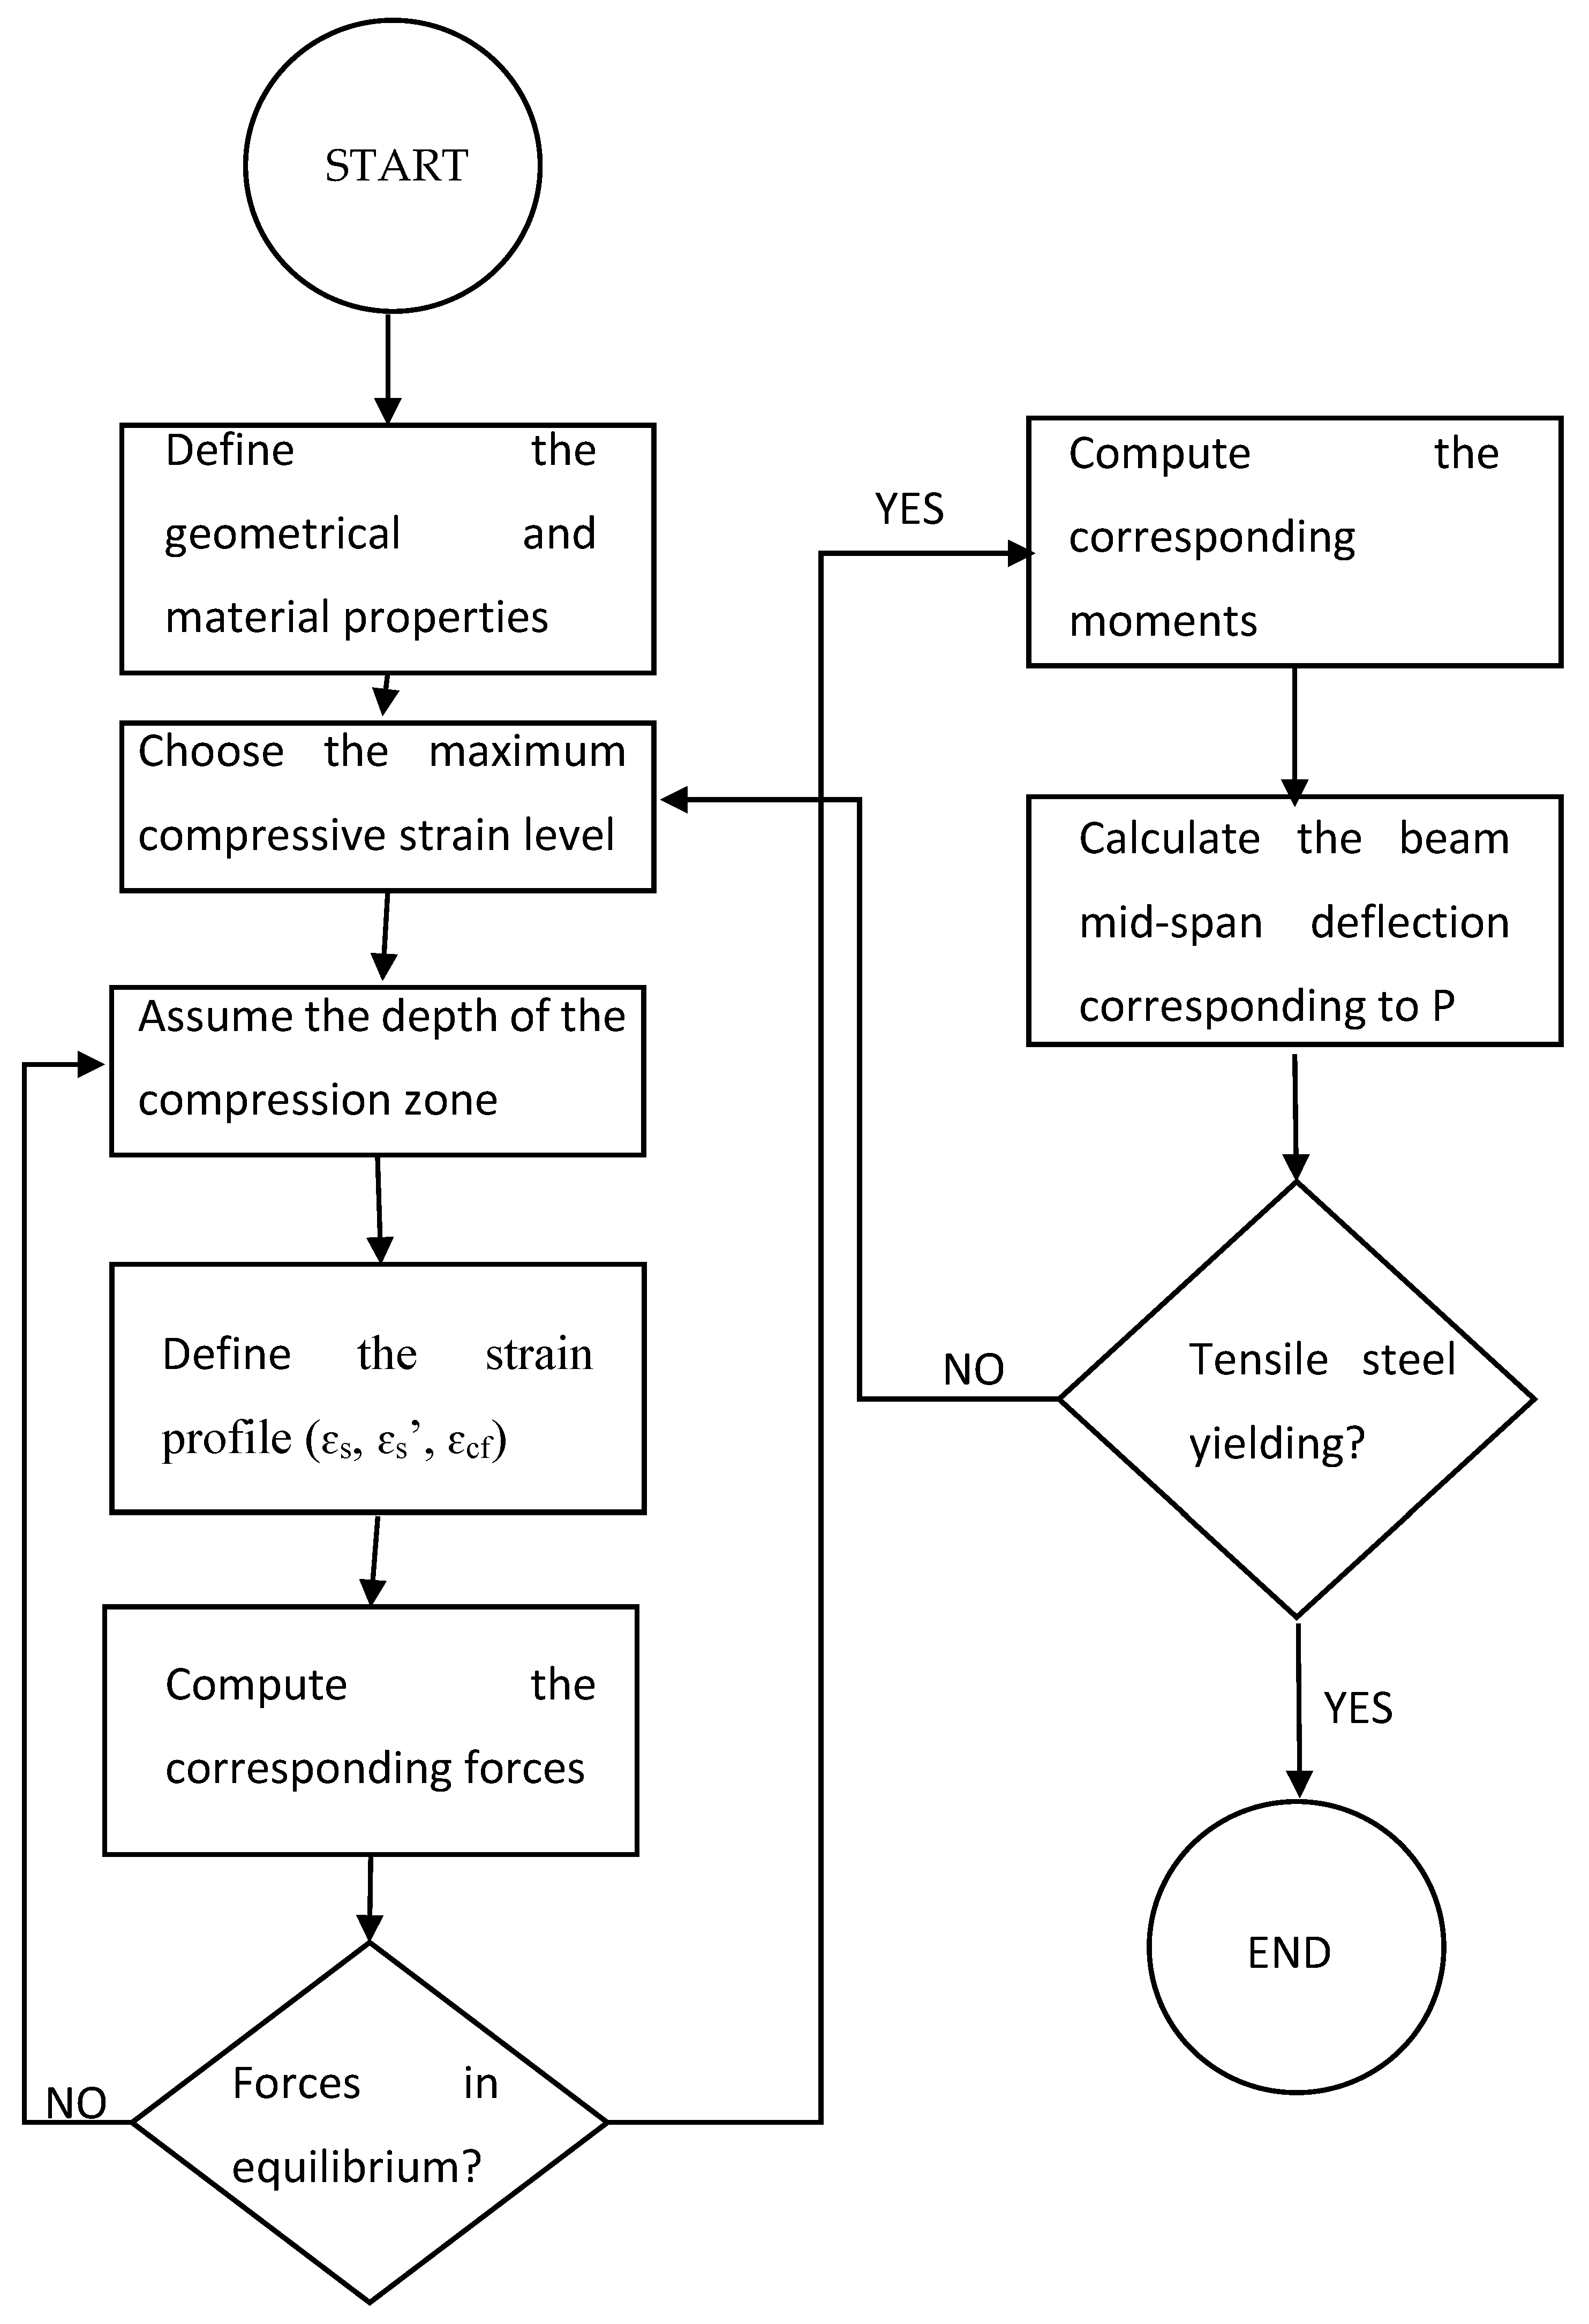
A numerical procedure was followed to generate the moment–curvature curve. In this procedure, the maximum compressive fiber strain value (
cf) was gradually increased until reaching the concrete crushing strain of (0.003). In order to accurately calculate the strain profile under each step value of
cf, the correct depth of the compression zone (
c) was necessary to define the strain profile and the corresponding stress profile as well as forces/moments. The sectional force equilibrium equation was then applied to validate the depth of the compression zone (
c) by iterating for the correct depth of compression zone that makes the summation of forces equal to zero—see
Figure 6.
The summation of moments due to concrete and steel contributions then yielded the total applied moment of the section corresponding to the curvature in Equation (17), and the numerical moment–curvature curve was then generated for the entire range of extreme compressive fiber strains.
2.5. Numerical Load–Deflection Calculations
The numerical nonlinear load–deflection solution of the beams is formulated using the moment–area integration. Half the span of the beam was divided into a number of segments and the flexural rigidity was calculated at the middle of each segment. The mid-span deflection for symmetric four-point bending loading protocol was then calculated by performing numerical integration of the moment of curvature response along the half span of the beam. The numerical integration was expressed as a summation of the analytical contribution of each segment as follows:
where (
Ns) is the number of segments along the shear span (
La), (
P) is the total load applied on the beam, (
xi+0.5) and (
xi−0.5) are the distances from the support to the end and the beginning of each segment, respectively, and
EIsi is the secant or effective flexural rigidity of the segment mid-section defined as:
Figure 6 presents the flowchart of the progressive moment–curvature calculation procedure along with the integrated load–deflection point corresponding to each maximum moment–curvature value.
Figure 6 is limited to the post-cracking region up to steel yielding. However, the same procedure may be followed to generate the response of the post-yielding region.
3. Constitutive Tension Model
The proposed model in this study is based on cycles of numerical analysis and experimental-numerical deflection error minimization with respect to material model parameters until convergence to the experimental response. A descending model was critical to represent the gradual loss of tension stiffness with the propagation of the beam cracks. This model represents the contribution of concrete in tension between two successive cracked sections. This approach is known as the smeared crack approach, which simulates the global response of the entire beam. Therefore, this response could be viewed as an averaged behavior for all beam sections. The tension model may be a function of the structural element and the loading patterns considered. A uniaxial plain concrete element would show a different behavior than a reinforced concrete flexural beam due to the steel-concrete bond in the latter member.
The presented constitutive tension model for reinforced concrete flexural beams is a summation of various reinforced concrete features. Plain concrete softening and steel tension stiffening are considered to be the main phenomena incorporated to develop the constitutive model. Tension softening occurs due to the development of concrete flexural cracks. The fracture energy, transformed from the strain energy, advances existing major cracks and initiates minor micro cracks, which weaken the concrete at relatively high rates. Steel-Reinforced concrete tension stiffening is the second important characteristic that represents the local bond-slip between the concrete and the steel bars. This feature causes the effective or averaged tensile stresses in the concrete to gradually reduce in between two successive primary cracks. In addition to tension softening and tension stiffening, shrinkage and aggregate size also participates in altering the concrete tensile behavior. Shrinkage builds up residual stresses in the concrete while hardening. This results in lowering the tensile strength and tension stiffening effects. On the other hand, the aggregate size/shape effects are mainly observed when shear and tensile stresses are combined. Therefore, a numerical constitutive tension model based on calibrating the global experimental response is important to capture all these characteristics in one model.
The proposed constitutive concrete tensile model relates the tensile strain
with the tensile concrete stresses
as a function of the material parameters calibrated based on experiments for flexural reinforced concrete beams. The model is presented as a function of concrete cracking and steel yielding parameters, Equation (23). Stress and strain constants in the equation were extracted by actively minimizing the deflection error between the numerical analysis vs. a large pool of four points bending tests on flexural beams—see
Table 2 and
Table 3.
This proposed descending function on the domain
shows a sudden drop to (0.5
fr) at the cracking strain (
ɛcr) upon strain to fracture energy conversion and continues to descend till zero when the tensile strain reaches (1.4
ɛy)—see
Figure 7. The sudden drop in stress at cracking is a function of the tension softening effect while the exhaustion of the tension stiffening effect is expected to be related steel yielding.
The axial force due to the proposed constitutive tensile model (
Tc2) is the integral of the given stress profile over the distance from the cracking depth
to the end of the model at
or the full tensile depth of the section, Equation (24).
where
is the end of the proposed model at
or the full tensile depth of the section
, whichever controls the case.
The moment induced due to the proposed constitutive tensile model (
Mtc2) is calculated as follows:
4. Results
The reinforced concrete beam tests collected in this paper cover a big range of geometrical and material parameters. Normal weight concrete and lightweight concrete were covered in the database. The maximum compressive concrete strength range is 27.5–83 MPa (4–12 ksi). The steel yielding strength range is 344.75–551.6 MPa (50–80 ksi). Singly and doubly reinforced sections with different ratios are included for representative comparisons. A wide range of steel ratios is examined to confirm the applicability of the model—see
Table 2 and
Table 3.
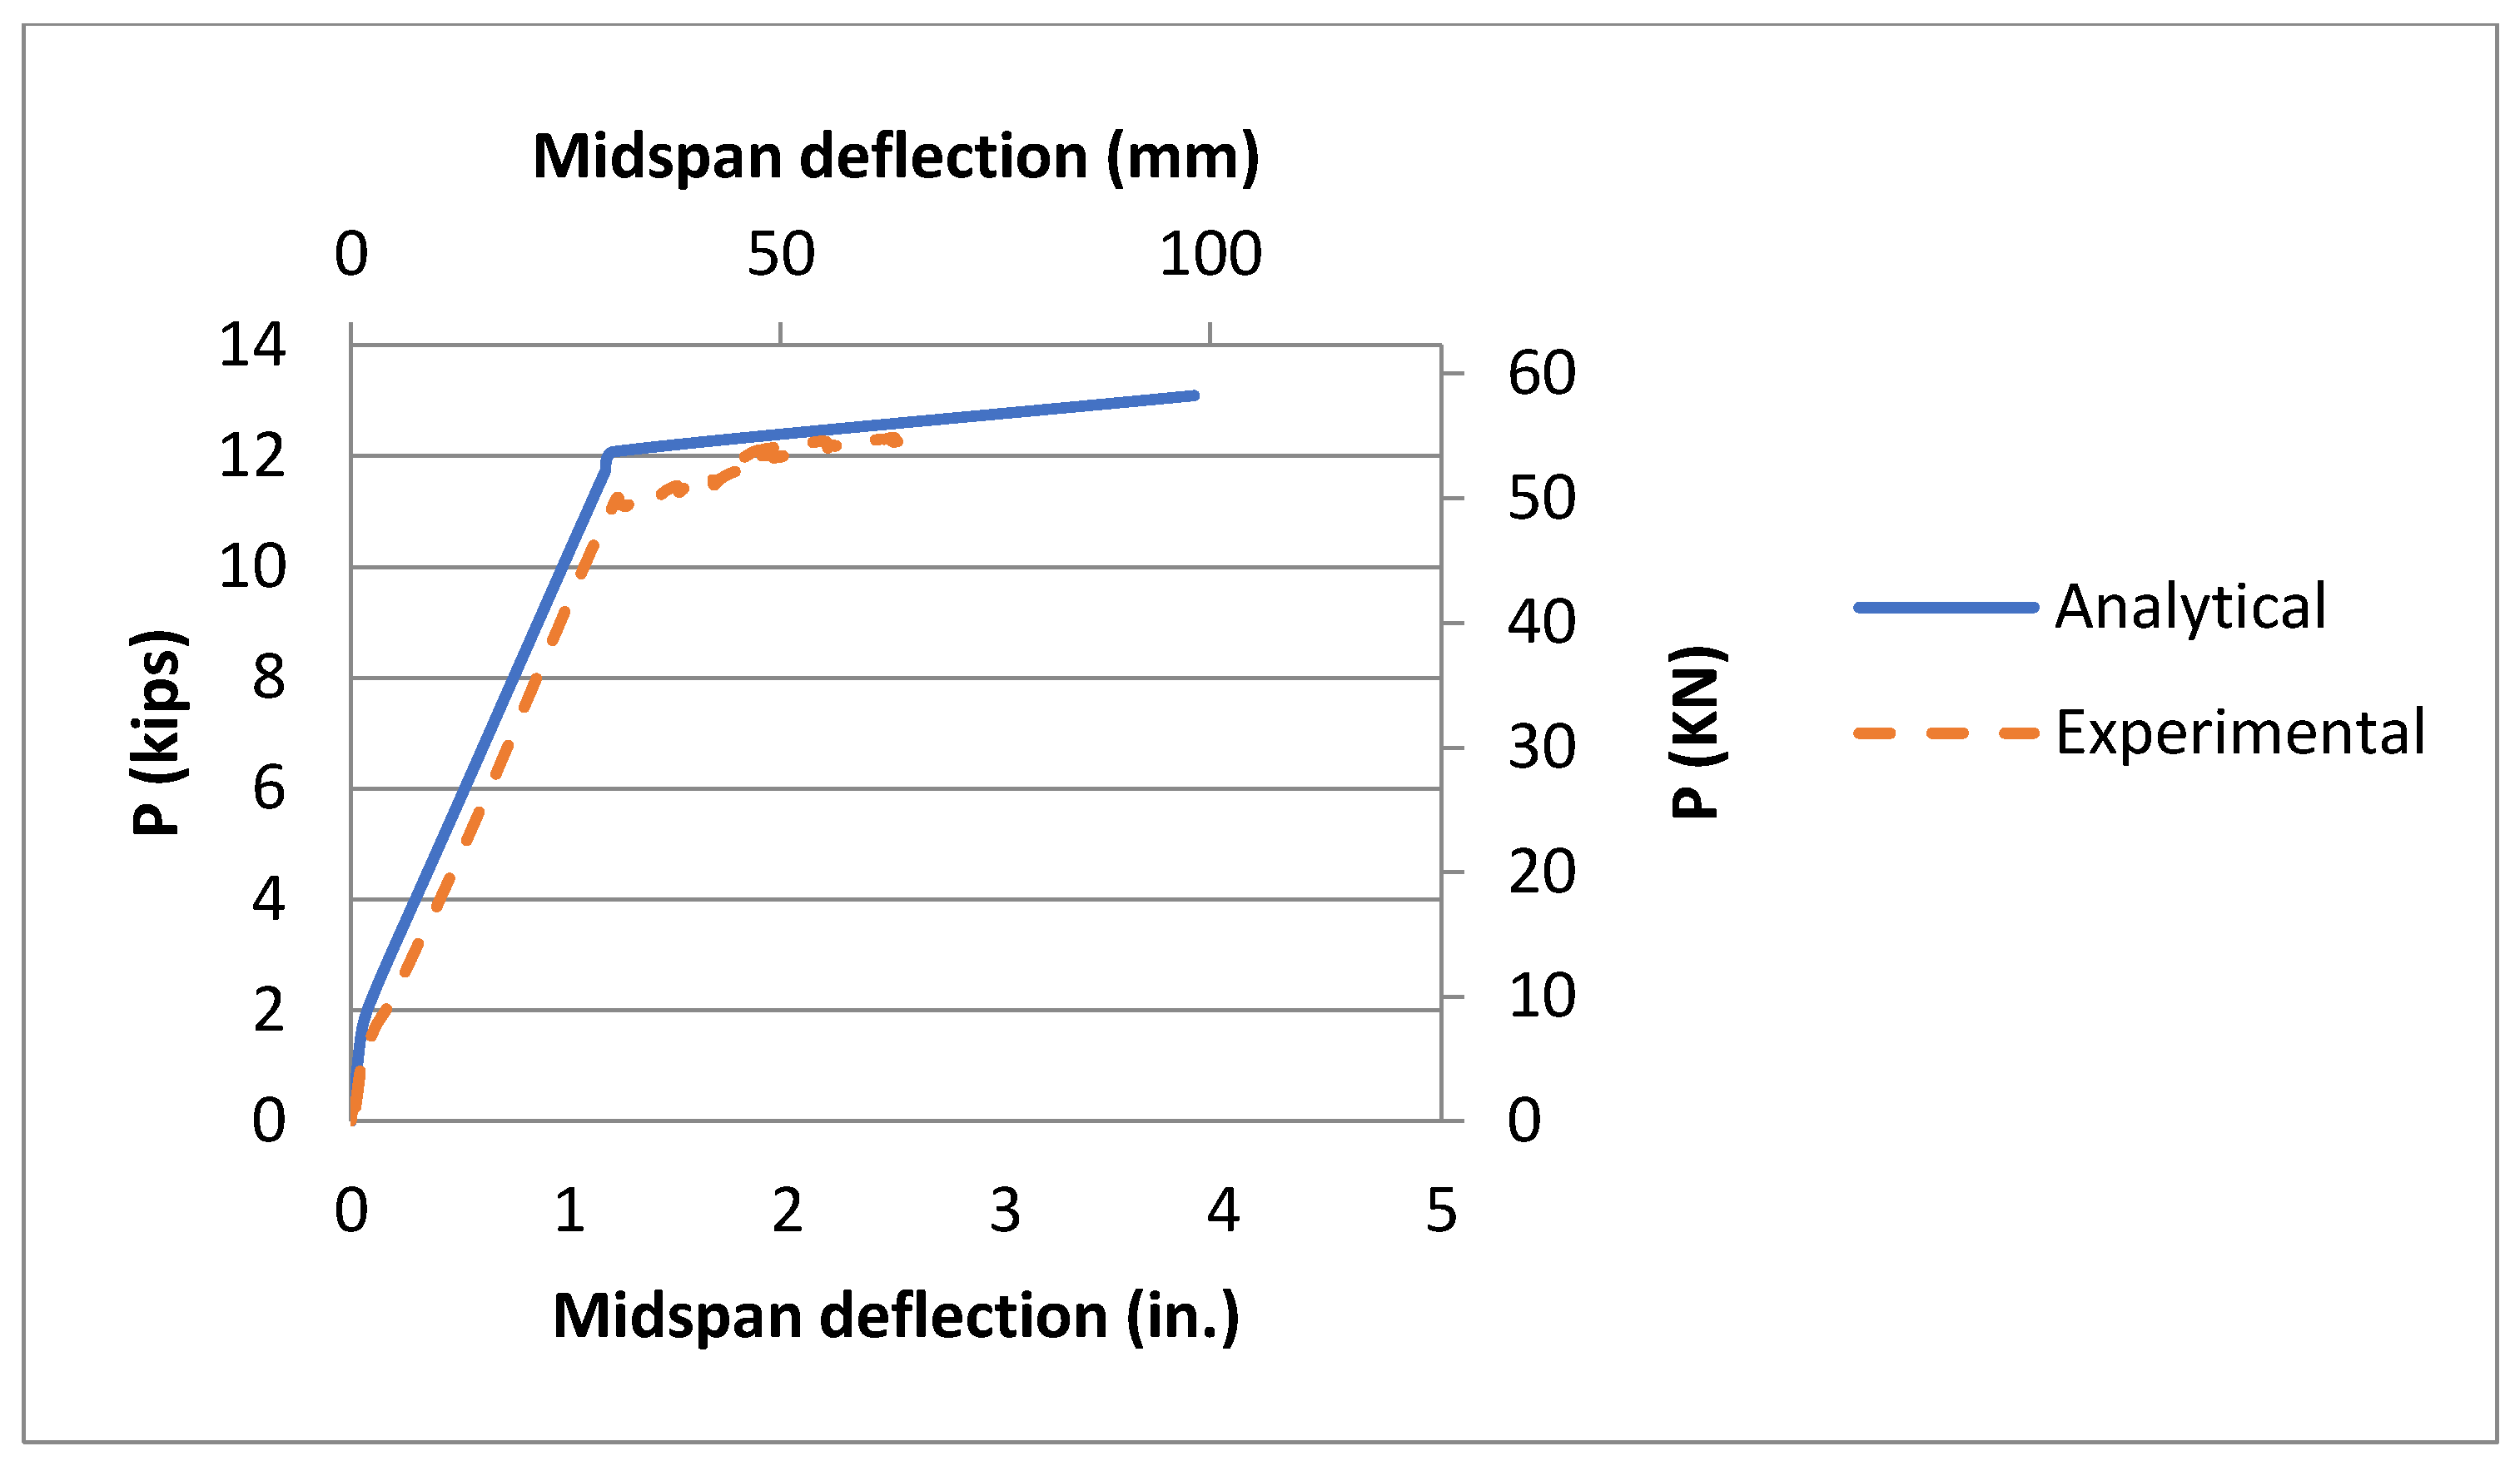
The common factors between these beams are: (1) they are all flexural beams, (2) they were tested in four-point bending to match the goal of this study and (3) they have comparable section height and width while varying the tensile steel area. Each beam was analyzed using the proposed analysis framework, then the resulting load–deflection graph, referred to as, “analytical” load–deflection curve in the legends of comparison figures, was generated and its deviation from the actual experimental response was minimized with respect to the tension stiffening parameters considered, (e.g.,
Figure 8).
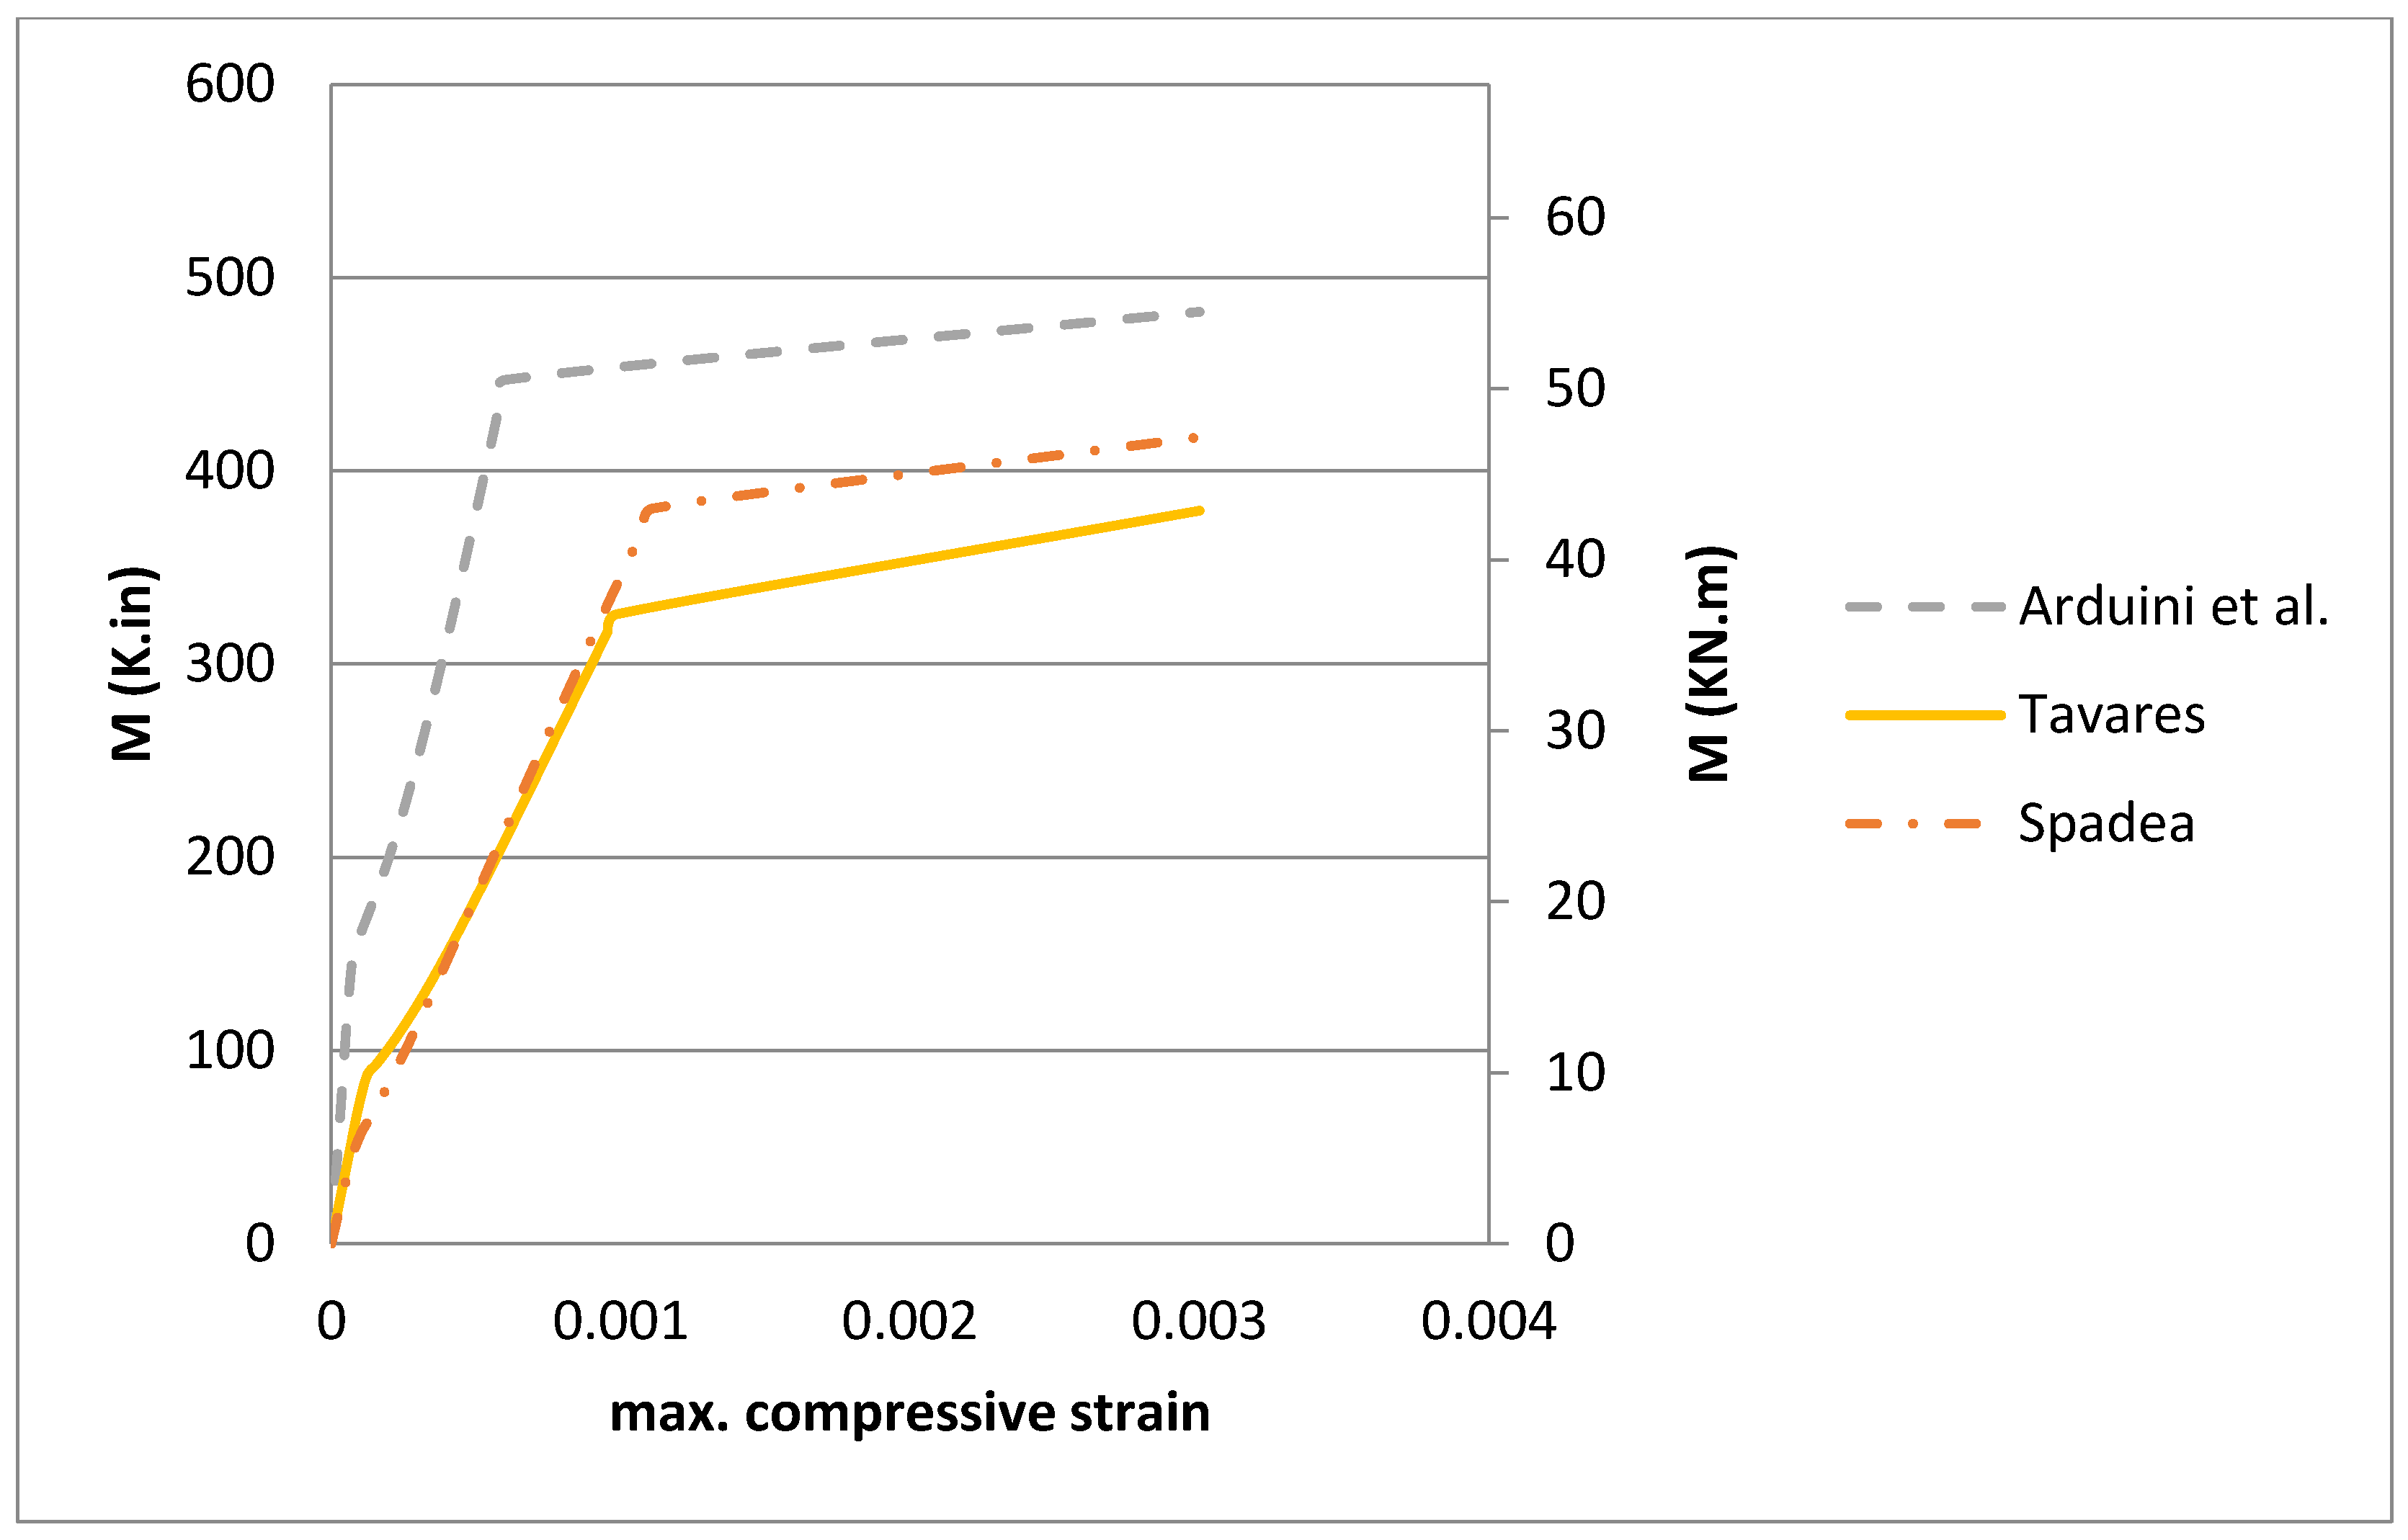
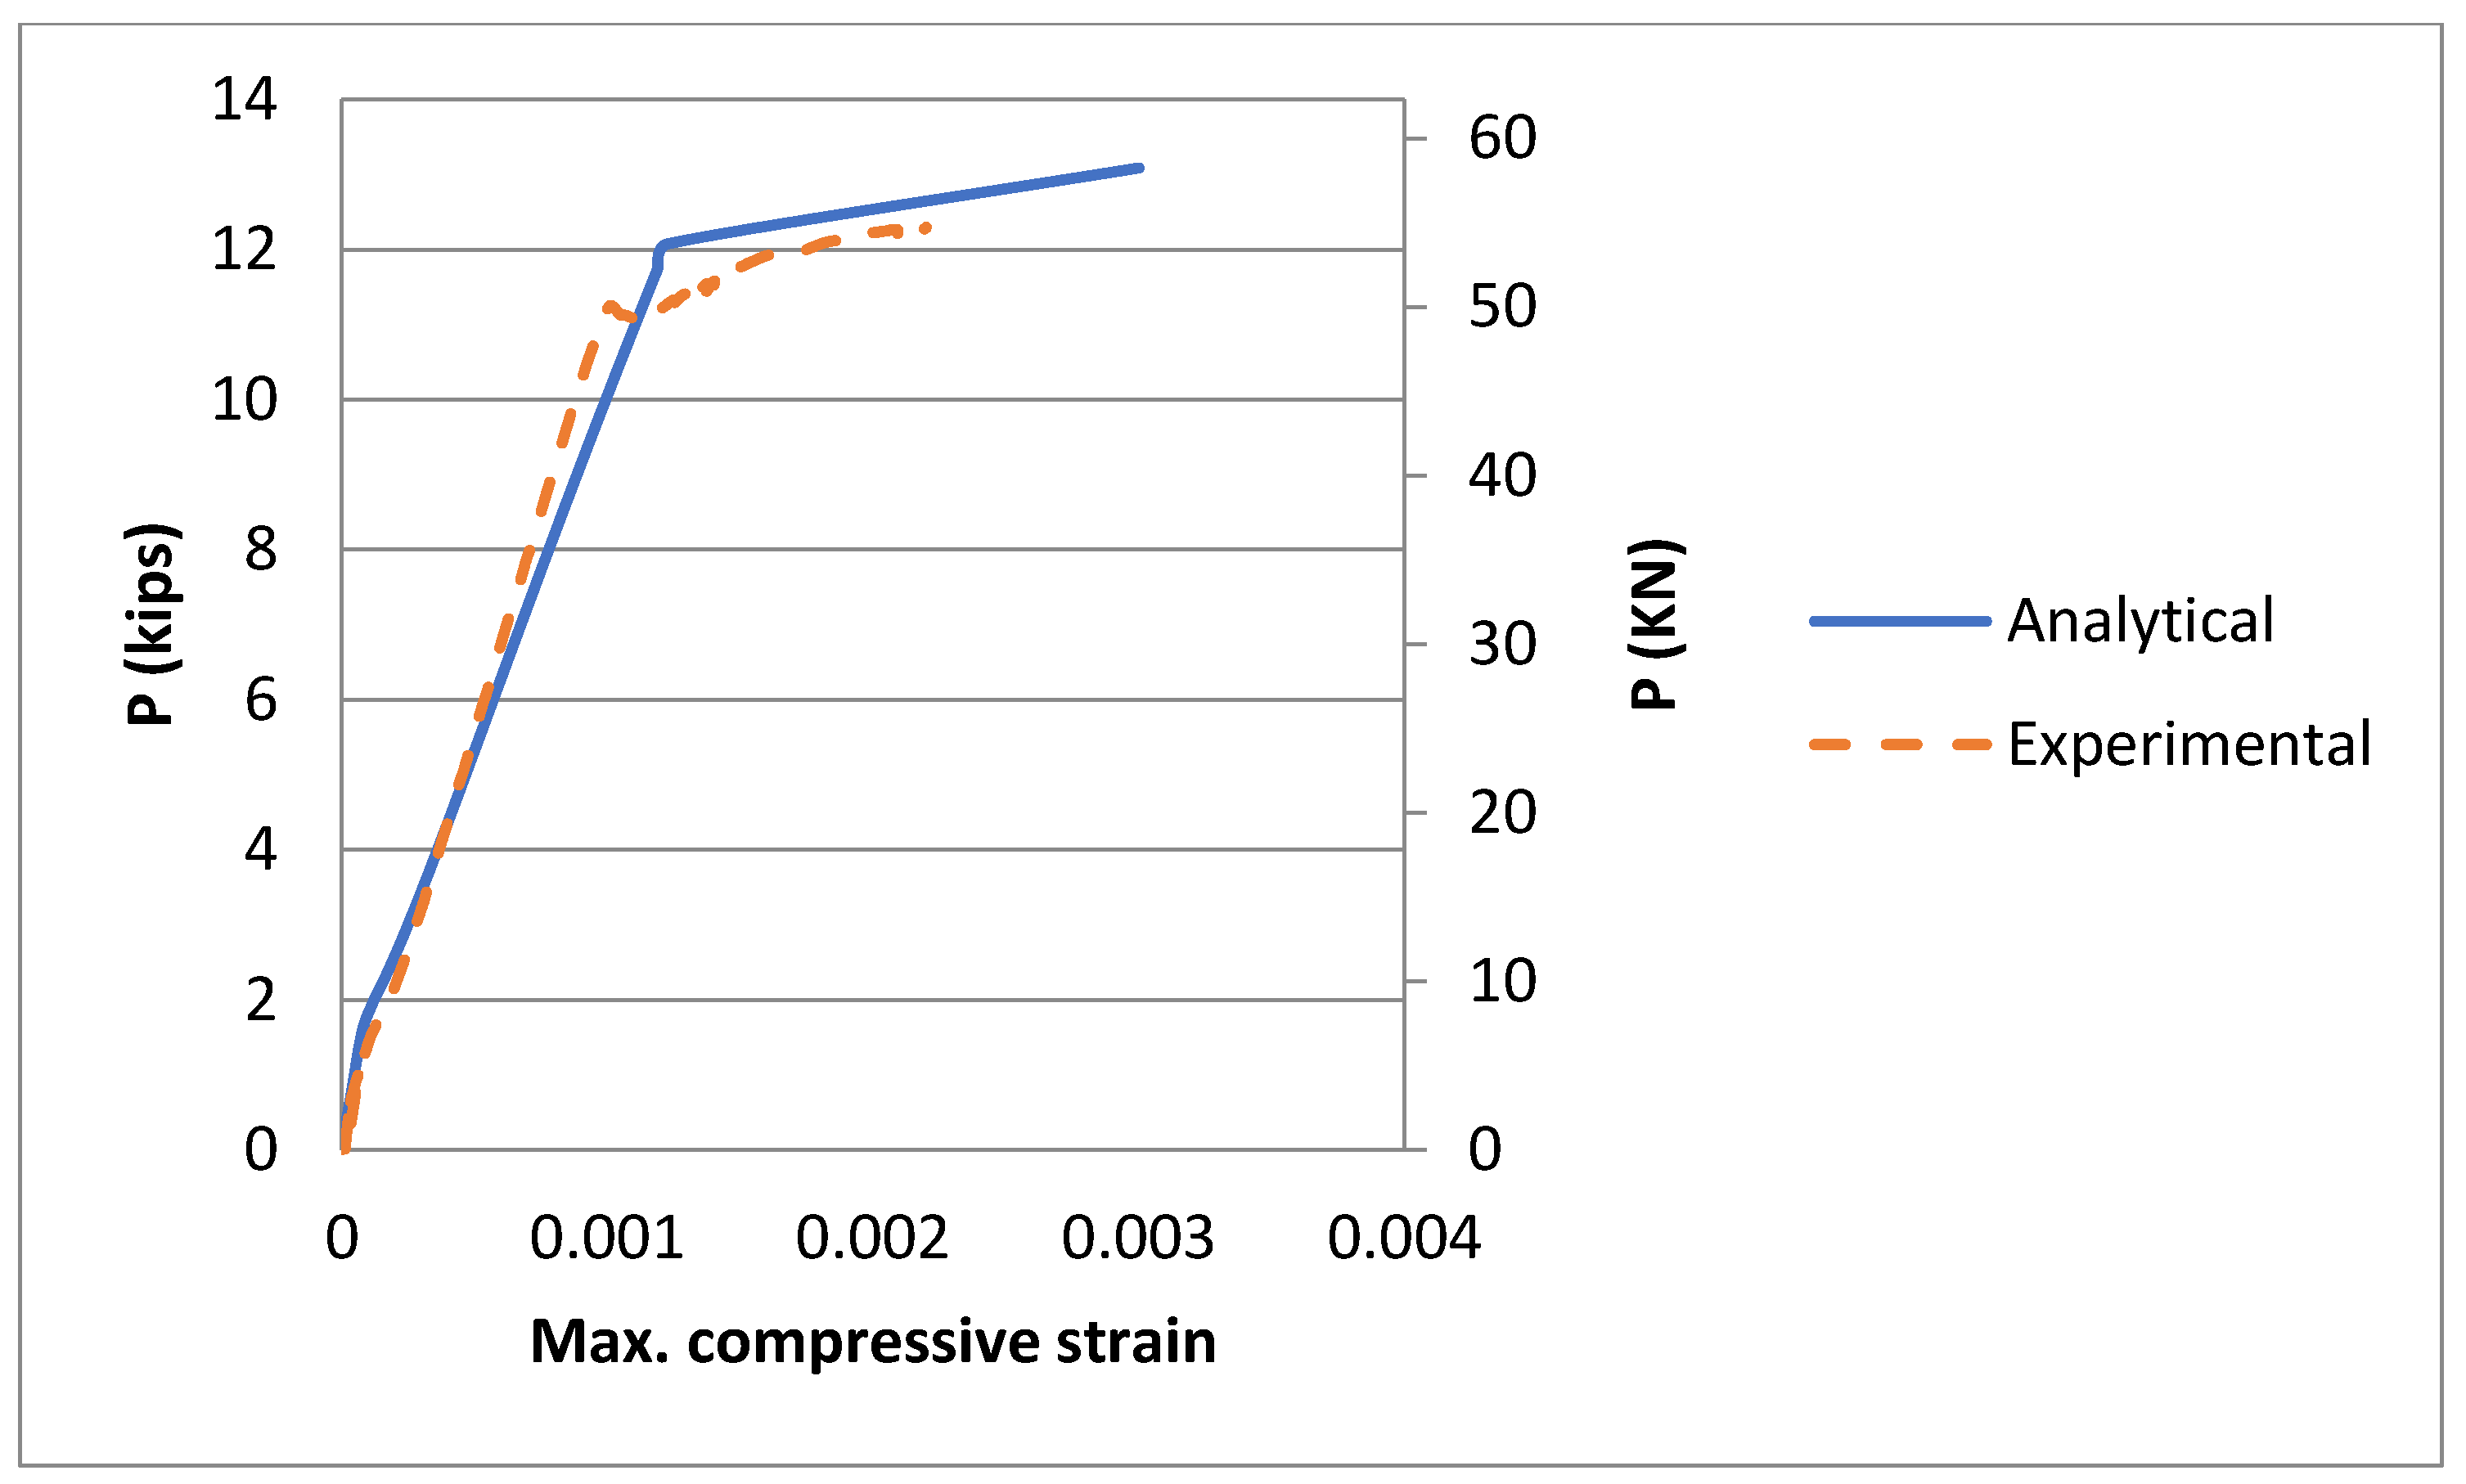
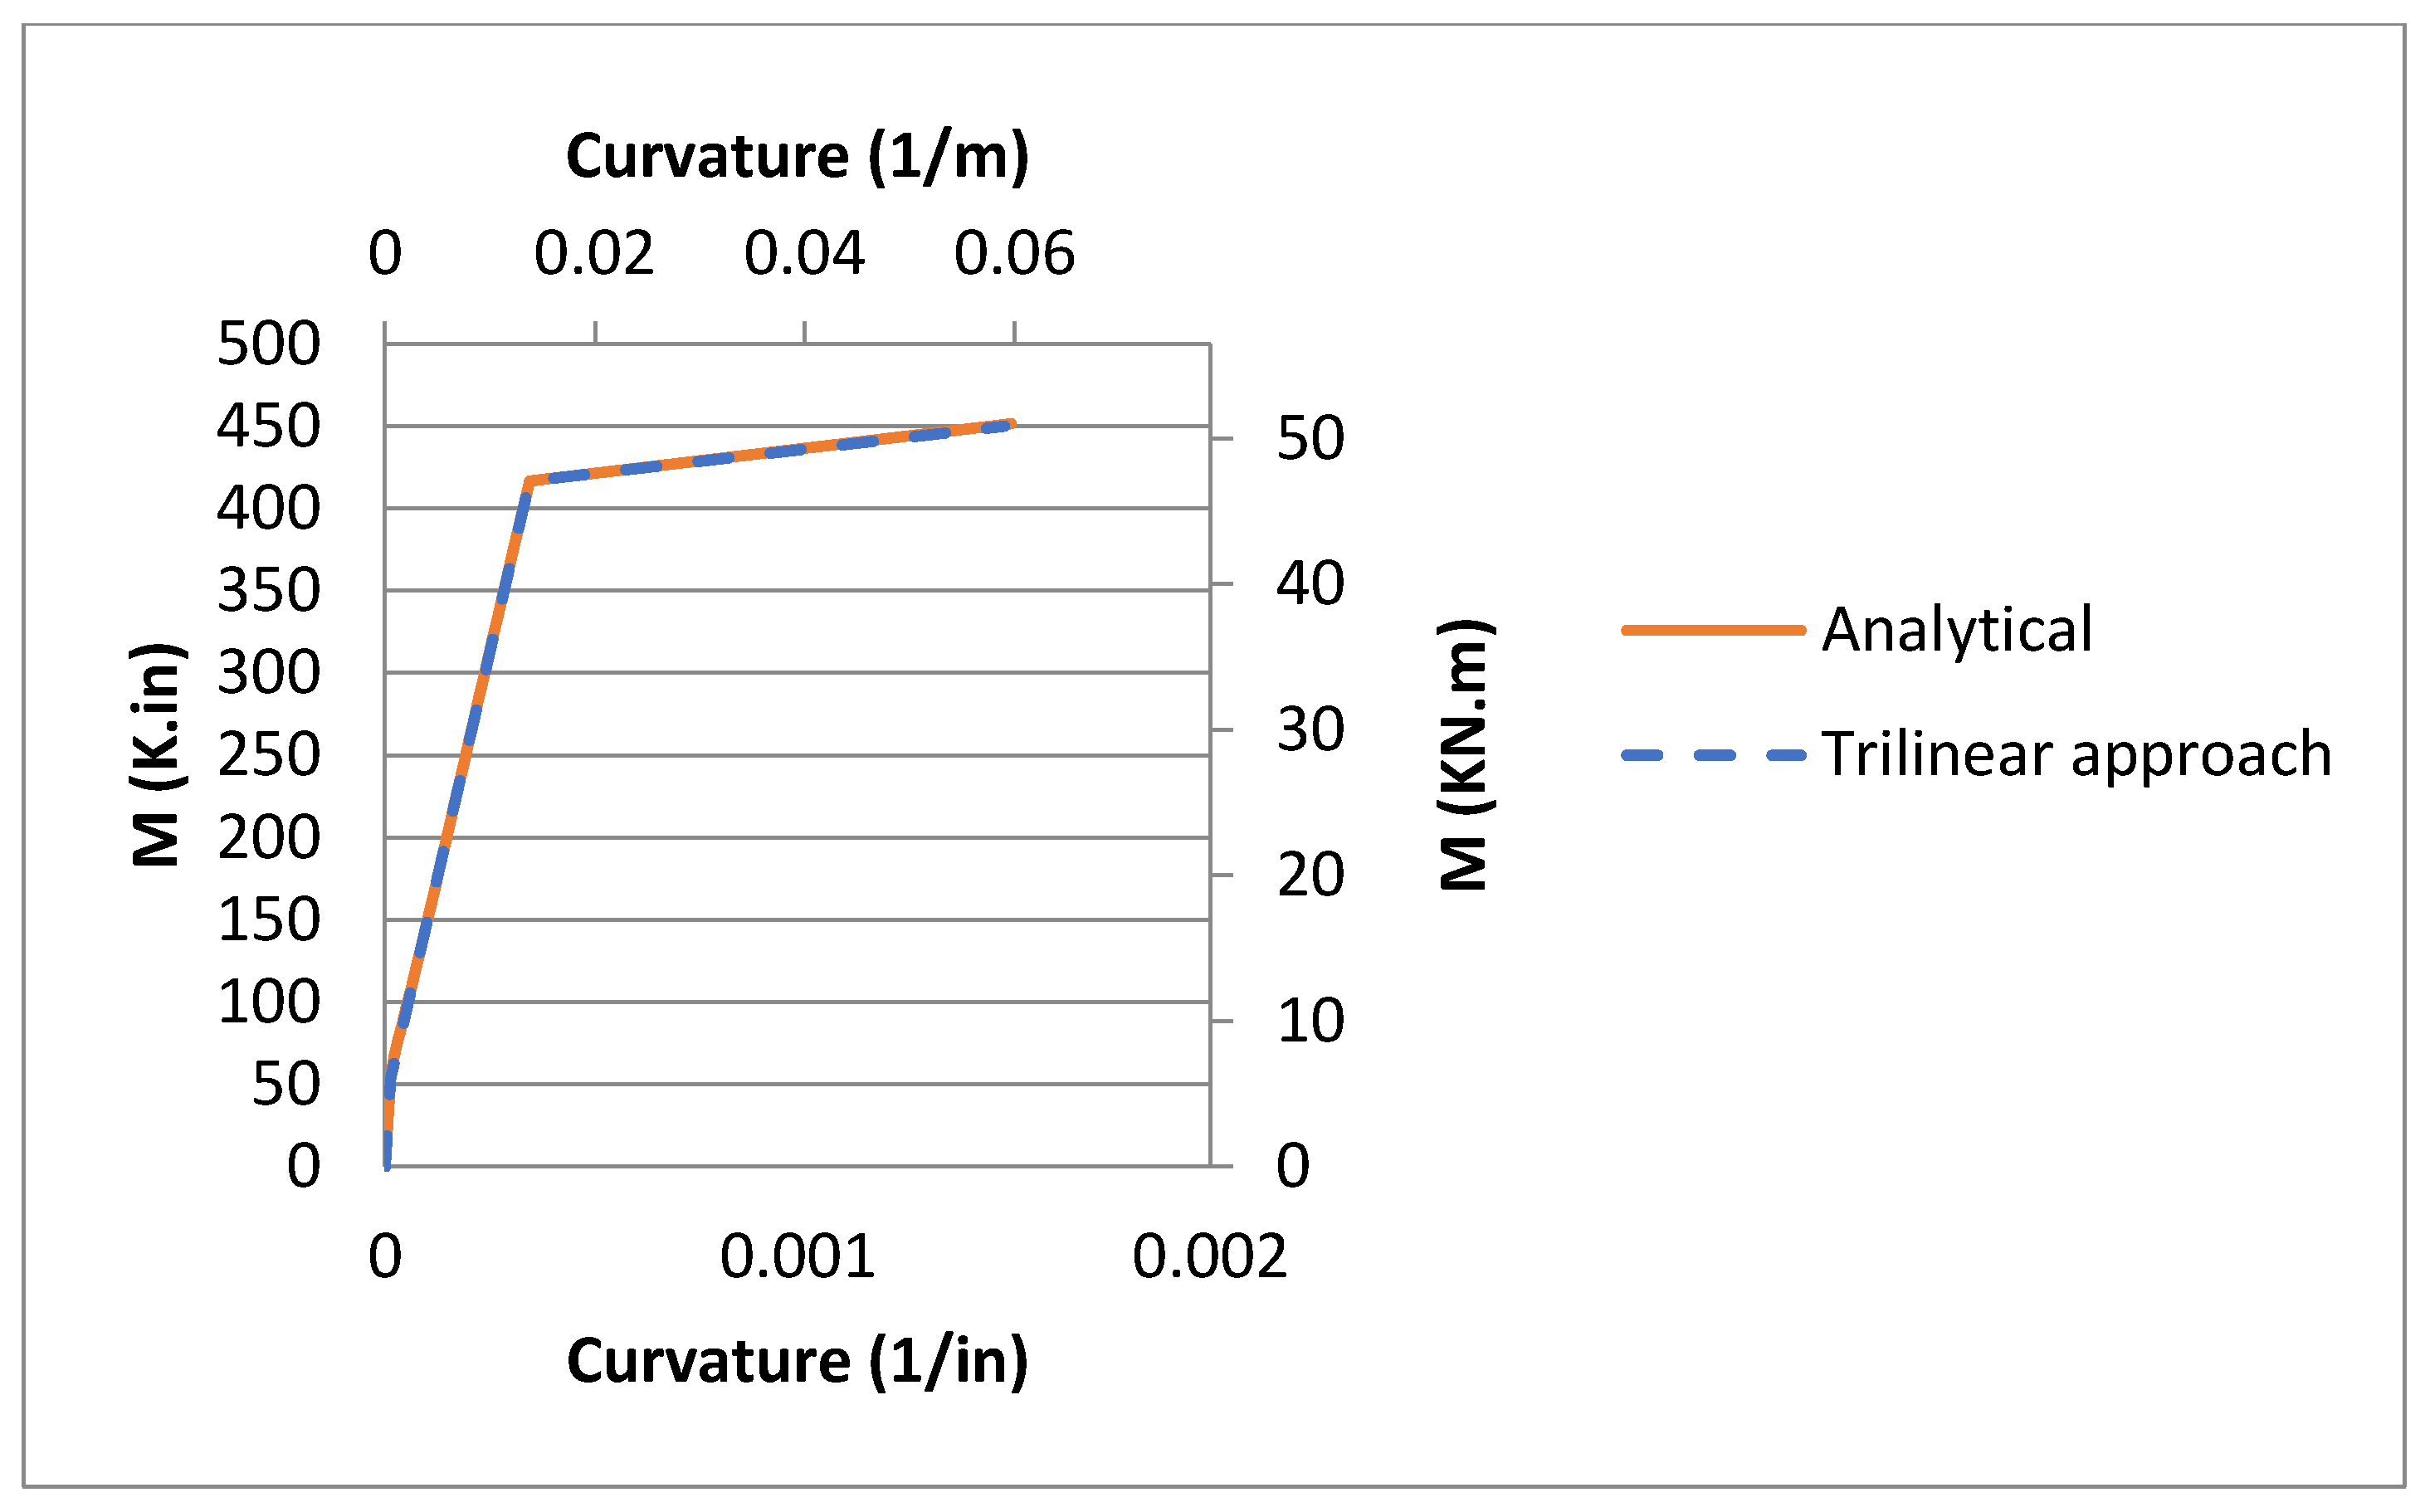
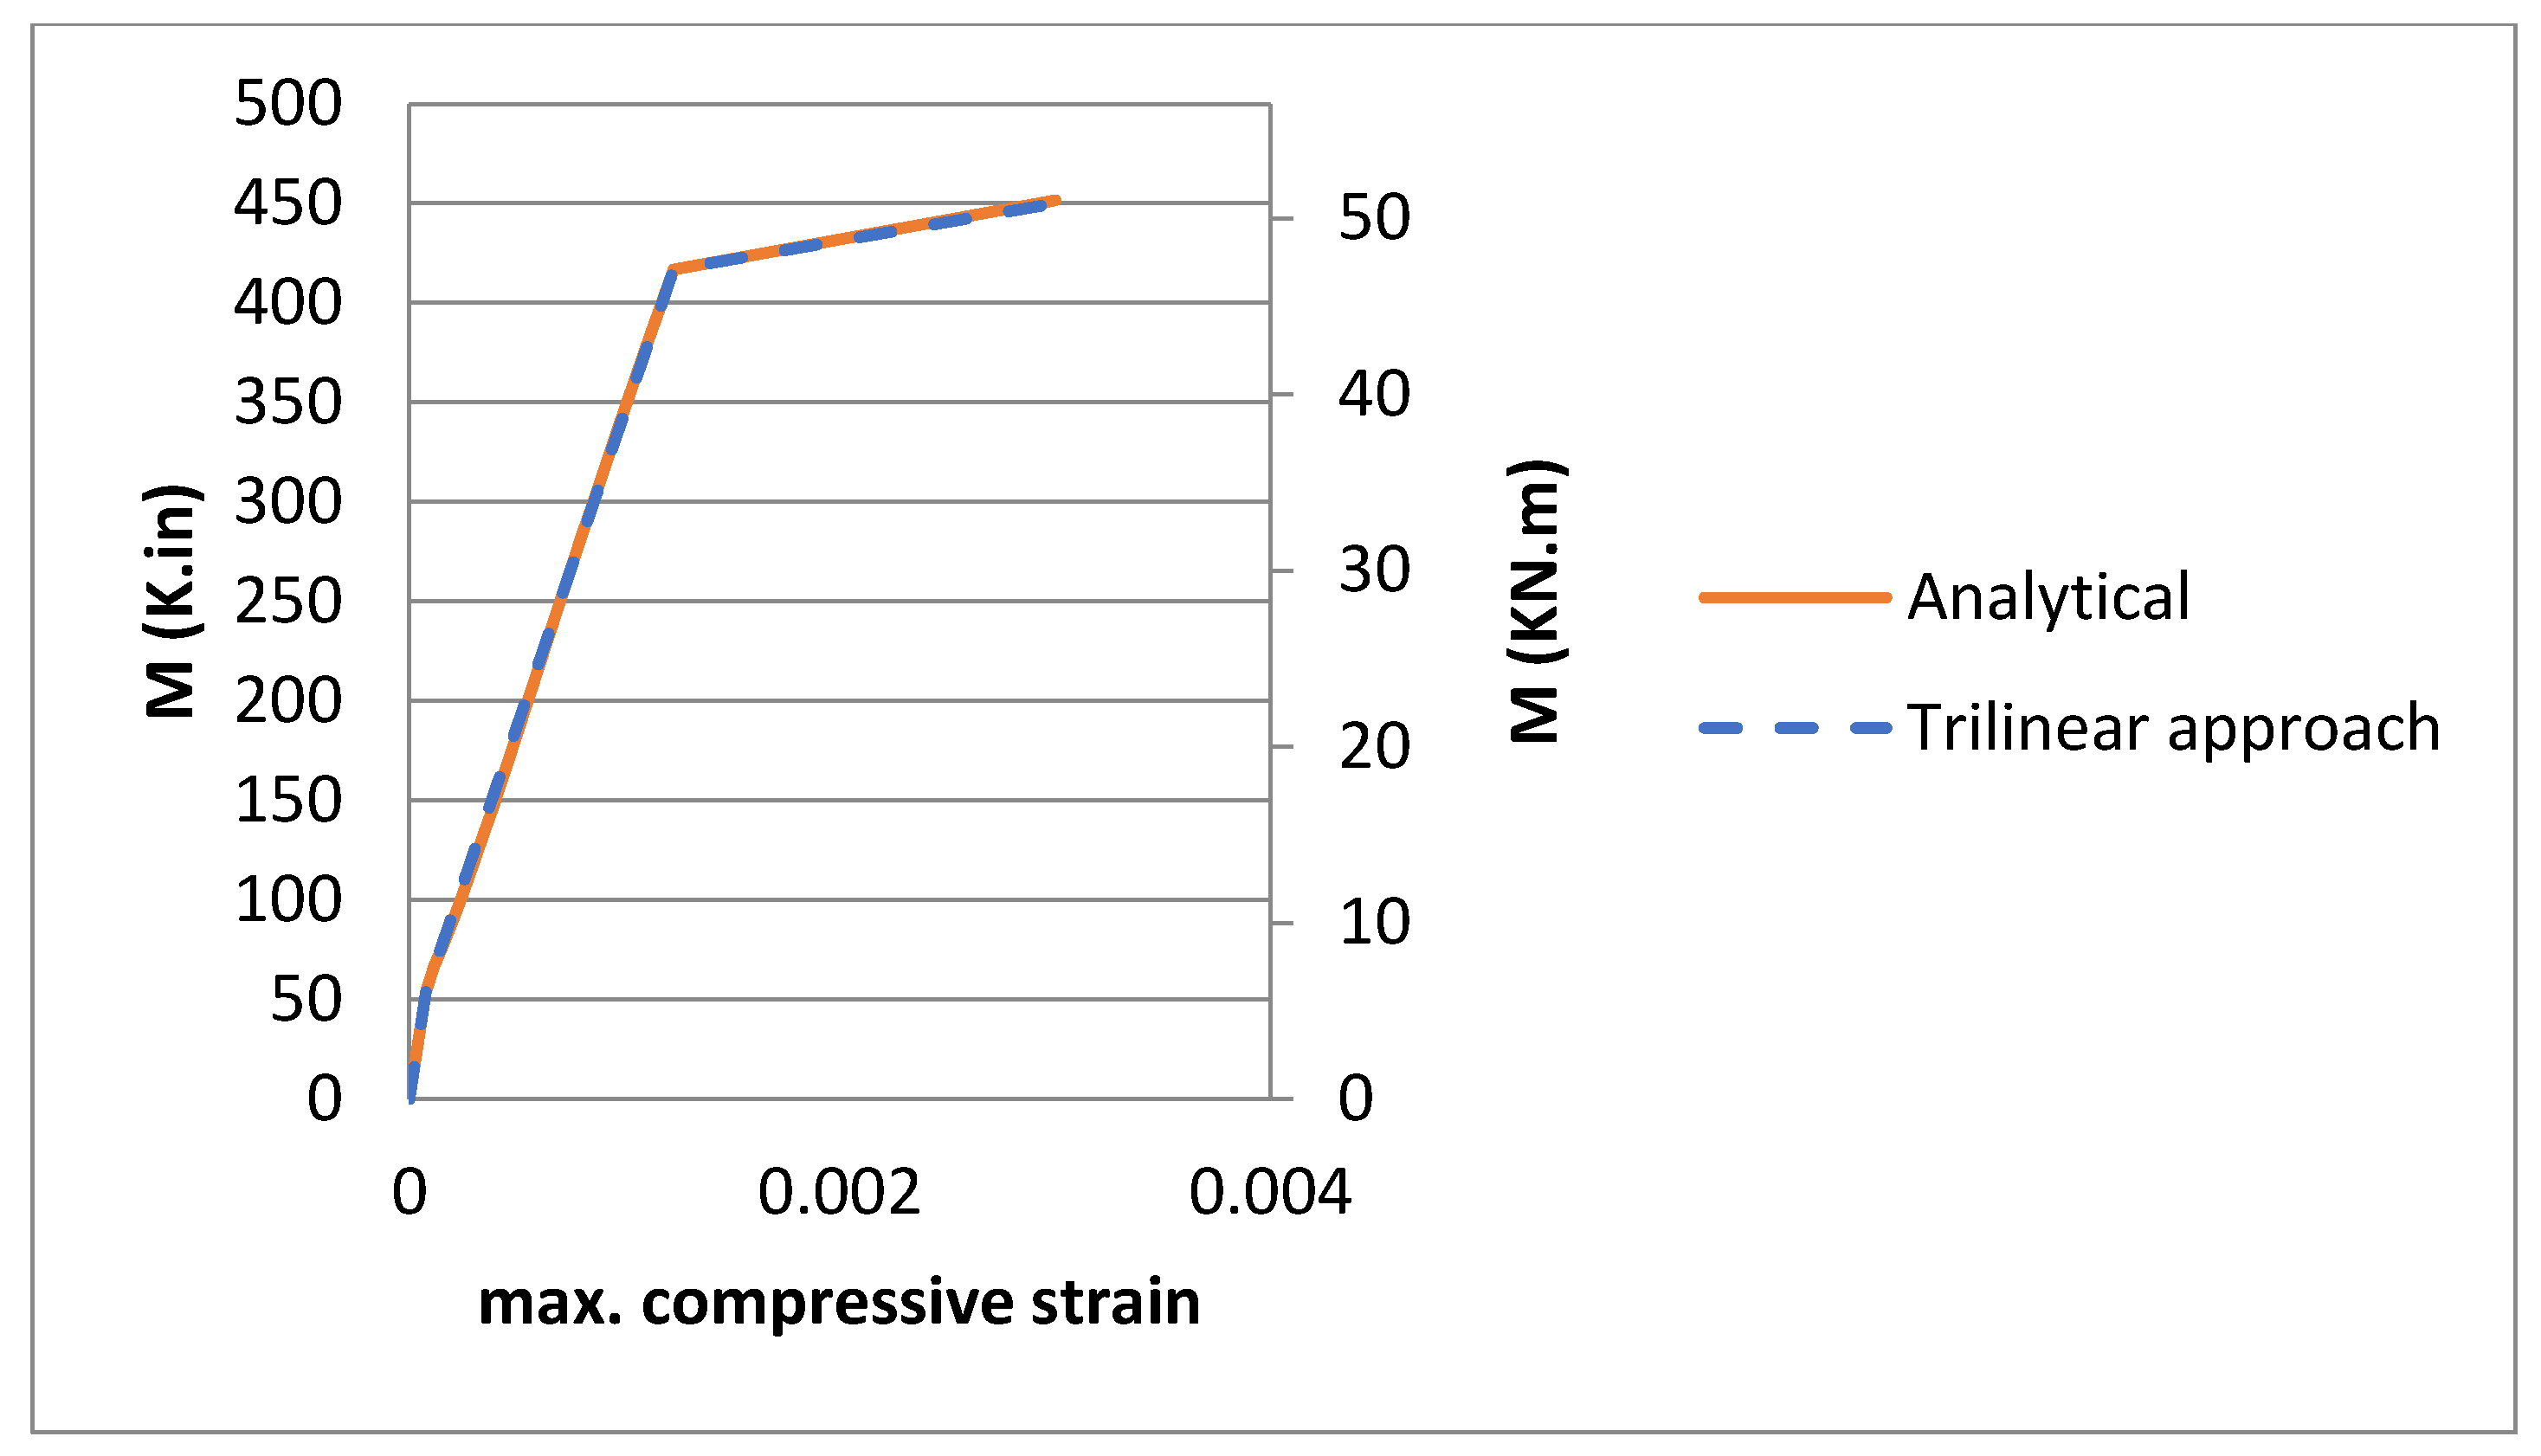
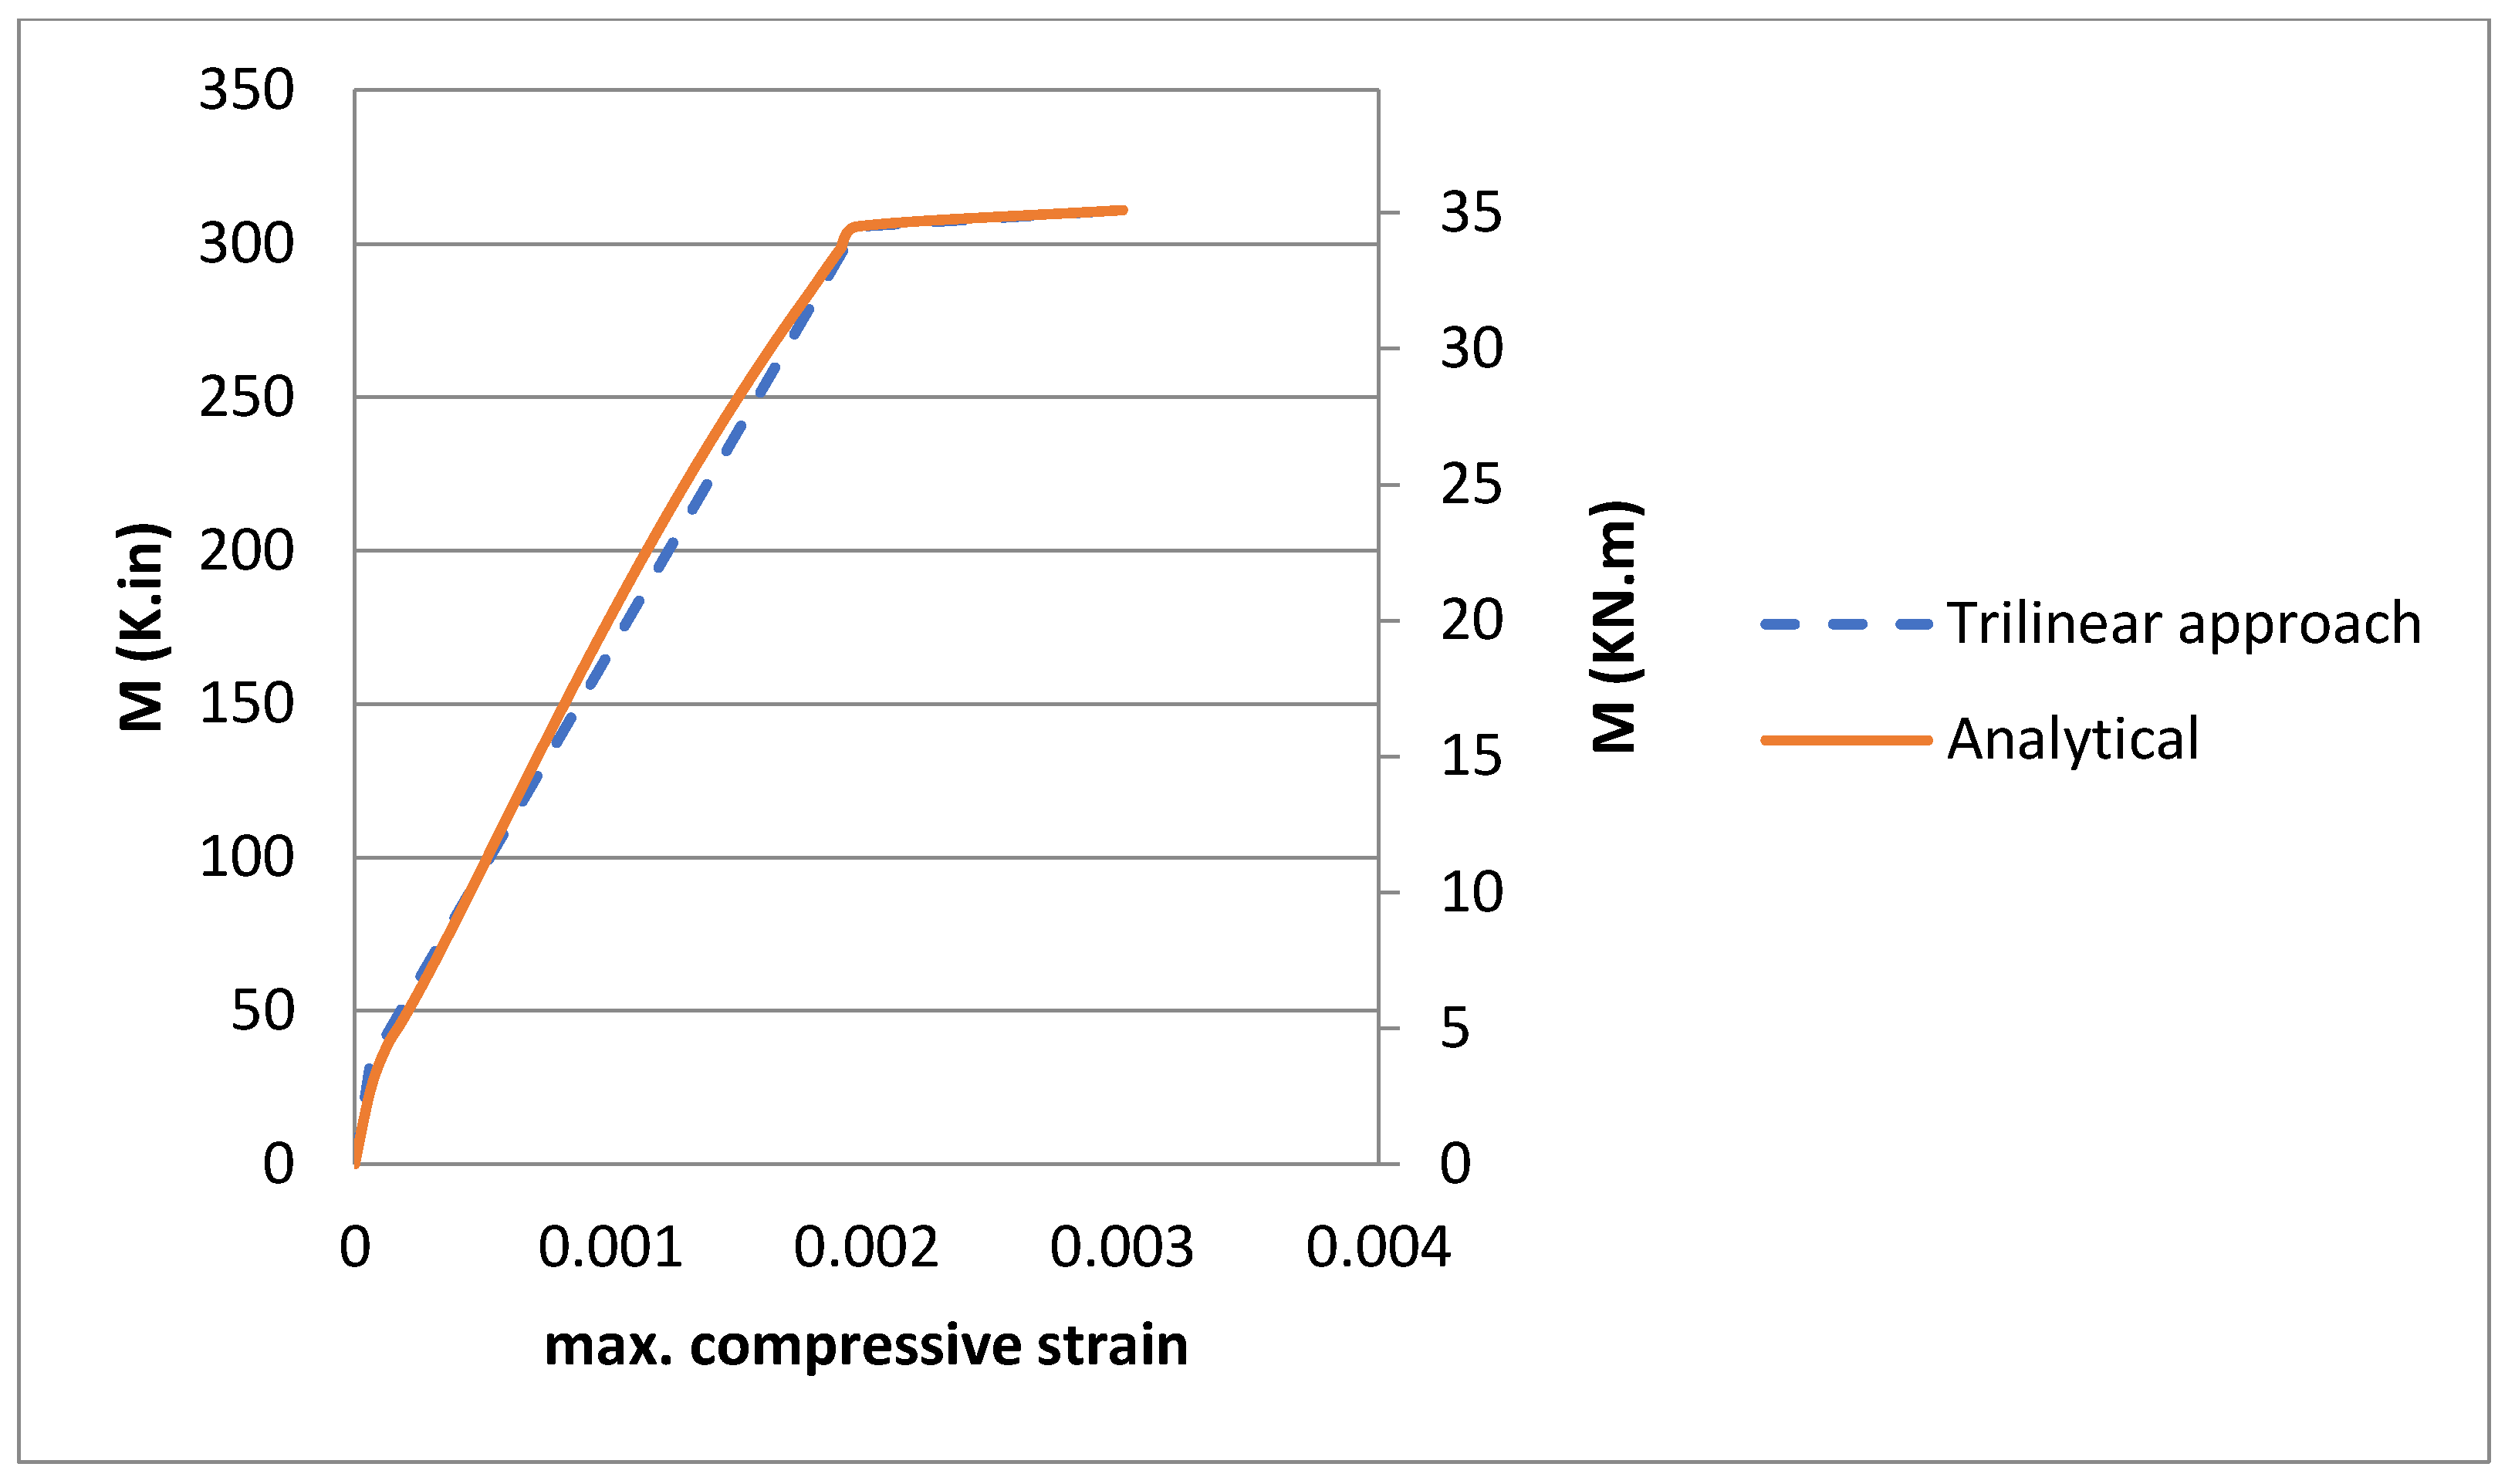
In addition, the moment–curvature graph and the moment–maximum compressive strain graph were developed to confirm the accuracy of the trilinear moment–curvature approximated behavior, (e.g.,
Figure 9 and
Figure 10).
The proposed analysis was performed for the tests conducted by Tavares et al. (2008) [
13], Arduini et al. (1997) [
14] and Spadea et al. (1998) [
15]. The geometric and material parameters of these beams are listed in
Table 2 and
Table 3. Excellent agreements were observed against Tavares et al. (2008), Arduini et al. (1997) and Spadea et al. (1998) experimental results—see
Figure 8. The trilinear analysis for moment–curvature behavior and moment–maximum compressive strain behavior was confirmed for the three experimental beams, see
Figure 9 and
Figure 10.
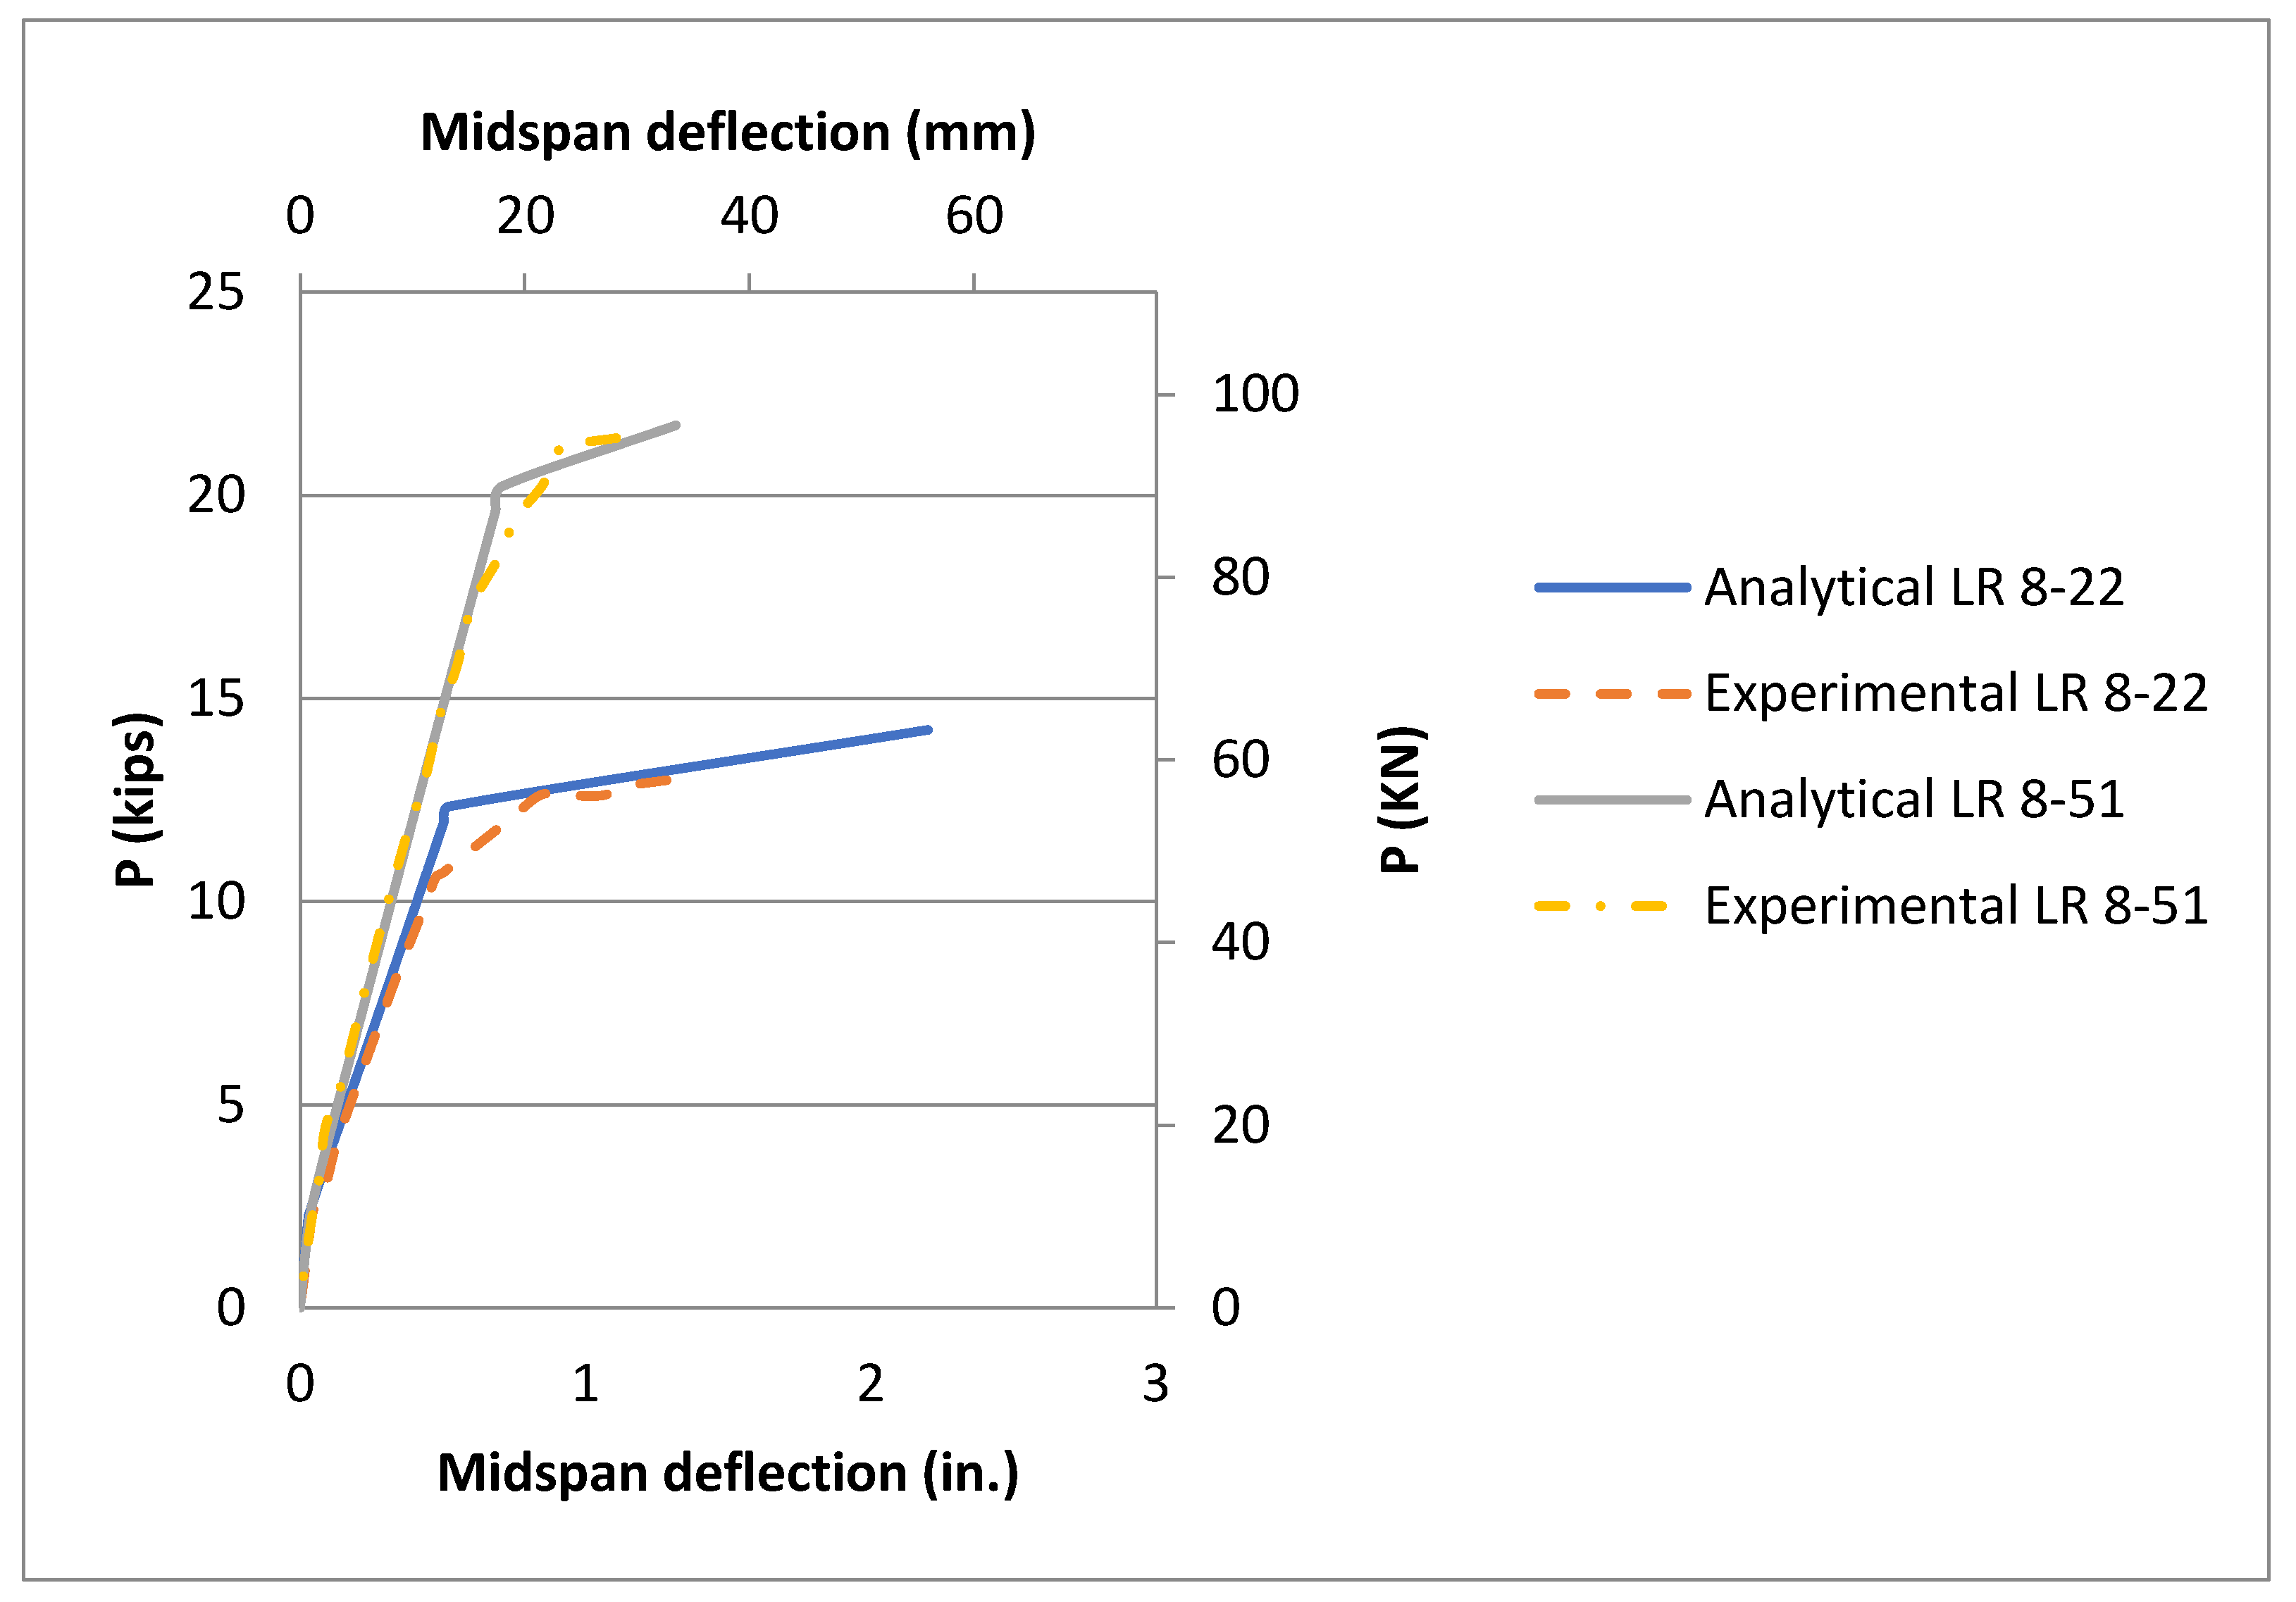
The four beams tested by Ahmed and Barker (1991) [
16] were analyzed here as well. All four beams have the same cross section 152.4 mm × 304.8 mm (6 in × 12 in) and the same clear span of 3.45 m (136 in). The beams were singly reinforced with (ρs = 0.0101, 0.0226, 0.0145, 0.0326) and high strength lightweight concrete f′
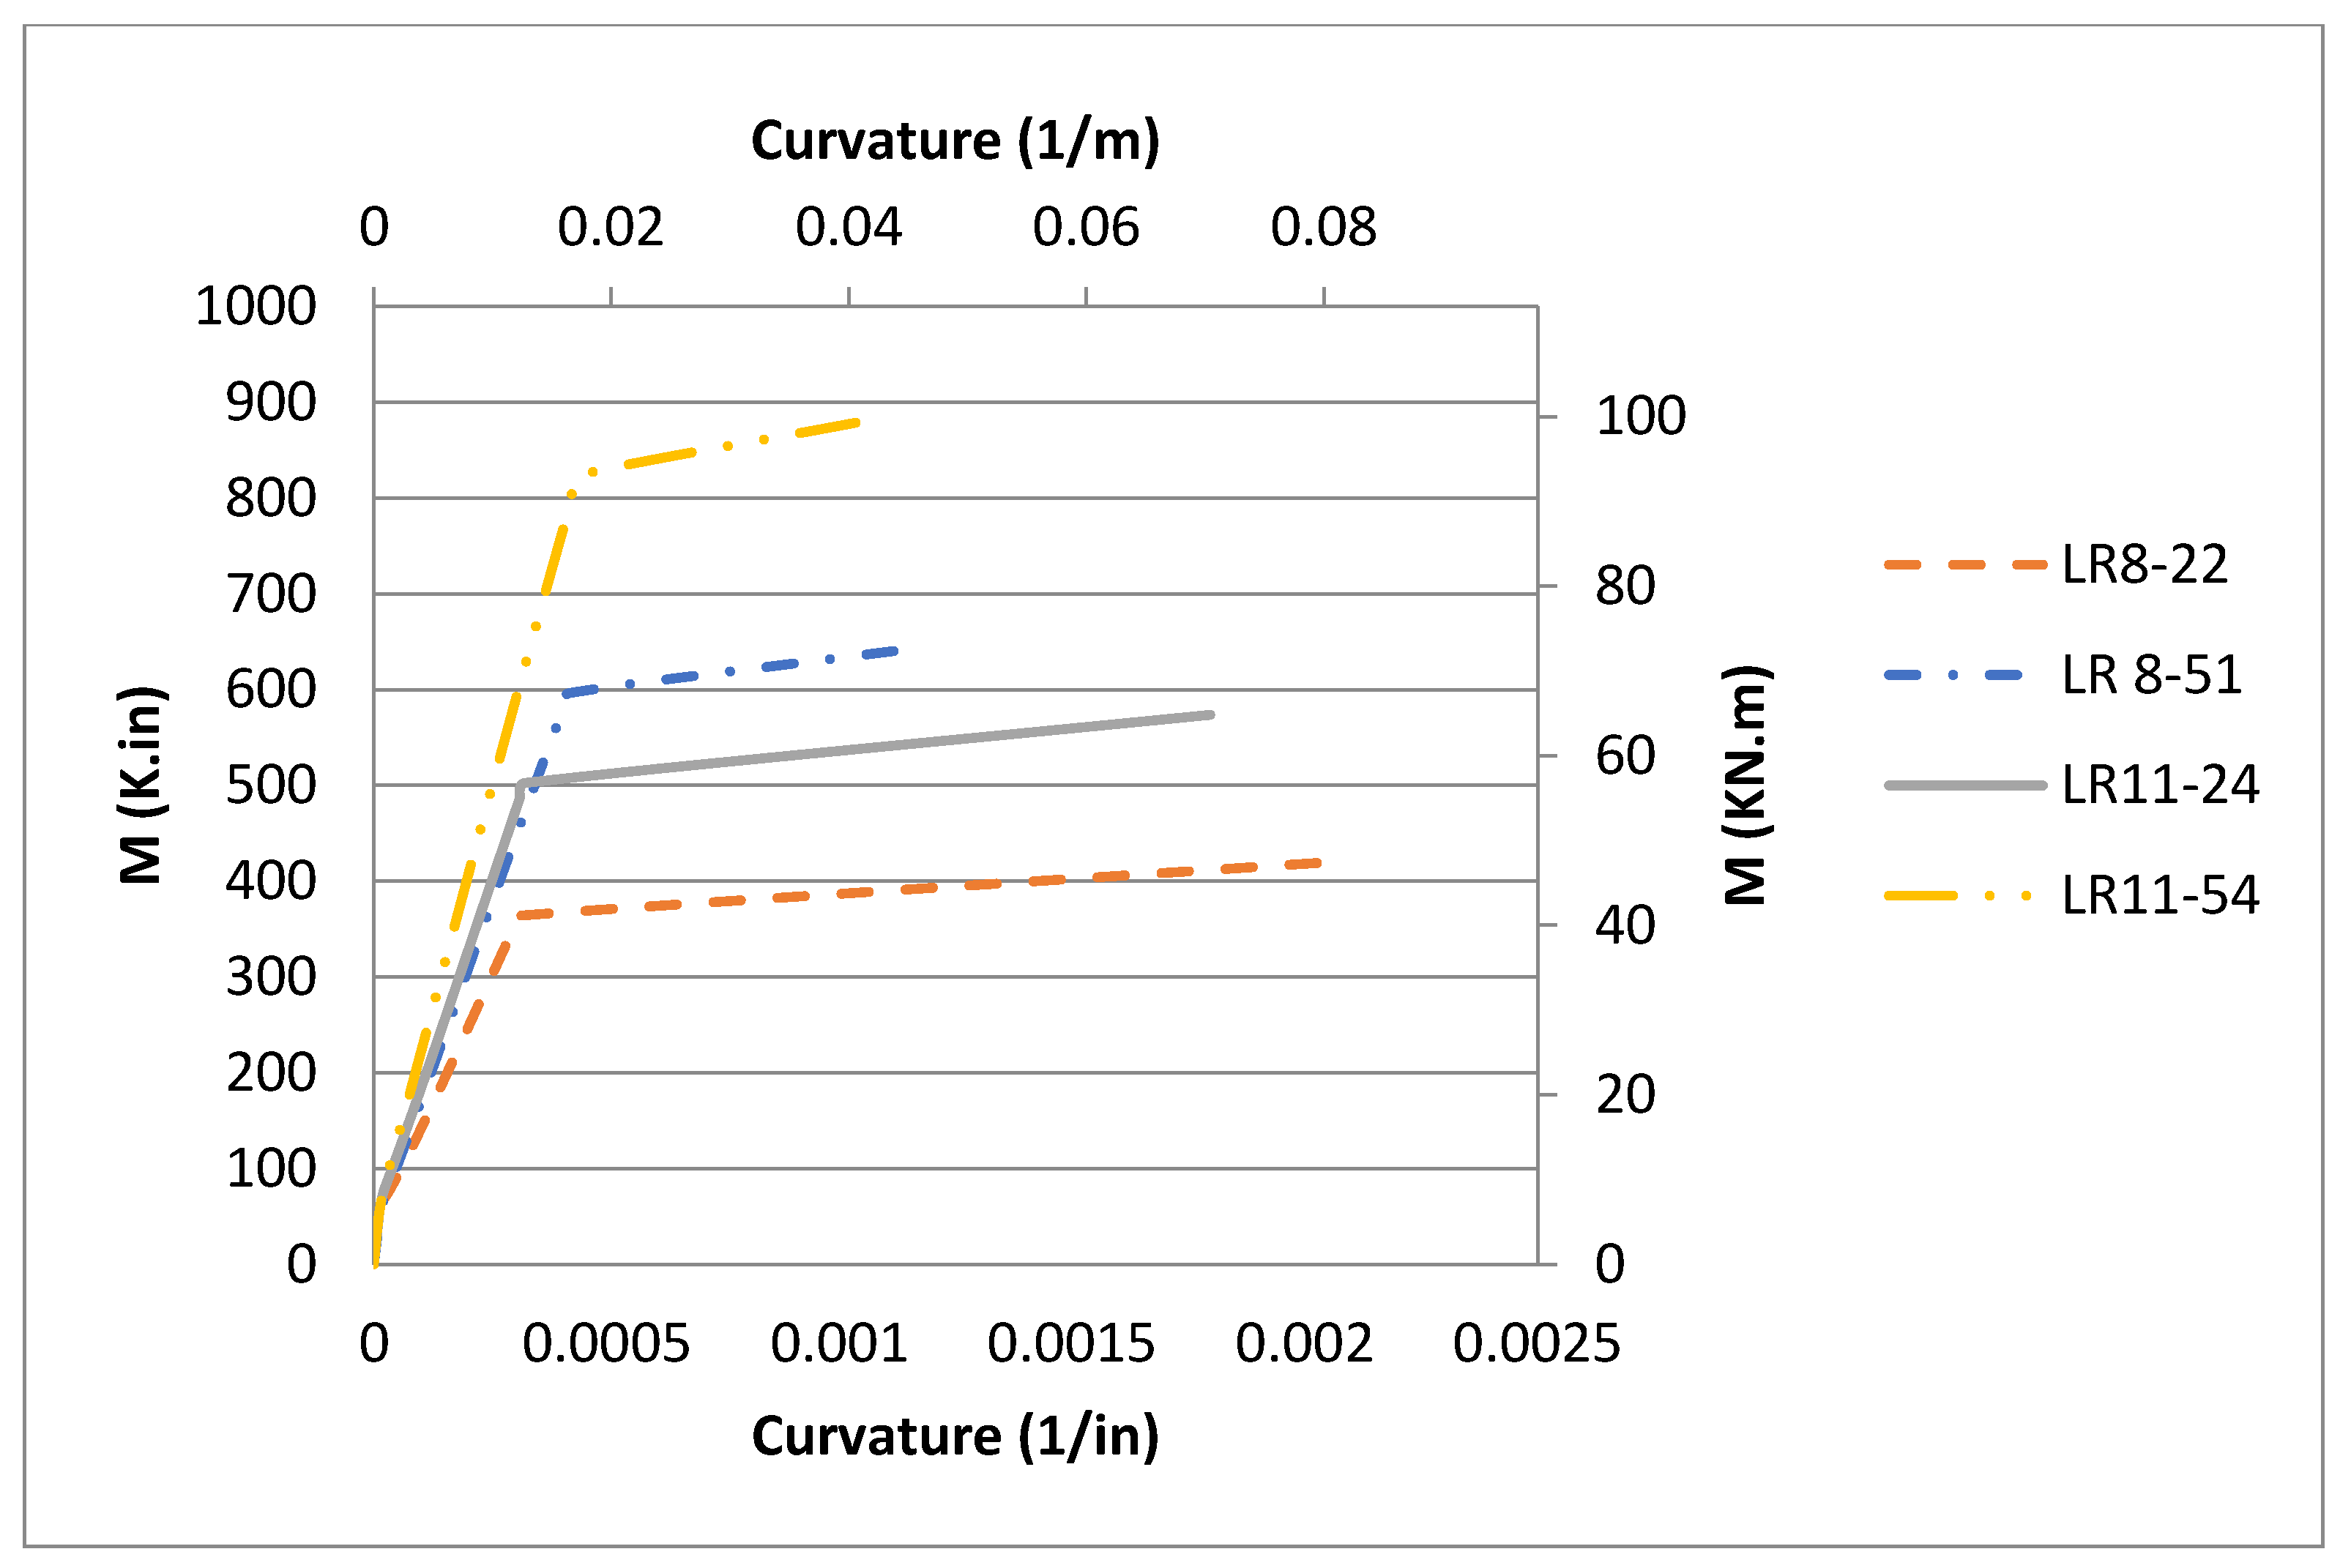
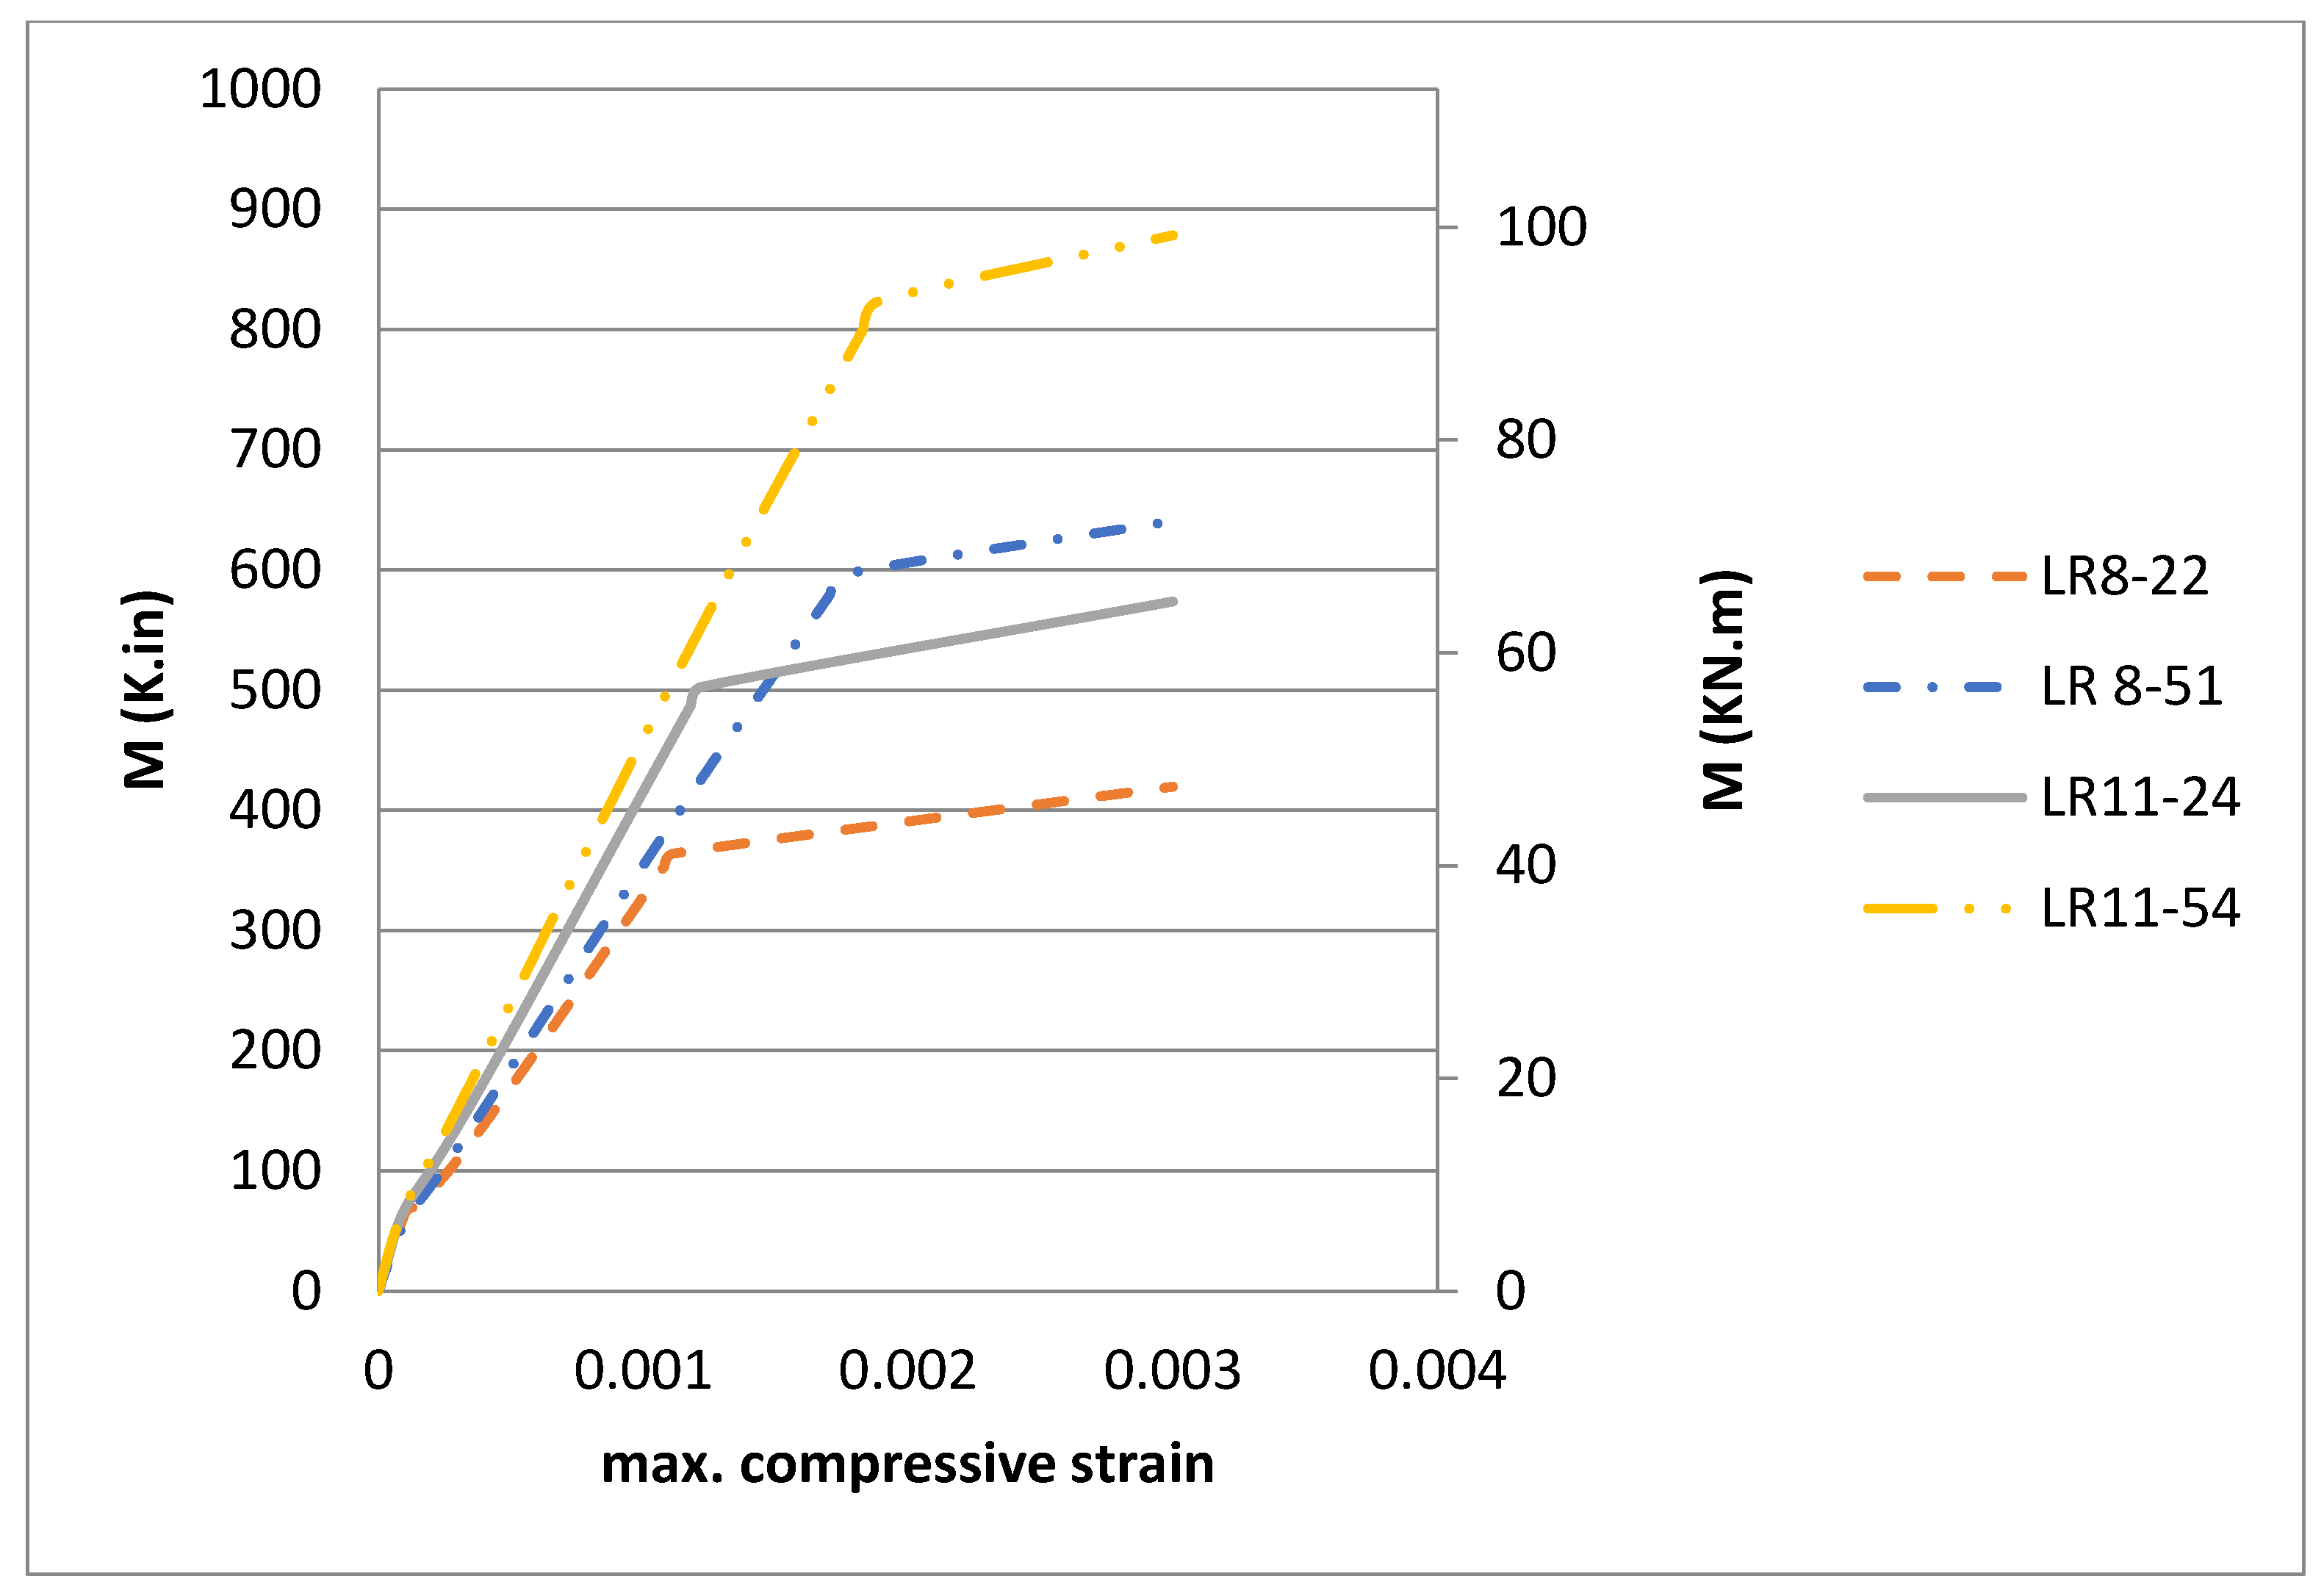
c of 59.3, 59.3, 80, 80 MPa (8.6, 8.6, 11.6, 11.6 ksi), respectively, for LR8-22, LR8-51, LR11-24 and LR11-54. Excellent matches were observed against the experimental curves for all four beams,
Figure 11 and
Figure 12. For all four beams, the trilinear behavior for the pre-cracking, post-cracking and post-yielding zones was fully confirmed for the moment–curvature and moment–maximum compressive strain responses—see
Figure 13 and
Figure 14.
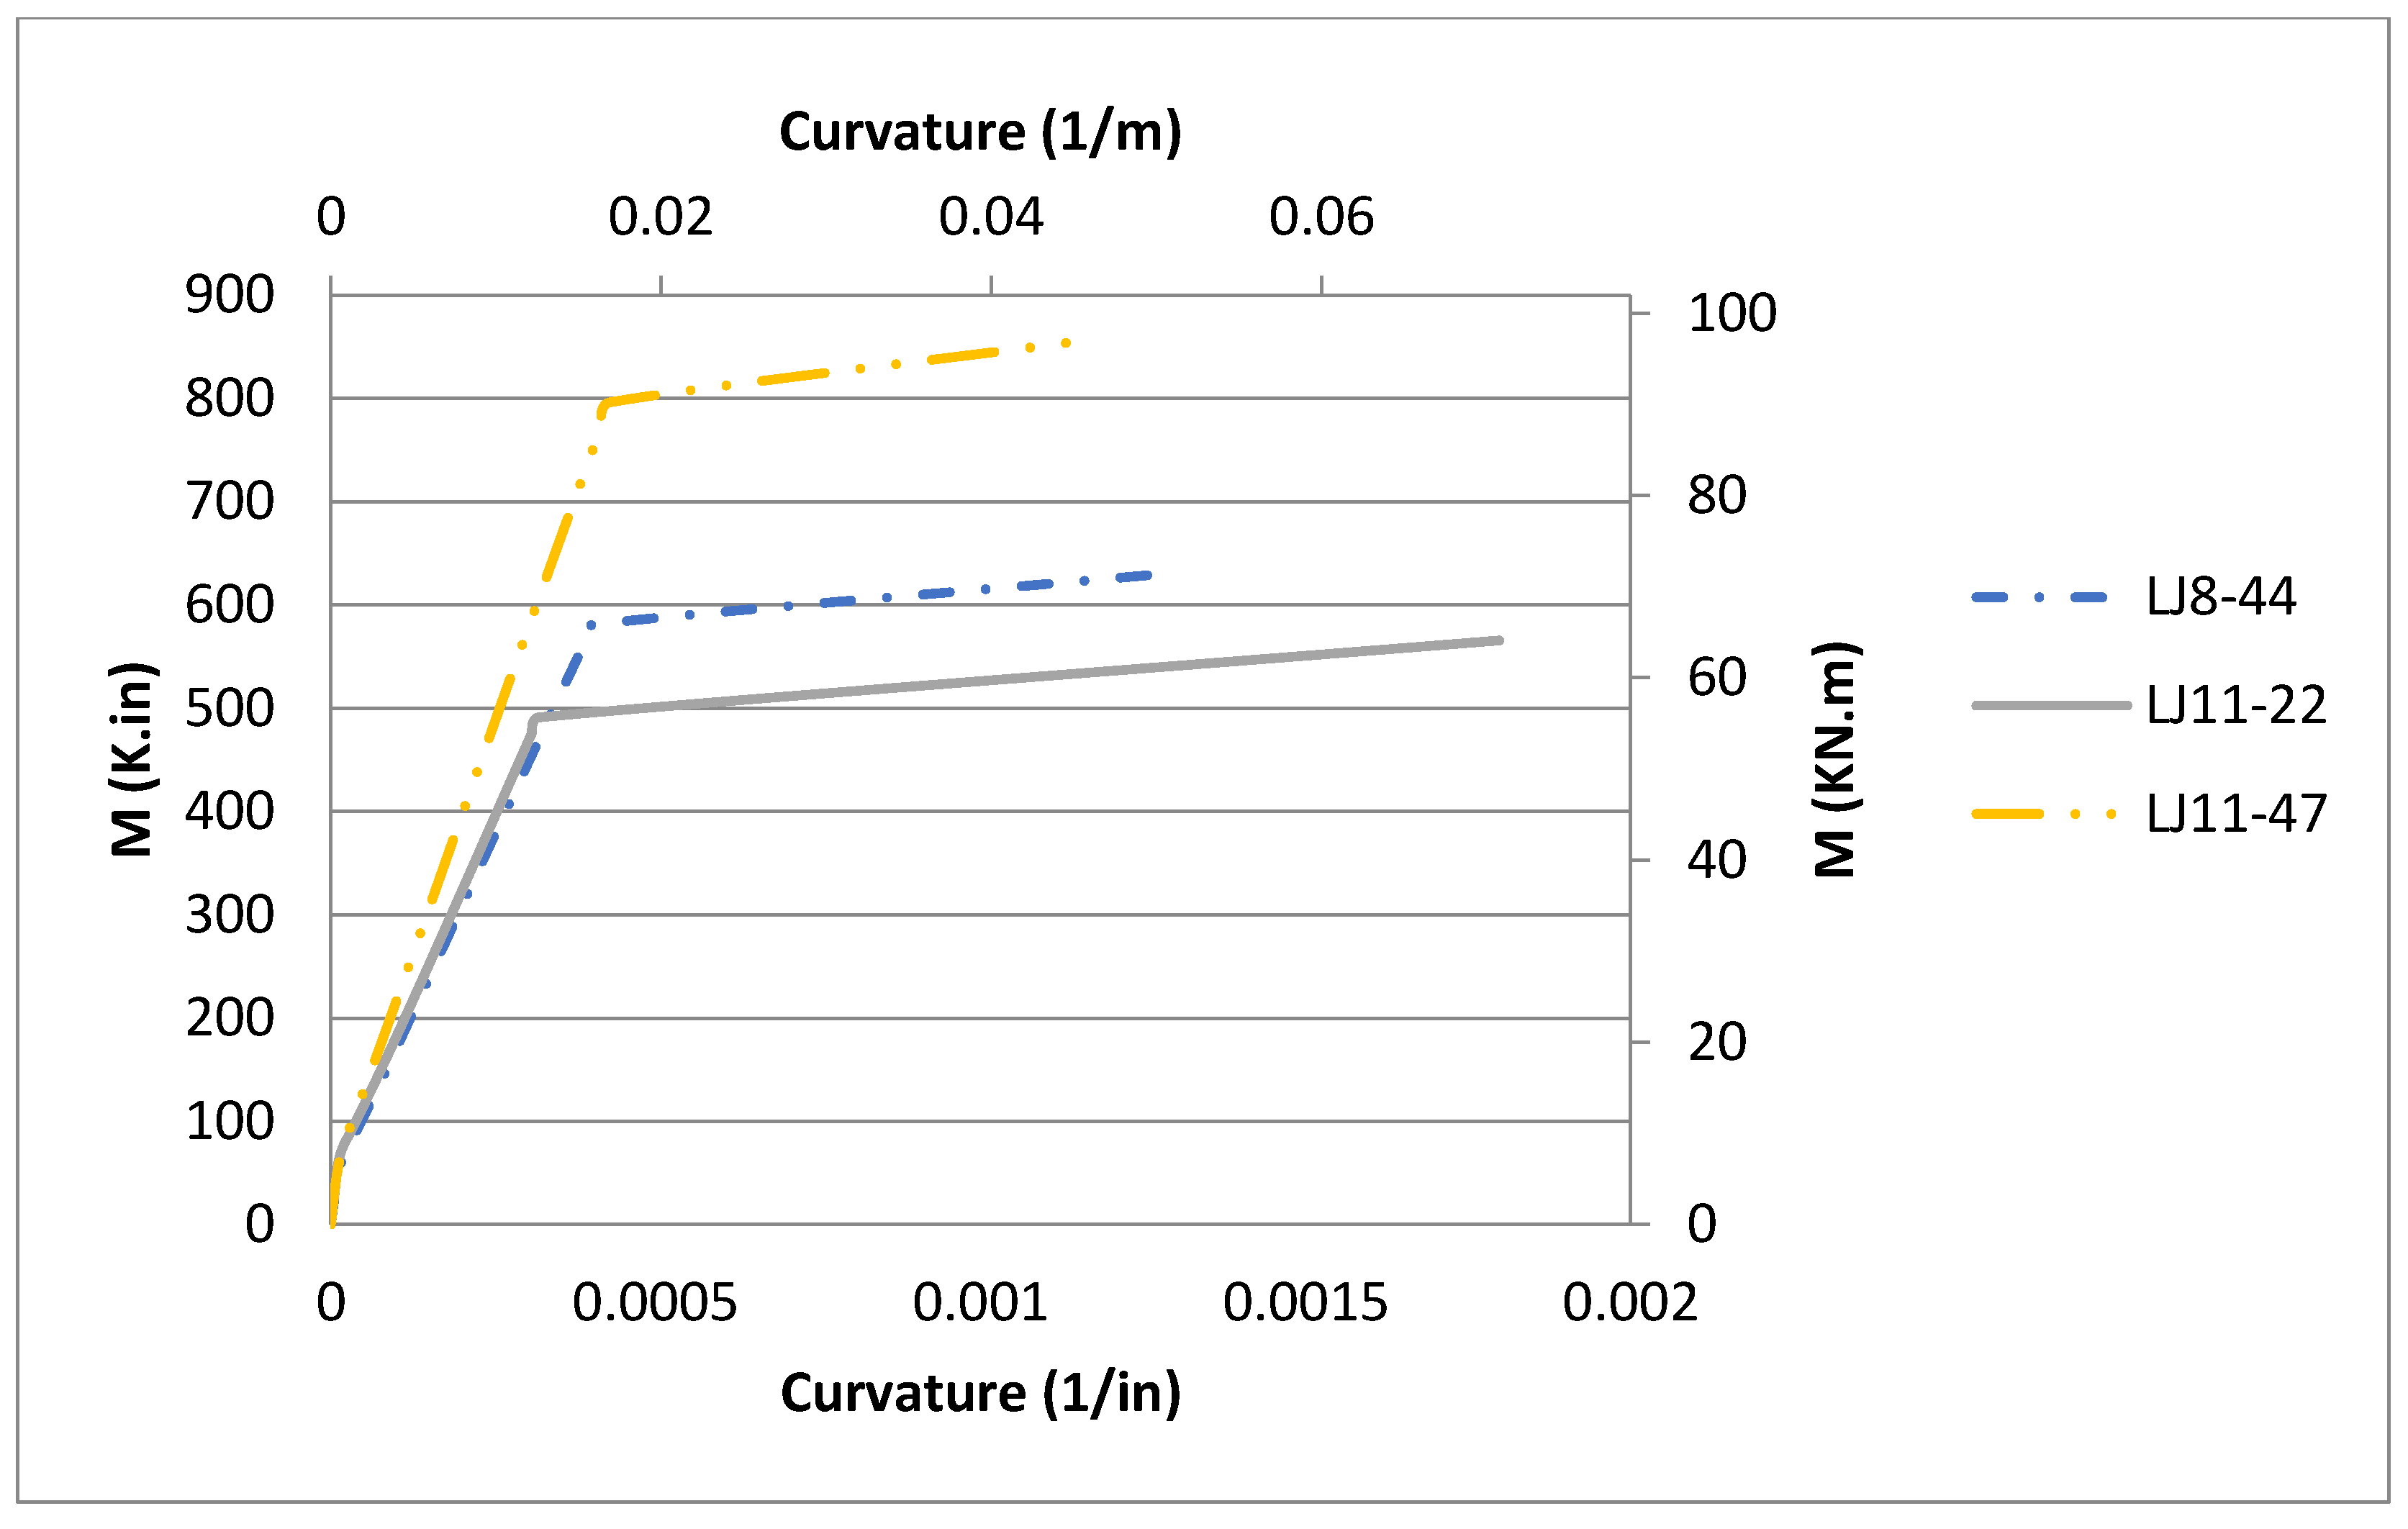
The last three analyzed beams were tested by Ahmad and Batts (1991) [
17]. All three beams have the same cross section of 152.4 mm × 304.8 mm (6 in × 12 in) and the same clear span of 3.45 m (136 in). The tested beams were doubly reinforced—see
Table 3. Light weight high strength concrete was used for all three beams. Excellent matches were obtained against the experimental results for all stages of loading, see
Figure 15. LJ11-22 showed a sudden change of stiffness in the post-cracking zone which generally indicates the development of shear cracks. For all three beams the trilinear behavior for the pre-cracking, post-cracking and post-yielding zones was fully confirmed for the moment–curvature and moment–maximum compressive strain responses, see
Figure 16 and
Figure 17.
Simplified Non-Linear Sectional and Beam Analysis
All previous comparisons showed a good agreement with the experimental data in terms of the global response of the beams. In this section, a detailed comparison is presented against two beams tested by Decker (2007) [
18] and Almusallam (1997) [
19]. Decker reported the global and sectional responses in his work. The sectional response was obtained by locating strain gauges at the tensile steel level and the top surface of the beam, which allowed for a full strain profile development. Unfortunately, Decker (2007) [
18] reported the failure of the strain gauges in the post-yielding zone. The beams were simply supported and were tested in four-point bending. The supports were placed 3 inches from the edge of the beam, providing a clear span of 4.72 m (15.5 ft).
Table 4 and
Table 5 show the geometrical and material properties of the beam. Similarily, Almusallam (1997) [
19] reported the experimental load–deflection and the experimental moment–curvature curves for a beam they tested.
Table 6 and
Table 7 show the geometrical and material properties of the analyzed beam.
The present analysis, of these two extra beams, was performed as described in this paper to obtain the load-mid span deflection graphs and the load-tensile steel strain curve as well as the moment–curvature and the moment–maximum compressive strain curves. This comparison was necessary to illustrate that the presented constitutive model matches not only the global response of the beam but also it matches the sectional local response.
A good agreement between the experimental and the present analytical load–deflection curve is shown in
Figure 18. This agreement confirms the accuracy of the proposed model against the global behavior of the beam. However, it is important to validate the constitutive tensile model against the local sectional response as well.
Figure 19 and
Figure 20 show load vs. maximum compressive strain and load vs. tensile steel strain. Excellent agreements between the present analytical and the experimental results were observed for the two comparisons. Furthermore, the present analytical sectional solution is compared against the trilinear sectional response developed by Rasheed et al. (2013) [
20] in
Figure 21 and
Figure 22. These comparisons confirm the trilinear behavior of the moment–curvature and moment–maximum compressive strain graphs.
Almusallam (1997) [
19] beam was also analyzed by the present analytical procedure.
Figure 23 shows the global analytical and experimental response. An excellent match was obtained using the proposed constitutive tension model for the analytical vs. experimental load–deflection data. Additionally, the trilinear behavior of the pre-cracking, post-cracking and post-yielding zones, developed in reference [
20], was fully confirmed for the moment–curvature curve against the present analytical and experimental response,
Figure 24. Furthermore, the moment–maximum compressive strain response of the present analytical solution is confirmed against the trilinear curve of reference [
20]—see
Figure 25. For further insightful experimental resources, the following three references are recommended for the reader to check out [
21,
22,
23].
5. Conclusions
This study was conducted to develop a tensile constitutive model by following an inverse nonlinear analysis framework of flexural concrete beams reinforced with steel bars. An incremental-iterative analysis scheme was followed to study the nonlinear flexural beam behavior and generate the analytical graphs. The proposed tensile constitutive model has a sudden drop at cracking strain, followed by a descending curve down to zero at . Series of comparisons were performed to validate the accuracy of the adopted model against the global experimental behavior for a large pool of beams. Two extra comparisons were conducted to check the applicability of the model against the sectional response of different beams. As a result of these comparisons, the model showed an excellent agreement with the validating experiments for the sectional and the global responses. The second main goal of this study was to confirm the trilinear-based behavior for moment versus curvature and moment versus maximum compressive strain graphs. Two additional beams were used for that purpose. Through all the comparisons in this study, and by using the proposed model, the trilinear behavior was verified in all the sectional and the global responses. Even though the literature has several tension stiffening models, the authors believe that this new model is more objective since:
The final degradation of cracked concrete is related to the yielding strain in steel rather than multiples of the cracking strain of the concrete.
The loss of energy due to cracking fracture is captured in a more pronounced way than earlier models.
The current model furnishes a single mathematical expression making it easier to implement in analytical formulations.
By minimizing the error between the analytical and experimental load–deflection responses in terms of the tensile constitutive model parameters, it was concluded that the fracture energy level released upon cracking and the vanishing of the tension stiffening contribution as it relates to the yielding strain in steel represent the more rational findings.
Author Contributions
Conceptualization, H.A.R. and A.A.; methodology, A.A. and H.A.R.; validation, A.A. and H.A.R.; formal analysis, A.A.; writing—original draft preparation, A.A.; writing—review and editing, H.A.R.; visualization, A.A.; supervision, H.A.R.; project administration, H.A.R.; All authors have read and agreed to the published version of the manuscript.
Funding
This research received no external funding.
Institutional Review Board Statement
Not applicable.
Informed Consent Statement
Not applicable.
Data Availability Statement
The data presented in this study are available on request from the corresponding author. The data are not publicly available due to inclusion in a follow up study under investigation.
Conflicts of Interest
The authors declare no conflict of interest.
References
- Laterza, M.; D’Amato, M.; Thanthirige, L.P.; Braga, F.; Gigliotti, R. Comparisons of codal detailing rules for curvature ductility and numerical investigations. Open Constr. Build. Technol. J. 2014, 8, 132–141. [Google Scholar] [CrossRef]
- Rousakis, T.C.; Karabinis, A.I. Adequately FRP confined reinforced concrete columns under axial compressive monotonic or cyclic loading. Mater. Struct. 2012, 45, 957–975. [Google Scholar] [CrossRef]
- Hillerborg, A.; Modeer, M.; Peterson, P.E. Analysis of crack formation and crack growth in concrete by means of fracture mechanics and finite elements. Cem. Concr. Res. 1976, 6, 773–782. [Google Scholar] [CrossRef]
- Leonhardt, F. Crack Control in Concrete Structures (IABSE Surveys); International Association for Bridge and Structural Engineering: Zurich, Switzerland, 1977; p. 26. [Google Scholar]
- British Standard Institution. Structural Use of Concrete, Part 2: Code of Practice for Special Circumstances; British Standard Institution: London, UK, 1997. [Google Scholar]
- European Committee for Standardization. Eurocode 2: Design of Concrete Structures—Part 1: General Rules and Rules for Buildings. The European Standard EN1992-1-1; European Committee for Standardization: Brussels, Belgium, 2004. [Google Scholar]
- Scanlon, A.; Murray, D.W. Time dependent deflections of reinforced concrete slab deflections. J. Struct. Div. 1974, 100, 1911–1924. [Google Scholar] [CrossRef]
- Vebo, A.; Ghali, A. Moment curvature relation of reinforced concrete slabs. J. Struct. Div. 1977, 103, 515–531. [Google Scholar] [CrossRef]
- Nayal, R.; Rasheed, H.A. Tension stiffening model for concrete beams reinforced with steel and FRP bars. J. Mater. Civ. Eng. 2006, 18, 831–841. [Google Scholar] [CrossRef]
- Rasheed, H.A. Inelastic Behavior of Reinforced Concrete Frame Structures. Master’s Thesis, University of Baghdad, Baghdad, Iraq, 1990. [Google Scholar]
- Hognestad, E. A Study of Combined Bending Axial Load in Reinforced Concrete Members; University of Illinois: Champaign, IL, USA, 1951; Volume 49. [Google Scholar]
- American Concrete Institute. Building Code Requirements for Structural Concrete (ACI 318-14) and Commentary (ACI 318R-14); American Concrete Institute: Farmington Hills, MI, USA, 2014. [Google Scholar]
- Tavares, D.; Giongo, J.; Paultre, P. Behavior of reinforced concrete beams reinforced with GFRP bars. IBRACON Struct. Mater. J. 2008, 1, 285–295. [Google Scholar] [CrossRef]
- Arduini, M.; Tommaso, A.; Nanni, A. Brittle failure in FRP plate and sheet bonded beams. ACI Struct. J. 1997, 94, 363–370. [Google Scholar]
- Spadea, G.; Bencardino, F.; Swamy, R.N. Structural behavior of composite RC beams with externally bonded CFRP. J. Compos. Constr. 1998, 2, 132–137. [Google Scholar] [CrossRef]
- Ahmad, S.H.; Barker, R. Flexural behavior of reinforced high-strength lightweight concrete beams. ACI Struct. J. 1991, 88, 69–77. [Google Scholar]
- Ahmad, S.H.; Batts, J. Flexural behavior of doubly reinforced high-strength lightweight concrete beams with web reinforcement. ACI Struct. J. 1991, 88, 351–358. [Google Scholar]
- Decker, B.R. Method of Strengthening Monitored Deficient Bridge. Master’s Thesis, Department of Civil Engineering, Kansas State University, Manhattan, KS, USA, 2007. [Google Scholar]
- Almusallam, T.H. Analytical prediction of flexural behavior of concrete beams reinforced by FRP Bars. J. Compos. Mater. 1997, 31, 640–657. [Google Scholar] [CrossRef]
- Rasheed, H.A.; Larson, K.H.; Nayyeri Amiri, S. Analytical solution of interface shear stresses in externally bonded FRP-strengthened concrete beams. ASCE J. Eng. Mech. 2013, 139, 18–28. [Google Scholar] [CrossRef]
- Van Mier, J.G.M. Strain-Softening of Concrete under Multiaxial Loading Conditions; Technische Hogeschool: Eindhoven, The Netherlands, 1984; pp. 32–39. [Google Scholar]
- Hordijk, D.A.; Reinhardt, H.W. Growth of discrete cracks in concrete under fatigue loading. In Toughening Mechanisms in Quasi-Brittle Materials; Springer: Dordrecht, The Netherlands, 1991; pp. 541–554. [Google Scholar]
- Van Vliet, M.R.; Van Mier, J.G. Experimental investigation of size effect in concrete and sandstone under uniaxial tension. Eng. Fract. Mech. 2000, 65, 165–188. [Google Scholar] [CrossRef]
| Publisher’s Note: MDPI stays neutral with regard to jurisdictional claims in published maps and institutional affiliations. |
© 2021 by the authors. Licensee MDPI, Basel, Switzerland. This article is an open access article distributed under the terms and conditions of the Creative Commons Attribution (CC BY) license (http://creativecommons.org/licenses/by/4.0/).

