Article

Molecular Characterization of the Organic Fraction of Municipal Solid Waste and Compositional Evolution during Oxidative Processes Assessed by HR-MAS 13C NMR Spectroscopy

by
Rosachiara A. Salvino
,
Giorgio Celebre
and
Giuseppina De Luca
*
Department of Chemistry and Chemical Technologies, University of Calabria, 87036 Arcavacata di Rende, Italy
*
Author to whom correspondence should be addressed.
Appl. Sci. 2021, 11(5), 2267; https://doi.org/10.3390/app11052267
Submission received: 4 February 2021 / Revised: 25 February 2021 / Accepted: 26 February 2021 / Published: 4 March 2021
(This article belongs to the Section Environmental Sciences)

Abstract

:
The use of high-resolution magic angle spinning (HR-MAS) 13C NMR spectroscopy is proposed here as an innovative and non-destructive approach to investigate the chemical composition of the organic fraction of municipal solid waste (OFMSW) and for monitoring the evolution of their composition during the oxidative iron-based Fenton treatment to which the initial matrix is subjected. The high quality and the good resolution of the 13C HR-MAS NMR spectra allowed an accurate assignment and quantification of the various types of carbon present in the analyzed organic matrix. Moreover, the HR-MAS has also shown its effectiveness in monitoring the different oxidative processes to which the same initially organic matrix has been subjected. The results obtained from the HR-MAS spectra on the collected samples during the different oxidative experiments, indicate that Fenton treatment is able to modify the percentage of the different types of carbons as a function of the concentrations of both Fenton reactants, H2O2 and Fe2+ salt, and of the oxidative process time.

1. Introduction

Solid waste management has become a relevant problem in modern society since the development of urban areas has led to a growth in waste production and consequently to a reduction in the places where all types of materials can be deposited [1]. The reduction in the quantity of waste to be stored in landfills has become a pressing problem and, consequently, different strategies and treatment methods suitable for this purpose are adopted [2,3]. First of all, recycling combined with avoidance, separate collection, and reuse contribute not only to waste reduction but also to energy saving and to the reduction in the amount of polluting and climate-altering emissions [4,5]. All these actions, and in particular separate collection, are very useful in reducing and recycling waste, but are not sufficient to achieve complete abatement, hence the need to develop new waste disposal and treatment methods that can convert waste into new products to be used in different fields so that the potential of waste can be fully exploited [6,7]. In order to choose the right technique, the first step is to classify waste according to its composition [8]. In this study, our attention is focused on the organic fraction of municipal solid waste (OFMSW), which includes food residues or food preparations and assimilable fractions, and which constitutes more than 30% of the total weight of municipal solid waste [9]. This waste fraction is generally converted into biogas [10] through anaerobic digestion [11,12,13] or transformed into soil improvers through a biological process of composting for use in agriculture [8,14,15]. These practices have many disadvantages related both to the time required for bacteria to degrade the various organic substances and to the possible problems of sickening smell or environmental pollution due to the accumulation of this fraction [16,17]. Henceforth, there is a need to develop new treatment methods that can be used as an alternative to the existing ones which are even more economically and ecologically advantageous. The chemical-physical process based on Fenton reagents, an oxidative method commonly used to treat a large variety of pollutants in water (phenols, formaldehyde, BTEX pesticides, rubber chemicals, and so on) seems to be one of the promising methods in treatment of OFMSW [18,19,20,21]. Indeed, this treatment has been tested by us and other colleagues within the project known by the acronym ReSIFaC (see Acknowledgements), and it seems to be a fast composting method by limiting the typical olfactory problems and allowing one to obtain a good compost to be used as a soil conditioner [22]. The characterization of the starting organic materials and the understanding of all the transformations they undergo during the oxidation process is of considerable importance both for the evaluation of the method and for assessing whether the final compound obtained is stable to be used as a soil improver [23]. Classically, the characterization and quantification of organic substances in municipal solid waste require extraction and fractionation, processes that are tedious and time-consuming [24]. In recent years, several spectroscopic methods have been used for the characterization of molecular components in waste, such as Fourier transformed infrared (FTIR) spectroscopy, UV-visible spectroscopy, fluorescence spectroscopy, and NMR spectroscopy. However, FT-IR spectroscopy is a good qualitative technique for monitoring the functional groups of organic matter, but it is only semi-quantitative and poorly selective. UV-visible spectroscopy is not quantitative and selective and, although the equipment is low-cost and easy to use, it is not applicable directly to organic waste, but it requires extraction processes. Likewise, fluorescence spectroscopy requires compact and economical equipment, but despite being a fast, sensitive, selective, and quantitative method, it is not applied directly to solid samples, but only to extracts or suspensions.
Among the instrumental techniques used to obtain this kind of information, solid-state nuclear magnetic resonance (SS-NMR) spectroscopy must certainly be included [25,26]. This technique requires advanced scientific skills and expensive equipment, but the undoubted advantages are due to the possibility to: i) investigate samples without any need for extraction and fractionation; ii) collect direct and quantitative information on the structural characteristics of organic substances in the organic waste; iii) highlight the possible variations in the composition of organic substances during composting processes [27]. In order to apply to the solid substances or solid mixtures, the NMR requires the use of special techniques to overcome many difficulties in the analysis of such samples, such as cross-polarization (CP) and magic angle spinning (MAS), which reduce/eliminate the line broadening observed in the spectra of these anisotropic samples. This technique is known as CP-MAS NMR spectroscopy.13C CP-MAS NMR spectroscopic analyses have already been used to characterize the families of chemical compounds present in organic waste, as reported in several papers [28,29,30,31]. Due to its nature, organic waste is in a state that is not simply solid but it is intermediate between the solid and liquid states. Indeed, organic waste can be considered a heterogeneous system endowed with liquid-like dynamics. For this kind of system, high-resolution magic-angle spinning (HR-MAS) NMR spectroscopy has become an extremely versatile technique. Many studies of semisolid materials have been carried out using this technique, which combines the “high-resolution” NMR for liquids and the “line-narrowing” for solids, in order to obtain NMR spectra of semisolids with a spectral resolution comparable to liquid-state NMR spectroscopy. There are numerous journal reviews and books dedicated to HR-MAS NMR spectroscopy [32,33], due to its large number of applications (cancer tissues, food science, cellular science, material science, etc.) [34,35] but, to our knowledge, organic waste samples have not yet been studied with this spectroscopic technique, although their physical state makes them an ideal matrix. As reported in the literature, the HR-MAS method has been used to investigate systems related to agriculture by performing a qualitative characterization and a quantitative analysis of the organic compounds present in the samples using 13C-labeled substances [36]. Moreover, the 13C HR-MAS was employed for the direct evaluation of the degree of substitution (DS) in an organic matrix represented by carboxymethyl cellulose (CMC) [37]. In this work, the authors use the integrals obtained from the 13C HR-MAS spectra to calculate the DS of different CMC samples and, to validate the method, they conduct experiments on specially prepared standards under controlled conditions.
The main purpose of this work was to probe the feasibility of using the HR-MAS technology to characterize the families of organic materials present in a sample of OFMSW and to monitor possible variations in their composition following iron-based oxidative treatments (Fenton reaction). To this end, we used the qualitative and quantitative information extracted from the 13C–{1H} HR-MAS NMR spectra recorded on a starting sample of OFMSW and on samples collected during, or at the end, of several oxidative treatments to which the same starting material was subjected. Note that, in order to understand if the HR-MAS technique was able to appreciate any variations in the composition of organic families, we followed different Fenton treatments applied to the same starting matrix, varying different parameters, namely the concentrations of the Fenton reagents (FeSO4 and H2O2) and the reaction times.

2. Materials and Methods

2.1. Sample Collection and Preparation for NMR

The samples were supplied from another department of the project and the experimental details of this process are given outside this work, with only the highlights being reported below. The waste used for the Fenton treatment was obtained through a sampling procedure lasting 12 days. In each of these days, waste was taken from a group of four different families, each day a different one. The waste collected on each sampling day (about 5 kg) was mixed and milled to a millimeter size by means of a steel blender. The resulting minced material was stored at −20 °C for 12 days. After this time, all the daily rates were defrosted and mixed together; the material obtained was divided into bags of 200 g, re-frozen and then used, after heat treatment at 110 °C, as the starting matrix for the oxidative treatment. The oxidation reaction [18] was carried out using a laboratory-scale glass reactor apparatus. The sample of organic material, 200 g, was placed into the glass rector and the Fenton reagents were added: 10 mL of a FeSO4 solution followed by addition of 10 mL of hydrogen peroxide (H2O2) solution. The mixture was kept under stirring conditions, the reactor was placed in a water bath, and the internal temperature was kept at 60 °C for the duration of the reaction. The pH of the mixture, initially at 4.5, was allowed to decline to pH 3.0 and was maintained until the reaction was complete. The samples used for the NMR experiments were collected during the phases of oxidation procedure and were differentiated according to the different percentages of H2O2/FeSO4 used. A first sample, called Sample 0, was collected from the batch of organic waste subjected to heat treatment (110 °C for 48 h). Three samples, called Sample 1, Sample 2, and Sample 3, were collected, and waste was treated for 12 h with the same amount of FeSO4, 0.05%wt, but different concentrations of H2O2, i.e., 0.002%wt, 0.0015%wt, and 0.0006%wt respectively. In order to understand the transformations that the waste undergoes during the oxidation process and to investigate the best experimental conditions, samples were collected at regular intervals during two different process (process A and process B). For process A, carried out by treating the waste with a solution of 0.002%wt of H2O2 and 0.01%wt of FeSO4, four samples were collected by withdrawing the substance from the reaction flask at regular 3 h intervals, i.e., Sample 4_3 h, Sample 4_6 h, Sample 4_9 h and Sample 4_12 h. Other four samples were collected for process B, carried out by adopting the conditions of Sample 3 (0.0006%wt of H2O2 and 0.05%wt FeSO4), i.e., Sample5_3 h, Sample 5_6 h, Sample 5_9 h and Sample 5_12 h, always at 3 h intervals. Moreover, another sample was collected for process B after a complete process of 8 h, Sample 6_8 h. This sample was collected in order to check if the reaction is complete after 8 h, as reported in reference [22], where the authors applied the Fenton reaction to an anaerobic digestate sample. In Figure 1, the experimental steps, the reaction conditions and the NMR samples collected during all oxidative treatments are reported. For the NMR experiments, samples were prepared by inserting 50 mg of substance into 5 mm zirconium rotor with 0.05 mL of D2O and a small amount of TMS. The D2O was used as the field frequencies lock signal and TMS for internal referencing of 13C chemical shifts. No additional treatment was necessary.

2.2. NMR Spectroscopy and Data Processing

All HR-MAS NMR spectra were obtained on a Bruker Avance 500 MHz spectrometer (Fällanden, Switzerland), operating at a 13C resonance frequency of 125.758 MHz, equipped with a BVT–3000 device for temperature control and an HR-MAS 5 mm probe. All measurements were made at a spin rate of 4 KHz and at room temperature, acquiring 32 k points with 5000 scans and using the inverse-gated pulse sequence (zgig) in order to avoid the nuclear Overhauser effect (NOE) and obtain quantitative 13C information from the 13C–{1H} NMR spectrum. Data were processed using Bruker TopSpin 3.6 software (Bruker BioSpin, Rheinstetten, Germany) [38]: the time-domain spectra were apodised with exponential function, and then Fourier-transformed, phased, and baseline-corrected automatically. In order to remove the background signal due to the Kel-F rotor cap, to each spectrum has been subtracted the 13C spectrum obtained from a blank sample consisting in D2O and TMS. The chemical shifts were referred to the TMS signal (δ = 0.00 ppm). In the semi-quantitative procedure, the global chemical shift range of carbon in the spectra was subdivided into sub-regions, as shown in Table 1.
Each signal was integrated using the TopSpin 3.6 software and was expressed as a percentage respect to the total integration area. The integration errors were calculated using the root-mean-square (RMS) method, by which the noise RMS was calculated as:
R M S = i n λ i n
where λ is the intensity of the i-point (in ppm) out of the total n-points. The RMS value, obtained in this way, represents the height of the noise. Subsequently, this value was used to estimate the error expressed as a percentage of the intensity of the signal and this percentage has been used to estimate the error bar of the integral of each NMR peak [39].

3. Results and Discussion

The most important advantage of the HR-MAS technique compared to the solid-state NMR is the possibility to obtain well-resolved NMR spectra [40]. Both 1H and 13C NMR spectra can be obtained with a spectral quality similar to the liquid state. However, since the organic waste is a complex system, the 1H HR-MAS NMR spectra are quite complex, due to the overlapping of the signals of the various compounds, and, therefore, for our investigations, the 13C spectra have been used. A typical 13C–{1H} NMR spectrum of the organic waste obtained using the HR-MAS NMR technique is shown in Figure 2a, where the carbon spectrum of Sample 0 (in blue) is compared with an OFMSW spectrum found in literature and obtained using the CP-MAS NMR technique (in black) [26]. Although the two spectra show a similar distribution of the peaks, an improvement in resolution is clearly visible in the HR-MAS spectrum in which the signal lines are much narrower. Figure 2b shows the NMR HR-MAS 13C–{1H} spectrum of Sample 0 in which the different regions are indicated. The region from 12 to 40 ppm is the classic region of aliphatic carbons signals, probably due to the presence of lipids and fatty acids in the OFMSW mixture that we used. The region from 58 to 100 ppm is due to the carbon atoms signals linked to heteroatoms. Note that this region of the spectrum has the same profile as the typical CP-MAS starch spectrum, as shown in the box of Figure 2b where the comparison of this region is reported [31]. From 125 to 130 ppm, this is the region of unsaturated carbon atoms signals, i.e., signals due to unsaturation in fatty acids and/or to aromatic species; finally, the region from 169 to 183 ppm is related to the signals of carbonyl carbons (acids, esters, ketones, amides, and aldehydes).
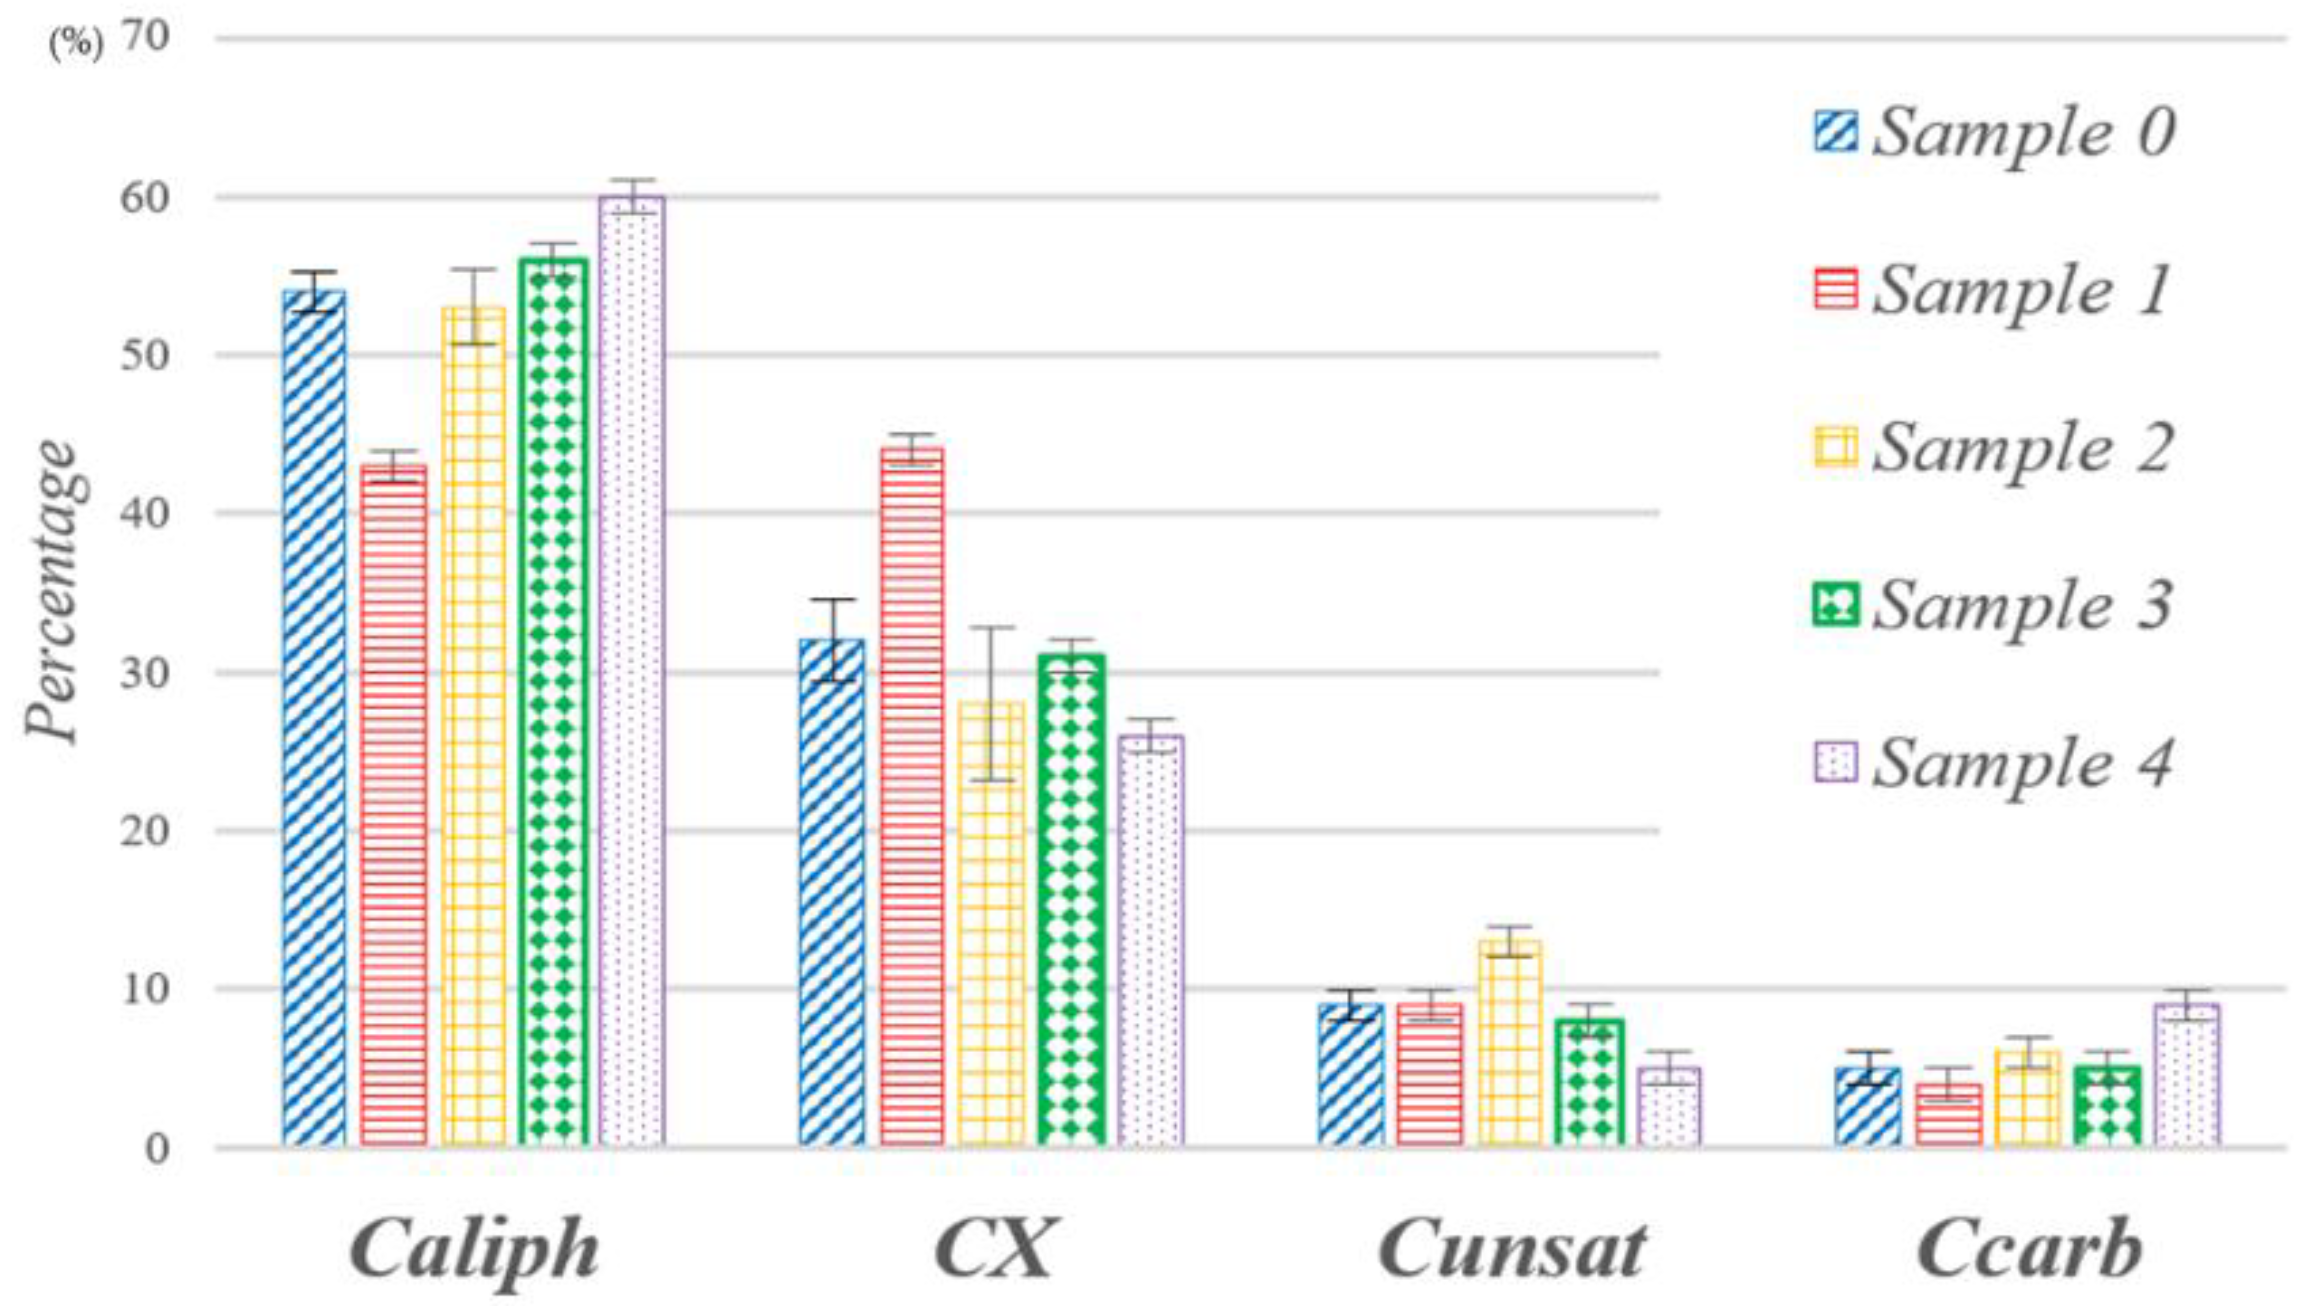
A detailed list of the overall chemical shift range of carbons is shown in Table 1 and these chemical shift ranges are used to evaluate the area of the signals. Indeed, unlike the CP-MAS spectrum in which it is possible to integrate only large signal ranges, in the spectrum of Figure 2b, the good resolution allows a better integration on the individual signals. In particular, the area of each signal of the spectrum was integrated and the quantitative information was grouped according to the nature of the atoms (aliphatic carbon atoms: Caliph; carbon atoms linked to heteroatoms: CX; unsaturated carbon atoms: Cunsat and carbonyl carbon: Ccarb). In Table 2, the 13C NMR integrated area of the different carbon type of Sample 0 are reported. In order to understand if the HR-MAS method is able to appreciate the possible chemical differences among the initial organic substrate and the products after the oxidative process, three samples, Sample 1, Sample 2, and Sample 3, were analyzed. The three samples are related to oxidative processes in which the initial OFMSW matrix was treated with the same amount of FeSO4 but with different quantities of H2O2. It is worth noting that the carbon spectra of Sample 1, Sample 2, and Sample 3 have the same spectral profile of Sample 0 and not substantial variations in the chemical shift values were observed in the spectra of the four samples (see Figure S1). The integration process on the various types of carbon was repeated for these samples and the results, reported in Table 2 and illustrated in Figure 3, were compared with the corresponding values obtained for Sample 0. Each sample analyzed shows different contents of C containing groups, and these fluctuations cannot be attributed to the error in the evaluation of the integral area, but, evidently, they derive from the different oxidative processes. The greatest variations occur for the aliphatic zone and for the region concerning the carbons linked to heteroatoms. Indeed, the highest content of aliphatic C is found for Sample 3, which is the sample obtained with the lowest amount of H2O2 (0.0006 %wt), while the highest content of C linked to heteroatoms is obtained for the Sample 1, in which the quantity of H2O2 was the highest (0.002 %wt). These results indicate that: a) the Fenton treatment is able to make changes in the initial OFMSW matrix; b) HR-MAS 13C NMR spectroscopy is effective in appreciating the variations that individual families of compounds undergo following the different treatments, in terms of reagent concentrations used.
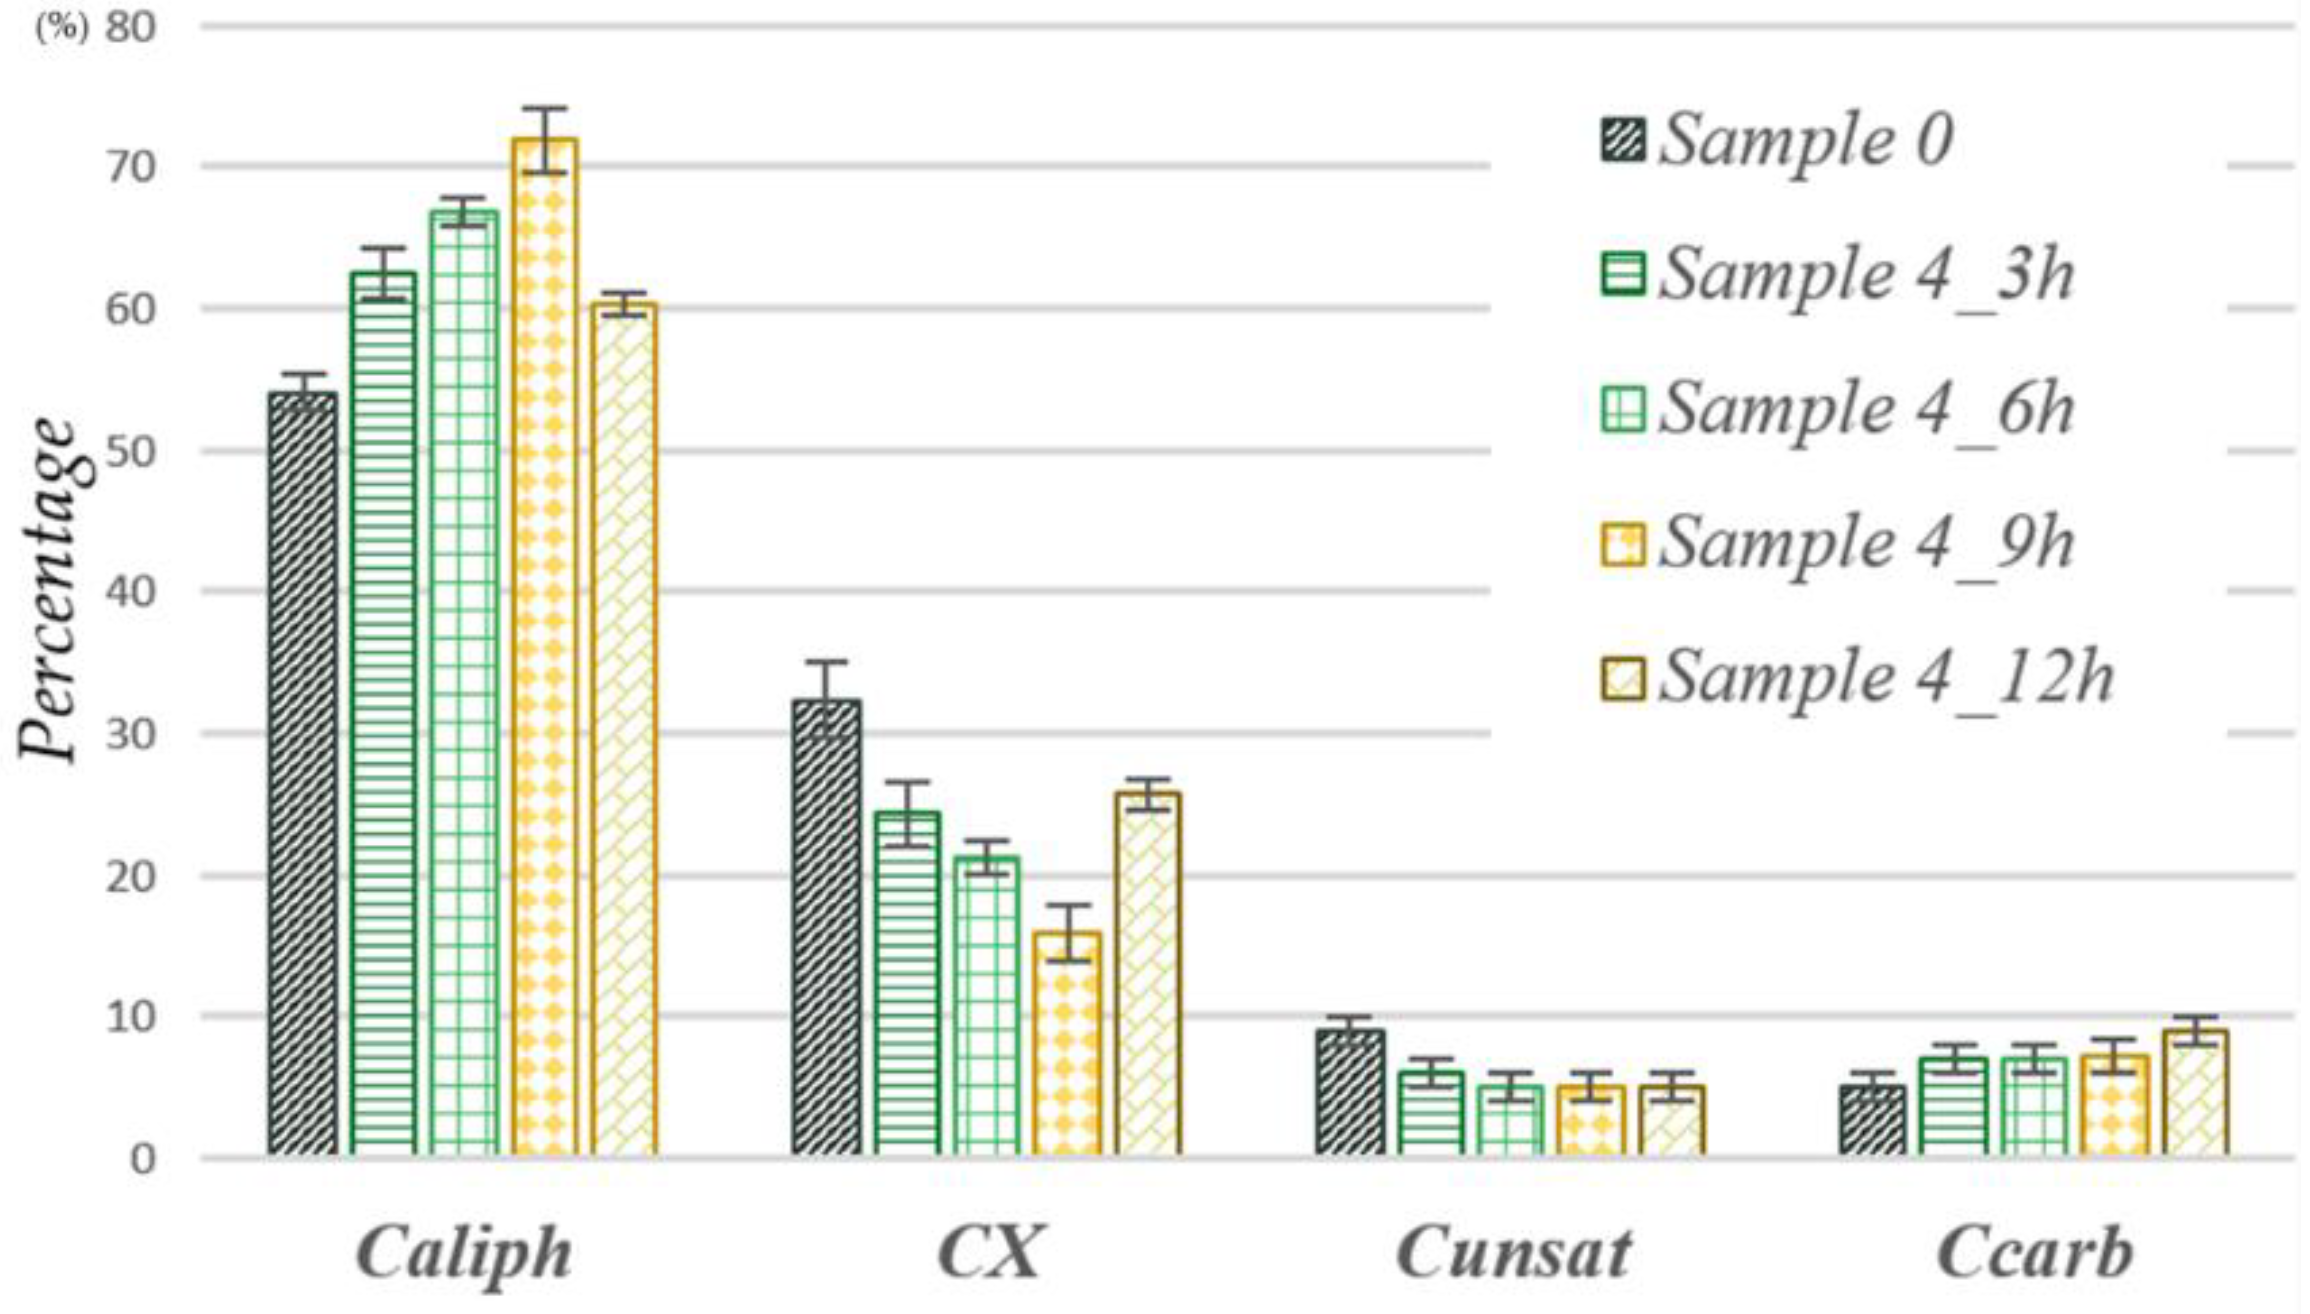
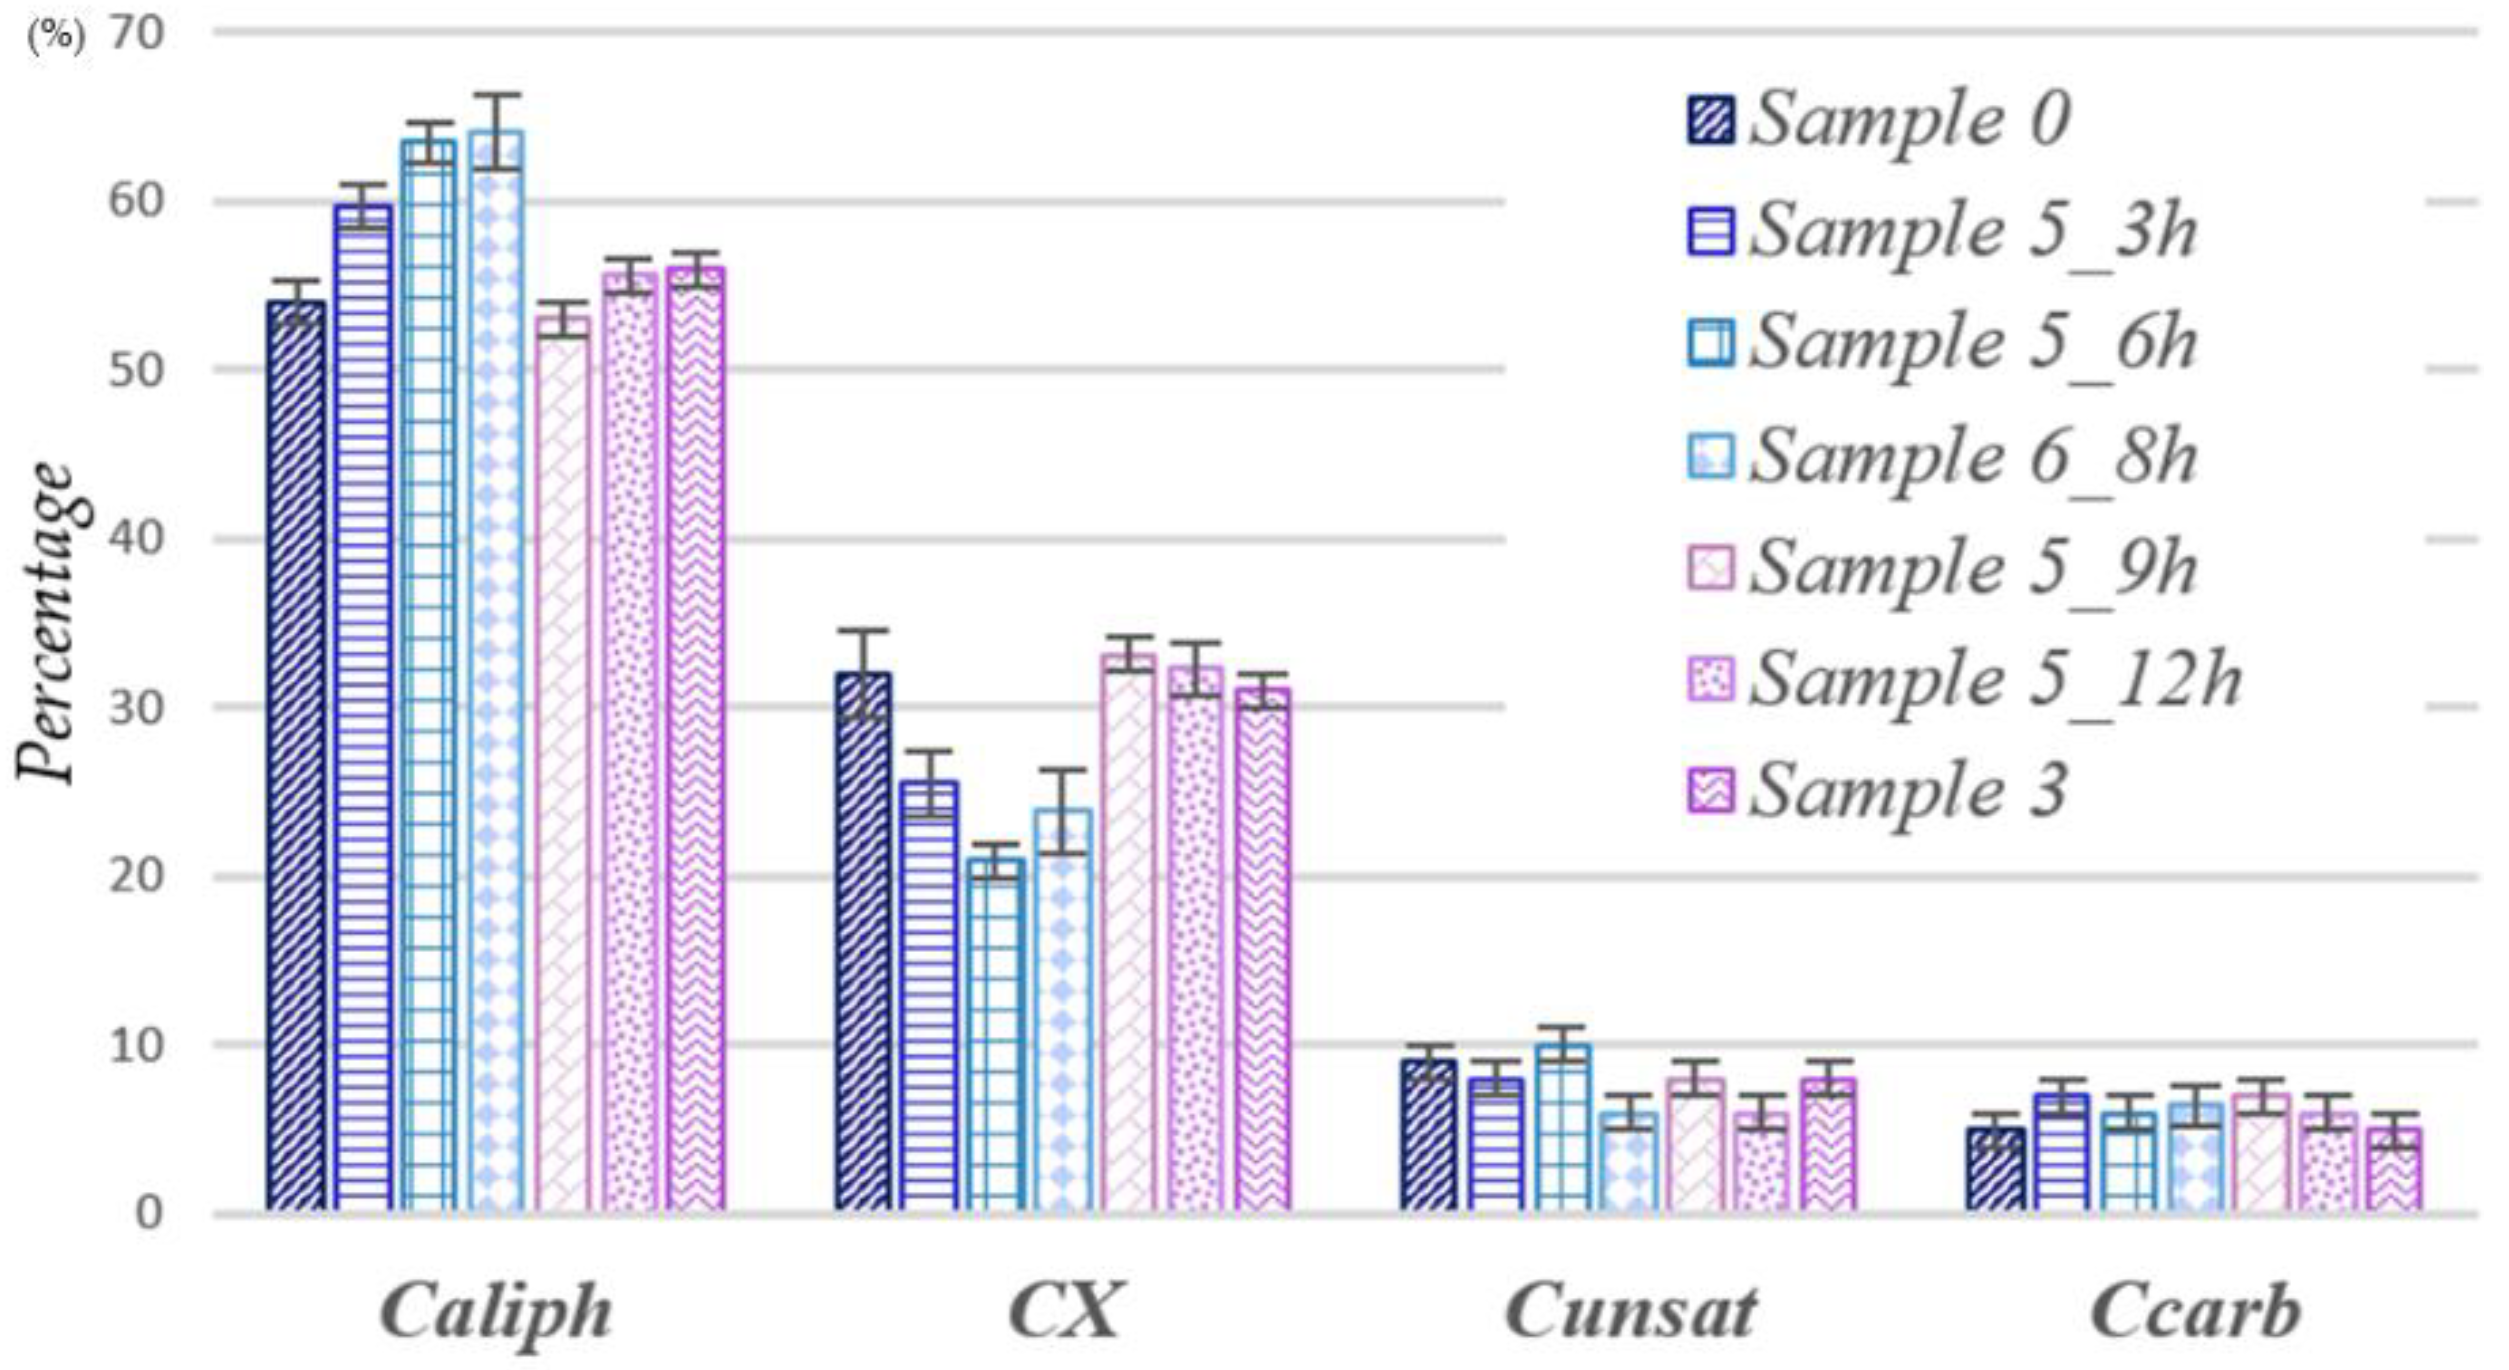
The experiments just described show that the NMR HR MAS method provides relevant information on the composition variations of the organic fraction of the waste subjected to the Fenton treatment. In order to better understand what happens to the various families of compounds during the oxidative process and to investigate the best reaction conditions, the HR-MAS NMR technique was applied to the study of two oxidative processes, A and B, carried out in different reaction conditions, as described in Section 2.1. A total of nine samples were collected for the two processes, four for process A and five for process B. For these samples, no alterations were observed in the profile of the 13C HR-MAS NMR spectra, but there are marked variations in the areas of the values associated with each region of the spectra. The results for process A are reported in Table 3 and illustrated in Figure 4 and Figure S2, while results for process B are reported in Table 4 and illustrated in Figure 5 and Figure S3, for both processes the values of the integrated areas are compared with the corresponding values of the initial OFMSW matrix (Sample 0).
  • Process A. From the data reported in Table 3 and Figure 4, it can be deduced that the reaction proceeds according to two main steps. The first stage, stage I, goes from 0 up to 9 h: during this time, as the reaction proceeds, a decrease in the content of carbon atoms linked to heteroatoms is observed. Since the data present in the literature on organic waste show that the amount of carbons linked to oxygen (C–O) is greater than the amount of any other C–X [23], it is probable that this also occurs for our samples and, therefore, this decrease can be attributable, for example, to the oxidation of alcoholic groups, mostly present in sugars, to carbonyl groups. On the other hand, however, there is no substantial variation in the areas related to the carbon atoms of the carbonyl groups and this suggests that probably, in this period of time, further oxidation of carbonyl groups with loss of CO2 occurs. It should be emphasized that it cannot be deduced in any way from the recorded spectra as to whether the CO2 produced comes from the newly formed or pre-existing carbonyl groups. Stage II occurs around 12 h: at this time, there is an evident increase in the area of carbon atoms linked to heteroatoms due, probably, to an oxidation of aliphatic carbons and, to a lesser extent, to the unsaturated ones. As evidence of this, a decrease in the areas due to these carbon groups can be appreciated.
  • Process B. From the data reported in Table 4 and from the relative distribution of Figure 5, it is possible to infer that the process B proceeds in the same way as for process A, but the two steps described above start and finish at different times. Indeed, Stage I of Sample 5 goes from 0 to 6 h, unlike Sample 4, in which it continues up to 9 h, while Stage II occurs at the time of about 8 h compared to 12 h for process A. Moreover, for Sample 5, it is possible to hypothesize a third stage between 9 and 12 h: at this moment, the trend previously observed in Stage I, i.e., an oxidation of the alcoholic groups to carbonyls with simultaneous loss of CO2, occurs. In Table 4 and Figure 5 are also reported the NMR data obtained for the Sample 6_8 h, in which the same concentrations of Sample 5 are used but the reaction proceeds continuously for 8 h. As can be seen from Table 4 and Figure 4, in Sample 6_8 h, there is a slight increase in the carbon atoms bound to the heteroatoms compared to the situation observed at 6 h. A decrease in the aliphatic content at 8 h is not observed, but a decrease in the unsaturation content is appreciable and suggests that this process (Stage II) begins with the oxidation of the double bonds and that it only subsequently proceeds with the oxidation of the saturated chains, as highlighted in Sample 5_9 h.

4. Conclusions

In this work, we have successfully applied, for the first time, NMR 13C HR-MAS NMR spectroscopy, an innovative and non-destructive technology, to organic waste materials in order to investigate their chemical composition and verify possible chemical variations, with respect to the initial substrate, by following several oxidation treatments as a function of both the concentrations of the Fenton reagents (FeSO4 and H2O2) and the reaction times. The better performance of the HR-MAS 13C NMR approach with respect to the CP-MAS method, the most commonly used technique to analyze the organic fraction of waste, relies upon the possibility of obtaining high-quality and much more resolved spectra, whose analysis contributes to a better understanding of the chemical nature of these waste. In addition, this HR-MAS approach has also proved suitable for monitoring the oxidative processes based on the Fenton reaction to which the initial waste matrix was subjected. Indeed, the results obtained highlight the qualitative/quantitative modifications of the different types of carbons as a function of the concentrations of both Fenton reactants and the duration of the oxidative process. These results are in agreement with the data reported in the literature regarding 13C NMR spectra, both in solids (CP-MAS) and in high resolution for extracts, in characterizing the organic component of OFMSW and in following the various natural composting processes [30]. Moreover, our results in terms of the variation of organic composition of the initial materials are in agreement with the data from thermogravimetry (TG) and FT-IR analysis applied to extracts of a digestate sample subjected to different Fenton treatment varying the concentration ratios between the reagents FeSO4 and H2O2 [22].
To our knowledge, this case study represents the first example in which the HR-MAS approach has been successfully applied to the organic fractions of OFMSW. Finally, the advantages in terms of rapidity, simplicity, and diversity of obtainable information makes this technique very attractive for further studies on different matrices of OFMSW and also to monitor other degradation/transformation processes to which organic waste can be subjected.

Supplementary Materials

The following are available online at https://www.mdpi.com/2076-3417/11/5/2267/s1, Figure S1: 1D HR MAS 13C–{1H} NMR spectrum (Bruker pulse sequence: zgig) recorded on (A) Sample 0; (B) Sample 1; (C) Sample 2; and (D) Sample 3 (All measurements were made at a spin rate of 4 KHz and at a room temperature using an instrument operating at 11.7 T), Figure S2: 1D HR MAS 13C-{1H} NMR spectrum (Bruker pulse sequence: zgig) recorded on (A) Sample 0; (B) Sample 4_3 h; (C) Sample 4_6 h; (D) Sample 4_9 h and (E) Sample 4_12 h (All measurements were made at a spin rate of 4 KHz and at a room temperature using an instrument operating at 11.7 T), Figure S3: 1D HR MAS 13C-{1H} NMR spectrum (Bruker pulse sequence: zgig) recorded on (A) Sample 0; (B) Sample 5_3 h; (C) Sample 5_6 h; (D) Sample 6_8 h; (E) Sample 5_9 h; (F) Sample 5_12 h and (G) Sample 3 (All measurements were made at a spin rate of 4 KHz and at a room temperature using an instrument operating at 11.7 T).

Author Contributions

Conceptualization, G.C. and G.D.L.; project administration, G.C.; investigation, R.A.S. and G.D.L.; methodology, R.A.S. and G.D.L.; supervision, G.D.L.; conceptualization, G.D.L.; formal analysis, R.A.S. and G.D.L.; data curation, R.A.S. and G.D.L.; visualization, R.A.S. and G.D.L.; writing—original draft, R.A.S. and G.D.L.; writing—review and editing, G.D.L. All authors have read and agreed to the published version of the manuscript.

Funding

The study was supported by: (a) the Italian Ministero dello Sviluppo Economico (MISE), through the Project “RESIFAC”: REALIZATION AND EXPERIMENTATION OF PILOT PLANTS FOR FAST COMPOSTING OF CIVIL AND INDUSTRIAL ORGANIC WASTE (Project No. CUP: B28I17000070008, “Horizon 2020”—PON I&C 2014–2020); (b) University of Calabria and POR Calabria—FSE/FESR 2014–2020.

Institutional Review Board Statement

Not applicable.

Informed Consent Statement

Not applicable.

Data Availability Statement

The datasets used and analyzed during the current study are available from the corresponding author on reasonable request.

Acknowledgments

The Authors acknowledge financial support from the Italian Ministero dello Sviluppo Economico (MISE), through the Project “RESIFAC”: REALIZATION AND EXPERIMENTATION OF PILOT PLANTS FOR FAST COMPOSTING OF CIVIL AND INDUSTRIAL ORGANIC WASTE (Project No. CUP: B28I17000070008, “Horizon 2020”—PON I&C 2014-2020). Moreover, the support of the University of Calabria and POR Calabria—FSE/FESR 2014–2020 is also acknowledged. The authors thanks the student Alessandro Fusaro is kindly acknowledged for his work on the project, during her Third Year Internship under the supervision of G. De Luca at the University of Calabria.

Conflicts of Interest

The authors declare no conflict of interest.

References

  1. Minelgaite, A.; Liovikiene, G. Waste Problem in European Union and its Influence on Waste Management Behaviours. Sci. Total Environ. 2019, 667, 86–93. [Google Scholar] [CrossRef]
  2. Sankoh, F.P. Understandig Solid Waste Managemente Practices in Developing Countries: From Waste Disposal to Recovery of Resources. Am. J. Environ. Prot. 2020, 9, 44–48. [Google Scholar] [CrossRef]
  3. Zorpas, A.A. Strategy Development in the Framework of Waste Management. Sci. Total Environ. 2020, 716, 137088. [Google Scholar] [CrossRef]
  4. Hamoda, M.F. Air Pollutants Emissions from Waste Treatment and Disposal Facilities. J. Environ. Sci. Health Part A 2006, 41, 77–85. [Google Scholar] [CrossRef]
  5. Das, S.; Lee, S.-H.; Kumar, P.; Kim, K.-H.; Lee, S.S. Solid Waste Management: Scope and the Challenge of Sustainability. J. Clean. Prod. 2019, 228, 658–678. [Google Scholar] [CrossRef]
  6. All, U.; Sajid, N.; Khalld, A.; Riaz, L.; Rabbani, M.M.; Hussain Syed, J.; Malik, R.N. A Review on Vermicomposting of Organi Wastes. Environ. Prog. Sustain. Energy 2015, 34, 1050–1062. [Google Scholar] [CrossRef]
  7. Soudejani, H.; Kazemian, H.; Inglezakis, V.; Zorpas, A. Application of Zeolites in Organic Waste Composting: A Review. Biocatal. Agric. Biotechnol. 2019, 22, 101396. [Google Scholar] [CrossRef]
  8. Diaz, L.F.; Savage, G.M.; Eggerth, L.; Golueke, C. Composting and Recycling Municipal Solid Waste; CRC Press: Boca Raton, FL, USA, 1993. [Google Scholar]
  9. Hailu, Y.; Hanchiso, T.; Bereta, A. Municipal Solid Waste Source Identification, Characterization and Physical Composition Analysis, Case Study Wolkite Town, Ethiopia. Am. J. Environ. Prot. 2019, 8, 48–53. [Google Scholar] [CrossRef]
  10. Mata-Alvarez, J.; Macè, S.; Llabrès, P. Anaerobic Digestion of Organic Solid Wasts. An Overview of Research Achievements and Perspectives. Bioresour. Technol. 2000, 74, 3–16. [Google Scholar] [CrossRef]
  11. Khalid, A.; Arshad, M.; Anjum, M.; Mahmood, T.; Dawson, L. The Anaerobic Digestion of Solid Organic Waste. Waste Manag. 2011, 31, 1737–1744. [Google Scholar] [CrossRef]
  12. Li, Y.; Park, S.; Zhu, J. Soli-State Anaerobic Digestion for Methane Production from Organic Waste. Renew. Sustain. Energy Rev. 2011, 15, 821–826. [Google Scholar] [CrossRef]
  13. Pramanik, S.K.; Suja, F.B.; Zain, S.; Pramanik, B.K. The Anaerobic Digestion Process of Biogas Production from Food Waste: Prospects and Constraints. Bioresour. Technol. Rep. 2019, 8, 100310. [Google Scholar] [CrossRef]
  14. Soumaré, M.; Tack, F.; Verloo, M. Effect of a Municipal Solid Waste Compost and Mineral Fertilization on Plan Growth in two Tropical Agricultural Soils of Mali. Bioresour. Technol. 2003, 86, 15–20. [Google Scholar] [CrossRef]
  15. Hargreaves, J.; Adl, M.; Warman, P. A Review of the Use of Composted Municipal Solid Waste in Agriculture. Agric. Ecosyst. Environ. 2008, 123, 1–14. [Google Scholar] [CrossRef]
  16. Kumar, S. Composting of Municipal Solid Waste. Crit. Rev. Biotechnol. 2011, 31, 112–136. [Google Scholar] [CrossRef]
  17. Cerda, A.; Artola, A.; Font, X.; Barrena, R.; Gea, T.; Sanchez, A. Composting of Food Wastes: Status and Challenges. Bioresour. Technol. 2018, 248, 57–67. [Google Scholar] [CrossRef] [PubMed] [Green Version]
  18. Koppenol, W. The Centennial of the Fenton Reaction. Free Radic. Biol. Med. 1993, 15, 645–651. [Google Scholar] [CrossRef]
  19. Oliveros, E.; Legrini, O.; Hohl, M.; Muller, T.; Braun, A.M. Industrial Waste Water Treatment: Large Scale Development of a Light-Enhanced Fenton Reaction. Chem. Eng. Process. 1997, 36, 397–405. [Google Scholar] [CrossRef]
  20. Chamarro, E.; Marco, A.; Esplugas, S. Use of FENTON Reagent to Improve Organic Chemical Biodegradability. Water Res. 2001, 35, 1047–1051. [Google Scholar] [CrossRef]
  21. Neyens, E.; Baeyens, J. A Review of Classic FENTON’s Peroxidation as an Advanced Oxidation Technique. J. Hazard. Mater. 2003, 98, 33–50. [Google Scholar] [CrossRef]
  22. Roccotelli, A.; Araniti, F.; Tursi, A.; Di Rauso Simeone, G.; Rao, M.A.; Lania, I.; Chidichimo, G.; Abenavoli, M.R.; Gelsomino, A. Organic Matter Characterization and Phytotoxic Potential Assessment of a Solid Anaerobic Digestate Following Chemical Stabilization by an Iron-Based Fenton Reaction. J. Agric. Food Chem. 2020, 68, 9461–9474. [Google Scholar] [CrossRef]
  23. Chefetz, B.; Hatcher, P.G.; Hadar, Y.; Chen, Y. Chemical and Biological Characterization of Organic Matter during Composting of Municipal Solid Waste. J. Environ. Qual. 1996, 25, 776–785. [Google Scholar] [CrossRef]
  24. Muller, M.; Pereira Milori, D.M.B.; Déléris, S.; Steyer, J.-P.; Dudal, Y. Solid-Phase Fluorescence Spectroscopy to Characterize Organic Wates. Waste Manag. 2011, 31, 1916–1923. [Google Scholar] [CrossRef]
  25. Baldock, J.A.; Oades, J.M.; Nelson, O.N.; Skene, T.M.; Golchin, A.; Clarke, P. Assessing the Extent of Decomposition of Natural Organic Materials Using Solid-State 13C NMR Spectroscopy. Aust. J. Soil Res. 1997, 35, 1061–1083. [Google Scholar] [CrossRef]
  26. Pichler, M.; Knicker, H.; Kogel-Knabner, I. Changes in the Chemical Structure of Municipal Solid Waste during Composting as Studied by Solid-State Dipolar Dephasing and PSRE 13C NMR ad Solid-State 15N NMR Spectroscopy. Environ. Sci. Technol. 2000, 34, 4034–4038. [Google Scholar] [CrossRef]
  27. Pichler, M.; Knicker, H.; Kögel-Knabner, I. Solid-State 13C NMR Spectroscopic, Chemolytic and Biological Assessment of Pretreated Municipal Solid Waste. J. Ind. Microbiol. Biotechnol. 2001, 26, 83–89. [Google Scholar] [CrossRef] [PubMed]
  28. Castaldi, P.; Alberti, G.M.R.M.P. Study of the Organic Matter Evolution During Municipal Solid Waste Composting Aimed at Identifying Suitable Parameters for the Evaluation of Compost Maturity. Waste Manag. 2001, 25, 209–213. [Google Scholar] [CrossRef] [PubMed]
  29. Tambone, F.; Genevini, P.; D’Imporzano, G.; Adani, F. Assessing Amendment Properties of Digestate by Sudying the Organic Matter Composition and the Degree of Biological Stability During the Anaerobic Digestion of the Organic Fraction of MSW. Bioresour. Technol. 2009, 100, 3140–3142. [Google Scholar] [CrossRef]
  30. Tambone, F.; Adani, F.; Gigliotti, G.; Volpe, D.; Fabbri, C.; Provenzano, M.R. Organic Matter Characterization During the Anaerobic Digestion of Different Biomasses by Means of CPMAS 13C NMR Spectroscopy. Biomass Bioenergy 2013, 48, 111–120. [Google Scholar] [CrossRef]
  31. Tang, H.; Hills, B.P. Use of 13C MAS NMR to Study Domain Structure and Dynamics of Polysaccarides in the Native Starch Granules. Biomacromolecules 2003, 4, 1269–1276. [Google Scholar] [CrossRef] [PubMed]
  32. Huhn, S.; Szabo, C.; Gass, J.; Manzi, A. Metabolic Profiling of Normal and Hypertensive Rat Kidney Tissues by HRMAS-NMR Spectroscopy. Anal. Bioanal. Chem. 2004, 378, 1511–1519. [Google Scholar] [CrossRef]
  33. Beckonert, O.; Coen, M.; Keun, H.C.; Wang, Y.; Ebbels, T.M.D.; Holmes, E.; Lindon, J.C.; Nicholson, J.K. High-Resolution Magic-Angle-Spinning NMR Spectroscopy for Metabolic Profiling of Intact Tissues. Nat. Protoc. 2010, 5, 1019–1032. [Google Scholar] [CrossRef]
  34. Farooq, H.; Courtier-Murias, D.; Soong, R.; Bermel, W.; Kingery, W.; Simpson, A.J. HR-MAS NMR Spectroscopy: A Pratical Guide for Natural Samples. Curr. Org. Chem. 2013, 17, 3013–3031. [Google Scholar] [CrossRef]
  35. Corsaro, C.; Cicero, N.; Mallamace, D.; Vasi, S.; Naccari, C.; Salvi, A.; Giofrè, V.; Dugo, G. HR-MAS and NMR towards Foodomics. Food Res. Int. 2016, 89, 1085–1094. [Google Scholar] [CrossRef]
  36. Mazzei, P.; Piccolo, A. HRMAS NMR Spectroscopy Applications in Agriculture. Chem. Biol. Technol. Agric. 2017, 4, 1–13. [Google Scholar] [CrossRef] [Green Version]
  37. Ferro, M.; Castiglione, F.; Panzeri, W.; Dispenza, R.; Santini, L.; Karlsson, H.J.; de Wit, P.P.; Mele, A. Non-Destructive and Direct Determination of the Degree of Substitution of Carboxymethyl Cellulose by HR-MAS 13C NMR Spectroscopy. Carbohydr. Polym. 2017, 169, 16–22. [Google Scholar] [CrossRef]
  38. TopSpin. Available online: https://www.bruker.com/en/products-and-solutions/mr/nmr-software/topspin.html (accessed on 1 February 2021).
  39. Caricasole, P.; Provenzano, M.; Hatcher, P.; Senesi, N. Evolution of Organic Matter During Composting of Different Organic Wastes Asessed by CPMAS 13C NMR Spectroscopy. Waste Manag. 2011, 31, 411–415. [Google Scholar] [CrossRef]
  40. Wong, A.; Lucas-Torres, C. High-Resolution Magic-Angle-Spinning (HR-MAS) NMR Spectroscopy. In NMR-Based Metabolomics; Keun, H.C., Ed.; Royal Society of Chemistry: Croydon, UK, 2018; Chapter 5; pp. 113–147. [Google Scholar]
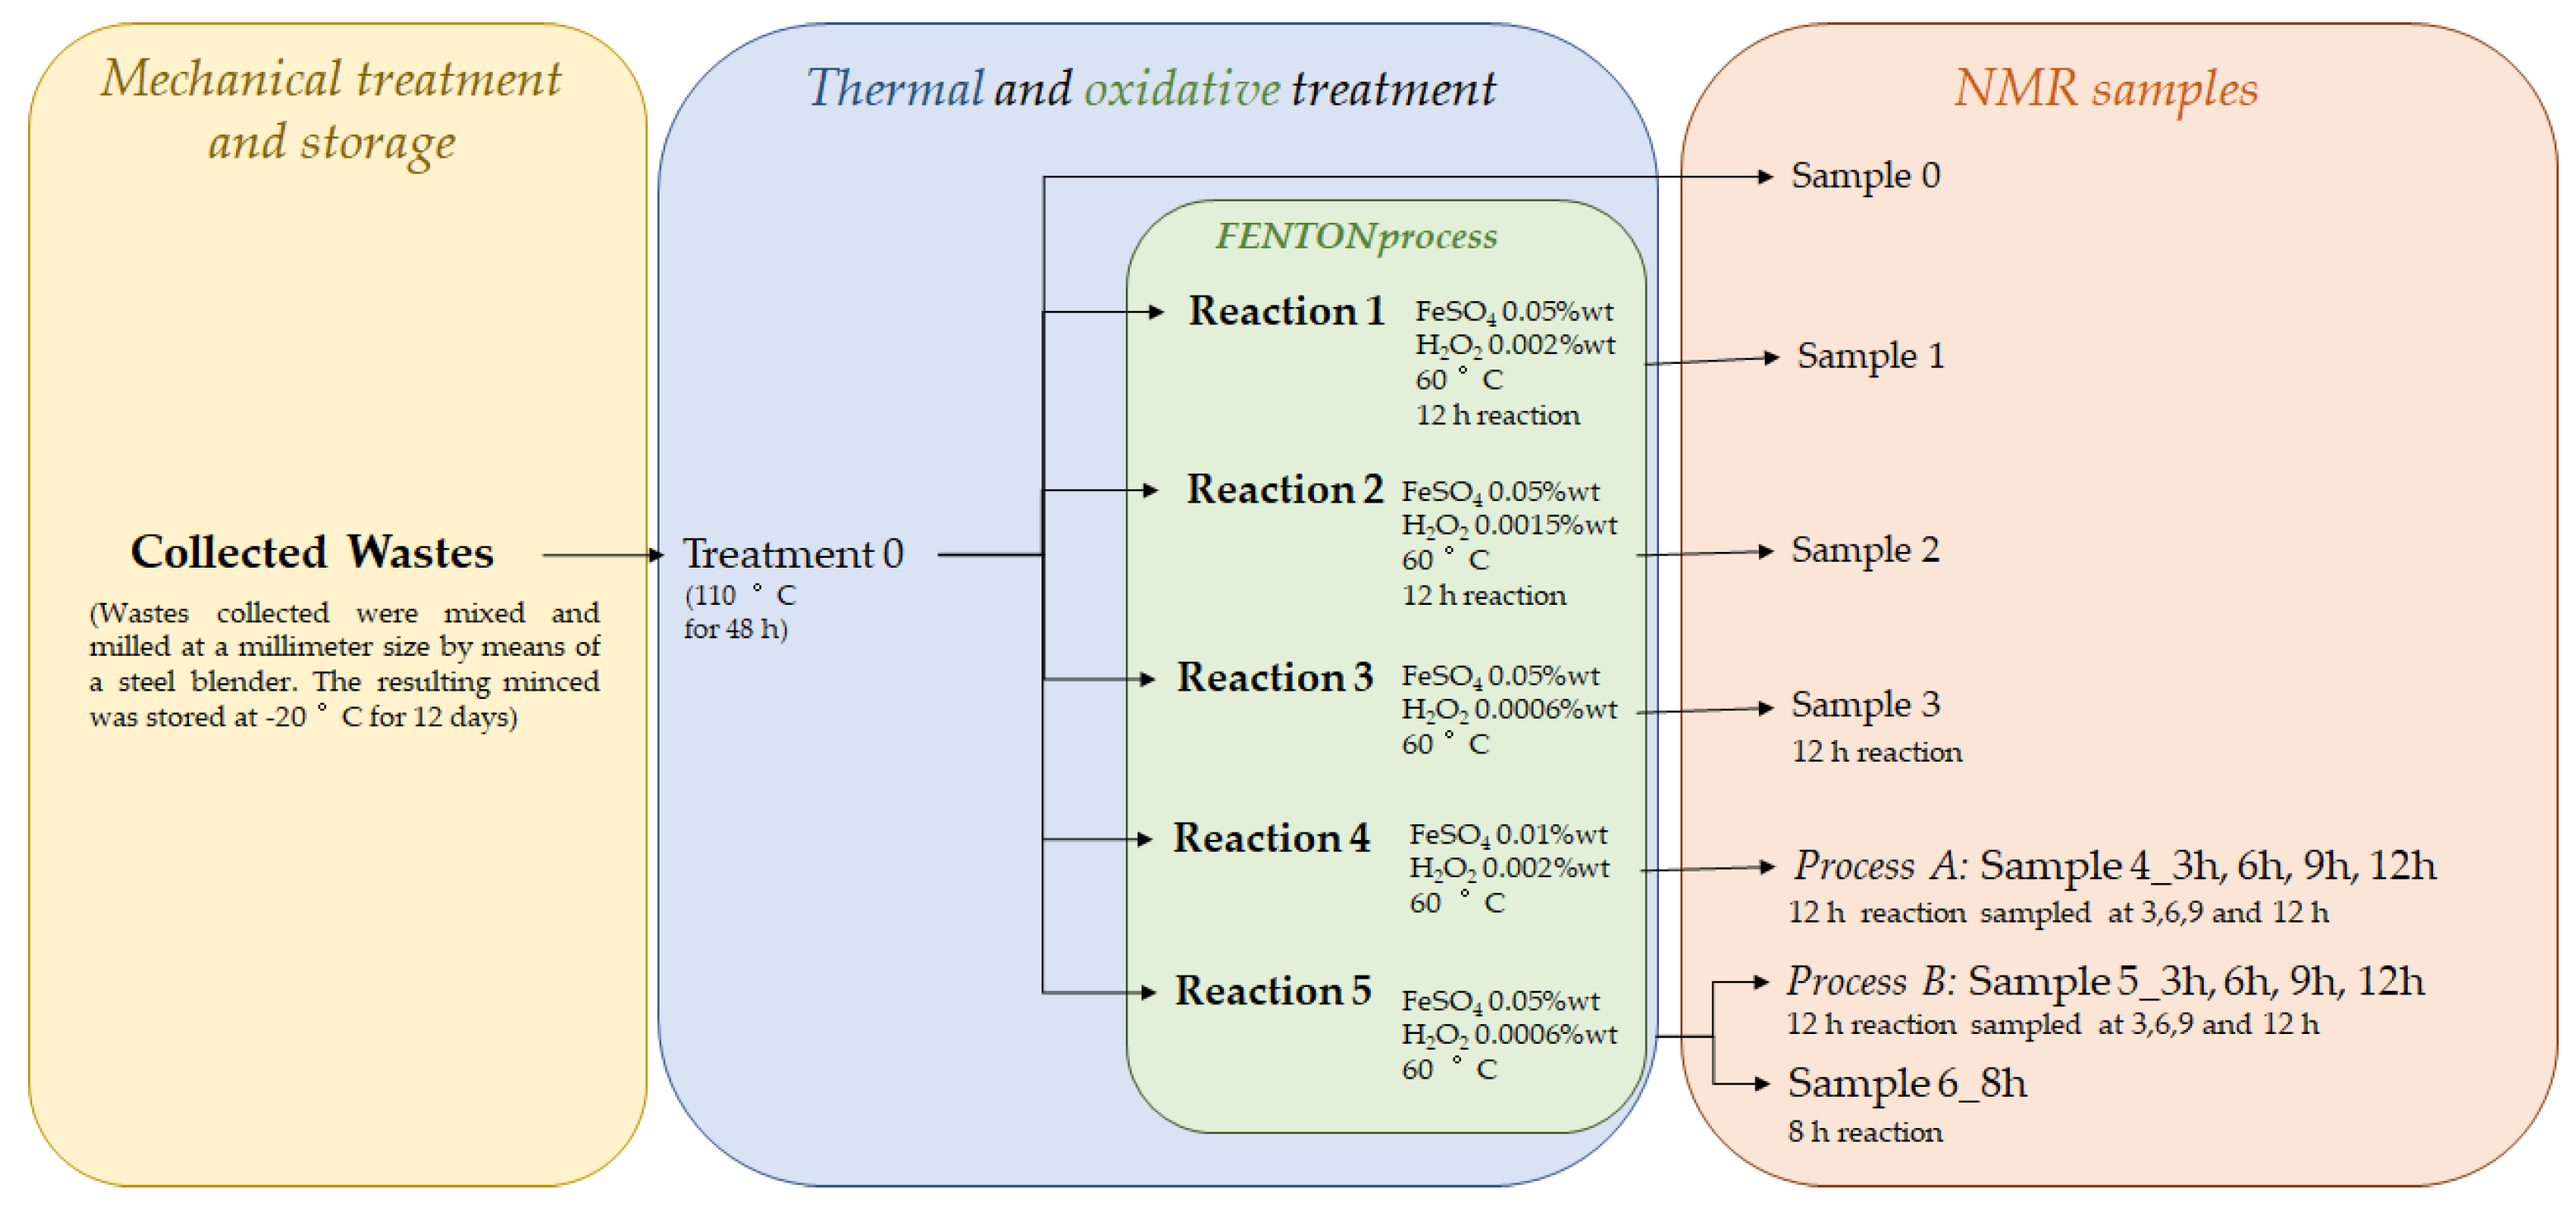
Figure 1. Experimental steps, oxidative reaction conditions, and NMR samples collected for each process the initial sample of the organic fraction of municipal solid waste (OFMSW) was subjected to.
Applsci 11 02267 g001
Figure 2. (a) HR-MAS 13C–{1H} NMR spectrum of Sample 0 (in blue) compared with CP-MAS 13C NMR spectrum of OFMSW sample reported in the literature (in black) [26]; (b) HR-MAS 13C NMR spectrum of Sample 0 and signal assignment. In the box, the comparison with the CP-MAS spectrum of starch in the same region is shown [31].
Applsci 11 02267 g002
Figure 3. Relative distribution, expressed as percentage (%), of the carbon groups Caliph, CX, Cunsat and Ccarb for the Samples 0, 1, 2, 3, and 4 at 12 h.
Applsci 11 02267 g003
Figure 4. Relative distribution, expressed as percentage (%), of the carbon groups Caliph, CX, Cunsat, and Ccarb for process A samples and comparison with Sample 0.
Applsci 11 02267 g004
Figure 5. Relative distribution, expressed as percentage (%), of the carbon groups Caliph, CX, Cunsat, and Ccarb for process B samples and comparison with the Sample 0 and Sample 3.
Applsci 11 02267 g005
Table 1. Chemical shift regions of 13C–{1H} NMR spectra of OFMSW [29,30].
Chemical Shift Range (ppm)Assignment
220 to 190C=O of ketones and aldehydes
190 to 160C=O in carboxylic acids, esters and amides
160 to 140C–O–R and C–N–R aromatics; C–1 in polystyrene
140 to 110Aromatic C–H; C–2, C–3, C–4, C–5 and C–6 in polystyrene
110 to 90C–1 in carbohydrates; C–2 and C–6 in the lignin syringes unit
90 to 60C–2 and C–6 in carbohydrates; side chain in lignin
60 to 50Methoxy groups, Ca in amino acids
50 to 40Methylene groups (lipids, proteins, polyethylene, polyisoprene, polyamide). Long chain aliphatic C, also biopolymers
40 to 25Cα and Cβ in polymers such as polyvinylchloride, polypropylene, polystyrene
25 to 0Methyl groups (lipids, peptides, polypropylene). Short chain aliphatic C
Table 2. Integral values, in percentage, of different carbon type, aliphatic (Caliph), heteroatoms-linked (CX), unsaturated (Cunsat) and carbonylic (Ccarb), calculated for the Samples 0, 1, 2, 3, and 4 at 12 h.
Caliph (%)CX (%)Cunsat (%)Ccarb (%)
Sample 054 ± 132 ± 39 ± 15 ± 1
Sample 143 ± 144 ± 19 ± 14 ± 1
Sample 253 ± 228 ± 513 ± 16 ± 1
Sample 356 ± 131 ± 18 ± 15 ± 1
Sample 460 ± 126 ± 15 ± 19 ± 1
Table 3. Integral values, in percentage, of Caliph, CX, Cunsat, and Ccarb, calculated for Sample of process A and comparison with Sample 0.
Process ACaliph (%)CX (%)Cunsat (%)Ccarb (%)
Sample 054 ± 132 ± 39 ± 15 ± 1
Sample 4_3 h63 ± 2 24 ± 26 ± 17 ± 1
Sample 4_6 h67 ± 121 ± 15 ± 17 ± 1
Sample 4_9 h72 ± 216 ± 25 ± 17 ± 1
Sample 4_12 h60 ± 126 ± 15 ± 19 ± 1
Table 4. Integral values, in percentage, of Caliph, CX, Cunsat, and Ccarb, calculated for samples of process B and comparison with Sample 0 and Sample 3.
Process BCaliph (%)CX (%)Cunsat (%)Ccarb (%)
Sample 054 ± 132 ± 39 ± 15 ± 1
Sample 356 ± 131 ± 18 ± 15 ± 1
Sample 5_3 h60 ± 125 ± 28 ± 17 ± 1
Sample 5_6 h63 ± 121 ± 110 ± 16 ± 1
Sample 5_9 h53 ± 133 ± 18 ± 17 ± 1
Sample 5_12 h56 ± 132 ± 26 ± 16 ± 1
Sample 6_8 h64 ± 224 ± 26 ± 16 ± 1
Publisher’s Note: MDPI stays neutral with regard to jurisdictional claims in published maps and institutional affiliations.