Article

Finding Effective Item Assignment Plans with Weighted Item Associations Using A Hybrid Genetic Algorithm

1
Vision AI Labs, SK Telecom, Seoul 04539, Korea
2
Department of Interdisciplinary, Industrial Studies, Hanyang University, Seoul 04763, Korea
3
Department of Industrial Engineering, College of Engineering, Hanyang University, Seoul 04763, Korea
*
Author to whom correspondence should be addressed.
Appl. Sci. 2021, 11(5), 2209; https://doi.org/10.3390/app11052209
Submission received: 19 January 2021 / Revised: 9 February 2021 / Accepted: 25 February 2021 / Published: 3 March 2021
(This article belongs to the Collection Heuristic Algorithms in Engineering and Applied Sciences)

Abstract

:
By identifying useful relationships between massive datasets, association rule mining can provide new insights to decision-makers. Item assignment models based on association between items are used to place items in a retail or e-commerce environment to increase sales. However, existing models fail to combine these associations with item-specific information, such as profit and purchasing frequency. To find effective assignments with item-specific information, we propose a new hybrid genetic algorithm that incorporates a robust tabu search with a novel rectangular partially matched crossover, focusing on rectangular layouts. Interestingly, we show that our item assignment model is equivalent to popular quadratic assignment NP-hard problems. We show the effectiveness of the proposed algorithm, using benchmark instances from QAPLIB and synthetic databases that represent real-life retail situations, and compare our algorithm with other existing algorithms. We also show that the proposed crossover operator outperforms a few existing ones in both fitness values and search times. The experimental results show that not only does the proposed item assignment model generates a more profitable assignment plan than the other tested models based on association alone but it also obtains better solutions than the other tested algorithms.

1. Introduction

Association rule mining uncovers interesting patterns that may exist within large amounts of co-occurring elements in a dataset. These interesting patterns include frequent items, association rules, and association rule classifiers that establish relationships between the co-occurring elements or transaction data. A typical association rule consists of an antecedent (or condition) and a consequent (or result), which have a conditional connection such as “if a condition event takes place, how likely a result event is.” Due to the existence of transaction data in many industries, association rule mining has been employed in various fields, including item placement, web usage mining, product portfolio identification, cross-selling, and fault diagnosis [1,2,3,4,5]. Extracting significant association between customer and product form [6], disease prediction [7], software defect prediction [8], and pollution monitoring in intelligent cities is also possible using weighted association rule mining [9]. When applying association rule mining to the referred fields, the principles are the same: we wish to discover items that frequently occur together in a database and, subsequently from these frequent items, generate association rules that satisfy a minimum constraint.
One representative application of association rule mining is market basket analysis, which identifies interesting purchasing patterns [10]. Association rule mining has been used in various settings that are related to market basket analysis. Brijs et al. developed association rules considering business values in item assortment analysis [11]. In a manufacturing context, researchers developed cell formation approaches based on association rule mining in cellular manufacturing systems for parts and machines. Chen used association rule induction to find effective configurations for machines [12], and Liu et al. proposed uncertain association rule mining to incorporate essential production factors such as operation sequences [13]. Association rule mining was also adopted to develop an order clustering approach in distribution centers [14]. Beheshtian-Ardakani used customer loyalty and market segmentation variables for item bundling [15]. The item assignment problem in retail was suggested as a practical application of market basket analysis [1]. Item assignment in retail involves finding effective assignments in a given layout to maximize the chance of cross-selling. A basic principle of item assignment for cross-selling is to place associated items in close proximity, thereby encouraging the sale of such items.
In most applications of association rule mining, including those mentioned above, all items in a dataset are treated uniformly. However, in a retail business, e.g., item-specific information such as cost, price, and sales volume are easily obtainable and quite important. Commonly, managers place emphasis on specific items; e.g., if some items are more profitable, they become more interested. Indeed, the approach of weighting items has been explored by many researchers. Cai et al. suggested weighting frequent items in a database during mining [16], and Tao et al. proposed weighted association rule mining to efficiently generate frequent items [17]. Khan et al. also used weighted association rule mining for datasets with binary and quantitative attributes in weighted settings [18]. Pears et al. generated weight assignments automatically by formulating a model that considers the relationship between items [19]. Utility itemsets or utility rules based on profit were introduced in a market basket analysis [20]. Heydari et al. also formulated a non-linear binary programming problem with weighted associations incorporating interaction information between items with utility information such as unit profit and selling possibility for each item, solving it by a genetic algorithm [21]. While these weighting approaches offer insight into an item assignment for a given layout, they failed to include item–item associations with item-specific information. It would be more realistic and desirable if an item assignment method could incorporate the existence of practical item-specific information, such as profit and sales volume. In Heydari et al., they took into consideration difference in selling possibility depending on allocated location, but we, ignoring such difference, rather focus on interaction among items depending on distance. The rationale is that we focus on practical settings with numerous sites and items as in retail and e-commerce. This study utilized association rule mining in the item assignment problem in a setting with a given layout by considering the weights of items according to profit and frequency counts.
Specifically, this study aimed to improve the existing approaches of association rule mining for the item assignment problem using the following two criteria. First, an item assignment plan must consider not only the strength of correlation between items but also the profit incurred by cross-selling. The measure of association between items is called lift. Assuming that X and Y are the antecedent and consequent for item sets, respectively, lift (X → Y) measures the possibility of cross-selling Y given that X was previously purchased. The measure lift (X → Y) can be also written as P(XY)/(P(X)P(Y), which relates to point-wise mutual information. When lift (item A → item B) and lift (item A → item C) have the same association strength, item A can be located next to either item B or item C. However, if the profit gained by cross-selling item B with item A is higher than by cross-selling item C with item A, it is reasonable that item A should be located next to item B to maximize sales.
Second, an assignment plan also needs to consider the purchasing frequency of items. Since the association among items is expressed as a ratio of probabilities, it is possible that lower frequency items have a stronger association with each other than higher frequency items. From an economic viewpoint, weakly correlated items with a high frequency can be more valuable than strongly associated items with a low frequency. In other words, items with low profit can still be beneficial to retailers if the items are sold quite frequently.
Given layouts and item-purchase frequencies, an effective item arrangement is quite important as well. The task of finding an effective item assignment, which is computationally intensive, involves searching for the best assignment with the highest potential for cross-selling. Solvable by searching for all assignments in a factorial way, the item assignment problem can be viewed as a special case of the quadratic assignment problem (QAP) [22], which can be formulated as a mixed-integer linear programming (MILP), a well-known combinatorial optimization problem. QAP is NP-hard, so no exact algorithm can solve the problem in polynomial time. An exact algorithm for QAP such as branch-and-bound and cutting plane methods is possible for a small size n. Recently, numerous researches have been made to develop well-performing heuristic and metaheuristic methods, which can find high-quality solutions in a reasonable time but with no optimality guaranteed. Taillard proposed robust tabu search (RTS) producing high-quality solutions with fast comparison of neighborhood in 0(n2) instead of 0(n3), in which n is the problem size [23]. Benlic et al. proposed breakout local search (BLS), which exploits local search and adaptive perturbation strategies to explore the search space [24]. Their subsequent research also presented a population-based memetic algorithm for QAP, which integrates BLS within the population-based evolutionary algorithm. Dokeroglu proposed hybrid teaching-learning-based optimization using RTS, called as TLBO-RTS, in which two phases of exploration and exploitation exist: all individuals are trained by TLBO algorithm in the first phase and further exploited by RTS [25]. Dokeroglu et al. also proposed an RTS-integrated artificial bee colony (ABC) optimization for QAP (ABC-QAP), a population-based algorithm inspired by the behavior of honeybees [26]. Hybrid genetic algorithm with hierarchical iterated tabu search was proposed to solve for the solution of QAP [27]. In addition, cited heuristic algorithms directly are also applicable to urban transportation networks such as vehicle routing problem and ridesharing user equilibrium problem [28] since they also can be formulated as MILP. Whale optimization algorithm combined with tabu search was proposed for green vehicle routing problem [29].
This study proposes not only an item assignment model incorporating lift, profit, and frequency for the effective assignment of items but also a hybrid genetic algorithm for finding better combinations of item assignments. The proposed model unifies profit and frequency as weighting coefficients of associations among items. Since the scales of profit and frequency may be different depending on the problems, in order to make them dimensionless, relative profit and frequency were used instead of absolute values. To find effective item assignments, we propose a hybrid GA among various heuristic algorithms that incorporate a robust tabu search. We adopt genetic algorithm due to its advantages of fast convergence, easy implementation, and competitive performance when combined with proper local search [30,31]. In the hybrid GA, we propose a special crossover, rectangular partially matched crossover, that is suitable for reflecting a physical layout form.
The rest of this paper is organized as follows. Section 2 describes the item assignment model. Section 3 explains the effect of profit and frequency in an environment with a given layout and defines the weighted item assignment model. Section 4 describes the proposed algorithm. Section 5 presents experimental results. Section 6 concludes the paper.

2. Item Assignment Model

The purpose of item assignment is to determine the most effective in-store locations of items to maximize the possibility of cross-selling. In practice, item assignment based on association rule mining starts by grouping sub-items; that is, sub-items are classified into different categories. Grouping sub-items allows the association information to remain useful, even if some sub-items are discontinued. Usually, the group information of sub-items is predetermined; e.g., diapers and pacifiers are to be grouped as “baby” items. The strengths of the associations are measured across these grouped items.
We apply lift, a measure of association, to represent the possibility of cross-selling. Let X and Y be sets of items. Assuming that Pr(X) is the probability of containing X in a transaction database and Pr(Y|X) is the conditional probability of including Y together when a transaction contained X, lift (XY) is defined as shown in Equation (1):
l i f t ( X Y ) = P r ( Y | X ) / P r ( Y ) = P r ( X Y ) P r ( X ) P r ( Y ) .
Lift (XY) measures how much the possibility of purchasing Y increases after buying X rather than buying Y alone. If lift (XY) is greater than 1, then X and Y, positively correlated, can be placed together for cross-selling.
Let us assume that n items are to be located at n sites, with one item at each site. Let I = {I1, I2, …, In} be the set of items and S = {S1, S2, …, Sn} be the set of sites. Suppose that xij is 1 (one) if item Ii is located at site Sj and 0 (zero) otherwise, and yij is 1 if site Si is adjacent to Sj and 0 otherwise. For a given layout, yij is given, and xij is a decision variable. The item assignment model can be stated as shown in Equation (2):
Maximize i j , k l   l i f t ( I i I j ) × x i k × x j l × y k l Subject   to i = 1 n x i k = 1 , k   =   1 ,   ,   n , k = 1 n x i k = 1 , i   =   1 ,   ,   n , x i k = { 1 ,       i f   i t e m   I i   i s   l o c a t e d   a t   s i t e   S k 0 ,     o t h e r w i s e .
The objective function in Equation (2) represents the sum of possibilities of cross-selling for a given assignment. Each item must be located at one site by the constraint k = 1 n x i k = 1 . Likewise, each site must hold only one item by the constraint i = 1 n x i k = 1 . According to y k l in the objective function, the possibility of cross-selling is added to the objective value only if the two items are placed at sites near one another.
For example, suppose that six items are assigned to six sites and the lifts of two items are given in Table 1. Lift has the characteristic that it is symmetric: lift (XY) = lift (YX). Therefore, we give lifts of items in the form of a triangular matrix, as illustrated in Table 1.
Let us assume that the layout of the six sites and an item assignment are as shown in Figure 1a,b, respectively. Let us denote Figure 1b as BASE_ASSIGN. Then, the total possibility of cross-selling can be calculated as follows. Item C is placed near item B and item E, and lift (C → B) and lift (C → E) are added to the total possibility of cross-selling, i.e., 1.1 + 1.5. Likewise, the seven lifts of items placed in close proximity are added to the total possibility of cross-selling. As a result, the total possibility of cross-selling is 1.1 + 1.3 + 0 + 1.3 + 1.5 + 1.6 + 1.3 = 8.1.
The task of item assignment is to search for an assignment plan that maximizes the sum of the possibilities of cross-selling. The task is an NP problem, and various heuristic algorithms of assignment can be conducted.

3. Item Assignment Based on Weighted Associations

This section proposes an item assignment problem based on weighted associations. Since most of the decisions made in retail industries are related to sales and profits, the proposed item assignment model, which considers the profits and frequencies of purchasing items, is realistic and worthwhile.

3.1. Effects of Profit and Frequency

In Section 2, the final assignment of items for cross-selling was obtained based only on the correlations between the items. However, these associations between the items do not consider the profit increase due to cross-selling. Since all retailers are profit-seeking, increased profit is a more important factor than the strength of correlations among items for item assignment in a retail environment.
Given BASE_ASSIGN, assume that the expected profits increased due to cross-selling are as shown in Table 2a. Then, the numbers considering both lifts and the profit is shown in Table 2b. Allocating item C next to item D promotes more profit than placing item C next to other items according to Table 2b. In the same sense, item B should be located next to item F.
As shown in Figure 2a, the item assignment, denoted as PROFIT_ASSIGN, is an updated version from BASE_ASSIGN, considering profit as well as lifts. Logically, PROFIT_ASSIGN is a better assignment than BASE_ASSIGN from an economic viewpoint.
The PROFIT_ASSIGN in Figure 2a considers not only the associations between the items but also the profit increase due to cross-selling. Note that the increased profit applied to the item assignment problem is a unit profit for one occurrence of the purchased items. Considering the frequency of purchasing items, in addition to profit, is a realistic approach for the item assignment problem.
Suppose that the number of transactions containing items cross-sold in a database is provided as shown in Table 3a. The numbers in Table 3 indicate how frequently the paired items are sold. Then, the values in Table 3b correspond to expected profits by taking into account the frequencies of occurrence as well as the lifts. The PROFIT_ASSIGN in Figure 3 needs to be changed when considering the frequencies of occurrence.
For example, according to Table 3b, assigning item B next to item D can promote higher sales than other assignments. In the same way, item C should be located next to item E. The assignment denoted as PROF_FRE_ASSIGN in Figure 2b is an updated version from PROFIT_ASSIGN, exchanging B and E with C and F, respectively. Then, PROF_FRE_ASSIGN is a better assignment than PROFIT_ASSIGN when considering increased profit as well as frequency.

3.2. Weighted Item Assignment Model

Section 3.1 discussed the influences of profit and frequency on item assignment plans. In this section, we propose a weighted item assignment model that considers both profit and frequency as in Equation (3), which is a modified model of Equation (2). Interestingly, this optimization problem becomes a special case of the quadratic assignment problem (QAP). In Equation (3), the weights of profit and frequency are multiplied:
Maximize i j ,   k l   w p r o f i t ( I i , I j ) × w f r e q u c n c y ( I i , I j ) × l i f t ( I i I j ) × x i k × x jl × y k l Subject   to i = 1 n x i k = 1 , k   =   1 ,   ,   n , k = 1 n x i k = 1 , i   =   1 ,   ,   n , x i k = { 1 ,       i f   i t e m   I i   i s   l o c a t e d   a t   s i t e   S k 0 ,     o t h e r w i s e .
Since the scales of profit and frequency are different depending on the problems, this study used relative profit and relative frequency as weights of the model. Relative profits were calculated by dividing the profit by the lowest increased profit among items. For instance, since the lowest profit in Table 2a is $10, the relative profits are calculated by dividing all profits by $10. Table 4 shows the relative profits obtained from Table 2a.
Likewise, relative frequencies are calculated by dividing the frequencies by the lowest frequency among all of them. By dividing all the frequencies in Table 3a by the lowest frequency, 1000, the relative frequencies can be obtained as in Table 5a. Then, we can rewrite the weights in Table 3b with those in Table 5b.
According to the weighted item assignment, the objective values of Equation (3) for BASE_ASSIGN, PROFIT_ASSIGN, and PRO_FRE_ASSIGN are 15, 18.4, and 21.4, respectively, as shown in Table 6. This result verifies the superiority of PRO_FRE_ASSIGN among the three assignments when considering both profits and frequencies. Since the weighted item assignment model considers the three factors of association, profit, and frequency among the items, the model can offer insight to decision-makers for finding the most effective assignment of items for cross-selling.

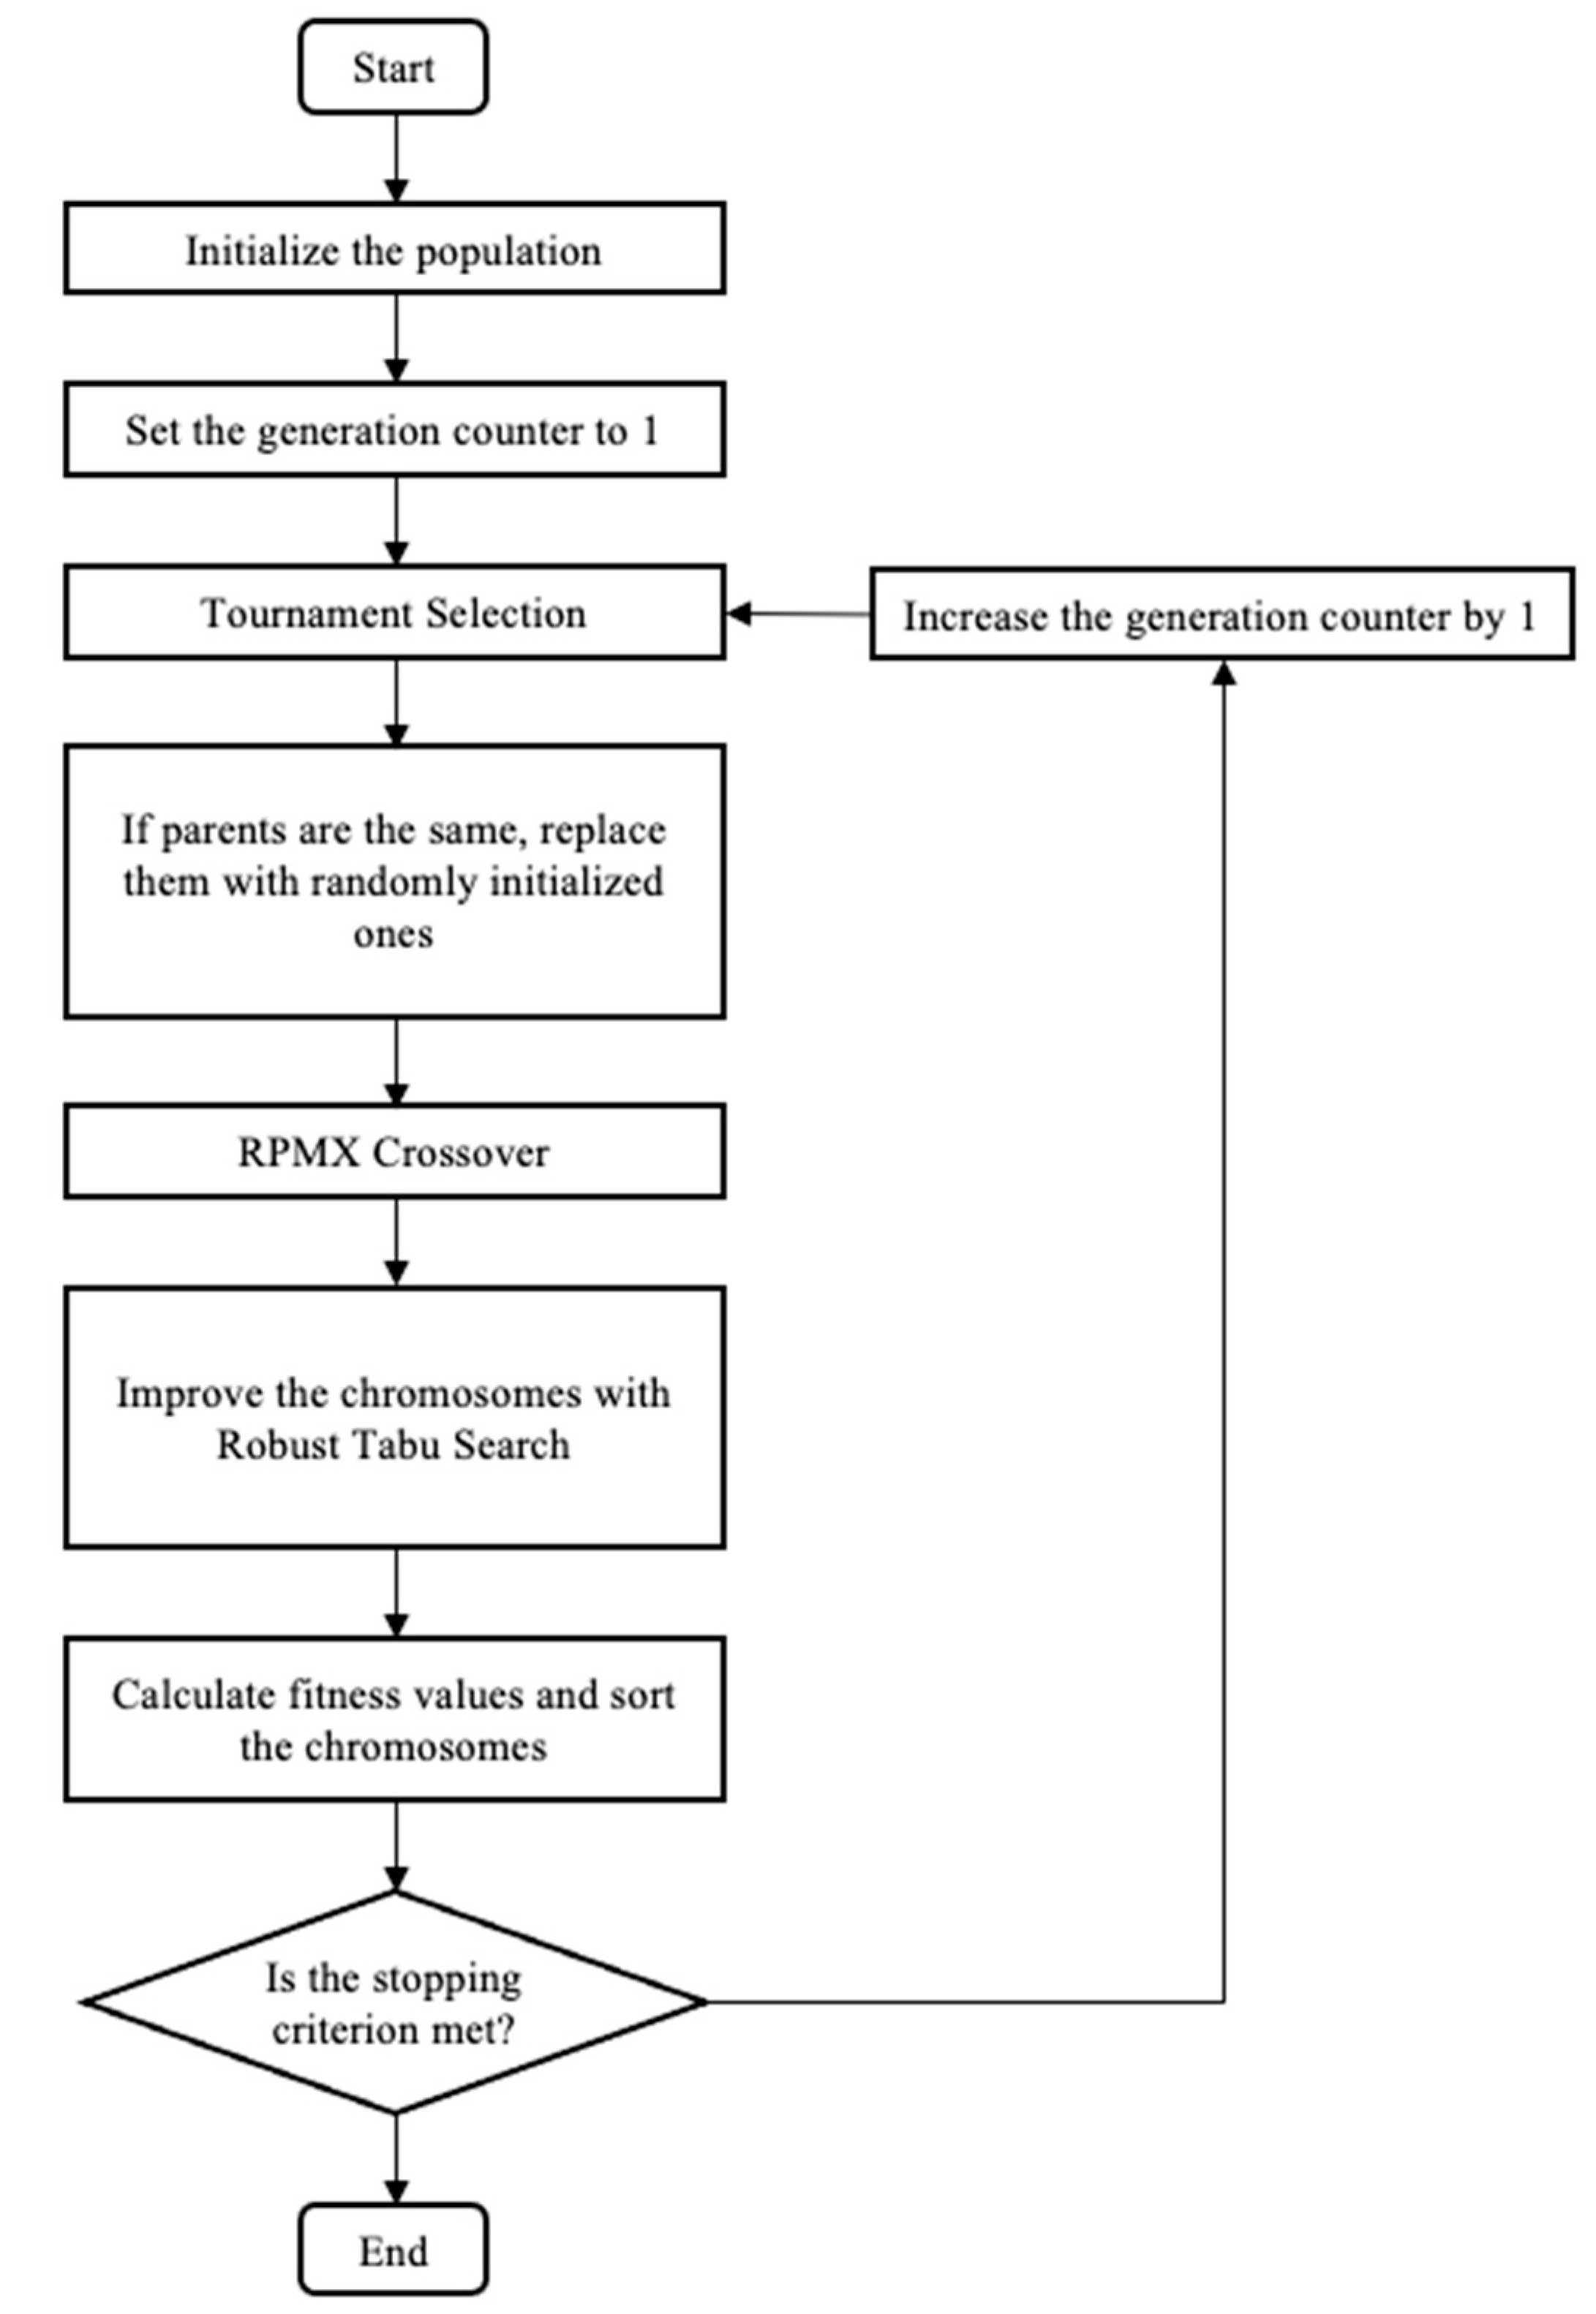
4. Hybrid Genetic Algorithm to Search for Effective Item Assignments

To identify effective assignments in the weighted item assignment problem, we propose a hybrid genetic algorithm (HGA) that focuses on a rectangular layout of sites. We describe the whole process of HGA in Figure 3. We first define a chromosome appropriately to represent the proposed item assignment model. Then, we calculate the fitness of each chromosome using the objective function in Equation (3). For the first generation, we generate each chromosome up to a given population size by randomly assigning items to a rectangular layout. With chromosomes in the population, we create new chromosomes through the process of selection, crossover, applying a robust tabu search, until the generation counter reaches the given maximum number of generations. In the selection procedure, if the genes of selected parents are the same, this will lead to producing the same children. To avoid this problem, we replace both parents with randomly initialized chromosomes when parents are the same. The abovementioned setting obviates the need of mutation operation. Our observation in the proposed algorithm is that the exclusion of mutation induces a simple parameter setting without compromising the performance.

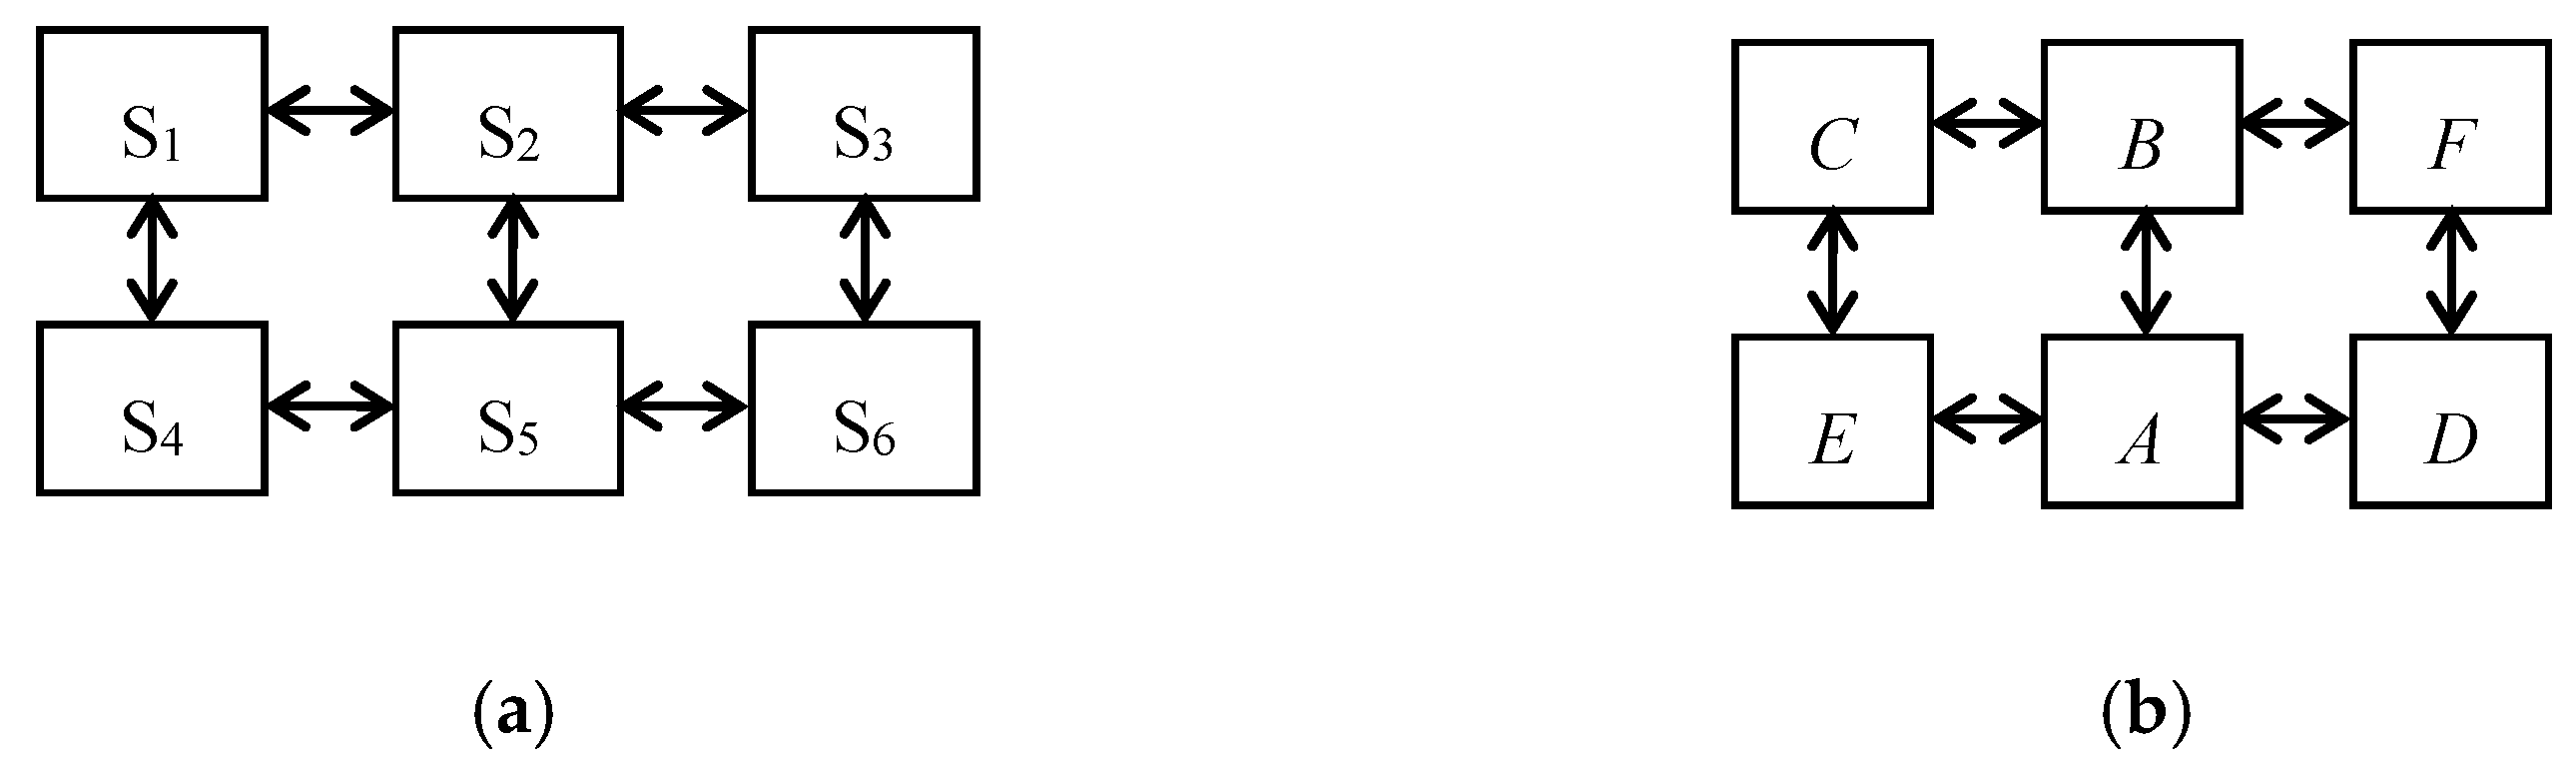
4.1. Equivalence to the TSP Problem

First, we show that a special case of the proposed item assignment problem is equivalent to a symmetric traveling salesman problem when the layout is circularly linked. We prove this by transforming the symmetric traveling salesman problem into an item assignment problem. Let I = {I1, I2, …, In} be the set of cities and S = {S1, S2, …, Sn} be the set of sites structured in a circularly linked form. In other words, the following site configuration in Figure 4a is considered.
Now, we allocate n cities to n sites, with one city at each site, which represents a traveling sequence of the n cities. For example, for n = 4 , the allocation of I 2 at S 1 , I 3 at S 2 , I 1 at S 3 , and I 4 at S 4 represents a traveling sequence, I2I3I1I4I2. It is straightforward that a traveling sequence of the n cities is mapped to an allocation of the n cities to form the circularly linked layout, and the mapping is one-to-one. Now, we formulate a symmetric traveling salesman problem given a circularly linked layout S . Suppose that c i j is the distance between city i and city j ; x i , j is 1 if city I i is located at site S j and 0 otherwise, and y i j is 1 if site S i is adjacent to S j and 0 otherwise. For a given layout S , y i j is given, and x i j is a decision variable. Since c i j × x i , k × x j , k + 1 is a traveling cost from the k -th visiting city ( i ) to the ( k + 1 ) -th visiting city ( j ) , the total cost to minimize is given by
i = 1   j i c i j × x i , 1 × x j , 2   +   c i j × x i , 2 × x j , 3 + + c i j × x i , n 1 × x j , n + c j i × x j , n × x i , 1 = i j , k l   c i j × x i , k × x j , l × y k , l  
with the constraints that each city i should be visited once, k = 1 n x i , k = 1 , and each site k should be taken once, i = 1 n x i , k = 1 . For example, a traveling sequence, I2I3I1I4I2, will have its objective value calculated by c 23 × x 2 , 1 × x 3 , 2 +   c 31 × x 3 , 2 × x 1 , 3 +   c 14 × x 1 , 3 × x 4 , 4 +   c 42 × x 4 , 4 × x 2 , 1 = c 23 +   c 31 + c 14 + c 41   with only x 2 , 1 =   x 3 , 2 = x 1 , 3 = x 4 , 4 = 1 among the decision variables. Thus, we rewrite the symmetric TSP as the following minimization programming:
Minimize i j , k l   c i j × x i k × x j l × y k l Subject   to i = 1 n x i k = 1 , k   =   1 ,   ,   n , k = 1 n x i k = 1 , i   =   1 ,   ,   n , x i k = { 1 ,       i f   i t e m   I i   i s   l o c a t e d   a t   s i t e   S k 0 ,     o t h e r w i s e .
Equation (5) has the same structure as Equation (3) except that TSP is a minimization problem. Thus, we conclude that the proposed model in Equation (5) is a general case of TSP.

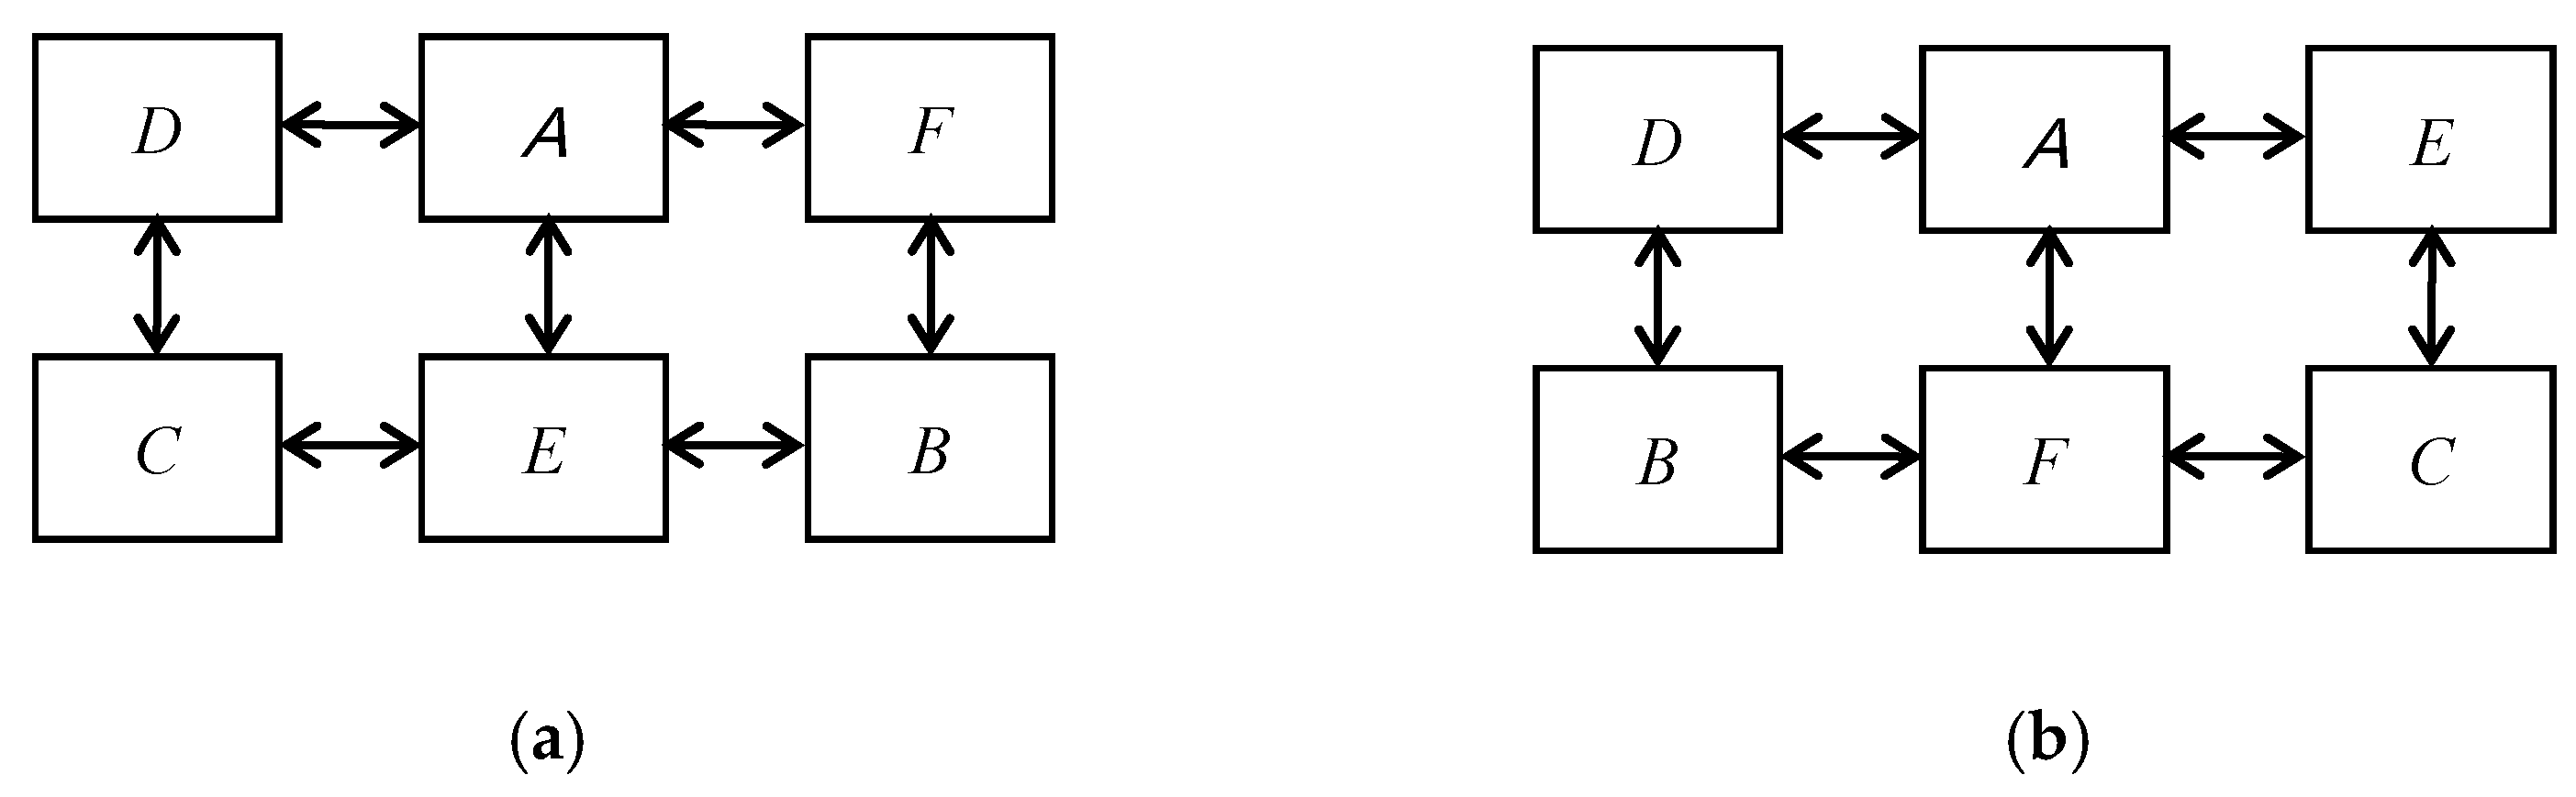
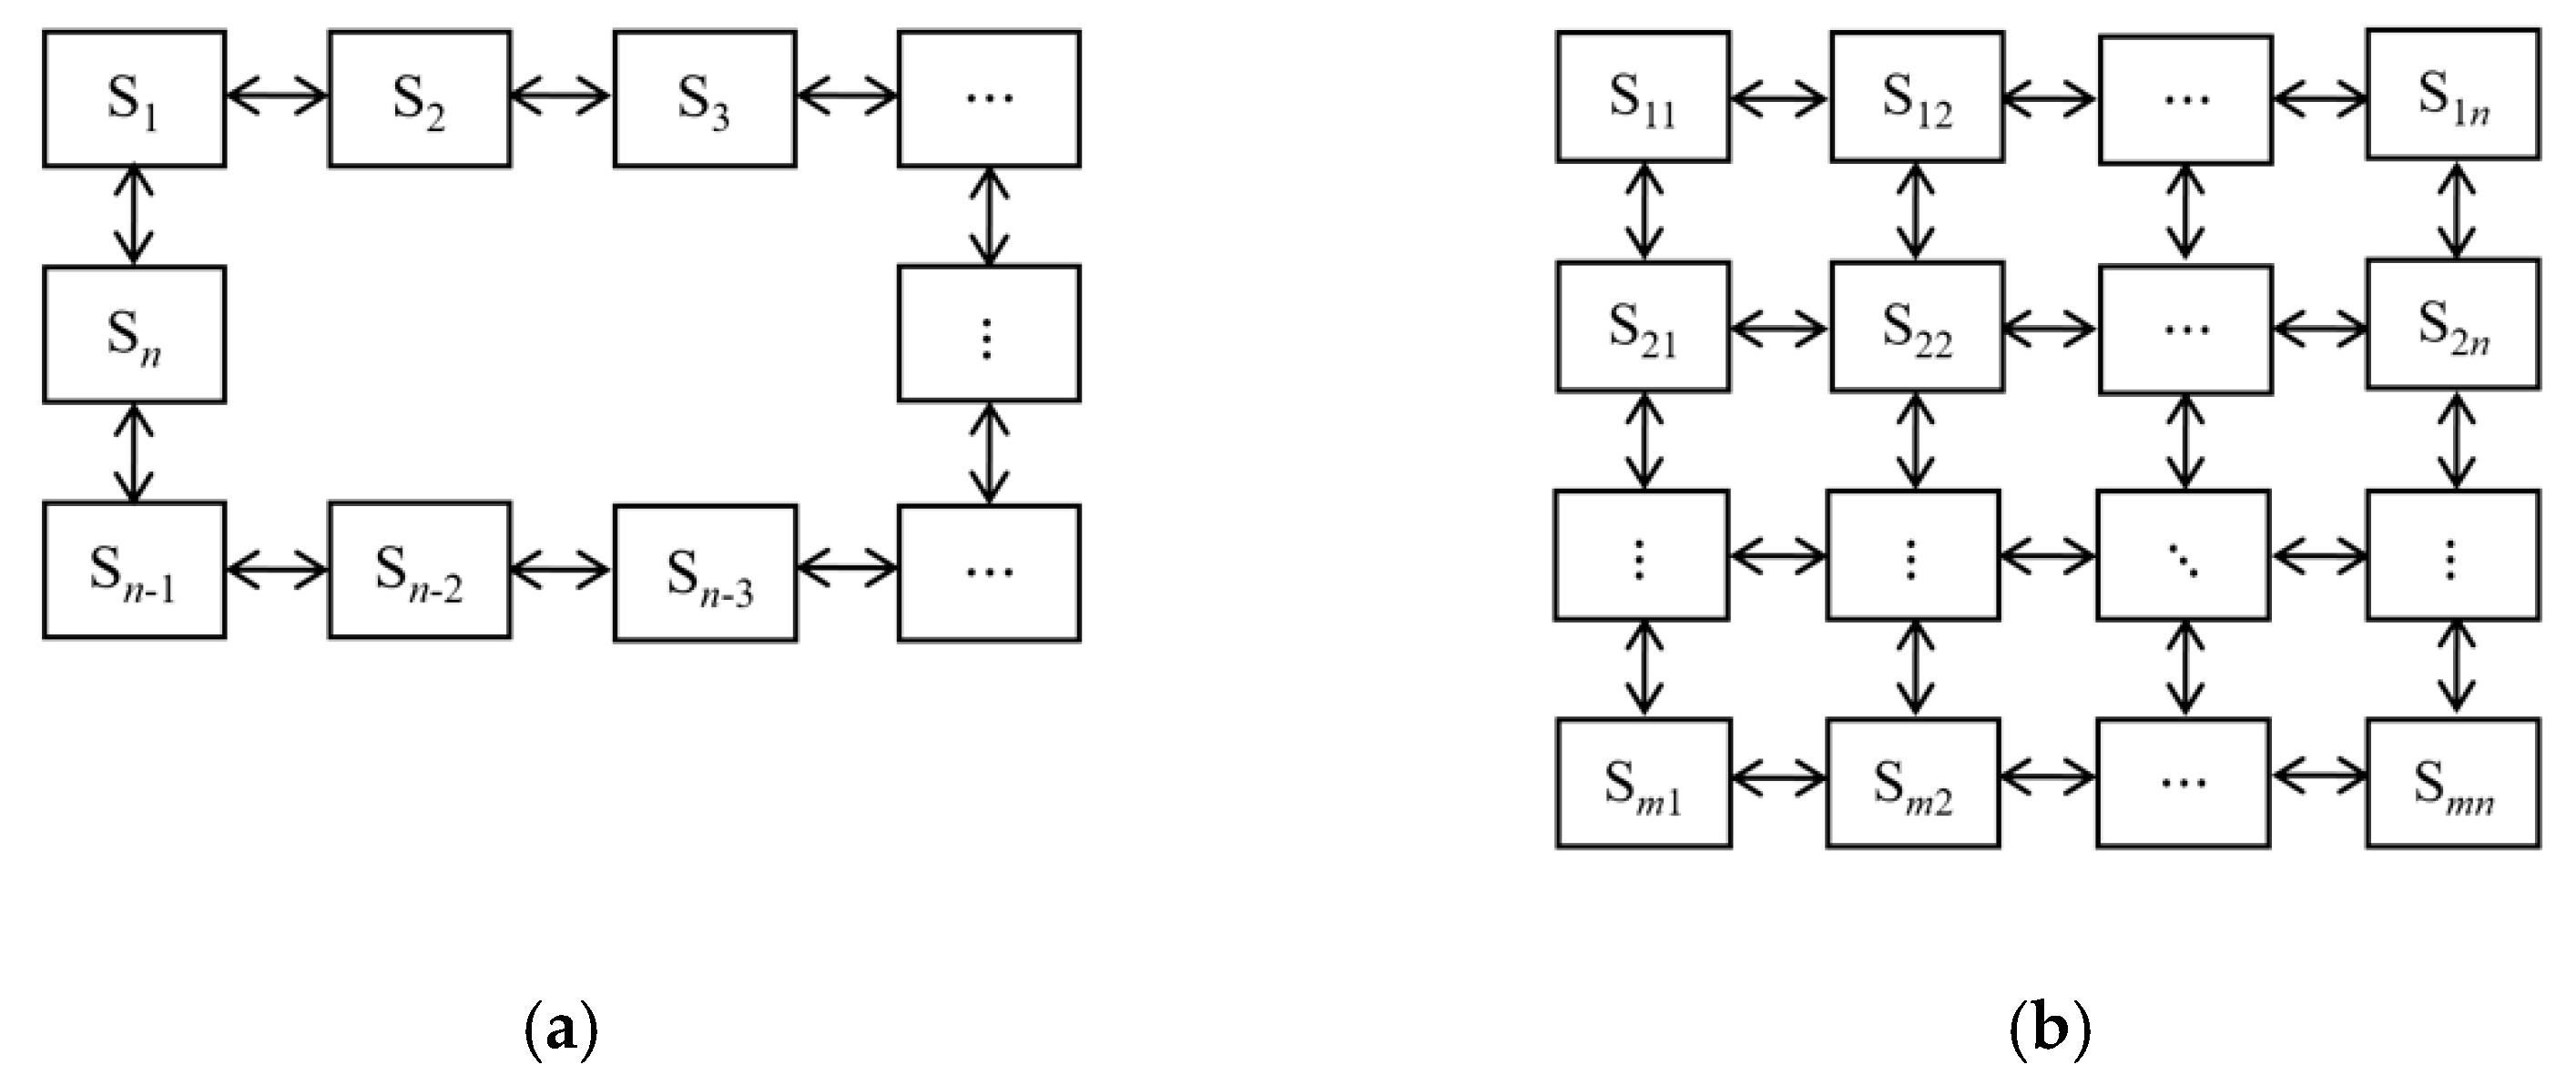
4.2. Definition of A Rectangular Chromosome

We design a rectangular-shape chromosome to apply a genetic algorithm on the item assignment problem. In the rectangular chromosome, an assignment of items is represented in a matrix format. Suppose, an item set I is given by I = {I11, I12, …, Imn} and a site set S = {S11, S12, …, Smn} is given with a rectangular layout with m rows and n columns, as shown in Figure 4b.
When items I11, I12, …, Imn are assigned to sites S11, S12, …, Smn, we represent them with the following rectangular chromosome r = [rij]:
r = [ r 11 r 12 r 1 n r 21 r 22 r 2 n r m 1 r m 1 r m n ] ,
where rij indicates an item assigned at the site corresponding to site s_ij. For example, we represent the item assignment in Figure 2b as a rectangular chromosome with numeric encoding [421653].
In this representation, the fitness value of the chromosome, which is the total possibility of cross-selling, can be calculated using Equation (3) as follows:
i = 1 m 1 j = 1 n w p r o f i t ( r i j , r ( i + 1 ) j ) × w f r e q u c n c y ( r i j , r ( i + 1 ) j ) × l i f t ( r i j r ( i + 1 ) j ) + i = 1 m j = 1 n 1 w p r o f i t ( r i j , r i ( j + 1 ) ) × w f r e q u c n c y ( r i j , r i ( j + 1 ) ) × l i f t ( r i j r i ( j + 1 ) ) .

4.3. Robust Tabu Search

To cope with the complexity of the proposed model with a rectangular layout, we adopt a robust tabu search (RTS) [23,25,26] as a local optimization step. Tabu search starts with approaching a local minimum and records recent moves in a tabu list. The tabu list forms adaptive memory to explore better solutions, and the size of tabu list decides a degree of diversification and intensification. While a large size of tabu list encourages the algorithm to avoid stagnation, a smaller size of tabu list encourages to produce local best solutions to be located around. Tabu search also uses aspiration criteria to allow for exceptions from the tabu list whenever such moves lead to a better result. Taillard’s RTS makes use of a short-term memory and multiple levels of aspiration criteria. Short-term memory prevents the algorithm from revisiting recently visited solutions, which can produce high-quality results. However, long-term memory for diversification drives the search to promising solutions. RTS utilizes tabu list sizes, aspiration, and the number of iterations as parameters. In HGA, we set tabu list sizes to between [0.9 × n, 1.1 × n] (where n is the problem size) and aspiration to 10n2, which are large enough to explore wide search space by allowing to escape from local optima. Often a larger number of iterations produce better solutions, and we set the number of iterations to 2000. Since the proposed method, being evolutionary, reuses previous found solutions, it can gradually approach better local optima as a generation increases. Algorithm 1 provides the details of the adopted RTS algorithm.
Algorithm 1: Robust Tabu Search Algorithm
1: authorized: if a move is not tabu, it is authorized.
2: aspired: Allow tabu moves if they are decided to be interesting.
3: tabu_list: A list to forbid reverse move.
4: Function RobustTabuSearch (bestPerm, flow, dist, minSize, maxSize, aspiration, numIters)
5:   n = size of bestPerm;
6:   bestCost = fitness of bestPerm;
7:   curCost = bestCost;
8:   curPerm = bestPerm;
9:   for (I = 0; I < n; I ++) do
10:      for (j = 0; j < n; j ++) do
11:         tabu_list[i][j] = −(n * I + j);
12:         if (I < j) then
13:            delta[i][j] = compute_delta (curPerm, i, j);
14:         end if
15:      end for
16:   end for
17:   for (iter = 0; iter < numIters; iter ++) do
18:      i_retained = infinite;
19:      min_delta = infinite;
20:      already_inspired = false;
21:      for (I = 0; I < n − 1; I ++) do
22:          for (j = I + 1; j < n; j ++) do
23:            authorized = (tabu_list[i][j] < iter) || (tabu_list[j][curPerm[i]] < iter);
24:            aspired = (tabu_list[i][p[j]] < iter-aspiration) ||
25:             (tabu_list[j][p[i]] < iter-aspiration) ||
26:             (curCost + delta[i][j] < bestCost);
27:            if ((aspired &&!already_aspired) ||
28:             (aspired && already_aspired && (delta[i][j] < min_delta)) ||
29:             (!aspired &&!already_aspired && (delta[i][j] < min_delta) && authorized)) then
30:               i_retained = i;
31:               j_retained = j;
32:               min_delta = delta[i][j];
33:               if (aspired) then
34:                 already_aspired = true;
35:               end if
36:             end if
37:           end for
38:      end for
39:      if (i_retained! = infinite) then
40:    swap(curPerm[i_retained], curPerm[j_retained]);
41:           curCost = curCost + delta[i_retained][j_retained];
42:           tabu_list[i_retained][curPerm[j_retained]] = iter + unif(minSize, maxSize);
43:           tabu_list[j_retained][curPerm[i_retained]] = iter + unif(minSize, maxSize);
44:           if (curCost < bestCost) then
45:             bestCost = curCost;
46:             bestPerm = curPerm;
47:           end if
48:      end if
49:      for (i = 0; i < n − 1; i++) do
50:           for (j = i + 1; j < n; j++) do
51:             if (i! = i_retained && i! = j_retained && j! = i_retained && j! = j_retained) then
52:               delta[i][j] = compute_delta_part(curPerm, delta, i, j, i_retained, j_retained);
53:             else
54:               delta[i][j] = compute_delta(curPerm, i, j);
55:             end if
56:           end for
57:      end for
58:   end for

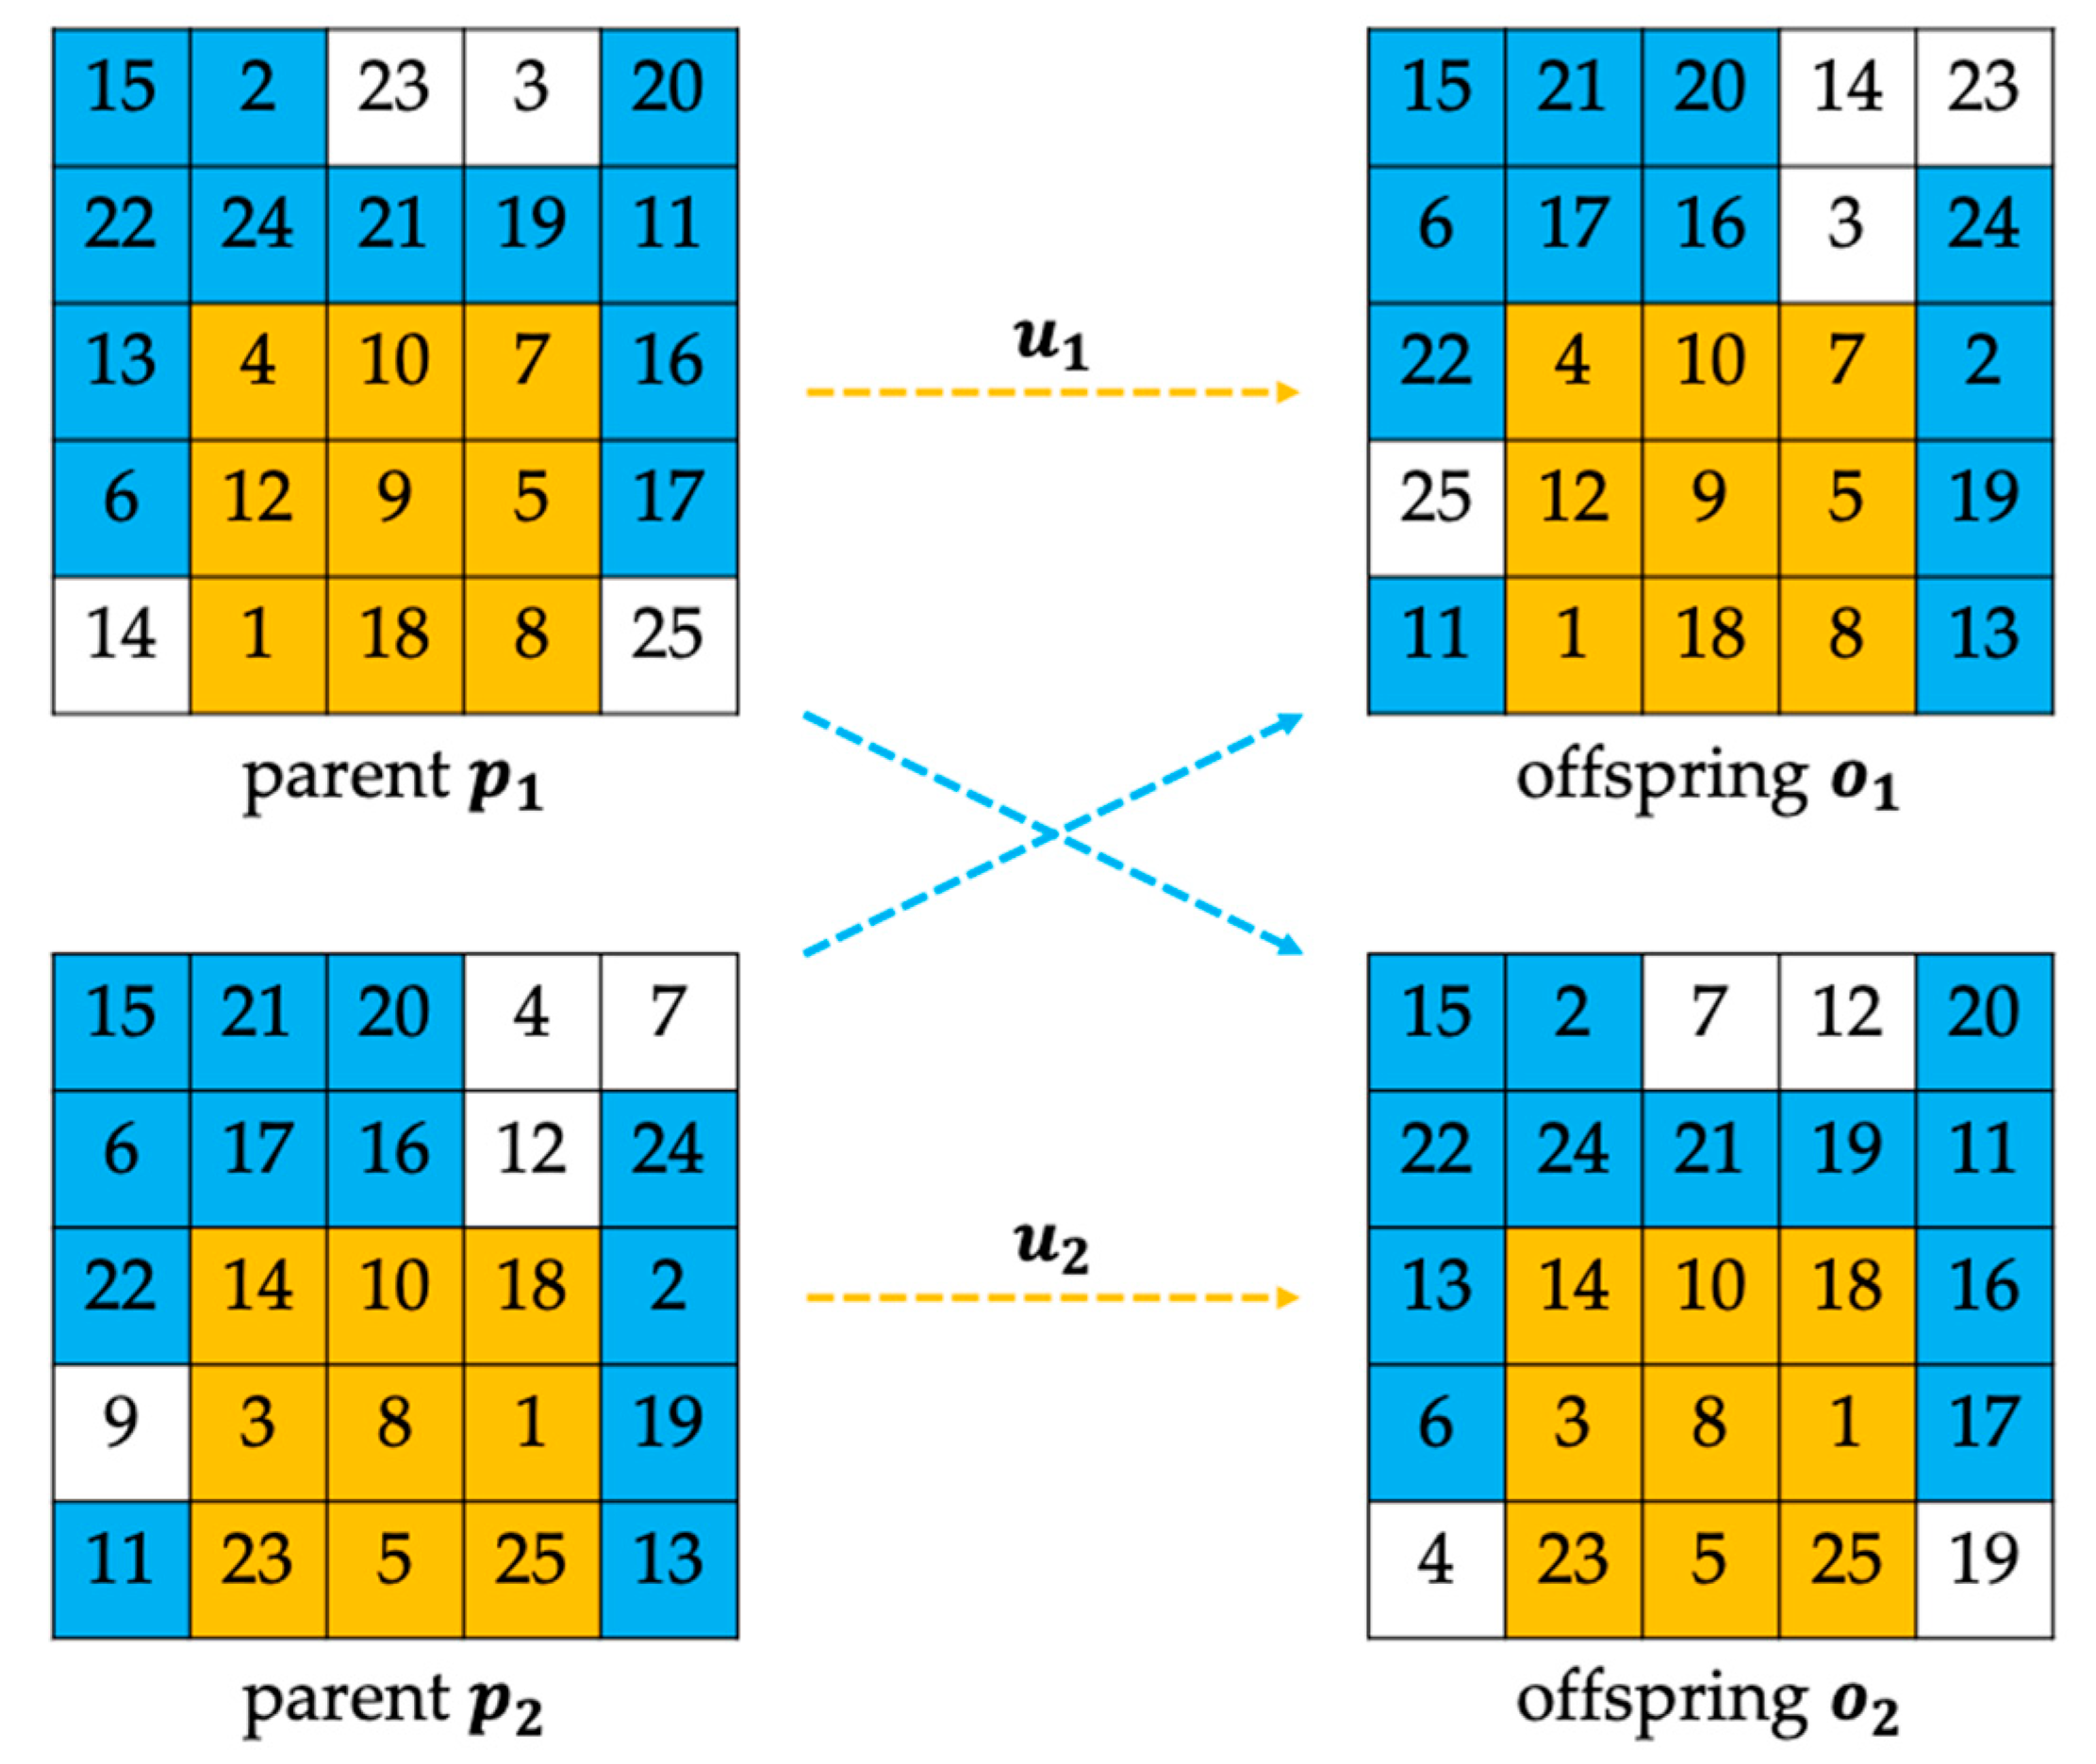
4.4. Rectangular Partially Matched Crossover

In the proposed genetic algorithm, we use tournament selection [32] to determine parents. After selecting chromosomes up to a tournament size, which is set to three in this study, from a population at random, we choose the best and the second-best chromosomes as the parents based on their objective values. In addition, we propose rectangular partially matched crossover (RPMX), which effectively adapts a partially matched crossover (PMX) operator to the item assignment model. PMX uses a vector-format chromosome and randomly finds two cut points from parent chromosomes, performing mapping and exchanging to produce a feasible solution while RPMX uses a matrix-format chromosome. RPMX selects two cut points each from both row and column sides to choose a preserved area in a rectangular chromosome. As shown in Figure 5, e.g., the first cut point from the rows is between the second and third rows, and the second one is the end of the rows. Likewise, the first cut point from the columns is between the first and second columns, and the second one is between the fourth and fifth columns. Let us denote the set of selected genes as u1 and u2, respectively. For example, u1 is {1,4,5,7,8,9,10,12,18}, colored orange in Figure 5. On each parent pi, we map u1 to keep the offspring oi intact, and the rest of the genes for each parent are copied onto the other offspring after exchanging them to produce feasible solutions. In the process, we obtain conflicted genes in parent p1 as u2u1u2 and those in parent p2 as u1u1u2. For example, in Figure 5, u1u2 is {1,5,8,10,18}, and the conflicted genes in parent p1 is u2 − {1,5,8,10,18}, colored in white in the first row of the figure. Then, we obtain unconflicted genes as p1u1u2 and p2u1u2, respectively, in each parent, exchanging them to construct offsprings. For example, the unconflicted genes are highlighted in blue in Figure 5, i.e., the blue-colored genes on each parent are copied onto the other offspring intact since they have no conflict to produce feasible solution, while the white-colored genes are copied after exchanging procedure, and the orange-colored genes are kept intact as they were in each parent.

5. Experiments

In this section, we demonstrate the application of the item assignment models based on association and the effectiveness of the proposed HGA with QAPLIB instances and synthetic problems designed for item assignment situations. We compare the method with a few state-of-the-art algorithms. We carry out experiments in the Java language on an Intel Core 3.6 GHz PC, and the implemented codes and datasets are available via the following GitHub url: https://github.com/bzantium/HGA-RPMX (accessed on 19 January 2021).

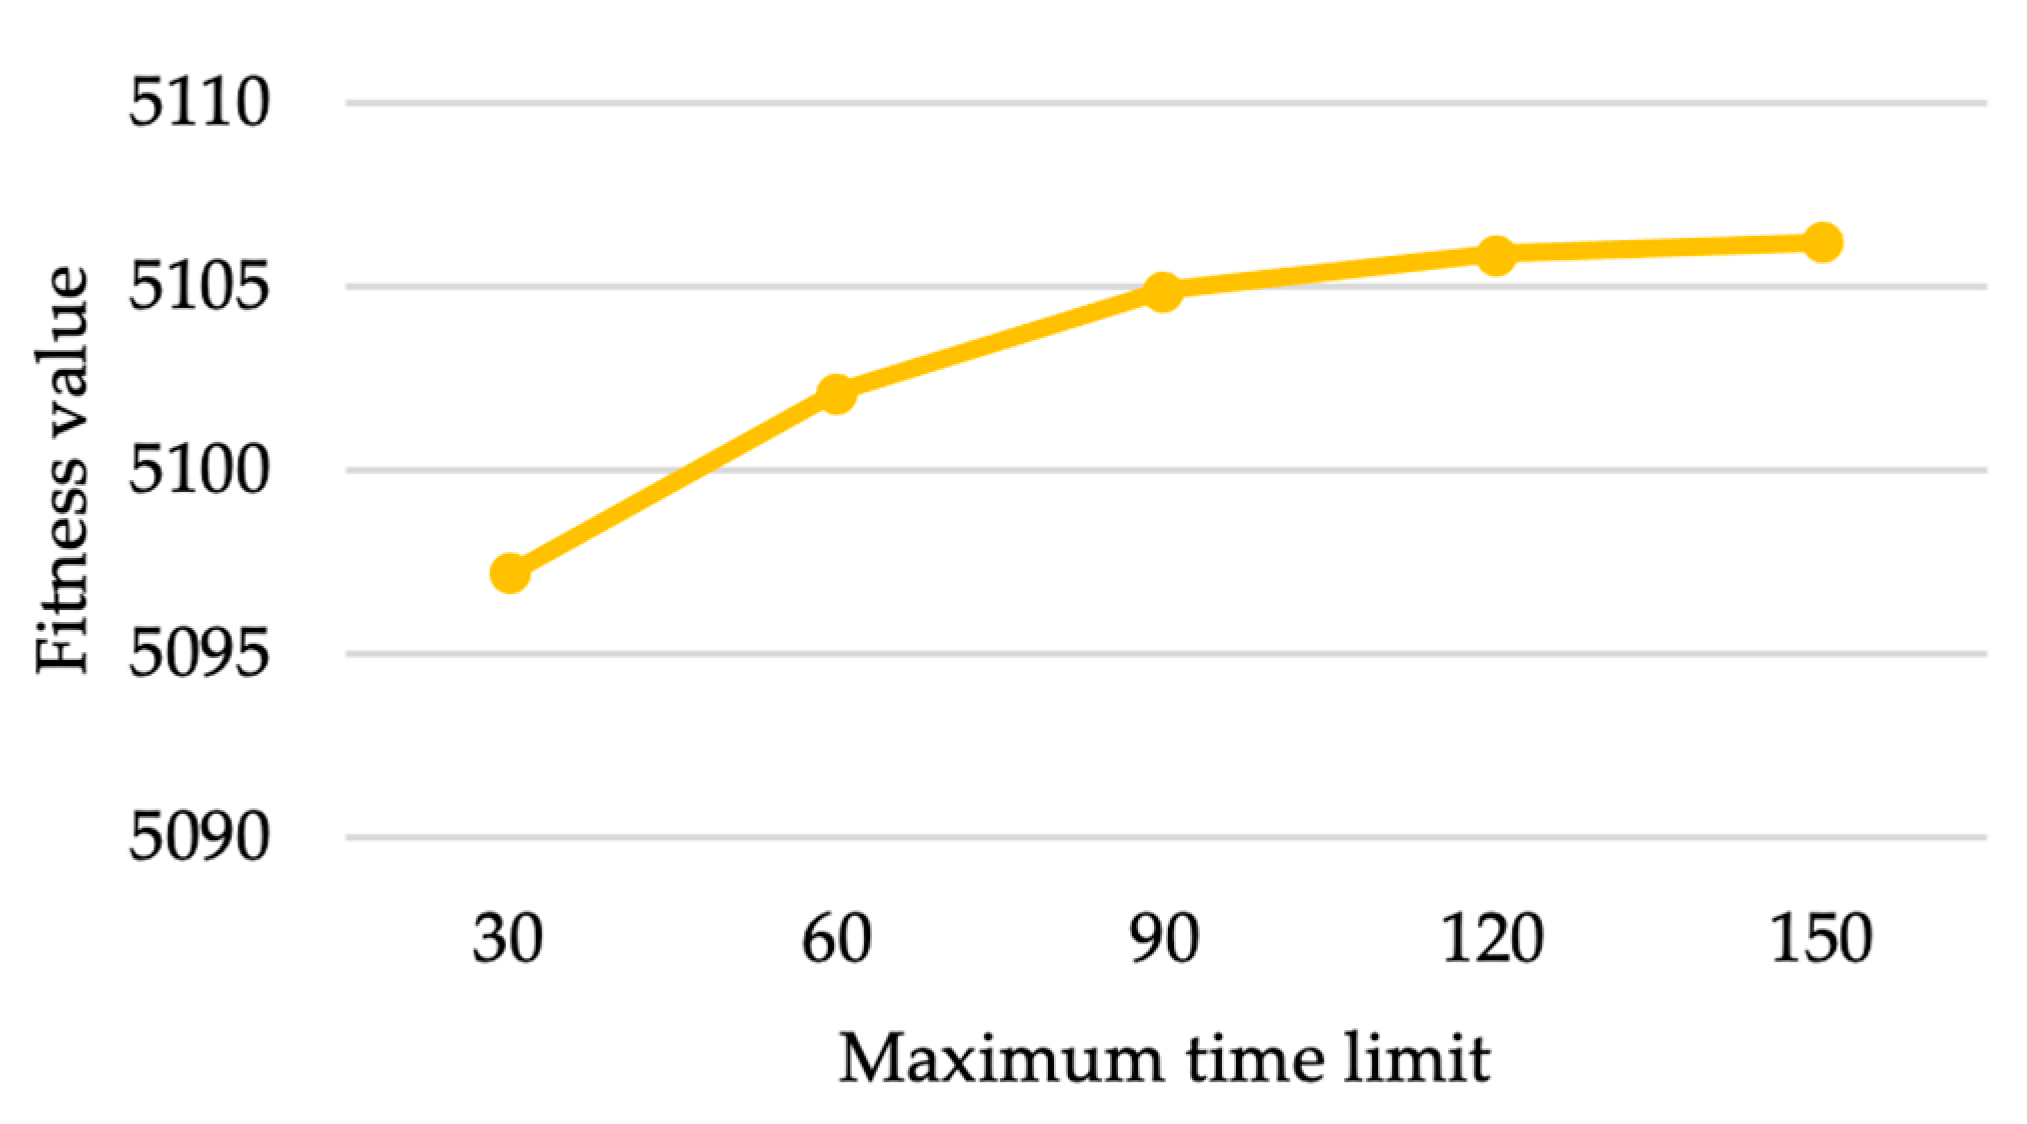
5.1. Tuning the Parameters of HGA

The time performance of the proposed algorithm varies depending on two main parameters: population size and maximum generation number. Besides, execution time linearly increases in proportion to the maximum generation number since it is a stopping criterion in the algorithm. According to the practice in the QAP literature, however, it is common to use maximum time limit for fair evaluation of the performance. Thus, to properly tune parameters, we set maximum generation number to infinite, fixing maximum time limit to 30 min. In Figure 6, for the problem of tai60a, we provide boxplots of 30 repeated percentage deviations from the published best-known solution with increasing population size ranging from 10 to 100. The reason we choose tai60a for tuning parameters is that it is a fairly hard problem of a moderate size.
We observe performance is not substantially different along with population size, meaning that population size has little effect on the performance of the proposed algorithm. Therefore, we simply decide to use population size 20, which has the minimum sample average under the infinite maximum-generation number. Instead, we use a 2-h maximum time limit for a practical purpose to test the proposed HGA on all the following comparative experiments. Settings of parameters are summarized in Table 7.

5.2. Experimental Results and Comparisons on the QAPLIB

QAPLIB is the most popular collection of instances for QAP to evaluate performances of a new algorithm by comparing with other methods. In this part of experiments, we compare our proposed HGA with TLBO-RTS and ABC-QAP in terms of averaged percentage deviation (APD) from the best-known solution (BKS) value of the problem instances given by QAPLIB and averaged execution time (denoted by “min.” in Table 8) to reach the reported result. We also take into account the number of reaching an optimal or BKS over 10 repeated executions. Since small and easy instances from the collection are easily and fast solved with no substantial differences between state-of-the-art algorithms, we present the results of challenging instances. Table 8 shows comparative results on the selected 19 instances. In this comparison, 255 number of processors were used in parallel for ABC-QAP algorithm. The proposed HGA outperformed the tested methods in the 15 problems, and it was both the most accurate and the fastest in terms of the average time in the 7 problems.
From Table 8, we observe that HGA shows competitive and better performance on all instance except only a few, finding the best-known solution for 16 out of 19 instances. Especially, for harder instances, tai40a, tai50a, tai60a, tai80a, and tai100a, it consistently outperforms the other algorithms.

5.3. Synthetic Experimental Design

We also tested the hybrid genetic algorithm using synthetic data including lifts, relative profits, and relative frequencies of items. Table 9 shows the range of the parameters set for the synthetic data. Lifts between the two items are randomly generated as a value within the range of 1 to 1.4 with probability of 0.9 otherwise 0. Relative profits and relative frequencies between the two items are randomly generated within the range of 1 to 4.
The synthetic databases shown in Table 10 are used in these experiments. The layouts of the sites in Table 10 are rectangular layouts of sites in which all the items are assigned. The synthetic databases consist of the table of lifts, table of relative profits, and table of relative frequencies. For example, the table of lifts for DB4 in Table 10 is a 225 × 225   matrix with values from 1 to 1.4 or zero, and tables of relative profits and relative frequencies are 225 × 225 matrices with values from 1 to 4.

5.4. Comparison of Assignment Models

In order to verify the superiority of the weighted item assignment model, three types of assignment models were compared, as shown in Table 11. Each assignment was optimized by the proposed algorithm with only one maximum generation number. The first assignment, denoted as (A), was updated from the initial assignment when considering only lifts. The fitness values in column (A) were calculated according to Equation (2). The second assignment was denoted as (B) and was updated from the initial assignment when considering both lifts and relative profits. Denoted as (C), the third assignment was updated from the initial assignment when considering lifts, relative profits, and relative frequencies. The numbers in column (C) are the fitness values of Equation (3).
Table 11 shows that the assignments denoted as (C) are better solutions when compared to the other assignments. For example, according to the experimental results of DB4, if retailers assign items to sites based on (A), which only considers lifts, they will lose around 94% of the chance of gaining profits compared to assignment (C). In addition, placing items at sites based on (C) increases the chance of sales by 27% more than assignment (B), which only accounts for lifts and relative profits. The experimental results in Table 11 demonstrated that the weighted item assignment model can mimic real situations in retail more accurately than the previous model that considered only lifts and even shows better performances as the problem size increases.

5.5. Comparison of HGA Using Different Crossover

We performed experiments to compare the proposed crossover, RPMX, in HGA with several existing crossover operators, position-based crossover (POS) [33] and uniform crossover (UX) [34]. Note that position-based crossover, possessing the same structure as RPMX, is different on how to choose exchanging genes. We compared the performance of crossover methods, RPMX, POS, and UX, using DB1, DB2, DB3, and DB4 in the item allocation situation. We present averaged fitness value and average time for each synthetic data in Table 12. We note that RPMX consistently outperforms the other crossover methods in terms of averaged fitness within comparative computational time.

5.6. Experimental Results and Comparison on the Synthetic Data

We evaluate the performance of the HGA on the synthetic data. Compared with TLBO-RTS and ABC-QAP, the proposed method HGA consistently outperforms the state-of-the-art algorithms in all databases. Table 13 shows the best-found solution (BFS) from trials, the averaged fitness value, averaged percentage deviation from BFS, and the averaged time to reach the reported fitness over 10 repeated executions for each database. All best-found solutions are derived by the proposed HGA.
We observe that the proposed HGA method consistently outperformed the other methods in all the databases in terms of fitness and APD. As can be seen above, HGA produced better solutions (higher fitness values) with substantially low deviation while keeping up competitive computational time for the tested problems in all instances. These results demonstrate that our proposed algorithm is effective, in particular, for weighted item assignment situations. Finally, we show averaged fitness values with 50 repetitions according to the maximum time limit from 30 to 150 min with step size 30 for DB2 in Figure 7 to demonstrate the convergence of the proposed method. The values increase as the maximum time limit increases with a trend of saturation.

6. Conclusions

This work proposes an item assignment model based on association rule mining to achieve a more realistic assignment model for the retail industry. Strong associations between the items can be used by retailers to position-correlated items close together for cross-selling. However, the strength of the association and the information regarding the profit and frequency of purchasing items are crucial factors for determining effective item assignments. This study suggests a profitable item assignment model combining association with profit and frequency and also proposes a hybrid genetic algorithm to find the most effective assignment. Lift was used to measure the strength of the associations. The absolute profits that increased due to cross-selling items were transformed into relative profits to mitigate gaps in the scale. The frequencies of cross-selling items were also transformed to their relative values. To test the effectiveness of the proposed weighted item assignment model, we tested three assignment types. The first assignment included only information for lifts. The second assignment was based on both lifts and profits. The third assignment considered lifts, profits, and frequencies. The experimental results showed that item assignment based on the third assignment increased the chance of gaining profits more than the other assignments. The results verified the superiority of the profitable item assignment model combining association, profit, and frequency. In addition, we performed two more experiments to compare the proposed hybrid genetic algorithm with state-of-the-art algorithms and the proposed crossover operator with other crossover operators. The tests showed that the proposed hybrid genetic algorithm, HGA, consistently provides a better solution in a reasonable computation time for the tested databases compared to the other methods. We showed that the proposed model, a quadratic assignment problem, is a general case of traveling sales problems. The proposed genetic algorithm is equipped with a specially designed gene, suitable for a layout representation, and its associated rectangular partially matched crossover. The weakness of the proposed method is a lack of theoretical analysis, which is inherent in metaheuristic algorithms. As a future research direction, research considering qualitative factors such as shopping path and layout type should be conducted in practical retail environments to provide a more realistic model for retail purposes. We also envision extending it to other assignment problems such as multi-mode multi-user traffic assignment problem in urban transportation networks.

Author Contributions

Conceptualization and methodology, K.-I.A. and K.L.; methodology, software, validation, formal analysis, visualization, and investigation by M.R.; data curation, writing by M.R., K.-I.A. and K.L.; supervision, project administration, and funding acquisition by K.L. All authors have read and agreed to the published version of the manuscript.

Funding

This research received no external funding.

Institutional Review Board Statement

Not applicable.

Informed Consent Statement

Not applicable.

Data Availability Statement

Available via https://github.com/bzantium/HGA-RPMX (accessed on 19 January 2021).

Acknowledgments

The authors acknowledge no other support given than what is covered by the authors contribution or funding sections.

Conflicts of Interest

The authors declare no conflict of interest.

References

  1. Ahn, K.I. Effective product assignment based on association rule mining in retail. Expert Syst. Appl. 2012, 39, 12551–12556. [Google Scholar] [CrossRef]
  2. Yang, Z.; Tang, W.H.; Shintemirov, A.; Wu, Q.H. Association Rule Mining-Based Dissolved Gas Analysis for Fault Diagnosis of Power Transformers. IEEE Trans. Syst. Man Cybern. Part C Appl. Rev. 2009, 39, 597–610. [Google Scholar] [CrossRef]
  3. Huang, J.; Ji, S.; Xie, H.; Wang, X. Research on cross-selling in the express delivery enterprise based on data mining. In Proceedings of the 2008 International Conference on Service Systems and Service Management, Melbourne, Australia, 30 June–3 July 2008; pp. 1–6. [Google Scholar]
  4. Jiao, J.; Zhang, Y. Product portfolio identification based on association rule mining. Comput. Des. 2005, 37, 149–172. [Google Scholar] [CrossRef]
  5. Cho, Y.H.; Kim, J.K.; Kim, S.H. A personalized recommender system based on web usage mining and decision tree induction. Expert Syst. Appl. 2002, 23, 329–342. [Google Scholar] [CrossRef]
  6. Kang, X.; Porter, C.S.; Bohemia, E. Using the fuzzy weighted association rule mining approach to develop a customer satis-faction product form. J. Intell. Fuzzy Syst. 2020, 38, 4343–4357. [Google Scholar] [CrossRef]
  7. Ramasamy, S.; Nirmala, K. Disease prediction in data mining using association rule mining and keyword based clustering algorithms. Int. J. Comput. Appl. 2017, 42, 1–8. [Google Scholar] [CrossRef]
  8. Shao, Y.; Liu, B.; Wang, S.; Li, G. Software defect prediction based on correlation weighted class association rule mining. Knowl. Based Syst. 2020, 196, 5742. [Google Scholar] [CrossRef]
  9. Tuysuzoglu, G.; Birant, D. Air Pollution Monitoring in Intelligent Cities Using Weighted Association Rule Mining. In Advances in Civil and Industrial Engineering; IGI Global: Hershey, PA, USA, 2021; pp. 171–197. [Google Scholar]
  10. Han, J.; Pei, J.; Kamber, M. Data Mininig: Concepts and Techniques; Elsevier: Amsterdam, The Netherlands, 2011. [Google Scholar]
  11. Brijs, T.; Swinnen, G.; Vanhoof, K.; Wets, G. Building an Association Rules Framework to Improve Product Assortment Decisions. Data Min. Knowl. Discov. 2004, 8, 7–23. [Google Scholar] [CrossRef] [Green Version]
  12. Chen, M.C. Configuration of cellular manufacturing systems using association rule induction. Int. J. Prod. Res. 2003, 41, 381–395. [Google Scholar] [CrossRef]
  13. Liu, C.; Yasuda, K.; Yin, Y.; Tanaka, K. Uncertain association rule mining algorithm for the cell formation problem in cellular manufacturing systems. Int. J. Prod. Res. 2008, 47, 667–685. [Google Scholar] [CrossRef]
  14. Chen, M.-C.; Huang, C.L.; Chen, K.Y.; Wu, H.P. Aggregation of orders in distribution centers using data mining. Expert Syst. Appl. 2005, 28, 453–460. [Google Scholar] [CrossRef]
  15. Ardakani, B.A.; Fathian, M.; Gholamian, M. A novel model for product bundling and direct marketing in e-commerce based on market segmentation. Decis. Sci. Lett. 2018, 7, 39–54. [Google Scholar] [CrossRef]
  16. Cai, C.; Fu, A.; Cheng, C.; Kwong, W. Mining association rules with weighted items. In Proceedings of the IDEAS’98. International Database Engineering and Applications Symposium (Cat. No.98EX156), Cardiff, UK, 10 July 2002; pp. 68–77. [Google Scholar] [CrossRef] [Green Version]
  17. Tao, F.; Murtagh, F.; Farid, M.; Coenen, F. Weighted association rule mining using weighted support and significance framework. In Proceedings of the ninth ACM SIGKDD international conference on Knowledge discovery and data mining, Washington, DC, USA, 24–27 August 2003; pp. 661–666. [Google Scholar]
  18. Khan, M.S.; Muyeba, M.; Coenen, F. Weighted Association Rule Mining from Binary and Fuzzy Data. In Computer Vision; Springer International Publishing: New York, NY, USA, 2008; Volume 5077, pp. 200–212. [Google Scholar]
  19. Pears, R.; Koh, Y.S.; Dobbie, G.; Yeap, W. Weighted association rule mining via a graph based connectivity model. Inf. Sci. 2013, 218, 61–84. [Google Scholar] [CrossRef]
  20. Lee, D.; Park, S.H.; Moon, S. Utility-based association rule mining: A marketing solution for cross-selling. Expert Syst. Appl. 2013, 40, 2715–2725. [Google Scholar] [CrossRef]
  21. Heydari, M.; Yousefli, A. A new optimization model for market basket analysis with allocation considerations: A genetic al-gorithm solution approach. Manag. Mark. Chall. Knowl. Soc. 2017, 12, 1–11. [Google Scholar] [CrossRef] [Green Version]
  22. Awler, E.L. The quadratic assignment problem. Manag. Sci. 1963, 9, 586–599. [Google Scholar]
  23. Taillard, E. Robust taboo search for the quadratic assignment problem. Parallel Comput. 1991, 17, 443–455. [Google Scholar] [CrossRef]
  24. Benlic, U.; Hao, J.K. Memetic search for the quadratic assignment problem. Expert Syst. Appl. 2015, 42, 584–595. [Google Scholar] [CrossRef] [Green Version]
  25. Dokeroglu, T. Hybrid teaching–learning-based optimization algorithms for the Quadratic Assignment Problem. Comput. Ind. Eng. 2015, 85, 86–101. [Google Scholar] [CrossRef]
  26. Dokeroglu, T.; Sevinc, E.; Cosar, A. Artificial bee colony optimization for the quadratic assignment problem. Appl. Soft Comput. 2019, 76, 595–606. [Google Scholar] [CrossRef]
  27. Misevičius, A.; Verenė, D. A Hybrid Genetic-Hierarchical Algorithm for the Quadratic Assignment Problem. Entropy 2021, 23, 108. [Google Scholar] [CrossRef]
  28. Ma, J.; Xu, M.; Meng, Q.; Cheng, L. Ridesharing user equilibrium problem under OD-based surge pricing strategy. Transp. Res. Part B Methodol. 2020, 134, 1–24. [Google Scholar] [CrossRef]
  29. Dewi, S.K.; Utama, D.M. A New Hybrid Whale Optimization Algorithm for Green Vehicle Routing Problem. Syst. Sci. Control. Eng. 2021, 9, 61–72. [Google Scholar] [CrossRef]
  30. Hanh, N.T.; Binh, H.T.T.; Hoai, N.X.; Palaniswami, M.S. An efficient genetic algorithm for maximizing area coverage in wireless sensor networks. Inf. Sci. 2019, 488, 58–75. [Google Scholar] [CrossRef]
  31. Yu, Y.; Li, J.; Li, Y.; Li, S.; Li, H.; Wang, W. Comparative Investigation of Phenomenological Modeling for Hysteresis Responses of Magnetorheological Elastomer Devices. Int. J. Mol. Sci. 2019, 20, 3216. [Google Scholar] [CrossRef] [Green Version]
  32. Miller, B.L.; Goldberg, D.E. Genetic algorithms, tournament selection, and the effects of noise. Complex Syst. 1995, 9, 193–212. [Google Scholar]
  33. Oliver, I.; Smith, D.; Holland, J.R. Study of permutation crossover operators on the traveling salesman problem. In Genetic Algorithms and Their Applications, Proceedings of the Second International Conference on Genetic Algorithms; Massachusetts Institute of Technology: Cambridge, MA, USA, 1987. [Google Scholar]
  34. Syswerda, G. A Study of Reproduction in Generational and Steady-State Genetic Algorithms. In Foundations of Genetic Algorithms; Elsevier BV: Amsterdam, The Netherlands, 1991; Volume 1, pp. 94–101. [Google Scholar]
Figure 1. (a) A rectangular layout of six sites. (b) Item assignment, denoted by BASE_ASSIGN.
Applsci 11 02209 g001
Figure 2. (a) Item assignment, denoted by PROFIT_ASSIGN. (b) Item assignment, denoted by PROF_FRE_ASSIGN.
Applsci 11 02209 g002
Figure 3. Flowchart of the proposed hybrid genetic algorithm (HGA).
Applsci 11 02209 g003
Figure 4. (a) Circularly linked layout. (b) Rectangular layout form.
Applsci 11 02209 g004
Figure 5. Rectangular partially matched crossover (RPMX) for weighted item assignment in rectangular layouts.
Applsci 11 02209 g005
Figure 6. Boxplot of percentage deviations with increasing population size.
Applsci 11 02209 g006
Figure 7. Averaged fitness values with 50 repetitions along with maximum time limit for DB2.
Applsci 11 02209 g007
Table 1. Exemplary lift values between 6 items.
ABCDEF
A-1.601.301.2
B1.6-1.11.401.3
C01.1-1.31.50
D1.31.41.3-01.3
E001.50-1.3
F1.21.301.31.3-
Table 2. (a) Expected profit increase due to cross-selling items. (b) Expected profit considering lifts.
(a)ABCDEF
A-1010201010
B10-10101030
C1010-201010
D201020-1010
E10101010-10
F1030101010-
(b)ABCDEF
A-16026012
B16-1114039
C011-26150
D261426-013
E00150-13
F123901313-
Table 3. (a) Frequencies of occurrence (database size = 22,000). (b) Expected profit considering lifts and frequencies.
(a)ABCDEF
A-10001000100010004000
B1000-1000400010001000
C10001000-100030001000
D100040001000-10001000
E-10001000100010004000
F1000-1000400010001000
(b)ABCDEF
A-16,000026,000048,000
B16,000-11,00056,000039,000
C011,000-26,00045,0000
D26,00056,00026,000-013,000
E-16,000026,000048,000
F16,000-11,00056,000039,000
Table 4. Relative profit increased by cross-selling items.
ABCDEF
A-11211
B1-1113
C11-111
D2111-11
E1111-1
F13111-
Table 5. (a) Relative frequencies of occurrence. (b) Expected relative profit considering lifts and frequencies.
(a)ABCDEF
A-11114
B1-1411
C11-131
D141-11
E1131-1
F41111-
(b)ABCDEF
A-1.602.604.8
B1.6-1.15.603.9
C01.1-2.64.50
D2.65.62.6-01.3
E004.50-1.3
F4.83.901.31.3-
Table 6. Relative profit increased by cross-selling items.
BASE_ASSIGNPROFIT_ASSIGNPROF_FRE_ASSIGN
Objective value according to Equation (3)1.6 + 2.6 + 1.1 + 3.9 + 4.5 + 1.3 = 152.6 + 4.8 + 3.9 + 2.6 + 4.5 = 18.42.6 + 4.8 + 5.6 + 3.9 + 4.5 = 21.4
Table 7. Parameter setting for the proposed hybrid genetic algorithm (HGA).
ParametersValue
Population size20
Maximum generation numberInfinite
Maximum time limit2 h
Tabu list sizes [ 0.9 n ,   1.1 n ]
Aspiration 10 × n 2
Number of iterations2000
Table 8. Comparison of the teaching-learning-based optimization using robust tabu search (TLBO-RTS), RTS-integrated artificial bee colony (ABC) optimization for QAP (ABC-QAP), and HGA on synthetic data.
ProblemBKSTLBO-RTSABC-QAPProposed HGA
APDMin.APDMin.APDMin.
tai40a3,139,3700.440(0)2.30.000(10)4.00.000(10)41.4
tai50a4,938,7960.961(0)4.40.312(0)19.80.241(1)58.5
tai60a7,205,9621.098(0)7.60.449(0)34.0* 0.335(0)71.8
tai80a13,499,1841.124(0)18.80.817(0)83.5* 0.603(0)52.9
tai100a21,052,4661.091(0)36.10.614(0)173.00.573(0)47.6
tai50b458,821,5170.000(10)4.20.000(10)1.60.000(10)0.8
tai60b608,215,0540.000(10)7.20.000(10)0.70.000(10)0.8
tai80b818,415,0430.005(0)17.50.000(10)8.00.000(10)10.4
tai100b1,185,996,1370.027(2)35.70.000(10)164.70.024(8)18.4
sko7248,4980.024(0)13.20.000(10)7.00.000(10)3.3
sko8166,256--0.000(10)15.20.000(10)15.5
sko9090,9980.049(0)25.20.000(10)14.70.000(10)12.9
sko100a115,5340.064(0)35.70.008(0)170.6* 0.003(8)28.1
sko100b152,0020.005(0)35.70.000(10)127.80.000(10)38.6
sko100c147,8620.019(0)35.70.000(10)48.30.000(7)41.7
sko100d149,5760.031(0)35.70.000(10)45.90.000(10)28.4
sko100e149,1500.023(0)35.70.000(10)42.00.000(10)23.1
sko100f149,0360.047(0)35.70.000(10)28.30.002(7)22.0
wil100273,0380.010(0)36.10.000(10)10.40.001(6)31.5
Average 0.27923.50.11652.60.09428.8
Column “APD” stands for the average percentage deviation from the best-found solution from all trials, and column “Min.” average time to reach the found fitness values in minutes. “*” means the HGA result is statistically significant with significance level of 0.01 compared to ABC-QAP.
Table 9. Parameters used generate synthetic data.
ParametersRange
Lift1 to 1.4 or 0
Relative profit1 to 4
Relative frequency1 to 4
Table 10. Synthetic databases (boldfaced) and the layout of sites.
DB1DB2DB3DB4
Number of items50100150225
Layout of sites 10 × 5 10 × 10 10 × 15 15 × 15
Table 11. Comparison of three assignments considering different factors: (A) lifts; (B) lifts and relative profits; and (C) lifts, relative profits, and relative frequencies.
DB(A)(B)(C)(C)/(A)(C)/(B)
DB11328.21856.82256.21.701.22
DB22767.84035.64967.81.791.23
DB34146.86204.47812.41.881.26
DB46253.89571.412,121.01.941.27
Table 12. Computational results of the proposed HGA integrating different crossover operators.
InstancePOSUXRPMX
FitnessMin.FitnessMin.FitnessMin.
DB12305.668.32303.253.6* 2306.016.2
DB25033.029.65029.457.0* 5105.849.7
DB37891.038.87894.661.8* 8040.469.8
DB412,228.852.612,226.854.5* 12,464.878.7
“Fitness” and “Min.” represent averaged fitness and average time to reach the found fitness values in minutes, respectively. “*” means that rectangular partially matched crossover (RPMX) is statistically significant with significance level of 0.01 in comparison with other crossover methods by two-way ANOVA for each instance.
Table 13. Comparison of the TLBO-RTS, ABC-QAP, and HGA on synthetic data.
InstanceBFSTLBO-RTSABC-QAPProposed HGA
FitnessAPDMin.FitnessAPDMin.FitnessAPDMin.
DB123062281.61.0584.52295.80.44245.3* 2306.00.00016.2
DB251625027.02.61529.65037.82.40655.9* 5105.81.08949.7
DB380867898.82.31529.07925.21.98976.5* 8040.40.56469.8
DB412,55412,301.62.01139.312,310.01.94457.5* 12,464.80.71178.7
Column “APD” stands for the average percentage deviation from the best-found solution from all trials. Columns “fitness” and “min.” represent averaged fitness and average time to reach the found fitness values in minutes, respectively. “*” means that rectangular partially matched crossover (RPMX) is statistically significant with significance level of 0.01 in comparison with ABC-QAP by paired t test for each instance.
Publisher’s Note: MDPI stays neutral with regard to jurisdictional claims in published maps and institutional affiliations.

