Article

Test-Retest and Minimal Detectable Change in the Assessment of Muscle Strength and Muscle Power in Upper and Lower Extremity Exercises in 9- to 14-Year-Old Children

by
Mario A. Horta-Gim
1,
Ena Monserrat Romero-Pérez
1,*,
Carlos Medina-Pérez
2,*,
José Manuel Tánori-Tapia
1,
Gabriel Núñez-Othón
1,
André Novo
3,4 and
José Antonio de Paz
1,5
1
Division of Biological Sciences and Health, University of Sonora, Hermosillo 83000, Mexico
2
Faculty of Health Sciences, University Isabel I, 09003 Burgos, Spain
3
Polytechnic Institute of Bragança, 5300-253 Bragança, Portugal
4
Center for Health Technology and Services Research (CINTESIS), University of Porto, 4200-319 Porto, Portugal
5
Institute of Biomedicine (IBIOMED), University of León, 24071 León, Spain
*
Authors to whom correspondence should be addressed.
Appl. Sci. 2021, 11(5), 2204; https://doi.org/10.3390/app11052204
Submission received: 19 January 2021 / Revised: 19 February 2021 / Accepted: 24 February 2021 / Published: 3 March 2021
(This article belongs to the Special Issue Biomedical Factors for Lower Extremity's Function)

Abstract

:
The prescription of maximal dynamic strength training in both adults and children is based on the evaluation of maximum strength, usually by one-repetition maximum tests (1RM). This study examined the test-retest reliability and the minimal detectable change (MDC) of the maximal force test and muscle power test. Forty-eight children (9–14 years old) completed two test–retest sessions that involved a one-repetition maximum (1RM) test and a muscle power test for leg extension (LE) and seated bench press (SBP). The MDC values of the 1RM test in the LE and SBP tests ranged from 7.35 to 11.34 kg and 6.84 to 7.92 kg, respectively. The MDC values of the muscle power test in the LE and SBP ranged from 30.32 to 63.20 Watt and 22.65 to 29.53 Watt, respectively. In children 9 to 14 years old, the increase of maximum strength along the growth curve was different in each muscle group studied. The repeatability of the 1RM test of the SBP was excellent (ICC 0.974) and was better than that of the LE (ICC, 0.954). The MDC of the 1RM test evaluation was 19.56% in the LE and 12.93% in the SBP.

1. Introduction

Muscle performance is a good indicator of overall health in adolescents and children [1]. High muscle fitness has been linked to a healthier cardiovascular profile, whereas low rates of fitness are associated with a worse metabolic profile [2,3]. The capacity of children to improve their muscular strength has been discussed [4], but current research reports that adolescents and children can benefit from regular resistance exercise [5,6,7,8]. As a result, the American Academy of Pediatrics supports their enrollment in suitably designed and supervised resistance training programs [9]. Thus, the value of assessment of muscle performance with valid and reliable methods has been increasingly recognized in sport, clinical, and health contexts [10].
Maximal dynamic strength is defined as the highest load that a person is able to lift once (one-repetition maximum; 1RM) [11]. Previous studies do not recommend 1RM testing in skeletally immature individuals [12]; however, 1RM testing is safe in children and adolescents when conducted by a qualified professional, (e.g., strength specialists, pediatric researchers or professionals certified by National Strength and Conditioning Association (NSCA), or similar institutions) [13,14,15,16]. Moreover, the American College of Sports Medicine’s official position statement regarding resistance training in healthy people recommends that the individual training load should be based on 1RM testing and that this criterion also should be applied to prescription resistance training in children and adolescents [9,17,18].
Muscle power can be defined as the product of load lifted and the distance that the load was lifted, divided by the time spent in that displacement, i.e., p o w e r = load   ×   mobilized   distance time   spent   moving   the   load [19]. Maximum muscle power output is the highest power value attained by overcoming successive resistances to different percentages of 1RM. These outcomes and other manifestations of strength, such as impulse and rate of force development (RFD) and impulse, are decisive in sport physical performance (e.g., running, jumping, balance, or agility) and in daily activities, and these are related with minor risk of injury to joints, bones, and muscles [20,21,22,23]. Muscle power is usually assessed in adolescents and children using field tests (e.g., ball throwing, vertical jump, or standing long jump) [24,25,26] or isokinetic devices [27,28]. However, a few studies have determined muscle power in children and adolescents relative to 1RM across a range of submaximal loads using a linear position transducer [15,29,30].
In any test, it is important to know the degree of validity, specificity, and repeatability of the method of assessment. Repeatability of measurements refers to the range variation in repeat measurements made on the same subject under identical conditions (i.e., same subject, same evaluator, and similar conditions) and reflects the stability of the results obtained in successive evaluations [30,31]. In most studies, repeatability of measurements is typically analyzed using the intraclass correlation coefficient (ICC) and the coefficient of variation (CV). Knowing the repeatability of any strength or muscle power test is important for coaches, doctors, physiotherapists, patients, parents, athletes and scientists for two reasons [30]: Firstly, it provides a greater degree of confidence in the conclusions drawn from the data analysis; secondly, if the standard error of measurement (SEM) of the method is known, the real magnitude of changes observed in the measure can be estimated [29], that is, the smallest detectable difference, denoted by minimal detectable change (MDC). A recent systematic review on test-retest reliability of 1RM analyzed 32 studies published on the subject, of which 14 were of young people; however, in none of the 14 studies was the age of the study subjects less than 16 years of age [32]. Even fewer publications have looked at the repeatability of assessment of muscle power. Moreover, to determine whether an improvement is real, it is necessary to know the minimum change values that can be detected by the instrument used. If the difference between the evaluations is greater than the MDC value of the employed measurement method, one can be sure, with a high degree of certainty, that the variation observed is not due to a limitation or random error of the method used for measurement [33]. However, there is a lack of data regarding the repeatability of these measurements (i.e., dynamic maximal strength and muscle power) in adolescents and children. Only few studies have reported data for maximal dynamic strength (1RM) and maximum power within this population [14,29,30,34,35].
The aim of our research was therefore to determine the test-retest and the minimum level of detectable change of the 1RM maximal strength test and muscle power test in upper and lower limbs in 9- to 14-year-old children.

2. Materials and Methods

2.1. Study Design and Participants

2.1.1. Design

A cross-sectional observational study of repeated measurements was conducted. The retest was conducted 48 h after the first test and was done blindly (i.e., without access to the value of the first measurement).

2.1.2. Ethical Approval

The study was approved by the Research Ethics Committee of the University of Sonora (Mexico) (No. CEI-UNISON 013/2020, date of final approval: 9 September 2020). Written parental permission and verbal consent to participate in the study was received from both the parents and participants, respectively.

2.1.3. Participants

Forty-eight children aged 9 to 14 years (24 boys and 24 girls) participated in the study. All participants were recruited from a private school at Hermosillo (Mexico). The participant inclusion criteria were age range between 9 to 14 years, no physical impairments preventing them from performing the tests and no previous experience with resistance or muscle power training. Exclusion criteria included lack of attendance at all assessment sessions. Before the first test was performed, all the school children who agreed to participate were divided into three age groups (G9–10 years, n = 16; G11–12 years; n = 16; and G13–14 years, n = 16) and within each age group were divided by sex (male/female). A number was assigned to each child. To allocate participants to the sample, 4 numbers were randomly chosen from each age and sex (i.e., 4 males 9 years old; 4 females 9 years old, etc.).

2.2. Measurements and Methods

Eight days before the data collection, all participants attended an introductory session to familiarize them with the equipment and testing procedures. They were instructed on acceptable technique for the exercise with submaximal loads in both tests.
The sample size was calculated using G*Power 3.1.9.7 (Düsseldorf, Germany) [32], using a t-test for difference between two dependent means, with an effect size of 0.5, alpha value of 0.05, and a statistical power of 0.95, for a sample size of 48 subjects.

2.2.1. One-Repetition Maximum Testing

Based on previous studies carried out in children, we applied the 1RM test on the participants [14,18]. It was performed on a multi gym machine (BH® Fitness Nevada Pro-T machine, Madrid, Spain) with an angle of 100° between the plane of the seat and the back. Before all testing procedures, participants performed a general warm-up (10 repetitions at 40% of their body weight). If this weight was lifted with the acceptable form, each participant performed a new set in which the load was increased by approximately 5 to 20 kg. In each set, the subject attempted two repetitions with the selected weight. If successful, the testing continued until a 1RM lift was determined. The 1RM was determined across three to six sets, excluding warm-up. All increases in weight were dependent upon the rating of perceived exertion in each attempt, which was assessed by OMNI-Resistance Exercise Scale (OMNI-RES) scale [36]. Rest periods between each attempt were set around 3 min between attempts. For the 1RM test of leg extension (LE), participants were seated with a knee flexion of 90° and prior to the test, the center of rotation of knee joint and lever arm of knee extension machine were aligned and tibia pad was individually set proximal to the medial malleolus on the leg for each participant. The range of motion of the knee joint began at 90° and ended around 180°. After 10 min of rest, the 1RM seated bench press (SBP) test was performed with the same protocol and material as described above. In this exercise, the participant was seated with arms in abduction at 90° and with elbows bent at 90°. The range of motion of the elbow joint began at 90° degrees and ended around 180°.

2.2.2. Muscle Power Testing

Muscle power tests were performed on the same machine as 1RM test (previously described) and 45 min after cited test. Mean power of concentric knee extension action (load × displacement/time) was measured across a range of six relative loads, (i.e., 30, 40, 50, 60, 70, and 80%), of the 1RM based on previous research [37]. In this test, each participant performed one set of three full range-of-motion knee extension actions with each load. Between each repetition, there was a complete pause and between sets each participant rested for 3 min. Each participant was instructed to push the load “as fast as possible” during the concentric phase. Muscle power was calculated from electronic measures of force, displacement, and duration using a linear encoder (T-Force System, Ergotech, Murcia, Spain, sample rate 1000 Hz) and associated software (v.2.3). The device was attached to the weight stack and measured vertical displacement relative to the ground. After 10 min of rest, the muscle power seated bench press (SBP) test was performed with the same protocol and material as described above. In this exercise, the participant was seated with arms in abduction at 90° and with elbows bent at 90°. The range of motion of the elbow joint began at 90° degrees and ended around 180°. From all the muscle power data, only the muscle power value reached at 60% of 1RM was considered for data analysis since the maximum power was manifested around this load.
The protocol of determination 1RM and muscle power test are represented in Figure 1.

2.3. Statistical Analysis

Data are presented as the means ± standard deviations (SD) and ranges. The data normality was assessed using the Shapiro–Wilk test. Differences between test and retests were analyzed by paired t-test; the comparison of the values of 1RM and power between age groups were performed by one-way ANOVA, the effect size (f) was performed with G*Power 3.1.9.7 (Düsseldorf, Germany) [32], by F-Test for ANOVA Fixed Effects one-way, and post hoc tests with Bonferroni correction. The comparison of the average of the power values expressed at the different percentages of 1RM, both for the LE and the SBP was performed by the repeated measures analysis of variance and the effects size were also reported as partial eta squared (η2).
To determine the confidence limits as measures of absolute reliability, the mean coefficient of variation (CV) from individual test-retest CVs was used, and the Bland–Altman method was used for visual evaluation of the reliability of measurements and agreement limit [34]. Repeatability is the closeness of the agreement between successive readings obtained by the same method for the same material and under the same conditions (same operator, same apparatus, same setting, and same time). The most commonly used method for the study of measurement repeatability is the intraclass correlation coefficient (ICC) [18]. This was calculated by determining the intraclass correlation coefficient (ICC) estimates and their 95% confident intervals based on two-way random effects, absolute agreement, and single-rater measurement (ICC2,1) [35]. In addition, Rosner’s proposal [38] is usually used to make a qualitative interpretation of the ICC result; thus, ICC < 0.4 indicates poor reliability, 0.4 ≤ ICC ≤ 0.75 indicates fair to good reliability, and ICC ≥ 0.76 indicates excellent reliability. The absolute reliability was evaluated using the standard error of measurement (SEM). The minimal detectable change (MDC95) was calculated both absolutely and as a percentage. The statistical significance level was set at 5%. All data were analyzed using SPSS statistical package version 25 (SPSS Inc., Chicago, IL, USA).

3. Results

General characteristics of the participants, age, weight, and size are shown in Table 1.
Figure 2 presents relative values of LE and SBP maximal dynamic strength (1RM). There were significant differences between the groups in the knee extensors’ maximal strength (F = 20.085; p < 0.001; f = 0.741). The G13–14 has a higher LE 1RM than G11–12, (p < 0.001) and G9–10, (p < 0.001), and G11–12 greater than G9–10 (p < 0.001). There are also significant differences between groups in SBP 1RM (F = 8.509; p < 0.001; f = 0.519). G13–14 has a higher LE 1RM than G11–12, (p < 0.001) and G9–10, (p < 0.001).
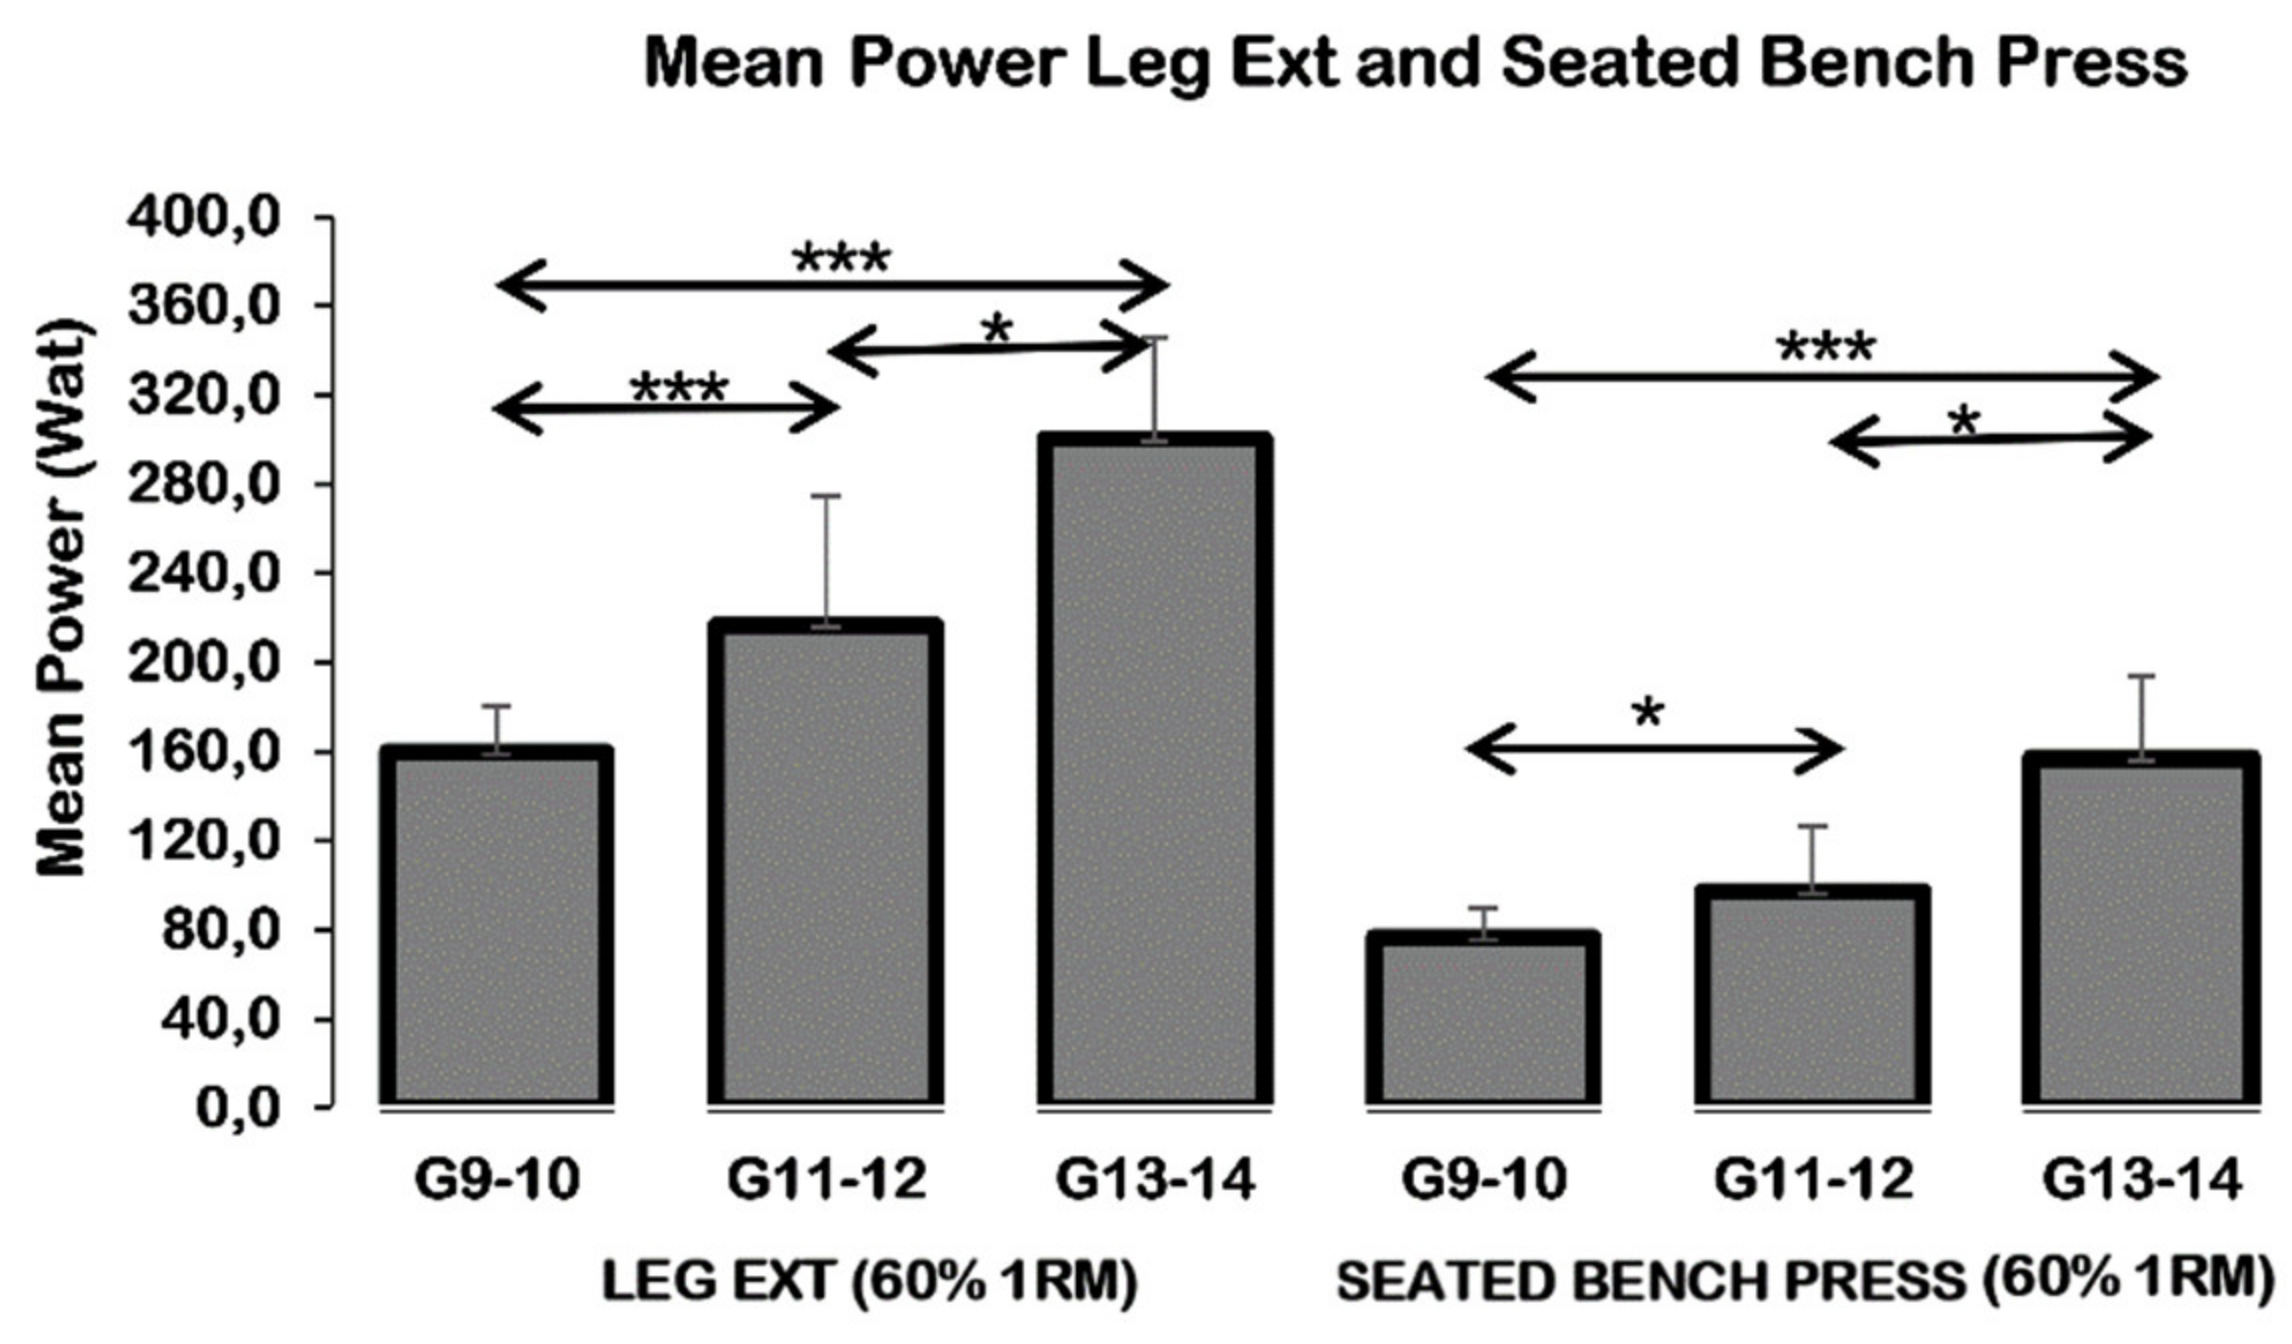
Figure 3 shows power values at 60% of the LE and SBP 1RM. Significant differences between groups were found in SPB power (F = 20.408; p < 0.001; f = 0.682). G13–14 has a higher LE 1RM than G11–12, (p = 0.003) and G9–10, (p < 0.001), and G11–12 greater than G9–10 (p = 0.019). There are also significant differences between groups in LE power (F = 20.085; p < 0.001; f = 0.679). G13–14 has a higher LE 1RM than G11–12, (p = < 0.05) and G9–10, (p < 0.001), and G11–12 greater than G9–10 (p < 0.001).
Reliability values of the 1RM test-retest in LE exercise by age group and gender are shown in Table 2.
Repeatability values of 1RM LE were good regardless of when they were studied by age (ICC ranged from 0.876 to 0.951; SEM% ranged from 4.52 to 6.64) or gender (ICC ranged from 0.977 to 0.958; SEM% ranged from 5.38 to 6.52). Furthermore, the 1RM test-retest in LE exercise in total sample demonstrated excellent reliability (ICC = 0.954; SEM% = 7.06). The minimum magnitude of change that would be detectable in the LE exercise was 7.35 to 11.34 kg, or 12.52% and to 18.40% between successive measures and girls showed lower value than boys (MDC% = 14.90; MDC% = 18.07, respectively).
Reliability values of the 1RM test-retest in SBP exercise by age group and gender are shown in Table 3.
Repeatability values of 1RM BPS were excellent in each age group (ICC ranged from 0.918 to 0.985; SEM% ranged from 3.30 to 5.01), in girls and boys (ICC = 0.929, ICC = 0.981, respectively; SEM% = 4.92, SEM% = 3.89, respectively) and in total sample (ICC = 0.974, SEM% = 4.67). In addition, the MDC% was different in each age group ranging from 9.15 to 13.87 and boys showed a lower value than girls (MDC% = 10.79).
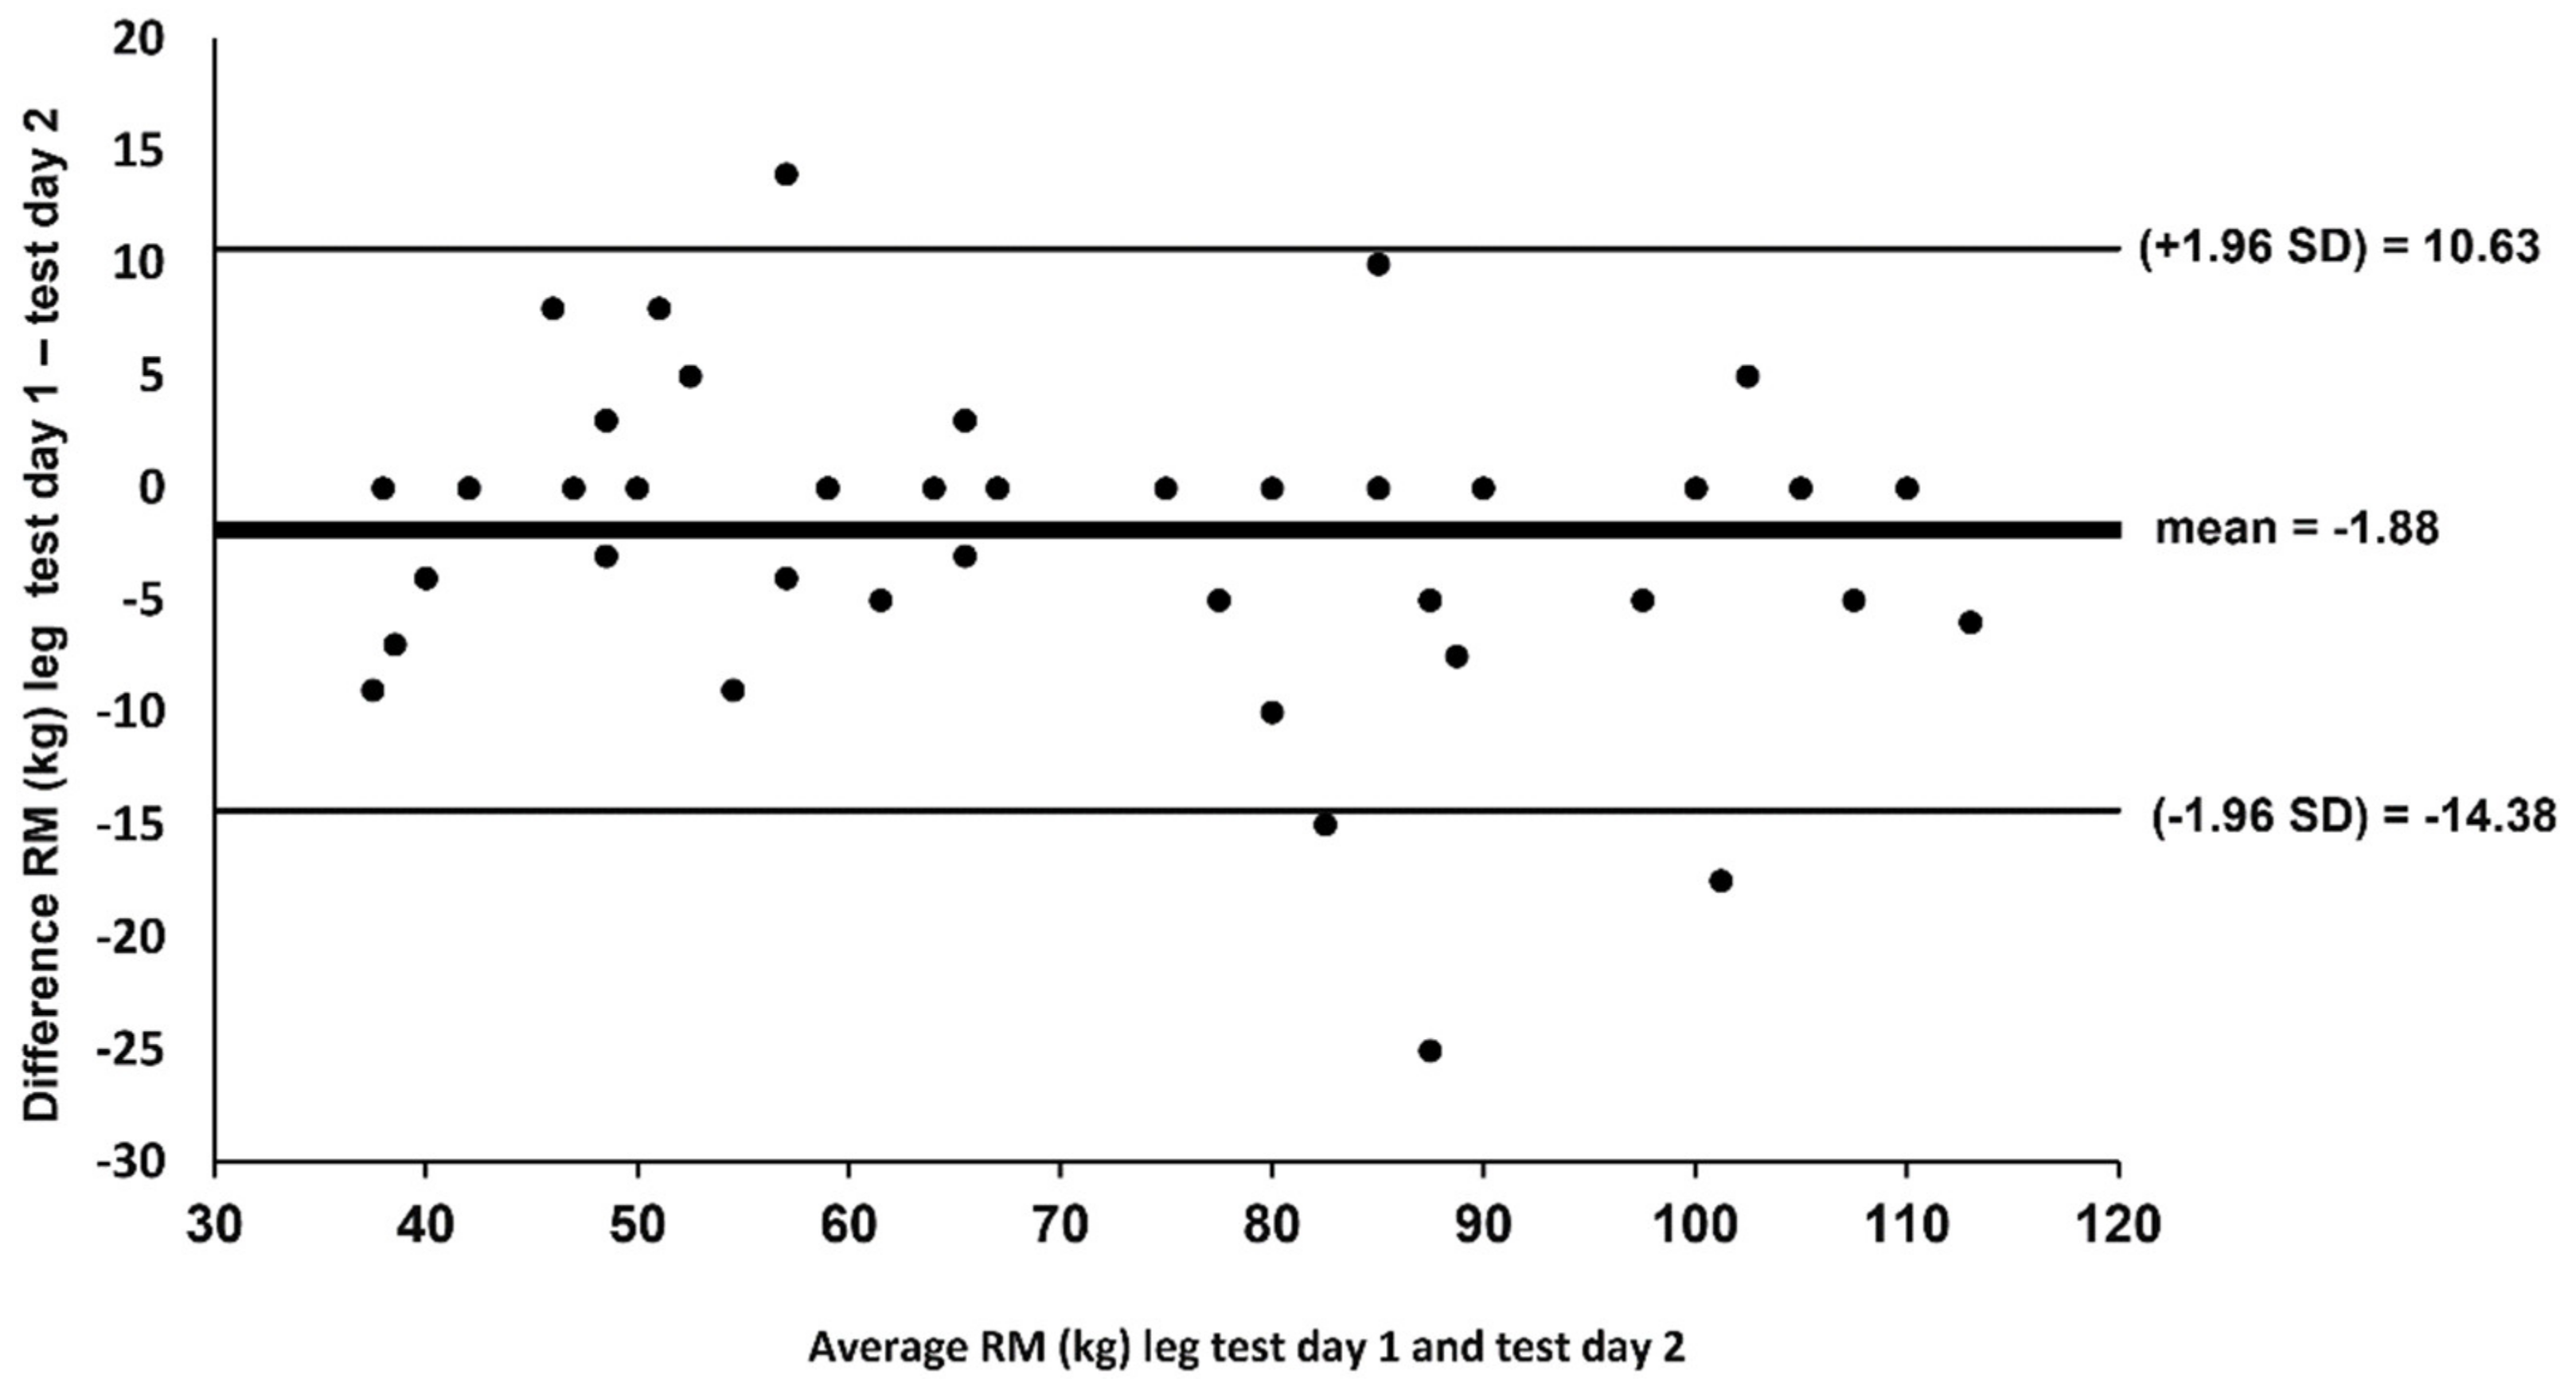
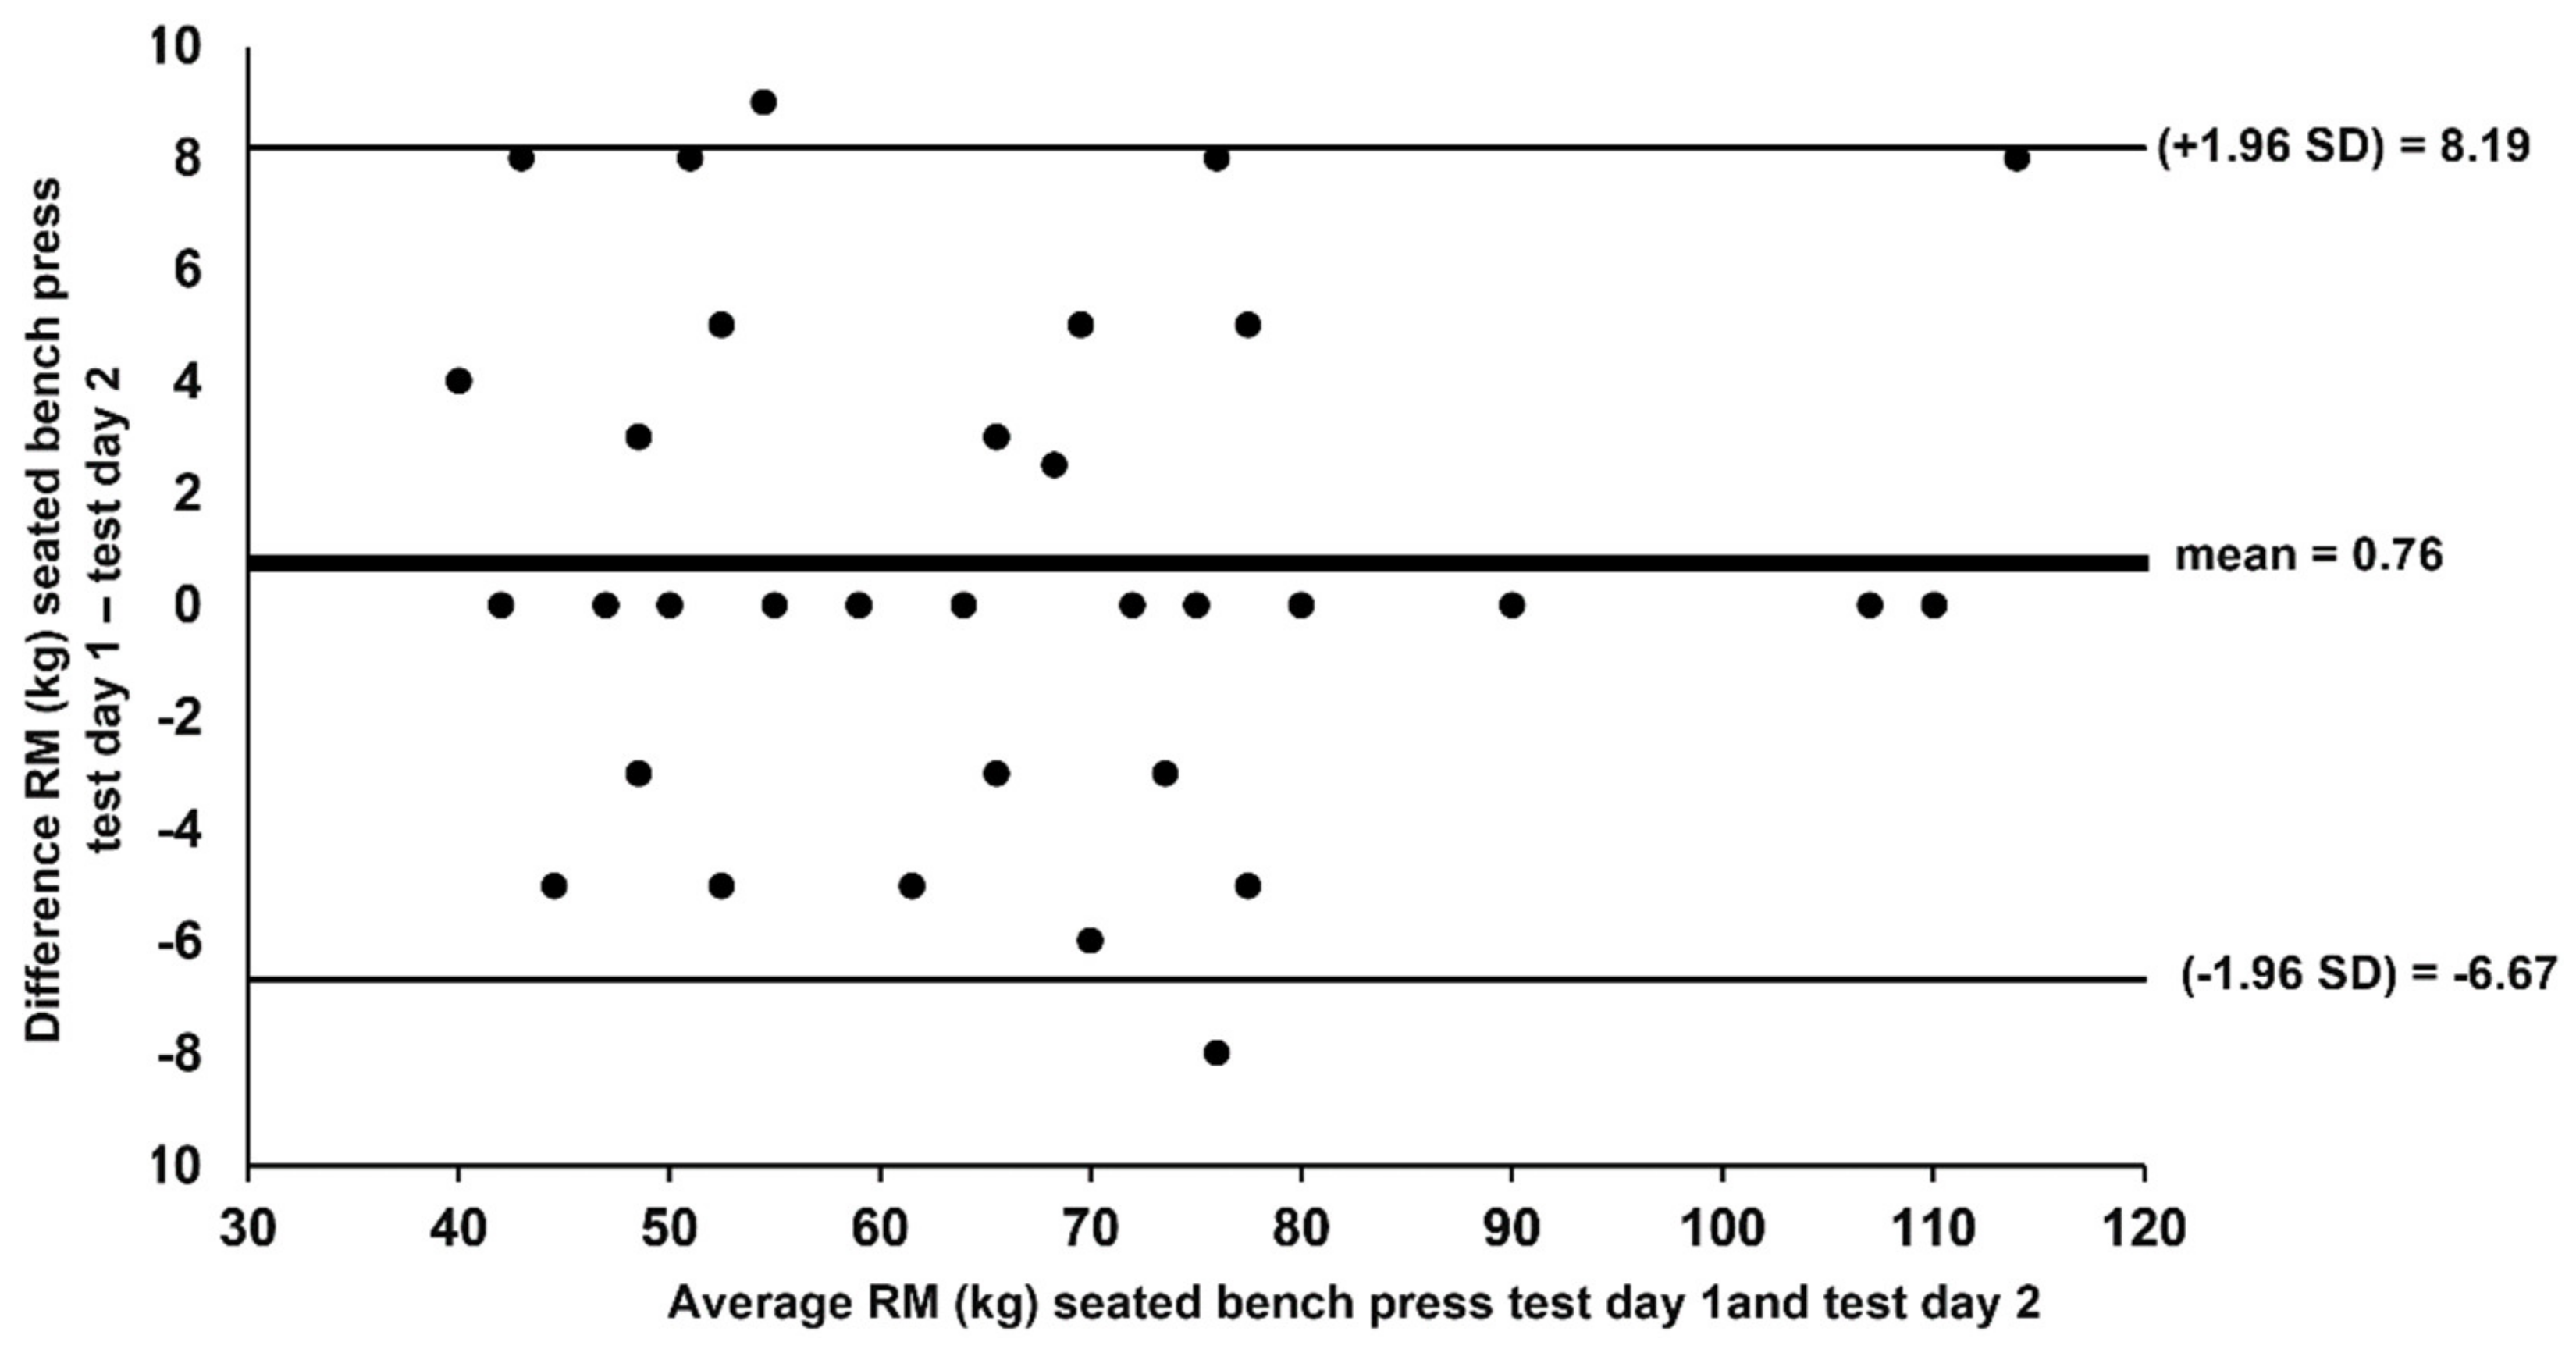
The limits of agreement between the values of the entire sample, estimated from the two test sessions (test-retest) are graphically depicted in the Bland–Altman plot in Figure 4 (LE exercise) and Figure 5 (SBP).
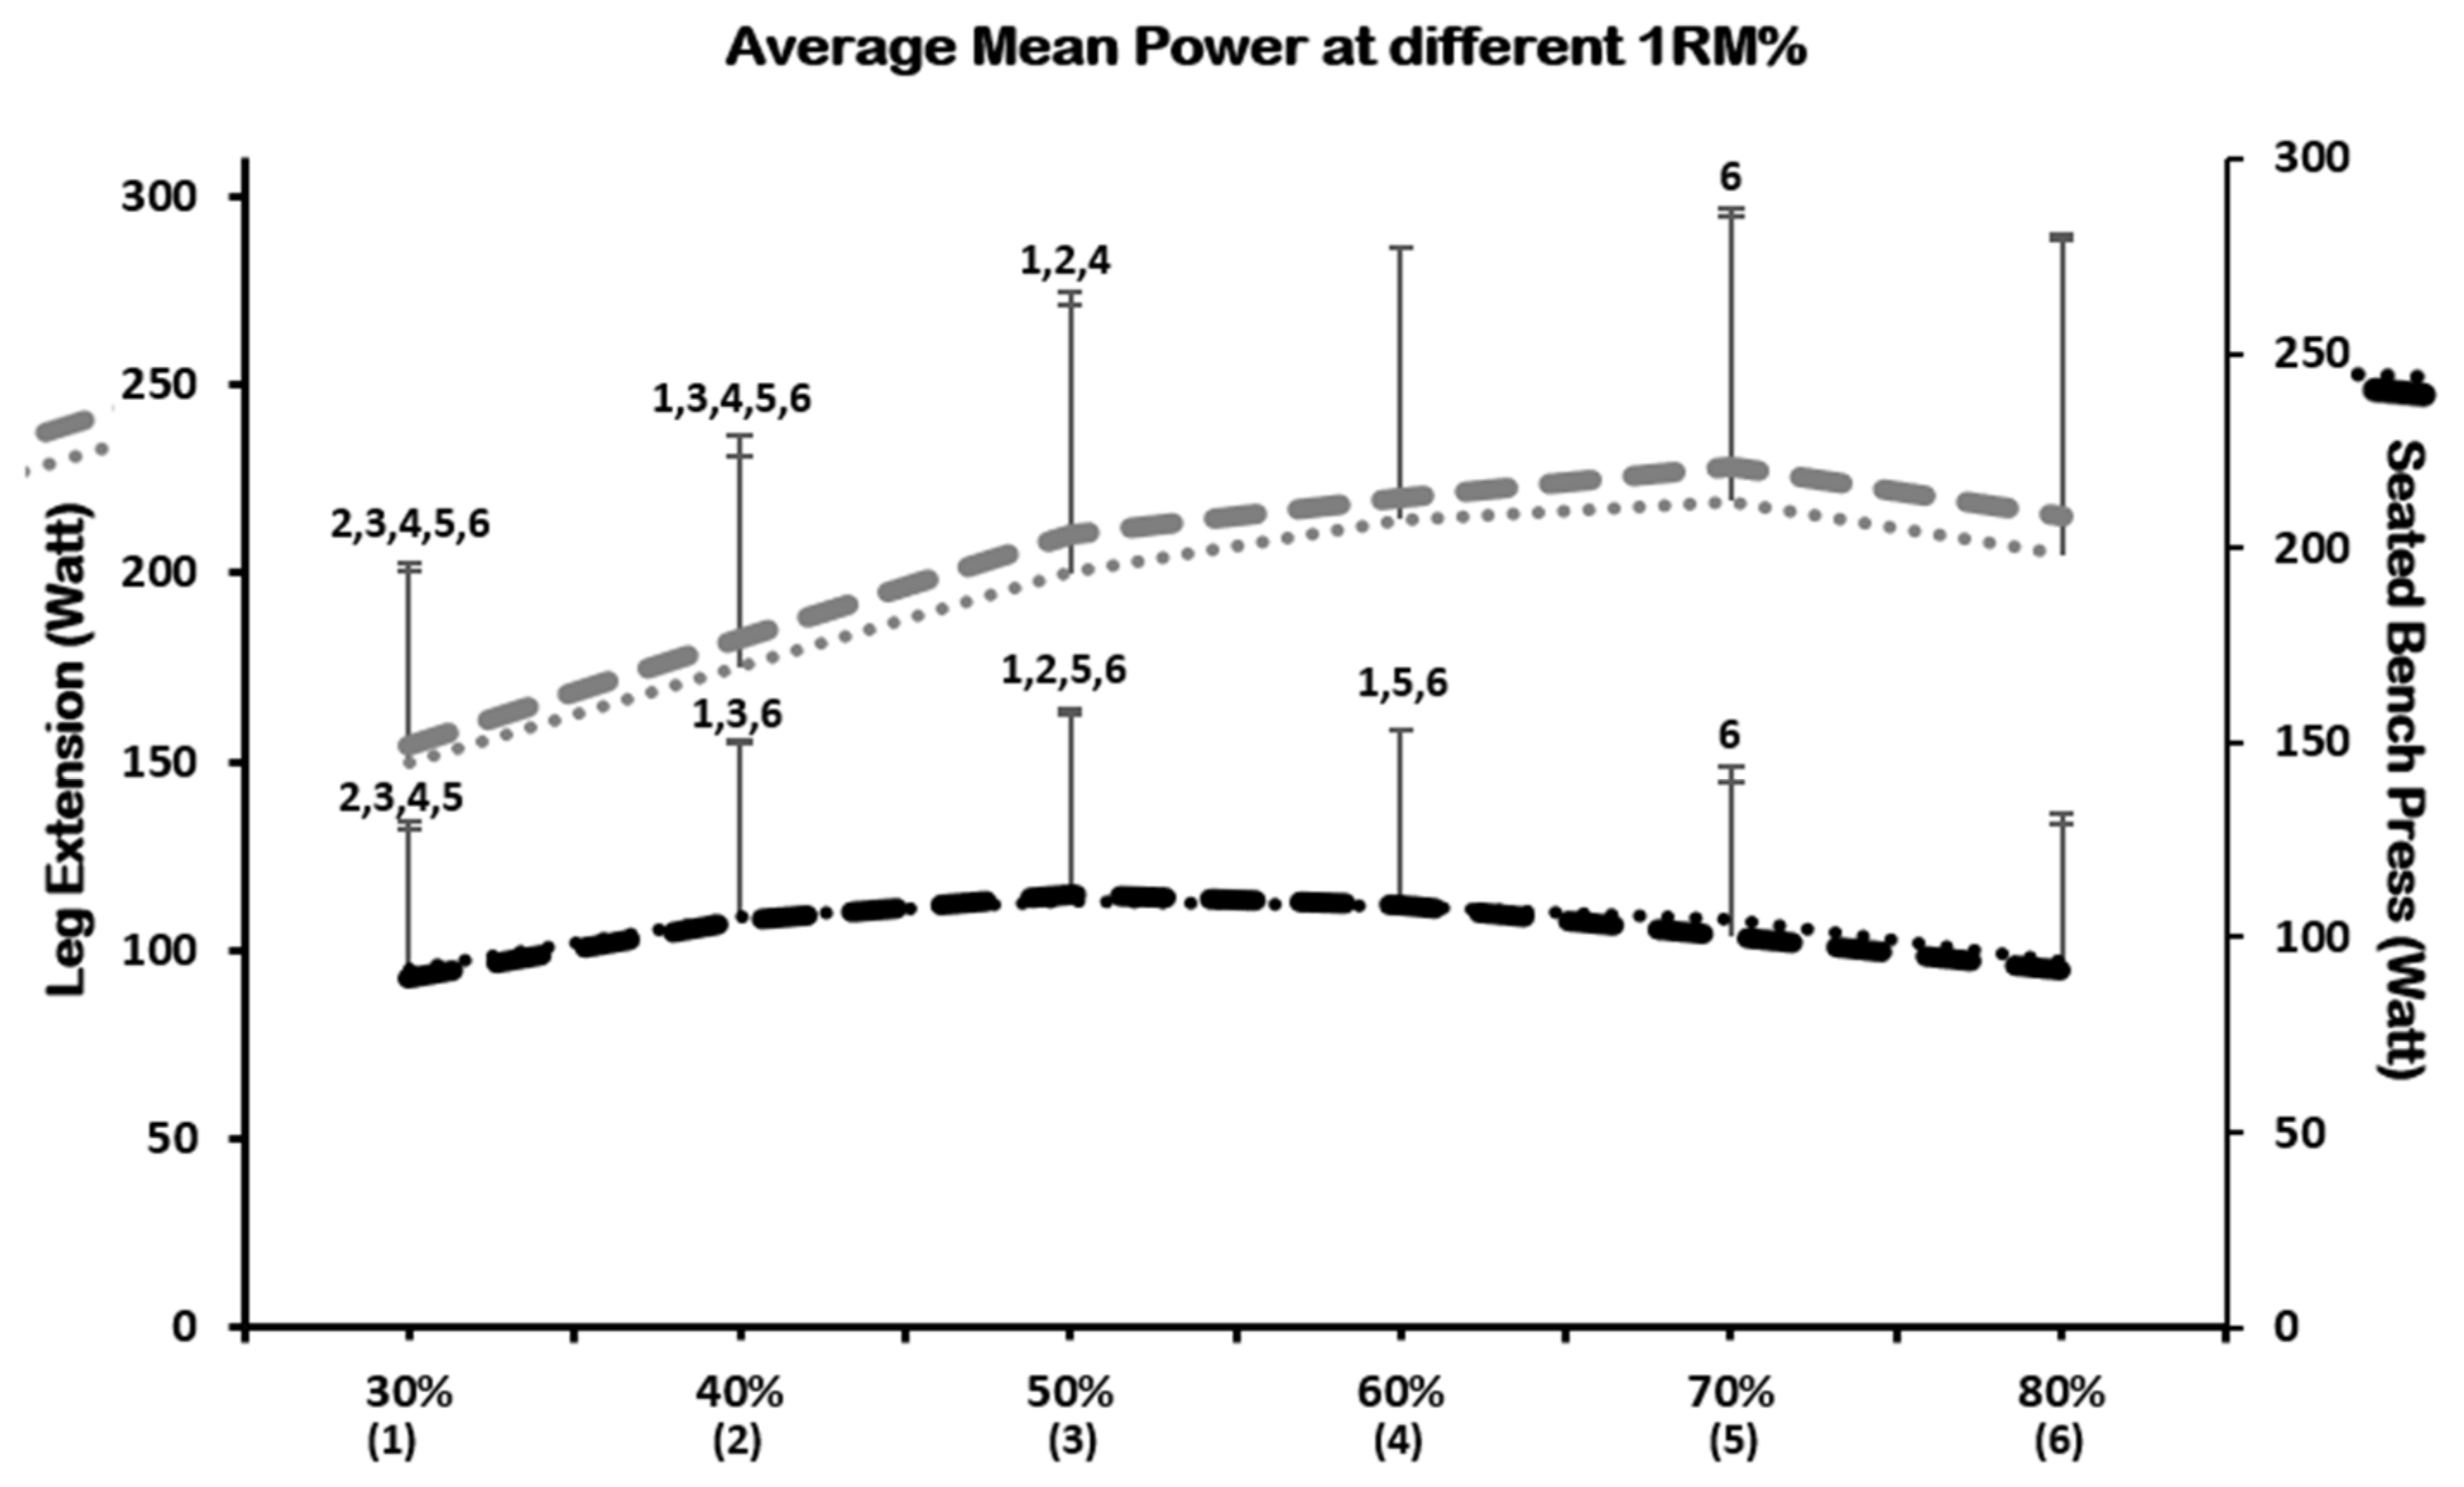
For muscle power data analysis, the percentage of 1RM at which participants reached the highest value of muscle power was determined. This percentage was set at 70% of 1RM in LE and at 50% of 1RM in SBP. When comparing the powers to the different loads, it was observed that in LE, there were differences between the different load percentages, (F = 64.601; p < 0.001; η2 = 0.5799), but there was no difference between the power value at 70% of 1RM and at 60% of 1RM (p = 1, IC95% [−14.671, 12.109]). There were also differences between the powers expressed in SBP at different percentages of 1RM (F = 21.735; p < 0.001; η2 = 0.326), but there was no difference between the power value manifested at 50% of 1RM and 60% of 1RM (p = 1, IC95% [−6.217, 6.376]). Therefore, LE and SBP power at 60% of 1RM are like LE power at 70% of 1 RM and SBP power at 50% of 1RM.Therefore, power at 60% 1RM was chosen for the MDC analysis in both exercises. Figure 6 shows the evolution of LE and SBP power manifested at different percentages of 1RM.
Muscle power values obtained at 60% of 1RM in the LE and SBP tests are shown in Table 4 and Table 5, respectively.
Repeatability power values in LE exercise were good in each age group (ICC ranged from 0.651 to 0.853; SEM% ranged from 6.05 to 10.52). In contrast, when the values are analyzed by sex, these are excellent in girls and boys (ICC = 0.937, ICC = 0.800, respectively; SEM% = 9.85, SEM% = 11.96, respectively). In addition, the 1RM test-retest in LE exercise in total sample demonstrated excellent reliability (ICC = 0.892; SEM% = 10.91). In cited exercise, the MDC% was different in each age group ranging from 16.76 to 29.17 and girls showed lower value than boys (MDC% = 27.29).
Repeatability of muscle power values in SBP were excellent in G11–12 and G13–14 (ICC = 0.922, ICC = 0.918, respectively; SEM% = 8.48, SEM % = 6.78, respectively). By gender, these values were excellent in girls and boys (ICC = 0.890, ICC = 0.951, respectively; SEM% = 12.72, SEM% = 7.96, respectively). Moreover, the 1RM test–retest in SBP exercise in total sample demonstrated excellent reliability (ICC = 0.935; SEM% = 10.37). Finally, the MDC% was different in each age group ranging from 18.79 to 30.01 and boys showed lower value than girls (MDC% = 22.06).

4. Discussion

This study examined the test-retest and the MDC of the 1RM maximal strength test and muscle power test in upper and lower limbs. Knee extension is involved in most daily activities and in sports, moreover, quadriceps is the strongest and most voluminous extensor muscle of the knee. SBP involves powerful and important muscles for the motor activities of the upper extremities. In addition, the performance of both exercises is easy and safe.
Our data showed that repeatability of 1RM evaluation both in LE and SBP exercises analyzed by test-retest was excellent, ranging from 0.876 to 0.951 for the LE and from 0.918 to 0.985 for the SBP. Studies on the test-retest reliability of 1RM in children under 16 years of age are few. In one such test, Faigenbaum et al. [39] reported an ICC of 0.98 for the LE exercise and an ICC of 0.93 for the bench press exercise in a sample of 24 children of 10 years of age. In a recent systematic review analyzing 32 articles in populations aged 16 to 85 years, the ICC ranged from 0.74 to 0.99, and in the exercise of SBP from 0.96 to 0.99 [32].
The repeatability determined for the current evaluation of the power at 60% of 1RM in the LE exercise ranged from “fair to good reliability” to “excellent reliability” (ICC: 0.651–0.853). This was lower than that shown by the SBP; although qualitatively in the same range, the SBP ICC in two of the groups was higher than 0.910 and was 0.663 only in the youngest group. Studies analyzing the repeatability of muscle power in children are limited and, on most occasions, measure the repeatability of jump ability as an indirect estimate of muscle power, either alone or in the context of other physical tests [40,41]. The study of Meylan et al. [29], which measured power in a leg press exercise with loads at different percentages of the proper body weight in 36 males (11–15 years old), found an ICC between 0.97 and 0.99.
In this field, few studies exist in which the MDC of 1RM test-retest repeatability is made explicit. One studied 21 healthy children aged 5 to 12 years to determine the repeatability of strength and power of knee flexors and knee extensors in an isokinetic device. Although the authors did not present the value of MDC%, using the values provided for the knee extensors, we calculated that the MDC% was 28% for the peak torque and 36.4% for the power, i.e., higher values than those found by our study [27]. The 1RM agreement limits of LE and SBP were uniform, regardless of the children’s maximum strength, and were within a range of 25 kg in LE and 14.9 kg in SBP.
The process of maturation and growth is associated with changes of increasing muscle mass and in muscle morphology and architecture, such as pennation angle [42], and changes mediated by hormonal variations during the maturation and growth period [43]. This is the reason why the repeatability analyses were analyzed by grouping the sample into three different age groups.
The maximum strength of the LE increases over the courses of growth and development, with significant differences (p < 0.001) between all age groups in our sample. However, in the strength of the SBP, the increase only appears in the age near to 14 years old. In general, for the whole population, and particularly the infant population, use of the musculature of the lower extremities is continuous during activities of daily life, including supporting of the corporal weight when walking, transporting a school backpack, jumping, and running. However, the use of the upper extremities is predominantly limited to actions of precision supporting relatively low loads [44,45]. This may be why, as body weight increases, muscle strength increases in the lower extremities and less so in the upper extremities, and it is only when the anabolic hormonal increase occurs around puberty that the increase in strength in the upper extremities becomes more significant [46]. This physiological explanation could not be endorsed with experimental data because we were unable to find sufficient studies of maximum strength using the 1RM test in the same muscle groups that we analyzed; only one study of 45 children aged three to seven years old was identified [15]. However, there were data from a similar study relating growth and handgrip isometric strength, among other tests, based on 597 boys and 601 girls aged 6–15 years [47].
A little studied aspect in children that can be interesting is the evolution of the power manifested when mobilizing different load percentages. In LE, the power is greater around 70% of 1RM, but not significantly greater than reached at 60% of 1RM, so if this behavior is confirmed in other studies, it could be affirmed that to exercise with knee extensors near to the maximum power, the chosen load would be between 60% to 70% of 1RM. The evolution of the power in relation to the load in the SBP is different, because although the maximum power is manifested around 50% of 1RM, it is not significantly different from that manifested at 40, 50 or 70% of 1RM, so if it were confirmed by other studies, to work out in SBP exercise close to the maximum power, the load should be between 40% and 70% of 1RM.
With this study, in addition to analyzing the repeatability and the MDC of the evaluation of muscle strength and mean muscle power in children before adolescence, we intended to underline the study’s practical importance for professionals who conduct strength training in children. With some frequency in clinical studies, the goodness of interventions is established solely on the basis of the presence or absence of statistically significant changes, without taking into account in the interpretation whether the change observed represents a minimally clinical important change for the patient’s situation, and without assessing whether the magnitude of the changes detected is greater than the random variation subject to the method used, i.e., the MDC. It is easier and more objective to determine the MDC than the minimally clinical important change. Therefore, to improve the effectiveness of rehabilitation and physical training interventions it is important, at least, to know the MDC used and to use it for the weighting of outcome measures. Keeping the MDC in mind is important for physiotherapists, coaches or sport scientists to determine the efficacy of muscle rehabilitation or strength training programs in children [48].
This study had some limitations. The most important is that it was limited to the assessment of two muscle groups, even though these groups are likely the most important for activities of daily life. Another limitation, unrelated to the study, is that there have been very few studies that analyzed test-retest of maximal dynamic strength in children before adolescence and even fewer that analyzed it with respect to muscle power. A third limitation of this research is that the stage of sexual maturation of the participants has not been assessed. Finally, the sample size was determined to establish the test-retest and the MDC of a global sample of 9- to 14-year-olds; the statistical power for the results for each of the age groups is limited by the size of the subsamples. It is necessary to encourage researchers to conduct and publish research on these measurements in children before adolescence.

5. Conclusions

In children from 9 to 14 years of age, the maximal dynamic strength value is different depending on muscle groups, increasing over the course of growth and maturation more gradually in the legs than in the upper body, in which it increases more abruptly near adolescence. The repeatability of the 1RM test of LE and SBP exercises was excellent in all groups of this age range. Despite the good repeatability, it should be kept in mind that the MDC of the 1RM test evaluation was relatively large—between 12 and 18% in the LE and between 9 and 13% in the SPB—regardless of the child’s strength level.

Supplementary Materials

The following are available online at https://www.mdpi.com/2076-3417/11/5/2204/s1. Table S1: Complete analysis of ANOVA between power loads in the LE and SBP exercises.

Author Contributions

Conceptualization: M.A.H.-G. and C.M.-P.; methodology, E.M.R.-P., C.M.-P. and J.A.d.P.; formal analysis, C.M.-P., A.N., and J.A.d.P.; data collection, M.A.H.-G. and G.N.-O.; data curation, M.A.H.-G.; J.M.T.-T. and G.N.-O.; supervision, E.M.R.-P. and J.A.d.P.; writing draft preparation, M.A.H.-G., C.M.-P. and A.N.; writing—review and editing, E.M.R.-P. and J.A.d.P. All authors have read and agreed to the published version of the manuscript.

Funding

This research received no external funding.

Institutional Review Board Statement

The study was conducted according to the guidelines of the Declaration of Helsinki and approved by the Institutional Review Board (or Ethics Committee) of University of Sonora (CEI-UNISON 013/2020, 9 September 2020).

Informed Consent Statement

Informed consent was obtained from all subjects involved in the study.

Data Availability Statement

Data will be available by request to the corresponding authors.

Conflicts of Interest

The authors declare no conflict of interest.

References

  1. García-Hermoso, A.; Ramírez-Campillo, R.; Izquierdo, M. Is Muscular Fitness Associated with Future Health Benefits in Children and Adolescents? A Systematic Review and Meta-Analysis of Longitudinal Studies. Sport. Med. 2019, 49, 1079–1094. [Google Scholar] [CrossRef] [PubMed]
  2. Artero, E.G.; Ruiz, J.R.; Ortega, F.B.; España-Romero, V.; Vicente-Rodríguez, G.; Molnar, D.; Gottrand, F.; González-Gross, M.; Breidenassel, C.; Moreno, L.A.; et al. Muscular and cardiorespiratory fitness are independently associated with metabolic risk in adolescents: The HELENA study. Pediatr. Diabetes 2011, 12, 704–712. [Google Scholar] [CrossRef] [PubMed]
  3. Cohen, D.D.; Gómez-Arbeláez, D.; Camacho, P.A.; Pinzon, S.; Hormiga, C.; Trejos-Suarez, J.; Duperly, J.; Lopez-Jaramillo, P. Low muscle strength is associated with metabolic risk factors in Colombian children: The ACFIES study. PLoS ONE 2014, 9, e93150. [Google Scholar] [CrossRef] [PubMed]
  4. Shaffer, T.E.; Coryllos, E.; Dyment, P.G. Weight training and weight lifting: Information for the pediatrician. Phys. Sportsmed. 1983, 11, 157–161. [Google Scholar] [CrossRef]
  5. Holloway, J.B.; Beuter, A.; Duda, J.L. Self-Efficacy and Training for Strength in Adolescent Girls. J. Appl. Soc. Psychol. 1988, 18, 699–719. [Google Scholar] [CrossRef]
  6. Morris, F.L.; Naughton, G.A.; Gibbs, J.L.; Carlson, J.S.; Wark, J.D. Prospective ten-month exercise intervention in premenarcheal girls: Positive effects on bone and lean mass. J. Bone Miner. Res. 1997, 12, 1453–1462. [Google Scholar] [CrossRef]
  7. Micheli, L.J.; Glassman, R.; Klein, M. The prevention of sports injuries in children. Clin. Sports Med. 2000, 19, 821–834. [Google Scholar] [CrossRef]
  8. Lillegard, W.A.; Brown, E.W.; Wilson, D.J.; Henderson, R.; Lewis, E. Efficacy of strength training in prepubescent to early postpubescent males and females: Effects of gender and maturity. Dev. Neurorehabil. 1997, 1, 147–157. [Google Scholar] [CrossRef]
  9. Stricker, P.R.; Faigenbaum, A.D.; McCambridge, T.M. Resistance Training for Children and Adolescents. Pediatrics 2020, 145, e20201011. [Google Scholar] [CrossRef] [PubMed]
  10. Ortega, F.B.; Cadenas-Sánchez, C.; Sánchez-Delgado, G.; Mora-González, J.; Martínez-Téllez, B.; Artero, E.G.; Castro-Piñero, J.; Labayen, I.; Chillón, P.; Löf, M.; et al. Systematic Review and Proposal of a Field-Based Physical Fitness-Test Battery in Preschool Children: The PREFIT Battery. Sport. Med. 2015, 45, 533–555. [Google Scholar] [CrossRef] [PubMed]
  11. Williams, T.D.; Tolusso, D.V.; Fedewa, M.V.; Esco, M.R. Comparison of Periodized and Non-Periodized Resistance Training on Maximal Strength: A Meta-Analysis. Sport. Med. 2017, 47, 2083–2100. [Google Scholar] [CrossRef] [PubMed]
  12. Washington, R.L.; Bernhardt, D.T.; Gomez, J.; Johnson, M.D.; Martin, T.J.; Rowland, T.W.; Small, E.; LeBlanc, C.; Malina, R.; Krein, C.; et al. Strength training by children and adolescents. Pediatrics 2001, 107, 1470–1472. [Google Scholar]
  13. Castro-Piñero, J.; Ortega, F.B.; Artero, E.G.; Girela-Rejón, M.J.; Mora, J.; Sjöström, M.; Ruiz, J.R. Assessing muscular strength in youth: Usefulness of standing long jump as a general index of muscular fitness. J. Strength Cond. Res. 2010, 24, 1810–1817. [Google Scholar] [CrossRef] [PubMed]
  14. Faigenbaum, A.D.; McFarland, J.E.; Herman, R.E.; Naclerio, F.; Ratamess, N.A.; Kang, J.; Myer, G.D. Reliability of the one-repetition-maximum power clean test in adolescent athletes. J. Strength Cond. Res. 2012, 26, 432–437. [Google Scholar] [CrossRef] [PubMed] [Green Version]
  15. Fry, A.C.; Irwin, C.C.; Nicoll, J.X.; Ferebee, D.E. Muscular strength and power in 3- To 7-year-old children. Pediatr. Exerc. Sci. 2015, 27, 345–354. [Google Scholar] [CrossRef]
  16. Myer, G.D.; Wall, E.J. Resistance Training in the Young Athlete. Oper. Tech. Sports Med. 2006, 14, 218–230. [Google Scholar] [CrossRef]
  17. Lloyd, R.S.; Faigenbaum, A.D.; Stone, M.H.; Oliver, J.L.; Jeffreys, I.; Moody, J.A.; Brewer, C.; Pierce, K.C.; McCambridge, T.M.; Howard, R.; et al. Position statement on youth resistance training: The 2014 International Consensus. Br. J. Sports Med. 2014, 48, 498–505. [Google Scholar] [CrossRef] [PubMed] [Green Version]
  18. Faigenbaum, A.D.; Milliken, L.A.; Westcott, W.L. Maximal Strength Testing in Healthy Children. J. Strength Cond. Res. 2003, 17, 162–166. [Google Scholar] [CrossRef]
  19. Sapega, A.A.; Drillings, G. The definition and assessment of muscular power. J. Orthop. Sports Phys. Ther. 1983, 5, 7–9. [Google Scholar] [CrossRef] [PubMed] [Green Version]
  20. Winter, E.M.; Abt, G.; Brookes, F.B.C.; Challis, J.H.; Fowler, N.E.; Knudson, D.V.; Knuttgen, H.G.; Kraemer, W.J.; Lane, A.M.; Van Mechelen, W.; et al. Misuse of “Power” and Other Mechanical Terms in Sport and Exercise Science Research. J. Strength Cond. Res. 2016, 30, 292–300. [Google Scholar] [CrossRef] [PubMed] [Green Version]
  21. Turner, A.N.; Comfort, P.; McMahon, J.; Bishop, C.; Chavda, S.; Read, P.; Mundy, P.; Lake, J. Developing Powerful Athletes, Part 1. Strength Cond. J. 2020, 42, 30–39. [Google Scholar] [CrossRef]
  22. Faigenbaum, A.D.; Myer, G.D. Resistance training among young athletes: Safety, efficacy and injury prevention effects. Br. J. Sports Med. 2010, 44, 56–63. [Google Scholar] [CrossRef] [Green Version]
  23. Johnson, B.A.; Salzberg, C.L.; Stevenson, D.A. A systematic review: Plyometric training programs for young children. J. Strength Cond. Res. 2011, 25, 2623–2633. [Google Scholar] [CrossRef] [PubMed]
  24. Ortega, F.B.; Artero, E.G.; Ruiz, J.R.; España-Romero, V.; Jiménez-Pavón, D.; Vicente-Rodriguez, G.; Moreno, L.A.; Manios, Y.; Béghin, L.; Ottevaere, C.; et al. Physical fitness levels among European adolescents: The HELENA study. Br. J. Sports Med. 2011, 45, 20–29. [Google Scholar] [CrossRef] [Green Version]
  25. Tomkinson, G.R.; Carver, K.D.; Atkinson, F.; Daniell, N.D.; Lewis, L.K.; Fitzgerald, J.S.; Lang, J.J.; Ortega, F.B. European normative values for physical fitness in children and adolescents aged 9-17 years: Results from 2 779 165 Eurofit performances representing 30 countries. Br. J. Sports Med. 2018, 52, 1445–1456. [Google Scholar] [CrossRef] [Green Version]
  26. Sumnik, Z.; Matyskova, J.; Hlavka, Z.; Durdilova, L.; Soucek, O.; Zemkova, D. Reference data for jumping mechanography in healthy children and adolescents aged 6-18 years. J. Musculoskelet. Neuronal Interact 2013, 13, 297–311. [Google Scholar] [PubMed]
  27. Santos, A.N.; Pavão, S.L.; Avila, M.A.; Salvini, T.F.; Rocha, N.A.C.F. Reliability of isokinetic evaluation in passive mode for knee flexors and extensors in healthy children. Braz. J. Phys. Ther. 2013, 17, 112–120. [Google Scholar] [CrossRef] [PubMed] [Green Version]
  28. Parsons, J.L.; Porter, M.M. Reliability of measuring hip and knee power and movement velocity in active youth. Pediatr. Phys. Ther. 2015, 27, 82–89. [Google Scholar] [CrossRef]
  29. Meylan, C.M.P.; Cronin, J.B.; Oliver, J.L.; Hughes, M.M.G.; Jidovtseff, B.; Pinder, S. The reliability of isoinertial force–velocity–power profiling and maximal strength assessment in youth. Sports Biomech. 2015, 14, 68–80. [Google Scholar] [CrossRef] [PubMed]
  30. Hopkins, W.G. Measures of reliability in sports medicine and science. Sport. Med. 2000, 30, 1–15. [Google Scholar] [CrossRef] [Green Version]
  31. Krabbe, P.F.M. Choice Models. In The Measurement of Health and Health Status; Elsevier: Amsterdam, The Netherlands, 2017; pp. 197–225. [Google Scholar]
  32. Grgic, J.; Lazinica, B.; Schoenfeld, B.J.; Pedisic, Z. Test–Retest Reliability of the One-Repetition Maximum (1RM) Strength Assessment: A Systematic Review. Sport. Med. Open 2020, 6, 31. [Google Scholar] [CrossRef]
  33. Tánori-Tapia, J.M.; Romero-Pérez, E.M.; Camberos, N.A.; Horta-Gim, M.A.; Núñez-Othón, G.; Medina-Pérez, C.; de Paz, J.A. Determination of the Minimum Detectable Change in the Total and Segmental Volumes of the Upper Limb, Evaluated by Perimeter Measurements. Healthcare 2020, 8, 285. [Google Scholar] [CrossRef] [PubMed]
  34. Atkinson, G.; Nevill, A.M. Statistical methods for assessing measurement error (reliability) in variables relevant to sports medicine. Sport. Med. 1998, 26, 217–238. [Google Scholar] [CrossRef]
  35. Koo, T.K.; Li, M.Y. A Guideline of Selecting and Reporting Intraclass Correlation Coefficients for Reliability Research. J. Chiropr. Med. 2016, 15, 155–163. [Google Scholar] [CrossRef] [Green Version]
  36. Robertson, R.J.; Goss, F.L.; Andreacci, J.L.; Dubé, J.J.; Rutkowski, J.J.; Frazee, K.M.; Aaron, D.J.; Metz, K.F.; Kowallis, R.A.; Snee, B.M. Validation of the children’s OMNI-resistance exercise scale of perceived exertion. Med. Sci. Sports Exerc. 2005, 37, 819–826. [Google Scholar] [CrossRef] [PubMed] [Green Version]
  37. Orange, S.T.; Metcalfe, J.W.; Liefeith, A.; Marshall, P.; Madden, L.A.; Fewster, C.R.; Vince, R.V. Validity and Reliability of a Wearable Inertial Sensor to Measure Velocity and Power in the Back Squat and Bench Press. J. Strength Cond. Res. 2018, 33, 2398–2408. [Google Scholar] [CrossRef] [PubMed] [Green Version]
  38. Rosner, B. Statistical methods in ophthalmology: An adjustment for the intraclass correlation between eyes—PubMed. Biometrics 1982, 38, 105–114. [Google Scholar] [CrossRef]
  39. Faigenbaum, A.; Westcott, W.; Long, C.; Loud, R.; Delmonico, M.; Micheli, L. Relationship Between Repetitions and Selected Percentages of the One Repetition Maximum in Healthy Children. Pediatr. Phys. Ther. 1998, 10, 110–113. [Google Scholar] [CrossRef]
  40. Gillen, Z.M.; Miramonti, A.A.; McKay, B.D.; Leutzinger, T.J.; Cramer, J.T. Test-retest reliability and concurrent validity of athletic performance combine tests in 6-15-year-old male athletes. J. Strength Cond. Res. 2018, 32, 2783–2794. [Google Scholar] [CrossRef]
  41. Ayán-Pérez, C.; Cancela-Carral, J.M.; Lago-Ballesteros, J.; Martínez-Lemos, I. Reliability of Sargent Jump Test in 4- to 5-Year-Old Children. Percept. Mot. Skills 2017, 124, 39–57. [Google Scholar] [CrossRef]
  42. Radnor, J.M.; Oliver, J.L.; Waugh, C.M.; Myer, G.D.; Lloyd, R.S. The influence of maturity status on muscle architecture in school-aged boys. Pediatr. Exerc. Sci. 2020, 32, 89–96. [Google Scholar] [CrossRef]
  43. Kraemer, W.J.; Ratamess, N.A.; Hymer, W.C.; Nindl, B.C.; Fragala, M.S. Growth Hormone(s), Testosterone, Insulin-Like Growth Factors, and Cortisol: Roles and Integration for Cellular Development and Growth With Exercise. Front. Endocrinol. 2020, 11. [Google Scholar] [CrossRef] [PubMed]
  44. Kern, D.S.; Semmler, J.G.; Enoka, R.M. Long-term activity in upper- and lower-limb muscles of humans. J. Appl. Physiol. 2001, 91, 2224–2232. [Google Scholar] [CrossRef] [Green Version]
  45. Sinam, V.; Daimei, T.; Singh, I.D.; Devi, D. Comparison of the Upper and Lower Limbs-A Phylogenetic Concept. IOSR J. Dent. Med. Sci. 2015, 14, 14–16. [Google Scholar] [CrossRef]
  46. Ramos, E.; Frontera, W.R.; Llopart, A.; Feliciano, D. Muscle strength and hormonal levels in adolescents: Gender related differences. Int. J. Sports Med. 1998, 19. [Google Scholar] [CrossRef]
  47. Laurson, K.R.; Saint-Maurice, P.F.; Welk, G.J.; Eisenmann, J.C. Reference curves for field tests of musculoskeletal fitness in U.S. children and adolescents: The 2012 nhanes national youth fitness survey. J. Strength Cond. Res. 2017, 31, 2075–2082. [Google Scholar] [CrossRef]
  48. Dyball, K.M.; Taylor, N.F.; Dodd, K.J. Retest reliability of measuring hip extensor muscle strength in different testing positions in young people with cerebral palsy. BMC Pediatr. 2011, 11, 42. [Google Scholar] [CrossRef] [Green Version]
Figure 1. Encoder location and test procedures (1RM (one-repetition maximum test), Muscle Power).
Applsci 11 02204 g001
Figure 2. One-repetition maximum (1RM) test values for LE (leg extension) and SBP (seated bench press) by age group. G9–10 = age group 9–10 years; G11–12 = age group 11–12 years; G13–14 = age group 13–14 years; *** = p < 0.001 difference between marked age group.
Applsci 11 02204 g002
Figure 3. Muscle power test values at 60% of 1RM in LE and SBP by age group. G9–10 = age group 9–10 years; G11–12 = age group 11–12 years; G13–14 = age group 13–14 years. Difference between marked age group: *** p < 0.001, * p < 0.05.
Applsci 11 02204 g003
Figure 4. Bland–Altman chart of differences in 1RM load in LE exercise.
Applsci 11 02204 g004
Figure 5. Bland–Altman chart of differences in 1RM load in SBP exercise.
Applsci 11 02204 g005
Figure 6. Average evolution of the power values obtained with loads at different percentages of 1RM in the LE and SBP exercises. The numbers above the standard deviation bar denote significant difference when comparing with the load cited. (The complete analysis of ANOVA is shown as Supplementary Materials online, Table S1).
Applsci 11 02204 g006
Table 1. Anthropometric characteristics of participants by age group.
Sex
(Female/Male)
Age (Years)Height
(cm)
Weight
(kg)
BMI (kg/m2)
G9–108/89.53 ± 0.51135.41 ± 4.5232.30 ± 5.4317.55 ± 2.51
G11–128/811.50 ± 0.52149.63 ± 7.93 a41.59 ± 10.40 a18.32 ± 2.84
G13–148/813.53 ± 0.52157.20 ± 5.48 abc48.15 ± 9.39 abc19.58 ± 3.78
G9–10 = age group 9–10 years; G11–12 = age group 11–12 years; G13–14 = age group 13–14 years; a = p < 0.05 difference between G9–10 vs. G11–12; b = p < 0.05 difference between G9–10 vs. G13–14; c = p < 0.05 difference between G11–12 vs. G13–14.
Table 2. 1RM values (kg) in LE test.
GroupTestMeanSDt-Test (p)ICC95% CICVSDSEMSEM%MDCMDC %
G9–10Test47.478.800.4650.894(0.736–0.960)0.0370.0532.655.547.3515.37
Retest48.187.69
G11–12Test61.7519.280.8720.951(0.865–0.982)0.0580.0524.096.6411.3418.40
Retest61.5018.28
G13–14Test84.1310.820.044 *0.876(0.674–0.956)0.0280.0383.854.5210.6612.52
Retest86.2011.30
All GirlsTest68.9424.440.031 *0.977(0.947–0.990)0.0370.0503.775.3810.4514.90
Retest71.3425.28
All BoysTest68.0021.020.3260.958(0.902–0.982)0.0520.0574.486.5212.4118.07
Retest69.3622.67
All SampleTest68.4722.590.032 *0.954(0.920–0.974)0.0450.0544.907.0613.5819.56
Retest70.3523.08
G9–10 = age group 9–10 years; G11–12 = age group 11–12 years; G13–14 = age group 13–14 years; SD: standard deviation; t-test (p) = p value of paired t-test; ICC = intraclass correlation coefficient; 95% CI = confidence interval of ICC; CV: coefficient of variation; SEM = standard error of measurement (absolute values); SEM (%) = SEM percentage values. MDC = minimal detectable change (absolute values); MDC% = MDC percentage values; * = significant difference between test 1 and test 2.
Table 3. 1RM values (kg) in SBP test.
GroupTestMeanSDt-Test (p)ICC95% CICV SDSEMSEM%MDCMDC %
G9–10Test57.3512.840.0860.953(0.868–0.983)0.0350.0332.614.617.2412.80
Retest55.7611.53
G11–12Test56.949.300.7700.918(0.783–0.971)0.0340.0362.865.017.9213.87
Retest57.2510.92
G13–14Test75.6319.610.4250.985(0.949–0.995)0.0280.0432.473.306.849.15
Retest73.9321.31
All GirlsTest56.1310.410.4890.929(0.845–0.969)0.0350.0392.754.927.6313.65
Retest55.7510.26
All BoysTest69.5418.930.0630.981(0.955–0.992)0.0290.0342.683.897.4310.79
Retest68.1319.96
All SampleTest62.9216.230.0720.974(0.953–0.985)0.0320.0362.914.678.0712.93
Retest61.9419.90
G9–10 = age group 9–10 years; G11–12 = age group 11–12 years; G13–14 = age group 13–14 years; SD: standard deviation; t-test (p) = p value of paired t-test; ICC = intraclass correlation coefficient; 95% CI = confidence interval of ICC; CV: coefficient of variation; SEM = standard error of measurement (absolute values); SEM (%) = SEM percentage values. MDC = minimal detectable change (absolute values); MDC% = MDC percentage values.
Table 4. Muscle power (W) values at 60% of 1RM in LE.
GroupTestMeanSDt-Test (p)ICC95% CICVSDSEMSEM%MDCMDC %
G9–10Test148.2820.280.3790.651(0.255–0.858)0.0650.04110.947.1930.3219.94
Retest155.8816.28
G11–12Test219.4755.120.5130.853(0.634–0.946)0.0690.07522.8010.5263.2029.17
Retest213.9065.22
G13–14Test282.9228.860.0650.696(0.634–0.946)0.0570.02417.566.0548.6716.76
Retest298.0133.86
All GirlsTest215.2681.350.029 *0.937(0.843–0.974)0.0750.05221.869.8560.627.29
Retest228.8392.85
All BoysTest222.2156.640.8040.800(0.591–0.909)0.0960.07826.6911.9674.0033.16
Retest224.1862.76
All SampleTest218.7469.430.1200.892(0.814–0.938)0.0860.06724.2910.9167.3530.25
Retest226.5078.44
G9–10 = aged group 9–10 years; G11–12 = aged group 11–12 years; G13–14 = aged group 13–14 years; SD: standard deviation; t-test (p) = p value of paired t-test; ICC = intraclass correlation coefficient; 95% CI = confidence interval of ICC; CV: coefficient of variation; SEM = standard error of measurement (absolute values); SEM (%) = SEM percentage values. MDC = minimal detectable change (absolute values); MDC% = MDC percentage values. * = significant difference between test 1 and test 2.
Table 5. Muscle power (W) values at 60% of 1RM in SBP test.
GroupTestMeanSDt-Test (p)ICC95% CICV SDSEMSEM%MDCMDC %
G9–10Test74.6613.960.9680.663(0.280–0.896)0.0830.0778.1710.8222.6530.01
Retest76.2714.58
G11–12Test98.5629.660.2850.922(0.797–0.972)0.0750.0598.238.4822.8023.49
Retest95.6030.14
G13–14Test155.9636.630.6150.918(0.778–0.972)0.0610.03710.666.7829.5318.79
Retest158.3339.03
All GirlsTest94.7935.940.6610.890(0.764–0.951)0.0100.08511.9512.7233.1435.26
Retest93.1736.16
All BoysTest122.8140.060.7640.951(0.889–0.978)0.0750.0529.817.9627.1922.06
Retest123.7548.60
All SampleTest108.7743.260.8960.935(0.887–0.963)0.0910.07611.2610.3731.2228.75
Retest108.4645.10
G9–10 = aged group 9–10 years. G11–12 = aged group 11–12 years. G13–14 = aged group 13–14 years. SD: standard deviation; t-test (p) = p value of paired t-test; ICC = intraclass correlation coefficient; 95% CI = confidence interval of ICC; CV: coefficient of variation; SEM = standard error of measurement (absolute values); SEM (%) = SEM percentage values. MDC = minimal detectable change (absolute values); MDC% = MDC percentage values.
Publisher’s Note: MDPI stays neutral with regard to jurisdictional claims in published maps and institutional affiliations.