Abstract
Pavement evaluation is critical for the decision-making process of pavement preservation and rehabilitation. Roughness is a key airport pavement characteristic that has been linked to impacts such as safety and service life. The Boeing Bump is one of the few roughness evaluation methods that has been developed specifically for runways. Although it is superior to the widely used International Roughness Index (IRI), it does not take into account the superposition effect of continuous runway bumps. Based on the ADAMS/Aircraft virtual prototype platform, this paper establishes and verifies five typical models (B737, B747, B757, B777, and B787) and then analyzes the most unfavorable speed (in terms of aircraft vibration) of each model and the dynamic responses caused by multiple bumps. The original Boeing Bump is improved and optimized by determining dynamic response thresholds for the various aircraft types. The results show that the revised Boeing Bump is more realistic than the original version, especially with regard to medium and long wave bands.
1. Introduction
Pavement evaluation is critical for the decision-making process of pavement preservation and rehabilitation. Roughness is a key airport pavement characteristic that has been linked to impacts such as safety and service life. Excessive runway roughness will cause aircraft to vibrate during taxiing, which not only accelerates the fatigue damage of the pavement and landing gear, but also affects passenger comfort and the operations of the pilot []. As a result, airports, airlines, and aircraft manufacturers are paying close attention to the effects of runway roughness []. At present, the internationally popular evaluation methods for runway roughness include Straight Edge, Power Spectral Density [,], the International Roughness Index (IRI) [,,], Wavelet Analysis [], the Boeing Bump [], etc. Different from the other methods that are used to assess road pavement roughness in general, the Boeing Bump is specifically designed to evaluate airport runway roughness. The Boeing Bump considers the height of a single bump at each wavelength (0 m~120 m) and thus is a typical section evaluation index. Several research efforts have proven the effectiveness of the Boeing Bump compared to other evaluation methods. For example, Liu established an aircraft dynamics model and proved that the correlation between the Boeing Bump and the center of gravity acceleration (CGA) and pilot station acceleration (PSA) of aircraft is superior to that of the IRI and Straight Edge method []. Loprencipe determined theoretically that the correlation between the Boeing Bump Index (BBI) and IRI is poor []. Woods used the Federal Aviation Administration’s (FAA’s) ProFAA software to analyze evaluation indices of runway roughness and showed that the BBI is more effective than the IRI [].
However, despite its superiority over the IRI and other roadway evaluation methods, the Boeing Bump method has some inherent deficiencies. First, it is based on a single bump and thus cannot reasonably address the superposition effect of multiple bumps on the aircraft’s vibration response []. Second, its standards are based on a single aircraft type, the B727, and thus it may not be applicable to other aircraft []. Therefore, for runway roughness evaluations specifically, the Boeing Bump method is theoretically less realistic than actual situations can support, which clearly is unfavorable in terms of the safety of runway operations. Boeing Bump method evaluations can be improved if these two shortcomings (i.e., based on a single bump and a single aircraft type) are corrected and optimized.
To this end, in this study, we carried out aircraft dynamics simulations by first establishing five typical virtual prototype models. Next, we quantified the superposition effect of the aircrafts’ vibration responses under multiple bumps. We then backcalculated the modified Boeing Bump’s height settings at different wavelengths according to the threshold of each aircraft’s dynamic response.
2. Boeing Bump Method
Figure 1 presents the classification standards for the Boeing Bump []. The horizontal coordinate is the bump length, which is defined as the shortest distance from the highest point of the bump to both ends. In the most unfavorable case, the highest bump is located precisely at the midpoint between both ends. In this case, the bump length can be regarded as a half wavelength. The range of the bump wavelength is from 0 to 120 m. The black curve is the upper limit of the acceptable zone, and the red curve is the upper limit of the excessive zone.
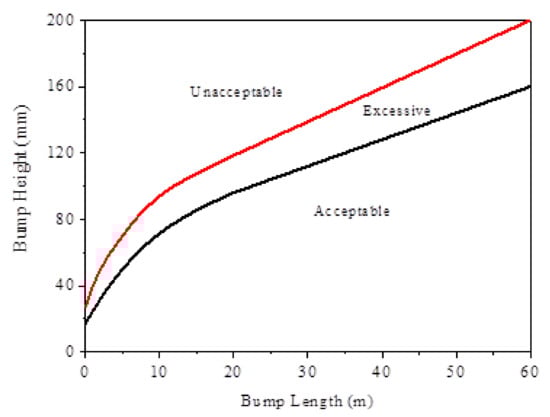
Figure 1.
Classification standards of the Boeing Bump.
The fitting functions for the two curves shown in Figure 1 are expressed as Equations (1) and (2), respectively.
The upper limit of the acceptable zone:
The upper limit of the excessive zone:
where H is bump height (mm) and L is bump length (m).
As an evaluation index for runway surface profiles, the Boeing Bump sets the height limit of a single bump without taking into account the superposition of an aircraft’s dynamic responses to multiple continuous bumps. Therefore, the current standard may be too limited to be applied to real situations. In addition, under different conditions, the corresponding responses of various aircraft also will be different from those of the B727, which is the reference aircraft for Boeing Bump standard formulations []
3. Simulation of Aircraft Dynamic Response
3.1. ADAMS/Aircraft Virtual Propotype
The modeling logic applied in ADAMS/Aircraft is bottom-up, which means that it combines the basic components through several levels to form a complete machine model []. The aircraft model structure includes the following components:
- Part: A part is the smallest unit and is built by referring to the Hardpoint (for spatial positioning) and the Construction Frame (for spatial positioning and orientation). The geometric type (Link or Arm), size, material, mass, and moment of inertia of the component can be set using the dialog box in ADAMS/Aircraft.
- Template: The separate parts are assembled into a template by setting Attachments or Forces. The template defines the topological structure of the aircraft model, which is the underlying structure of the prototype model and cannot be used directly for simulation analysis.
- Subsystem: The subsystem is a higher level of the model that is based on the creation of the template. Users can invoke the template to generate the subsystem in Standard mode and then modify the parameters of the subsystem, such as the coordinates of the Hardpoint, the position and direction of the Construction Frame, and the parameters of the property file. However, the subsystem is not used directly for simulation analysis.
- Communicator: The Communicator is used mainly to exchange information between subsystems and includes an Input Communicator or Output Communicator. For example, the Output Communicator that is responsible for the tire installation position and rolling direction in the landing gear subsystem must correspond to the Input Communicator in the Tire subsystem. During assembly, the software will automatically pair the appropriate Communicators.
- Test Rig: The Test Rig is an equipment that is used to store a simulation controller and test the structure of the model. It includes the whole machine simulation test rig, landing gear dynamic simulation test rig, landing gear structure simulation test rig, and wheel simulation test rig. The Test Rig controls the simulation parameters and calculation process during simulation analysis.
- Assembly: The Assembly is the only component that can be used directly for simulation analysis in ADAMS/Aircraft. The Assembly consists of the Test Rig and one or more subsystems and is divided into the following components. The wheel assembly consists only of a single wheel subsystem. The landing gear structure assembly includes the landing gear suspension subsystem and the structure test rig. The landing gear dynamic assembly includes the landing gear suspension subsystem, wheel subsystem, and dynamic simulation test rig. The assembly of the whole machine includes five basic subsystems, i.e., the fuselage subsystem, the nose landing gear suspension subsystem, the front wheel system, the main landing gear suspension subsystem, and the main wheel system, as well as the whole machine simulation test rig.
ADAMS/Aircraft supports both Template Builder and Standard modes. After building the aircraft components and generating templates in Template Builder mode, users can call the template in Standard mode to complete the assembly of the whole machine model and carry out simulation analysis. Figure 2 presents the specific modeling and assembly processes in ADAMS/Aircraft in the order of ‘template–subsystem–assembly’ [].
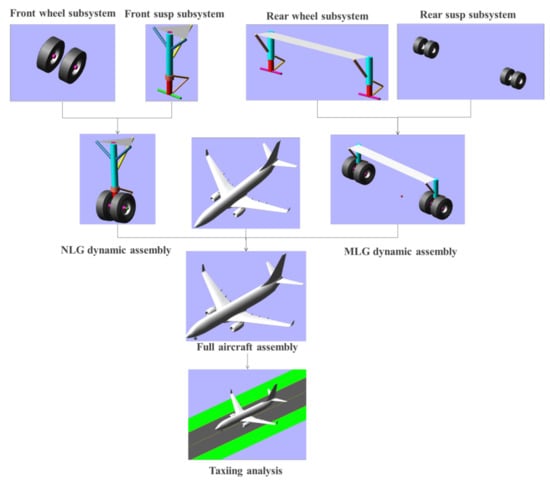
Figure 2.
Iconic flowchart of the modeling and assembly process [].
3.2. Typical Aircraft Virtual Prototype Models
ADAMS/Aircraft software includes templates for various parts of an aircraft’s structure, which allows users to modify the parameters slightly. However, the only type of aircraft for which the templates apply is a military aircraft, which is quite different from civilian airliners. In order to carry out simulations for civil aircraft, we have built several additional civil aircraft models to complete the ADAMS/Aircraft database. Boeing and Airbus occupy the mainstream presence in the current international civil aviation market. Table 1 presents the classifications for the different Boeing (B) and Airbus (A) models.

Table 1.
Aircraft model classifications [].
Based on the representative aircraft types presented in Table 1, we selected five typical Boeing aircraft types for this study to build virtual prototype models: B737-800, B757-200, B777-300E, B787-800, and B747-400. Figure 3 shows these five models assembled in ADAMS/Aircraft.
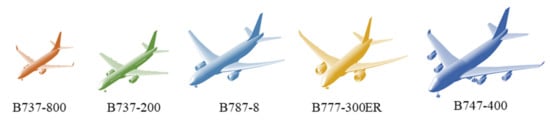
Figure 3.
Virtual prototype models of typical Boeing aircraft assembled in ADAMS/Aircraft.
Using the B787-800 as an example [], Table 2 shows the parameters used for the fuselage, landing gear, and wheel. The stiffness and damping ability of the landing gear system were considered using landing gear buffer model. Detailed information about landing gear buffer model can be found in authors’ previous publication [].
Table 2.
Virtual prototype model of B787-800 and parameters [].
3.3. Verification of Virtual Prototype Models
The FAA has used a B737-800 driving simulator to conduct research into airport runway roughness at the Mike Monroney Aeronautical Center in Oklahoma City, OK []. The FAA presents the simulation results in terms of the weighted root mean square of the vertical acceleration of the aircraft cockpit on eight existing runways. These results were obtained from both the driving simulator as well as from the FAA’s computer program, ProFAA, which the FAA uses to compute pavement profile roughness []. In this paper, the driving simulator test results are used to verify the reliability of the virtual prototype compared to ProFAA. The longitudinal profiles of the eight runways were imported into ADAMS/Aircraft. Using the newly built B737-800 model, simulations were performed at the same speed (100 knots) as used in FAA B737-800 driving simulator and ProFAA. We were then able to calculate the weighted root mean square of the vertical acceleration of the cockpit from the ADAMS/Aircraft simulation. Table 3 and Figure 4 present comparisons of the simulation results obtained using ProFAA, the B737-800 simulator, and ADAMS/Aircraft software. Our simulation results obtained from ADAMS/Aircraft are closer to the driving simulator results than to the ProFAA results, and the overall trend of our results also is more consistent with the driving simulator data than with the ProFAA data. With regard to the average difference from the reference driving simulator results, the ProFAA results reached 64% whereas the difference for the ADAMS/Aircraft results was only 14%. Therefore, using ADAMS/Aircraft for aircraft simulations is more reliable than using ProFAA.
Table 3.
Comparison of results for three simulation methods [].
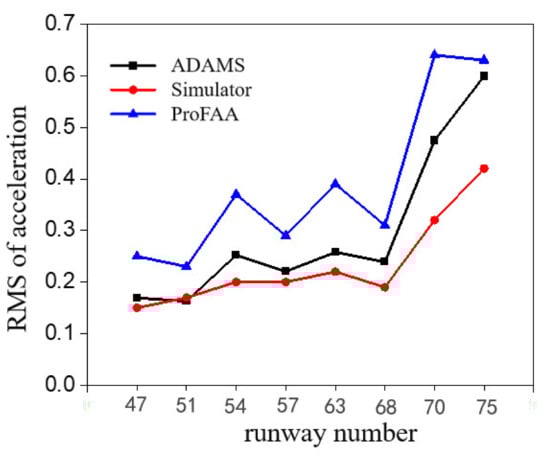
Figure 4.
Comparison of results obtained from three different simulation methods.
Figure 5 presents the simulation results for the five aircraft models with the same taxiing speed on the same runways (as used in the FAA’s research). As shown, the root mean square of the vertical acceleration of the aircraft cockpit tends to decrease with the increase in the size of the aircraft.
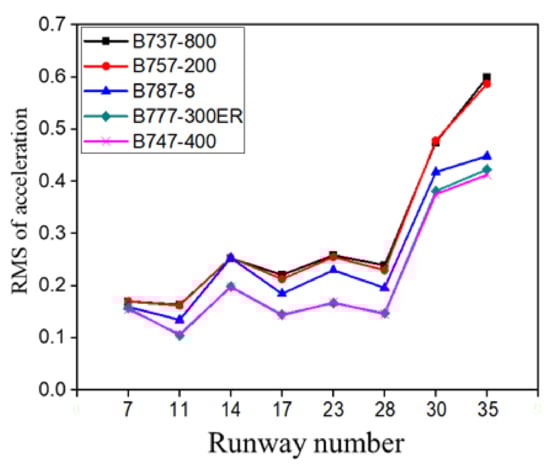
Figure 5.
Comparison of results obtained from five aircraft models.
3.4. Takeoff Speed
We applied standard thrust level for each virtual prototype model body to simulate aircraft taking off on a runway and then compared the taxiing speed and the mainwheel load level. Takeoff speed is obtained in this section and will be used to determine the most unfavorable speed later in this study. Figure 6 presents the comparisons between aircraft taxiing speed V and mainwheel load for each aircraft model. When the mainwheel load becomes 0, the aircraft is completely off the ground, which means the corresponding taxiing speed can be determined as the takeoff speed. Table 4 shows the takeoff speed for all five models ranges from 250 to 350 km/h.
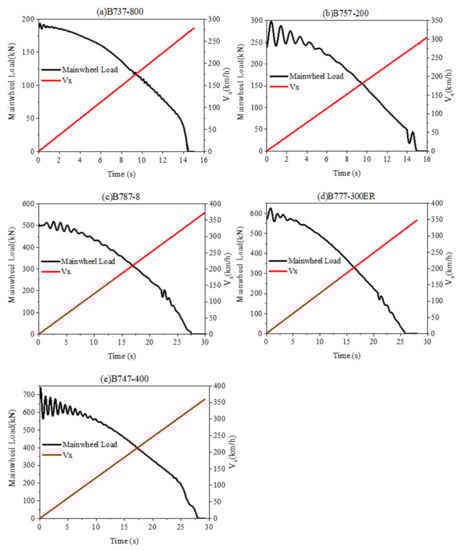
Figure 6.
Aircraft taxiing speed and mainwheel load for each ADAMS/Aircraft prototype model.
Table 4.
Takeoff Speed for Five Types of Aircraft (km/h).
4. Testing Scenarios
4.1. Criteria for Four Vibration Index Values
In this study, dynamic load coefficient (DLC) is defined as the ratio of the vertical dynamic load of an aircraft to its weight, it is also referred as dynamic load factor. Overload coefficient (or overload factor) is defined as the ratio of the excessive vertical dynamic load of an aircraft to its weight (i.e., overload coefficient equals to DLC minus one), it is also referred as overload factor. The effects of runway roughness on the aircraft, pilot(s), and passengers should be examined simultaneously. The runway roughness evaluation criteria are dependent on the threshold values of the dynamic load coefficient and the acceleration.
United States Military Standard MIL-A-8866 analyzed the probability of aircraft dynamic load coefficient during landing. One landing consists of different phases such as touching down, turning, taxiing, and braking []. Table 5 shows the number of times per thousand runway landings that dynamic load coefficient () is experienced. It was observed that most of time during landing, the dynamic load coefficient is smaller than 1 ± 0.15.
Table 5.
Number of times per thousand runway landings that dynamic load factor () is experienced [].
APR Engineering Consulting Co., Ltd. in the United States uses ± 0.4 g as the threshold value for aircraft vertical acceleration and has set that value into its software []. Therefore, the peak value of the aircraft dynamic response shown in Table 6 is taken as the basis for modifying the Boeing Bump standard.
Table 6.
Aircraft dynamic response control criteria that correspond to Boeing Bump evaluation standard.
4.2. Form of Roughness Excitation
The excitation parameter for runway roughness evaluation has been simplified to harmonic vibrations, with the cosine function adopted as input. The function expression is shown in Equation (3).
where x is the horizontal coordinate of the runway, z is the elevation coordinate of the runway, H is twice the amplitude, that is, the vertical distance between the peak and valley, and is the wavelength.
In order to eliminate the interference of the initial disturbance and ensure that the aircraft maintains a smooth taxiing state before encountering excitation, we set a 500-m buffer zone in front of the single cosine excitation. Then, we calculated the elevation data of the runway profile and input those data into the pavement file for simulation. Figure 7 presents a schematic diagram of a single bump and multiple bumps excitation (bulge) represented by cosine functions.
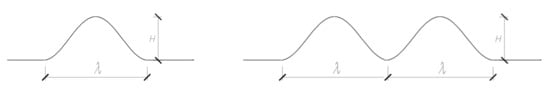
Figure 7.
Single and multiple bumps characterized by cosine functions.
Previous study shows that the aircraft vibration caused by the runway roughness is sensitive to the runway longitudinal wavelength, the longest wavelength could be 120 m []. In this study, multibody dynamics analysis ADAMS was used to simulate five typical aircraft models with various wavelength excitation. The range of the wavelength is 0–120 m. We first divided the entire range into discrete steps, and then generate the corresponding longitudinal profile to perform multibody dynamics analysis. Such process can be time consuming. Through several trials, we have determined the optimum step size to be 1 m. Using step size larger than 1 m makes the corrected BBI curve not smooth enough and affect the result accuracy, while using step size smaller than 1 m significantly increases the simulation cost.
4.3. Modifying Process
We set the conditions and process for optimizing the Boeing Bump method as follows:
- We set the wavelength range for the Boeing Bump to be 0 m to 120 m, with the step size of 1 m.
- We divided the wavelengths of 1 m~120 m into different bands.
- According to the vibration response characteristics of the different aircraft types, we determined the corresponding wavebands.
- We determined the taxiing speed of the aircraft.
- We determined the bump height that corresponded to each wavelength and input the multiple bumps into ADAMS/Aircraft.
- We simulated five types of aircrafts and found four vibration index values.
- According to the set thresholds of the vibration responses, we determined the height of the bump that corresponded to each wavelength and used that height as the standard for the final modified model.
Figure 8 presents the entire process for modification of the Boeing Bump method.
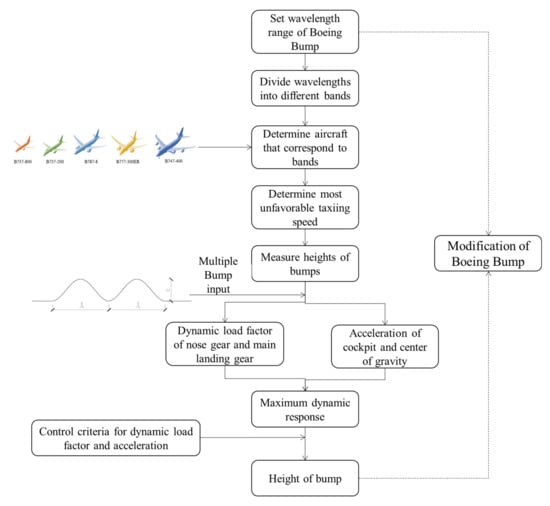
Figure 8.
Modification process for Boeing Bump Index model.
5. Results and Discussion
5.1. The Most Unfavorable Speed
We carried out simulations for the five aircraft models taxing at different speeds and obtained four indicators: PSA, CGA, MGDLC, NGDLC. The simulation results show that the maximum values of the PSA and CGA increase as the taxiing speed increases. Therefore, the most unfavorable speed for vertical acceleration is the takeoff speed for each aircraft. For indicators MGDLC and NGDLC, on the other hand, their maximum values do not necessarily occur at takeoff speed. Due to the lift effect produced by aircraft wings, the dynamic load coefficient increases first and then decreases with increasing taxiing speed. The taxiing speed corresponds to the maximum dynamic load coefficient is then defined as the most unfavorable speed for dynamic load coefficient. Table 7 summarized the most unfavorable speeds for each aircraft model.
Table 7.
Most unfavorable speeds for five types of aircraft (km/h).
5.2. Analysis of Superposition Effect
When two successive bump wavelengths with the same shape and amplitude are present on the runway profile, taxiing simulation tests are carried out at the most unfavorable speed for the aircraft’s vibration response. We set bumps with 10-mm amplitude and 3~60m wavelengths. Figure 9 presents comparisons of the maximum values of the MGDLC and PSA after the superposition of two bumps and a single bump. When the wavelength of two successive bumps is the sensitive wavelength of the aircraft at that speed, the frequency of the continuous excitation is close to the natural frequency of the aircraft’s buffer system. Therefore, the dynamic responses of the aircraft reach their peak due to the superposition of resonation.
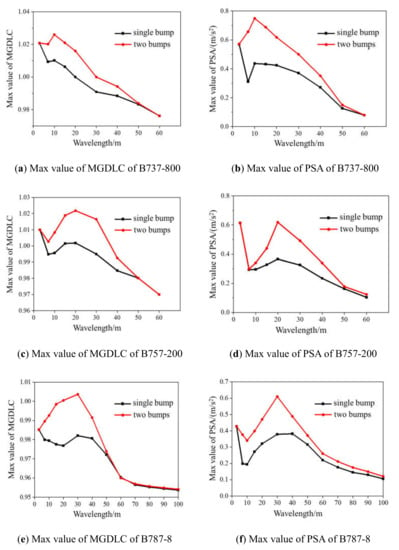
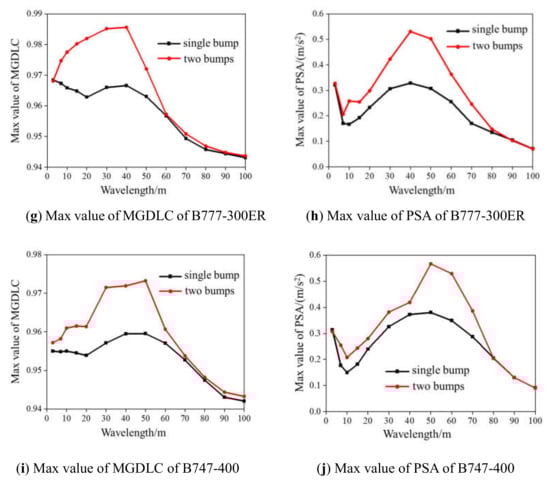
Figure 9.
Maximum values of MGDLC and PSA after superposition (compared with single bump).
The bump wavelength is set to the aircraft’s sensitive wavelength, which indicates that the frequency of the continuous excitation is the natural frequency of the aircraft. Table 8 shows the peak dynamic responses of the five types of aircraft under two identical successive bumps compared to their responses under a single bump. The increases in the peak dynamic responses (NGDLC and PSA) at the front of the aircraft after superposition are greater than the increases in those responses (MGDLC and CGA) at the center of the aircrafts. This trend becomes increasingly more distinct with the diminishing size of the aircraft type.
Table 8.
Peak responses and increases following superposition of two successive bumps.
5.3. Modification of Boeing Bump Index
The Boeing Company mainly utilizes only the B727 as the test aircraft for investigating Boeing Bump criteria. Although the results show a reliable relationship with the dynamic responses of the B727, their extension for application to other aircraft types may be poor. This paper analyzes the peak value of the CGA for five aircraft at the most unfavorable speed under different wavelength bumps (Figure 10). The CGA of the B737 is the largest within the 15 m wavelength whereas the CGA of the B747 is the largest at more than 50 m wavelength. In general, when the bump wavelength is near the sensitive wavelength of a certain aircraft model, the dynamic response is the greatest because the excitation frequency is close to the natural frequency of that aircraft.
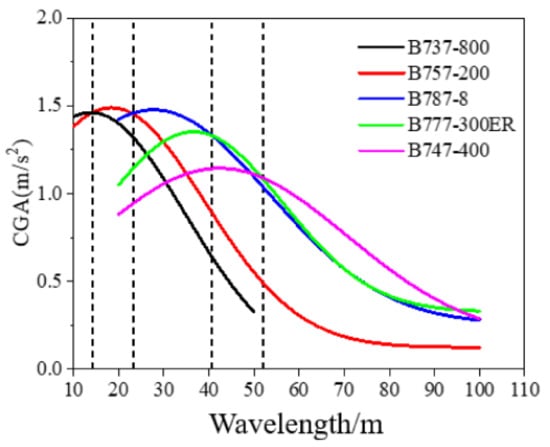
Figure 10.
Maximum value of CGA versus different wavelength bumps for five aircraft model types.
To ensure that a runway’s roughness can meet the requirements for all types of aircraft, the aircraft with the greatest dynamic response should be selected as the simulation aircraft for the corresponding wavelength range. Table 9 shows the selection of the simulation aircraft models based on different wavelengths. Based on the criteria for the MGDLC, NGDLC, PSA, and CGA, we modified the bump height as the upper limit in the acceptable zone and unacceptable zone, as shown in Table 10.
Table 9.
Selection of simulation aircraft under different wavelength bumps.
Table 10.
Limits of Boeing Bump height in acceptable zone and unacceptable zone.
Figure 11 shows the fitting curves of the upper limits of the modified Boeing Bump height in the acceptable zone and unacceptable zone. The bump height increases as the bump length increases. Figure 12 presents a comparison between the modified and original Boeing Bump evaluation criteria. The upper limits of the acceptable and unacceptable zones in the modified criteria are both below the original standard line, especially under the middle and long waves. Thus, the revised evaluation criteria are more conservative and have a wider application range than the original Boeing Bump criteria, especially in terms of the middle and long waves on a runway.
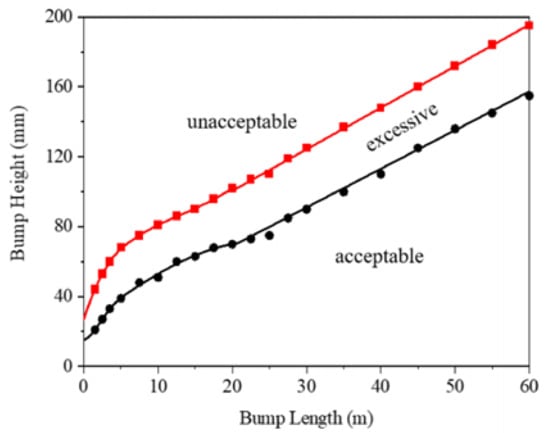
Figure 11.
Modification of Boeing Bump.
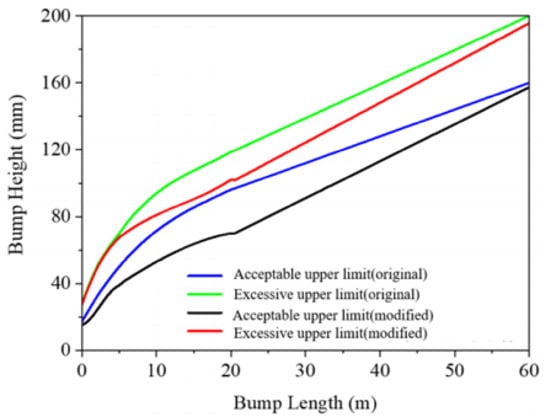
Figure 12.
Comparison of modified and original Boeing Bump thresholds.
6. Conclusions
By adopting a single bump as the standard, the Boeing Bump ignores multiple bump superpositions. In this study, we carried out aircraft dynamic simulations by first establishing five typical virtual prototype models and then quantifying the superposition effect of the aircraft vibration responses under multiple bumps. Based on this work, we then backcalculated the modified Boeing Bump at different wavelengths according to the dynamic response thresholds. The main points of this study are as follows.
- We developed and verified the reliability of the B737-800, B757-200, B777-300ER, B787-800, and B747-400 virtual prototype models in this study.
- The most unfavorable speed (in terms of vibration response) of the different aircraft models differs greatly. Basically, the larger the aircraft, the higher the most unfavorable speed.
- The aircraft’s dynamic response might increase by 50% for two bumps on a rough runway compared to a single bump. Therefore, the original Boeing Bumpmethod should be improved in terms of dealing with multiple bumps.
- Different wavelengths are associated with different aircraft types. Furthermore, the modification evaluation criteria are stricter than the criteria for the original Boeing Bump, especially for middle and long waves on the runway.
Author Contributions
Conceptualization, S.L. and Y.T.; methodology, S.L. and Y.T.; validation, S.L. and Y.T.; investigation, S.L. and Y.T.; resources, S.L. and Y.T.; data curation, S.L. and Y.T.; writing—original draft preparation, S.L. and Y.T.; writing—review and editing, S.L., Y.T., Z.Z., L.L. and P.X.; visualization, S.L. and Y.T.; supervision, S.L. and Y.T.; project administration, S.L. and Y.T.; funding acquisition, S.L. and Y.T. All authors have read and agreed to the published version of the manuscript.
Funding
This study was supported by China Postdoctoral Science Foundation funded project (No.2020M681392), and the National Natural ScienceFoundation of China (Grant No. U1833123 and No.U1933113). The authors appreciate the help of Junjun Chen, PenghuiLi, et al.
Institutional Review Board Statement
Not applicable.
Informed Consent Statement
Not applicable.
Data Availability Statement
[1]. The [Airframe aerodynamics, Landing gear buffer system, wheels] data presented in this study are available on request from the corresponding author. The data are not publicly available due to [institution policy]. [2]. The [runway profile data for Shanghai Pudong Airport Runway No. 4, Hangzhou Xiaoshan Airport Runway No. 1, Dongying Shengli Airport Runway, Ningbo Lishe Airport Runway, and Nanjing Lukou Airport Runway No. 1. ] data presented in this study are available on request from the corresponding author. The data are not publicly available due to [airports internal policy]. [3]. Publicly available datasets were analyzed in this study. [B737-800 simulator] data can be found here: [https://www.airporttech.tc.faa.gov/Products/Airport-Pavement-Papers-Publications/Airport-Pavement-Detail/ArtMID/3684/ArticleID/159/Boeing-737-800-Final-Surface-Roughness-Study-Data-Collection accessed on 27 February 2021]. [4]. These prior studies (and datasets) are cited at relevant places within the text as references [ F. A. A., Surface Roughness Study Final Data Report Boeing 737-800. Washington, D. C: Federal Aviation Administration, 2015.].
Conflicts of Interest
The authors declare no conflict of interests.
References
- Gerardi, A.G. Dynamic Response of Aircraft to Pavement Unevenness. In Proceedings of the Name of the Conference on Research in Airport Pavements, Atlanta, GA, USA, 30 April–3 May 2006; pp. 91–96, Number: 175. ISBN 0360-859X. [Google Scholar]
- Gerardi, A.; Kreuger, D. The Effects of Runway Roughness on Aircraft Fatigue Life. In Aircraft/Pavement Interaction: An Integrated System; ASCE: New York, NY, USA, 1991; pp. 77–95. [Google Scholar]
- Kirk, C.L. Analysis of Taxiing Induced Vibrations in Aircraft by the Power Spectral Density Method; Technical Report; Cranfield Institute of Technology: Bedford, UK, 1973. [Google Scholar]
- Chen, R.P. Generalized Power Spectral Density Analysis with Application to Aircraft Taxiing Problems. Ph.D. Thesis, Georgia Institute of Technology, Atlanta, GA, USA, 1969. [Google Scholar]
- Civil Aviation Administration of China. MH/T 5024-2009, Technical Specifications of Aerodrome Pavement Evaluation and Management. 2009. Available online: https://www.docin.com/p-119165177.html (accessed on 27 February 2021).
- Transport Canada. Measurement and Evaluation of Runway Roughness; Civil Aviation, Standards; Advisory Circular AC 302-023; Transport Canada: Ottawa, ON, Canada, 2015. [Google Scholar]
- Hayhoe, G.F. Airport pavement rideability rating for maintenance evaluation. In Proceedings of the 2016 Airports Conference, Hershey, PA, USA, 21–23 March 2016; Volume 22. [Google Scholar]
- Endo, K.; Himeno, K.; Kawamura, A.; Hachiya, Y.; Matsui, K. Evaluation of Longitudinal Runway Profile and Ride Quality Using Wavelet Analysis and Brain Waves. In Proceedings of the TRB 82nd Annual Meeting, Washington, DC, USA, 12–16 January 2003. [Google Scholar]
- Gervais, E.L. Runway roughness measurement, quantification and application: The Boeing approach. In Aircraft/Pavement Interaction: An Integrated System; ASCE: New York, NY, USA, 1991; pp. 121–131. [Google Scholar]
- Liu, S.; Ling, J.; Yuan, J.; Li, P.; Chen, J. Landing gear cumulative stroke-based runway roughness evaluation. In Proceedings of the 97th Annual Meeting of Transportation Research Board, Washington, DC, USA, 7–1 January 2018. [Google Scholar]
- Loprencipe, G.; Zoccali, P. Comparison of methods for evaluating airport pavement roughness. Int. J. Pavement Eng. 2019, 20, 782–791. [Google Scholar] [CrossRef]
- Woods, J.E. A Study of Airport Pavement-Aircraft Interaction Using Wavelet Analysis; The University of Texas: San Antonio, TX, USA, 2008. [Google Scholar]
- Ling, J.; Liu, S.; Li, M.; Yuan, J. Application limitation of Boeing Bump to evaluation of runway roughness. J. Tongji Univ. Nat. Sci. 2018, 46, 1035–1041. [Google Scholar]
- Gerardi, M. The Boeing Bump Index—Additional Methodologies Recommended. 2015. Available online: http://www.aprconsultants.com/wp-content/uploads/2016/01/Boeing-Bump-Article_Additional-Methodologies-Recommended.pdf (accessed on 27 February 2021).
- Zhu, L.; Chen, J.; Yuan, J.; Du, H. Taxiing load analysis of aircrafts based on virtual prototype. J. Tongji Univ. Nat. Sci. 2016, 44, 1873–1879. [Google Scholar]
- Civil Aviation Administration of China, Aerodrome Technical Standards MH5001-2013. 2013. Available online: https://wenku.baidu.com/view/685b6c6341323968011ca300a6c30c225801f051.html (accessed on 27 February 2021).
- The Boeing Company. 787 Airplane Characteristics for Airport Planning [R]. 2018. Available online: https://www.boeing.com/resources/boeingdotcom/commercial/airports/acaps/787.pdf (accessed on 27 February 2021).
- Federal Aviation Administration. Surface Roughness Study Final Data Report Boeing 737-800[M]; Federal Aviation Administration: Washington, DC, USA, 2015. [Google Scholar]
- Federal Aviation Administration. ProFAA: The Federal Aviation Administration Computer Program for Roughness Index Analyses: User’s Manual (Draft); Federal Aviation Administration: Washington, DC, USA, 2004. [Google Scholar]
- United States Military, Airplane Strength and Rigidity Reliability Requirements, Repeated Loads, Fatigue and Damage Tolerance. Military Specification. MIL-A-8866. 1987. Available online: http://everyspec.com/MIL-SPECS/MIL-SPECS-MIL-A/download.php?spec=MIL-A-8866C.019123.PDF (accessed on 27 February 2021).
- APR Consultants, Inc. APR’s BBI Plus Analysis, version 1.2.4; APR Consultants, Incorporated: Diamond Bar, CA, USA, 2002. [Google Scholar]
Publisher’s Note: MDPI stays neutral with regard to jurisdictional claims in published maps and institutional affiliations. |
© 2021 by the authors. Licensee MDPI, Basel, Switzerland. This article is an open access article distributed under the terms and conditions of the Creative Commons Attribution (CC BY) license (http://creativecommons.org/licenses/by/4.0/).