Article

Effects of Hip Abductor Strengthening on Musculoskeletal Loading in Hip Dysplasia Patients after Total Hip Replacement

by
Giordano Valente
1,*,
Fulvia Taddei
1,
Alberto Leardini
2 and
Maria Grazia Benedetti
3
1
Bioengineering and Computing Laboratory, IRCCS Istituto Ortopedico Rizzoli, 40136 Bologna, Italy
2
Movement Analysis Laboratory, IRCCS Istituto Ortopedico Rizzoli, 40136 Bologna, Italy
3
Physical Medicine and Rehabilitation Unit, IRCCS Istituto Ortopedico Rizzoli, 40136 Bologna, Italy
*
Author to whom correspondence should be addressed.
Appl. Sci. 2021, 11(5), 2123; https://doi.org/10.3390/app11052123
Submission received: 18 December 2020 / Revised: 23 February 2021 / Accepted: 24 February 2021 / Published: 27 February 2021
(This article belongs to the Special Issue Musculoskeletal Models in a Clinical Perspective)

Abstract

:
Hip dysplasia patients after total hip replacement show worse functional performance compared to primary osteoarthritis patients, and unfortunately there is no research on muscle and joint loads that would help understand rehabilitation effects, motor dysfunctions and failure events. We tested the hypothesis that a higher functional improvement in hip dysplasia patients who received hip abductor strengthening after hip replacement, would result in different gait function and musculoskeletal loads during walking compared to patients who performed standard rehabilitation only. In vivo gait analysis and musculoskeletal modeling were used to analyze the differences in gait parameters and hip and muscle forces during walking between the two groups of patients. We found that, in a functional scenario of very mild abnormalities, the patients who performed muscle strengthening expressed a more physiological force pattern and a generally greater force in the operated limb, although statistically significant in limited portions of the gait cycle, and likely related to a higher gait speed. We conclude that in a low-demand task, the abductor strengthening program does not have a marked effect on hip loads, and further studies on hip dysplasia patients would help clarify the effect of muscle strengthening on loads.

1. Introduction

Developmental dysplasia of the hip (DDH) features chronic dislocation of the femoral head, leading to secondary osteoarthritis, contractures and atrophy of the hip abductor muscles, and resulting in overall motor dysfunction, pain and disability [1]. These musculoskeletal issues can be treated through total hip replacement (THR), which includes a specific complexity for DDH patients due to difficulties in restoring the ideal center of joint rotation. The major risks after THR are residual abnormalities in gait and early wear of the prosthesis, due to poor abduction function and femoral offset [2,3]. Rehabilitation of the hip abductor muscles has been debated and targeted as a major player in the removal of residual dysfunctions [4,5], although no consensus has been found on a specific rehabilitation protocol for hip abductor strengthening [6,7]. Recent studies on THR patients following osteoarthritis demonstrated the effectiveness of hip muscle strengthening and activity retraining intervention on functional outcomes [8,9].
Recently, we have evaluated the effects of a program of abductor exercises on a population of DDH patients through a randomized prospective study [10]. We found a significantly higher improvement in clinical and functional scores at follow-ups of a Study Group that performed a specific muscle strengthening program, compared to a Control Group that performed standard postoperative rehabilitation only. We concluded that a specific protocol for hip abductor strengthening with adequate presurgical planning would improve functional performance and patient satisfaction in DDH patients after THR.
From a biomechanical perspective, gait analysis studies among THR patients demonstrated that DDH patients have worse functional performance and unsatisfactory clinical results compared to primary osteoarthritis patients [11,12]. However, although a few studies analyzed the effect of hip abductor strengthening on joint loads in osteoarthritis patients after THR [13,14], there is no literature regarding muscle and joint contact forces during movement in DDH patients after THR. Muscle and joint loads are related to the stress at the hip joint, with consequent failure events that may occur as a result of wear, edge loading, impingement and subluxation [15,16].
Quantifying muscle and joint loads after rehabilitation following THR of DDH patients would provide insights into the biomechanical effect of a program of exercises, identify potential compensation strategies, or help explain pain and residual motor dysfunctions. The state-of-the-art method to quantify musculoskeletal loads includes the use of multibody models of the musculoskeletal system and patient-specific gait analysis measurements, with consequent simulations of movement and prediction of the biomechanical variables [17,18].
Therefore, the aim of this study was to analyze the effect of a rehabilitation protocol for abductor muscle strengthening on gait function and musculoskeletal loads during walking in DDH patients after THR. We compared gait analysis measurements, joint contact forces and muscle forces of the hip between a group of patients who performed the specific rehabilitation protocol and another group of patients who performed standard rehabilitation only, in the operated and contralateral limb. We tested the hypothesis that a higher improvement in clinical and functional outcome in patients after hip abductor strengthening, as shown recently [10], would result in differences in muscle and joint forces compared to patients who performed standard rehabilitation only.

2. Materials and Methods

2.1. Patients and Experimental Data

Thirty DDH patients were randomly selected from a total of 110 recruited previously within a multicentric clinical trial [10] about the effects of a strengthening abductor program in functional performance and patient’s satisfaction. The 30 patients were scheduled for gait analysis at a follow-up of at least 6 months after THR [19,20,21]. Ten of them did not complete the protocol refusing to perform gait analysis, and of the 20 patients that accepted to perform the exam, 13 were in the rehabilitation arm (Study Group) and seven in the control arm (Control Group) of the study. After gait analysis data acquisition, one patient in the Study Group and one patient in the Control Group were excluded because of missing data on ground reaction forces, therefore 18 patients were included.
All patients were operated with a minimally invasive anterolateral approach for osteoarthritis secondary to DDH [10], and treated with the same cementless hip implant. Preoperative planning was carried out with HipOp-Plan software (http://www.hipop-plan.com/), which allows patient-specific, interactive and user-friendly positioning of the prosthesis components.
Both groups underwent standard early postoperative rehabilitation based on mobilization, gait training and generic muscle strengthening, until patient discharge. In addition, the Study Group only, performed a 2-week daily rehabilitation program aimed at strengthening the hip abductor muscles [8]. Measurements such as Western Ontario and McMaster Universities Osteoarthritis Index (WOMAC), Harris Hip Score and 10 Meter Walk Test were used to measure the functional outcome.
The institutional Ethics Committee approved the study (n. 0006168, registered in the local Institutional Registry with the number 26/13), and all patients read and signed an informed consent.

2.2. Gait Analysis

After completion of the rehabilitation program, the patients performed state-of-the-art gait analysis. Each subject performed five trials of barefoot level walking at a self-selected speed on a 10 m walkway. An additional static trial was recorded in standing upright position. The subjects were first instrumented with 22 reflective markers on pelvis and lower limbs following an established protocol [22]. Three-dimensional marker trajectories and ground reaction force data were collected using an 8-camera motion capture system (100 Hz, Vicon 612 Motion System, Oxford, UK), and two embedded force platforms (2000 Hz, Kistler, Winterthur, Switzerland), respectively.

2.3. Musculoskeletal Modeling and Gait Simulations

A generic multibody musculoskeletal model including 14 rigid bodies, 20 degrees of freedom and 80 musculotendon actuators [23] was used in conjunction with experimental marker trajectories and ground reaction forces to calculate joint angles, joint moments, muscle forces and joint contact forces during walking, by leveraging OpenSim [24]. Preliminarily, marker trajectories were processed with a Woltring low-pass filter to smooth the data with a mean square error of 10 mm, then MATLAB (R2018a, Mathworks, USA) was used to process marker trajectories and ground reaction forces to generate the input files and batch process the simulations in OpenSim. First, the model was personalized for each subject, by scaling the dimensions of each body segment, mass and inertial properties, and the elements attached to the body segments, based on (i) the distances between the experimental markers from the static trial and the corresponding virtual markers on the model, and (ii) body mass. Joint angles during walking were then calculated through inverse kinematics, by minimizing the errors between experimental and virtual markers. Joint moments were calculated through inverse dynamics, from the joint angles and the ground reaction forces. Then, muscle forces were calculated by decomposing the joint moments among the musculotendon actuators through static optimization, by minimizing the sum of muscle activation squared and accounting for the force–length–velocity relationship [25]. Finally, joint contact forces were calculated from the instantaneous force equilibrium through joint reaction analysis.
All data were normalized to percentage of gait cycle from 1% to 100%, and muscle and joint contact forces were expressed in body weight (BW). Hip contact forces, and the most influential muscle forces acting on the hip were analyzed. The muscle forces were grouped and summed in hip abductor muscles (gluteus medius anterior, middle and posterior, gluteus minimum anterior, middle and posterior) and hip flexor muscles (iliacus, psoas and rectus femoris).

2.4. Statistical Analyses

Differences in subject characteristics, functional parameters and peak values in gait analysis measurements between the Study Group and the Control Group were tested by using a Mann–Whitney U-test (α = 0.05) for independent nonparametric samples.
The differences in hip contact forces and muscle forces between groups across the gait cycle were analyzed in both the operated and the contralateral limb. First, the forces were expressed as mean and standard deviation, and mean differences between groups were calculated to have a preliminary quantification of the differences for an initial overall comparison. Then, to evaluate group-wise statistically significant differences, statistical parametric mapping (SPM) was used [26]. Specifically, nonparametric two-tailed unpaired t-tests were performed between the variables of the Study Group and the Control Group (α = 0.05), by using the SPM1D package (SPM, www.spm1d.org, v0.4 [27]) in MATLAB. Differences were considered clinically relevant if significant differences occurred for at least 4% of the gait cycle [28].
Further, an analysis on the overall peaks of hip contact forces was performed. First, force peaks across the gait cycle were calculated and presented as boxplot distributions, and statistically significant differences between groups were tested by using a Mann–Whitney U-test (α = 0.05). Finally, linear correlation (R, p-values) between force peaks and gait speed was checked in both the Study Group and the Control Group patients.

3. Results

3.1. Function and Gait Analysis Results

The general characteristics of the patients included are reported in Table 1. Age, body mass, height, and BMI showed no significant differences between the two groups.
Measurements from gait analysis demonstrated that cadence and gait speed were significantly higher in the Study Group, while stance time in the operated side and cycle time were significantly higher in the Control Group (Table 2). The other time–distance parameters showed no significant differences.
Regarding kinematic measurements, there were no significant differences in pelvic obliquity and hip range of motion between the Study Group and the Control Group (Table 3).

3.2. Analysis of the Musculoskeletal Forces

Regarding the forces predicted via musculoskeletal modeling, the hip contact forces in the operated leg were larger in the Study Group throughout most of the gait cycle, with a maximum difference of 0.6 BW, although the differences were significant in limited portions of the gait cycle (Figure 1).
Conversely, hip contact forces in the contralateral leg were larger in the Control Group, with a maximum difference of −0.6 BW, although not statistically significant (Figure 1).
However, from a qualitative analysis in the shape of the hip contact forces, the Study Group shows a more physiological pattern where a typical double-bump is present with a central absorption loading phase, in both the operated and contralateral leg. No remarkable differences were found in the hip abductor and flexor muscles.
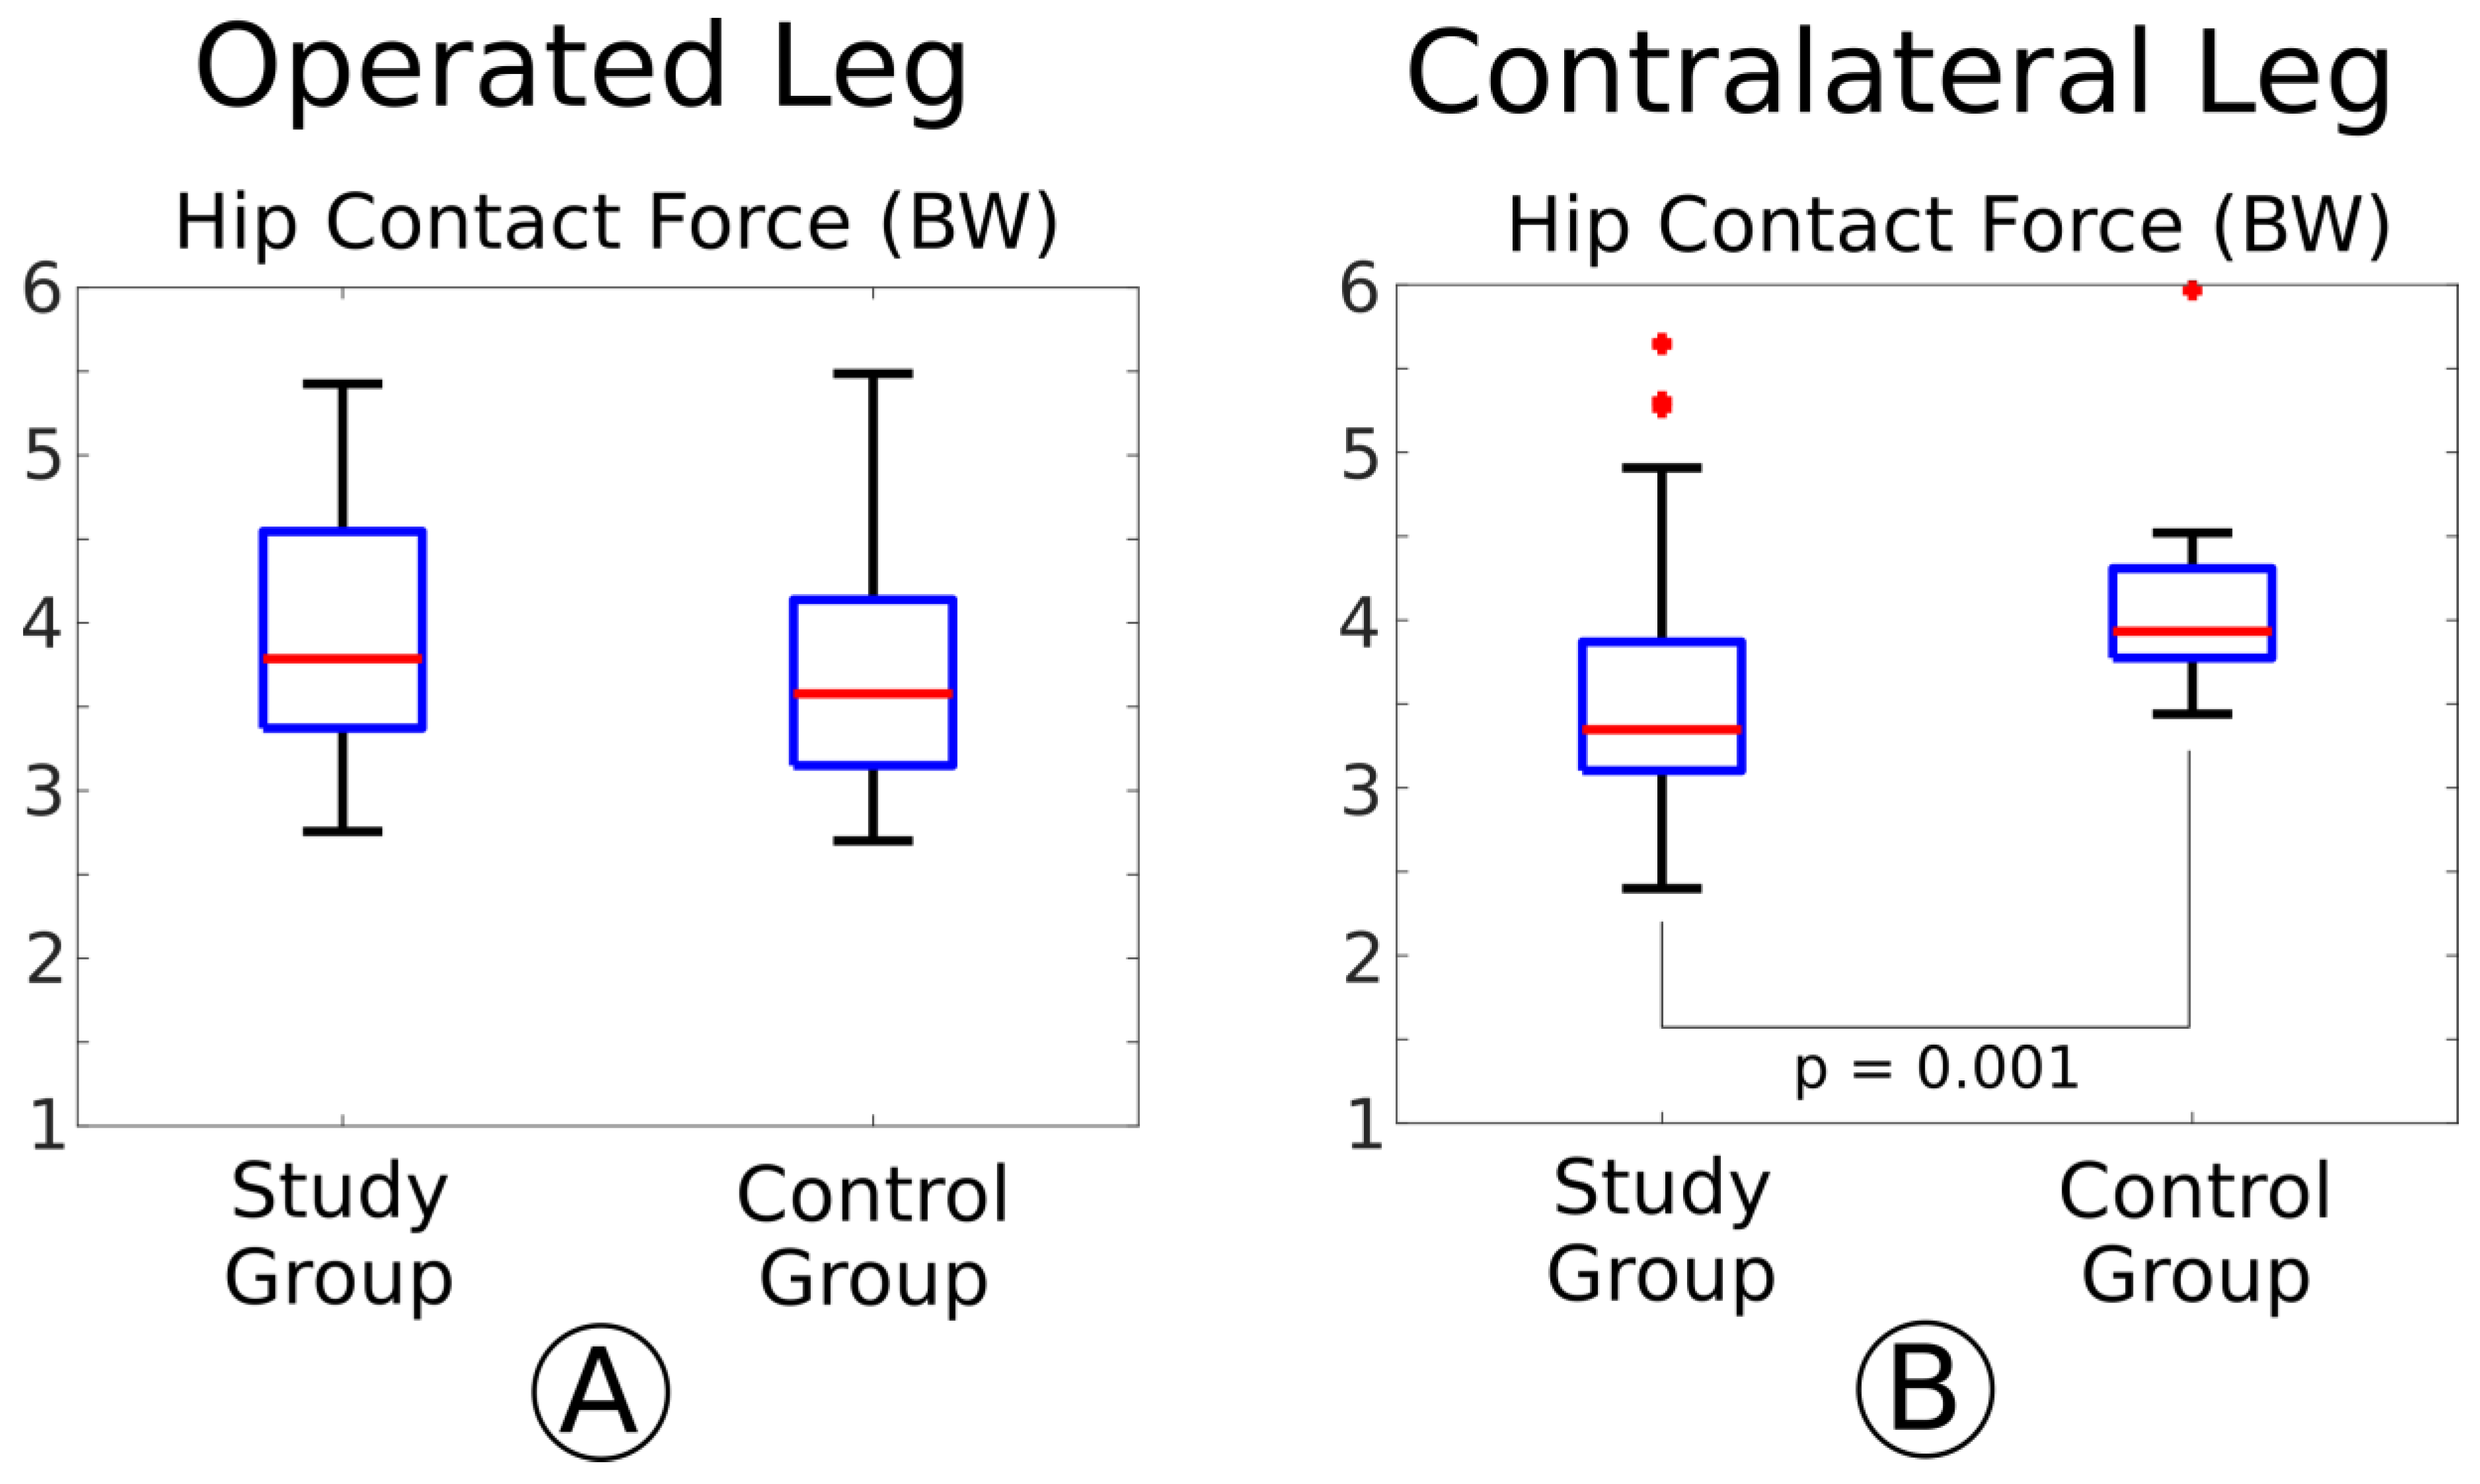
Focusing on the peaks of hip contact forces, no significant differences between the Study and the Control Group were found in the operated limb, while significant differences were present in the contralateral limb with higher force peaks in the Control Group (Figure 2).
In addition, there was a moderate significant correlation between gait speed and contact force peaks in the hip in the Study Group (R = 0.44, p < 0.001) (Figure 3). The peak of hip contact force occurred always toward toe off.

4. Discussion

In this study, we used in vivo motion analysis and multibody musculoskeletal models to test the hypothesis that a higher improvement in clinical and functional outcome shown in DDH patients who received hip abductor strengthening after hip replacement [10], would result in different musculoskeletal loads (i.e., joint contact forces and muscle forces) during walking compared to patients who performed standard rehabilitation only.
Gait analysis revealed mild abnormalities in the time–distance parameters and in the pelvic and hip kinematics, with few significant differences between the two groups (Table 2 and Table 3). Although only few articles are available for gait analysis in DDH patients operated on hip prosthesis [11,19,29], our results are in general agreement with findings of slower gait, shorter stride, reduced range of motion in the sagittal and coronal planes [11], and lower pelvic rotation in the coronal plane [29] with respect to healthy subjects. In addition, functional outcome data in terms of 10 Meter Walk Test, Harris Hip Score and WOMAC demonstrated a better outcome in the Study Group with results very similar to those of the entire sample of patients reported in [10] (Table S1).
Overall, the protocol for abductor muscle strengthening has a mild effect on joint contact forces and muscle forces during walking in the operated limb. We would have expected a more marked effect of strengthening on loads from the hypothesis tested, given the significant difference in abductor strength between groups [10], and the major influence of hip abductor strength on joint contact forces shown in a previous simulation study [30]. In the present study, the patients in the Study Group generally experienced a greater hip force in the operated limb compared to the Control Group (Figure 1 and Figure 2), although with significant differences in a small portion of the gait cycle. This mild difference in hip contact force is, however, likely related to gait speed, which was greater in the Study Group (Table 3, Figure 3). The influence of gait speed on hip contact force during the gait cycle can also explain the force pattern where a typical two-peak pattern is present, more similar to that in both healthy population and THR patients, with a lower force magnitude in both peaks compared to the healthy [28,31]. As we found speed as an influent parameter in our results (Figure 3), we performed a post-hoc analysis where we tried to remove the two slower walking patients from the six patients of the Control Group, with all possible cautions in interpreting the results, given the small number of subjects. This led to a more physiological pattern of hip contact force (i.e., more marked double-bump), but the statistical significance of the differences between groups was only changed slightly. Therefore, we decided to keep all patients in the Control Group, considering also that the two slower patients were globally not more nor less involved than the others.
The lack of differences in muscle forces of the hip abductors and flexors between limbs is difficult to interpret, also considering that there is no consensus in the literature about the effect of impaired muscle status on joint contact forces.
Unfortunately, no similar studies are available on hip contact and muscle forces after THR in DDH patients, indeed this is the first study that analyzed the musculoskeletal loads during gait in DDH patients after THR. Previous research focused on dysplastic hips [32,33] or in patients operated on periacetabular osteotomy [34,35]. Sørensen et al [35] reported a normal hip muscle function during walking after 12 month periacetabular osteotomy, and found that joint force magnitude continued to be higher than normal, justifying this finding with the need for joint structures of a longer time to heal than muscles, with a residual pain alleviating strategy. Damm et al. [36] reported a correlation between muscle atrophy, fatty degeneration and higher hip joint forces. Fatty atrophy was observed after THR contributing to functional outcome deterioration [37].
Considering that the patients included in the present study underwent CT-based planning that allowed targeting more accurately the reconstruction of the center of rotation and other features of the implant, we can suppose that the hip contact force in the Study Group could represent an optimal outcome in terms of recovery of correct loading, also symmetric with the contralateral hip. Nevertheless, in the Control Group, the hip force peak seems to be lower, although not significantly, in the operated limb and significantly higher in the contralateral limb, which suggests a nonoptimal recovery of the operated hip function. According to Sørensen et al. [35], who found contradictory results assessing hip joint kinetics in DDH patients by isokinetic dynamometry and gait analysis, walking can be considered a low-demand task in terms of muscle recruitment, thus more strenuous activities should be explored in the future for a more robust functional assessment of hip muscles. Actually, the physical demand on the gluteal muscles is higher during other common motor tasks (e.g., stairs, squat), and the effect of a more performing muscle might be more marked [14,36,38,39].
The main limitation of this study is the small sample size of the patients, with relevant differences between the Study Group and the Control Group. Unfortunately, we were not able to control the adherence of the patients to the original protocol after 6 months from surgery. In fact, 10 of the patients randomly included in the subgroup for gait analysis came from a distance, and at 6-month follow up they declined to participate. This limited sample size has undoubtedly limited the significance of the observed differences. However, we believe that this limitation does not invalidate the study, given the absence in the literature of analogous studies and the importance of the topic, as it could bring preliminary results to the discussion. Another limitation might regard the lack of gait analysis data before surgery. It is indeed true that a patient control pre- and postoperation would be of additional help in interpreting the results, but the gait pattern before surgery is usually confounding for the presence of leg length discrepancy and pain, hence this choice might be questionable anyway. Finally, it became evident from the analysis of the results that the chosen motor task (i.e., walking at self-selected speed), besides being important as the most common daily task, might not be the best task to highlight the differences induced in kinematics, joint and muscle loads between the operated and contralateral limb. It is possible that a higher demanding task, such as squat or stairs, might better highlight the differences. This should be kept in mind when designing similar studies in the future.

5. Conclusions

In conclusion, in this pilot study we found that the protocol for abductor muscle strengthening in hip dysplasia patients following total hip replacement does not have a major effect on muscle and joint contact forces during walking. However, in a functional scenario of very mild abnormalities, patients who performed muscle strengthening expressed a more physiological force pattern and a generally greater force in the operated limb, both likely related to a higher gait speed. Therefore, in a low-demand task such as walking, the abductor strengthening program leads to more physiological load patterns, although the differences in magnitude are not marked. Further studies on a larger sample size of DDH patients are desirable to clarify the effects of abductor muscle strength on hip joint loads.

Supplementary Materials

The following are available online at https://www.mdpi.com/2076-3417/11/5/2123/s1, Table S1: Functional outcome measurements.

Author Contributions

Conceptualization: G.V., F.T., M.G.B.; data acquisition: A.L.; modeling and simulations: G.V.; data analysis: G.V., M.G.B.; writing—original draft preparation: G.V.; writing—review and editing: G.V., F.T., A.L., M.G.B.; funding acquisition: M.G.B. All authors have read and agreed to the present version of the manuscript.

Funding

This study was funded by the Programma di ricerca Regione-Università 2010–2012 Area 2—“Ricerca per il Governo clinico”, within the project title “Optimising functional recovery in patients with developmental dysplasia of the hip: an innovative pathway for joint reconstruction and rehabilitation”.

Institutional Review Board Statement

The study was conducted according to the guidelines of the Declaration of Helsinki, and approved by the Ethics Committee of the Rizzoli Orthopaedic Institute (protocol n. 0006168, registered in the local Institutional Registry with the number 26/13).

Informed Consent Statement

Informed consent was obtained from all subjects involved in the study.

Conflicts of Interest

The authors declare no conflict of interest.

References

  1. Reikerås, O.; Haaland, J.E.; Lereim, P. Femoral Shortening in Total Hip Arthroplasty for High Developmental Dysplasia of the Hip. Clin. Orthop. Relat. Res. 2010, 468, 1949–1955. [Google Scholar] [CrossRef] [PubMed] [Green Version]
  2. Lecerf, G.; Fessy, M.-H.; Philippot, R.; Massin, P.; Giraud, F.; Flecher, X.; Girard, J.; Mertl, P.; Marchetti, P.; Stindel, E. Femoral offset: Anatomical concept, definition, assessment, implications for preoperative templating and hip arthroplasty. Orthop. Traumatol. Surg. Res. 2009, 95, 210–219. [Google Scholar] [CrossRef]
  3. McGrory, B.; Morrey, B.; Cahalan, T.; An, K.; Cabanela, M. Effect of femoral offset on range of motion and abductor muscle strength after total hip arthroplasty. J. Bone Jt. Surg. Br. Vol. 1995, 77, 865–869. [Google Scholar] [CrossRef] [Green Version]
  4. Liu, R.; Wen, X.; Tong, Z.; Wang, K.; Wang, C. Changes of gluteus medius muscle in the adult patients with unilateral developmental dysplasia of the hip. BMC Musculoskelet. Disord. 2012, 13, 101. [Google Scholar] [CrossRef] [Green Version]
  5. Rasch, A.; Byström, A.H.; Dalén, N.; Martinez-Carranza, N.; Berg, H.E. Persisting muscle atrophy two years after replacement of the hip. J. Bone Jt. Surg. Br. Vol. 2009, 91, 583–588. [Google Scholar] [CrossRef] [PubMed] [Green Version]
  6. Di Monaco, M.; Castiglioni, C. Which type of exercise therapy is effective after hip arthroplasty? A systematic review of randomized controlled trials. Eur. J. Phys. Rehabil. Med. 2013, 49, 893–907. [Google Scholar]
  7. Di Monaco, M.; Vallero, F.; Tappero, R.; Cavanna, A. Rehabilitation after total hip arthroplasty: A systematic review of controlled trials on physical exercise programs. Eur. J. Phys. Rehabil. Med. 2009, 45, 303–317. [Google Scholar]
  8. Madara, K.C.; Marmon, A.; Aljehani, M.; Hunter-Giordano, A.; Zeni, J., Jr.; Raisis, L. Progressive Rehabilitation after Total Hip Arthroplasty: A Pilot and Feasibility Study. Int. J. Sports Phys. Ther. 2019, 14, 564–581. [Google Scholar] [CrossRef] [PubMed] [Green Version]
  9. Matheis, C.; Stöggl, T. Strength and mobilization training within the first week following total hip arthroplasty. J. Bodyw. Mov. Ther. 2018, 22, 519–527. [Google Scholar] [CrossRef]
  10. Benedetti, M.G.; Cavazzuti, L.; Amabile, M.; Tassinari, E.; Valente, G.; Zanotti, G.; Vaienti, E.; Orsini, S.; Mariani, E.; Taddei, F. Abductor muscle strengthening in THA patients operated with minimally-invasive anterolateral approach for developmental hip dysplasia. HIP Int. 2021, 31, 66–74. [Google Scholar] [CrossRef] [PubMed]
  11. Nie, Y.; Ning, N.; Pei, F.; Shen, B.; Zhou, Z.; Li, Z. Gait Kinematic Deviations in Patients With Developmental Dysplasia of the Hip Treated With Total Hip Arthroplasty. Orthopedics 2017, 40, e425–e431. [Google Scholar] [CrossRef] [Green Version]
  12. Catani, F.; Benedetti, M.G.; Binazzi, R.; De Zerbi, M.; Leardini, A.; Giannini, S. Functional evaluation in total hip replacement patients. Chir. Degli Organi Mov. 1999, 83, 349–357. [Google Scholar]
  13. Wesseling, M.; De Groote, F.; Meyer, C.; Corten, K.; Simon, J.-P.; Desloovere, K.; Jonkers, I. Subject-specific musculoskeletal modelling in patients before and after total hip arthroplasty. Comput. Methods Biomech. Biomed. Eng. 2016, 19, 1683–1691. [Google Scholar] [CrossRef] [PubMed]
  14. Myers, C.A.; Laz, P.J.; Shelburne, K.B.; Judd, D.L.; Winters, J.D.; Stevens-Lapsley, J.E.; Davidson, B.S. Simulated hip abductor strengthening reduces peak joint contact forces in patients with total hip arthroplasty. J. Biomech. 2019, 93, 18–27. [Google Scholar] [CrossRef]
  15. Elkins, J.M.; Pedersen, D.R.; Callaghan, J.J.; Brown, T.D. Fracture Propagation Propensity of Ceramic Liners During Impingement-Subluxation. J. Arthroplast. 2012, 27, 520–526. [Google Scholar] [CrossRef] [Green Version]
  16. Brandt, J.-M.; Gascoyne, T.C.; E Guenther, L.; Allen, A.; Hedden, D.R.; Turgeon, T.R.; Bohm, E.R. Clinical failure analysis of contemporary ceramic-on-ceramic total hip replacements. Proc. Inst. Mech. Eng. Part H J. Eng. Med. 2013, 227, 833–846. [Google Scholar] [CrossRef] [PubMed]
  17. Hicks, J.L.; Uchida, T.K.; Seth, A.; Rajagopal, A.; Delp, S.L. Is My Model Good Enough? Best Practices for Verification and Validation of Musculoskeletal Models and Simulations of Movement. J. Biomech. Eng. 2015, 137, 020905. [Google Scholar] [CrossRef] [PubMed]
  18. Pandy, M.G.; Andriacchi, T.P. Muscle and Joint Function in Human Locomotion. Annu. Rev. Biomed. Eng. 2010, 12, 401–433. [Google Scholar] [CrossRef]
  19. Marangoz, S.; Atilla, B.; Gök, H.; Yavuzer, G.; Ergin, S.; Tokgözoğlu, A.M.; Alpaslan, M. Gait analysis in adults with severe hip dysplasia before and after total hip arthroplasty. HIP Int. 2010, 20, 466–472. [Google Scholar] [CrossRef] [PubMed] [Green Version]
  20. Ewen, A.M.; Stewart, S.; Gibson, A.S.C.; Kashyap, S.N.; Caplan, N. Post-operative gait analysis in total hip replacement patients—A review of current literature and meta-analysis. Gait Posture 2012, 36, 1–6. [Google Scholar] [CrossRef]
  21. Bahl, J.S.; Nelson, M.J.; Taylor, M.; Solomon, L.B.; Arnold, J.B.; Thewlis, D. Biomechanical changes and recovery of gait function after total hip arthroplasty for osteoarthritis: A systematic review and meta-analysis. Osteoarthr. Cartil. 2018, 26, 847–863. [Google Scholar] [CrossRef] [Green Version]
  22. Leardini, A.; Sawacha, Z.; Paolini, G.; Ingrosso, S.; Nativo, R.; Benedetti, M.G. A new anatomically based protocol for gait analysis in children. Gait Posture 2007, 26, 560–571. [Google Scholar] [CrossRef]
  23. Rajagopal, A.; Dembia, C.L.; Demers, M.S.; Delp, D.D.; Hicks, J.L.; Delp, S.L. Full-Body Musculoskeletal Model for Muscle-Driven Simulation of Human Gait. IEEE Trans. Biomed. Eng. 2016, 63, 2068–2079. [Google Scholar] [CrossRef] [PubMed]
  24. Delp, S.L.; Anderson, F.C.; Arnold, A.S.; Loan, P.; Habib, A.; John, C.T.; Guendelman, E.; Thelen, D.G. OpenSim: Open-Source Software to Create and Analyze Dynamic Simulations of Movement. IEEE Trans. Biomed. Eng. 2007, 54, 1940–1950. [Google Scholar] [CrossRef] [PubMed] [Green Version]
  25. Anderson, F.C.; Pandy, M.G. Static and dynamic optimization solutions for gait are practically equivalent. J. Biomech. 2001, 34, 153–161. [Google Scholar] [CrossRef]
  26. Nichols, T.E.; Holmes, A.P. Nonparametric permutation tests for functional neuroimaging: A primer with examples. Hum. Brain Mapp. 2002, 15, 1–25. [Google Scholar] [CrossRef] [PubMed] [Green Version]
  27. Pataky, T.C.; Robinson, M.A.; Vanrenterghem, J. Vector field statistical analysis of kinematic and force trajectories. J. Biomech. 2013, 46, 2394–2401. [Google Scholar] [CrossRef] [Green Version]
  28. Wesseling, M.; Meyer, C.; Corten, K.; Desloovere, K.; Jonkers, I. Longitudinal joint loading in patients before and up to one year after unilateral total hip arthroplasty. Gait Posture 2018, 61, 117–124. [Google Scholar] [CrossRef] [PubMed]
  29. Lai, K.-A.; Lin, C.-J.; Jou, I.-M.; Su, F.-C. Gait analysis after total hip arthroplasty with leg-length equalization in women with unilateral congenital complete dislocation of the hip—Comparison with untreated patients. J. Orthop. Res. 2001, 19, 1147–1152. [Google Scholar] [CrossRef]
  30. Valente, G.; Taddei, F.; Jonkers, I. Influence of weak hip abductor muscles on joint contact forces during normal walking: Probabilistic modeling analysis. J. Biomech. 2013, 46, 2186–2193. [Google Scholar] [CrossRef]
  31. Giarmatzis, G.; Jonkers, I.; Wesseling, M.; Van Rossom, S.; Verschueren, S. Loading of Hip Measured by Hip Contact Forces at Different Speeds of Walking and Running. J. Bone Miner. Res. 2015, 30, 1431–1440. [Google Scholar] [CrossRef] [PubMed]
  32. Song, K.; Gaffney, B.M.; Shelburne, K.B.; Pascual-Garrido, C.; Clohisy, J.C.; Harris, M.D. Dysplastic hip anatomy alters muscle moment arm lengths, lines of action, and contributions to joint reaction forces during gait. J. Biomech. 2020, 110, 109968. [Google Scholar] [CrossRef]
  33. Skalshøi, O.; Iversen, C.H.; Nielsen, D.B.; Jacobsen, J.; Mechlenburg, I.; Søballe, K.; Sørensen, H. Walking patterns and hip contact forces in patients with hip dysplasia. Gait Posture 2015, 42, 529–533. [Google Scholar] [CrossRef]
  34. Thomas-Aitken, H.D.; Willey, M.C.; Goetz, J.E. Joint contact stresses calculated for acetabular dysplasia patients using discrete element analysis are significantly influenced by the applied gait pattern. J. Biomech. 2018, 79, 45–53. [Google Scholar] [CrossRef] [PubMed]
  35. Sørensen, H.; Skalshøi, O.; Nielsen, D.B.; Jacobsen, J.S.; Søballe, K.; Mechlenburg, I. Hip muscle and joint contact forces before, 6 and 12 months after minimally invasive periacetabular osteotomy. HIP Int. 2020. [Google Scholar] [CrossRef] [PubMed]
  36. Damm, P.; Zonneveld, J.; Brackertz, S.; Streitparth, F.; Winkler, T. Gluteal muscle damage leads to higher in vivo hip joint loads 3 months after total hip arthroplasty. PLoS ONE 2018, 13, e0190626. [Google Scholar] [CrossRef] [PubMed]
  37. Kovalak, E.; Özdemir, H.; Ermutlu, C.; Obut, A. Assessment of hip abductors by MRI after total hip arthroplasty and effect of fatty atrophy on functional outcome. Acta Orthop. Traumatol. Turc. 2018, 52, 196–200. [Google Scholar] [CrossRef]
  38. Eng, J.J.; Chu, K.S. Reliability and comparison of weight-bearing ability during standing tasks for individuals with chronic stroke. Arch. Phys. Med. Rehabil. 2002, 83, 1138–1144. [Google Scholar] [CrossRef] [PubMed] [Green Version]
  39. Shakoor, N.; Hurwitz, D.E.; Block, J.A.; Shott, S.; Case, J.P. Asymmetric knee loading in advanced unilateral hip osteoarthritis. Arthritis Rheum. 2003, 48, 1556–1561. [Google Scholar] [CrossRef] [PubMed]
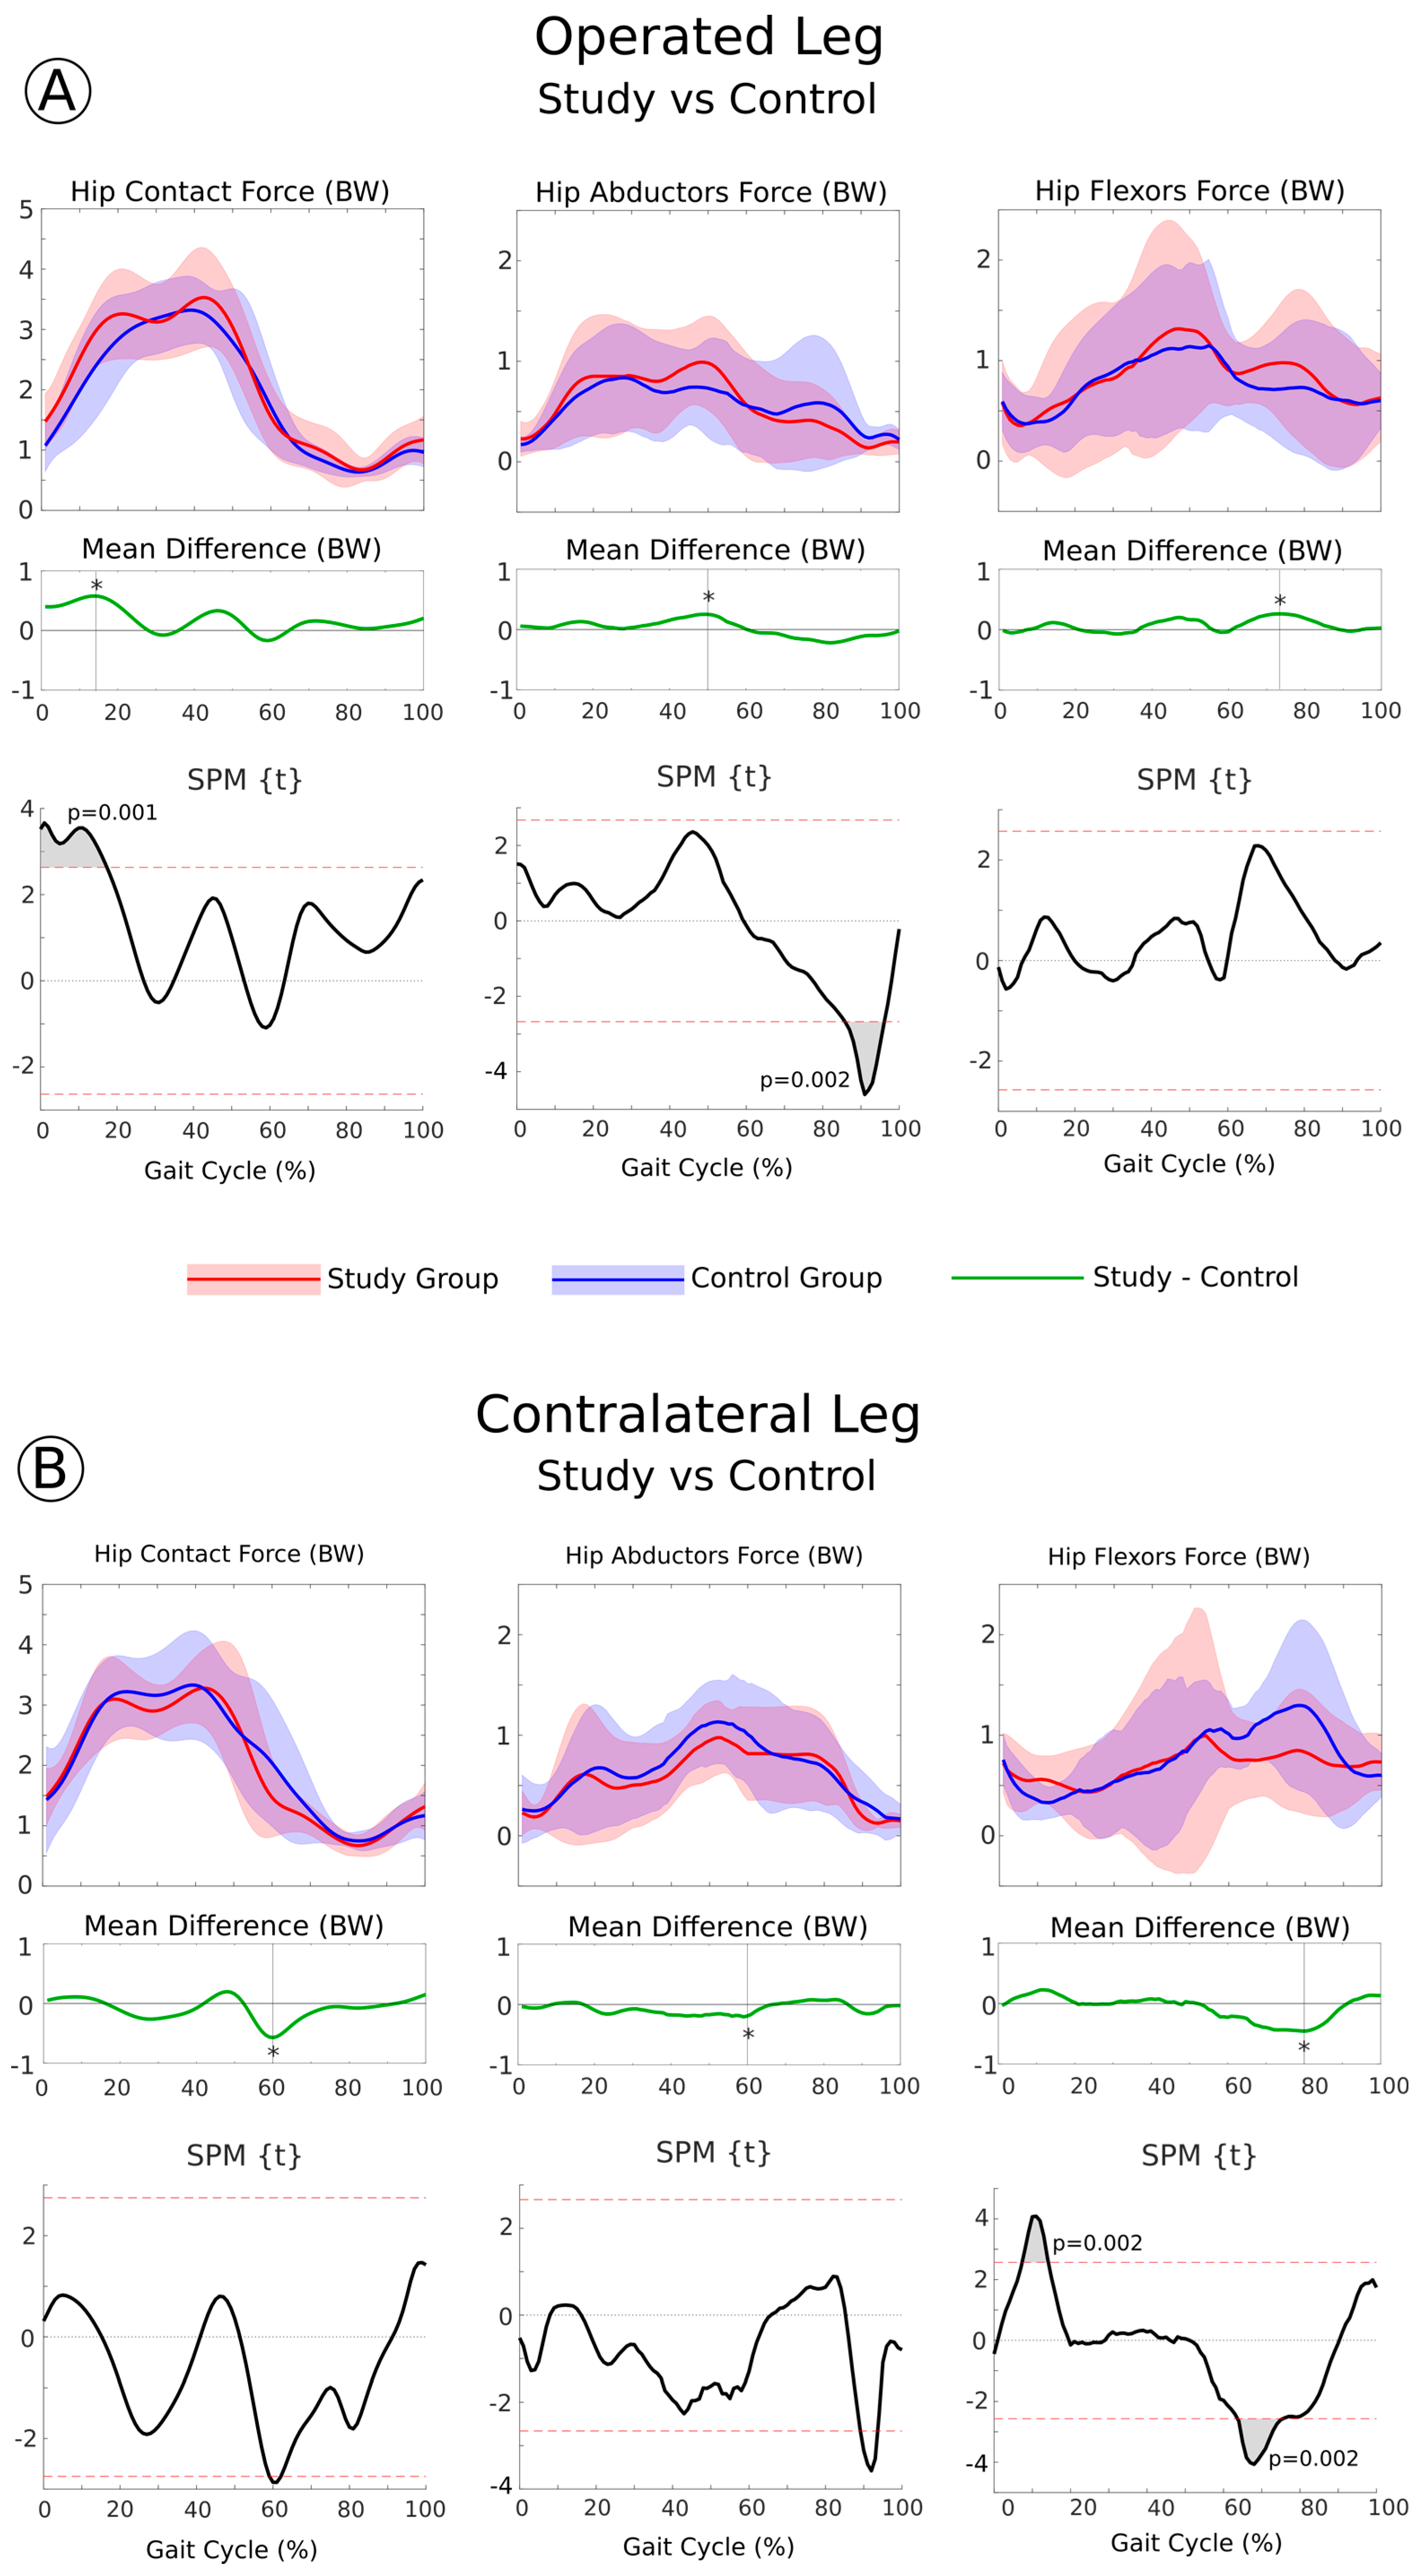
Figure 1. Hip contact forces and muscle forces (normalized to body weight and represented as mean and standard deviation) of the operated leg (A) and contralateral leg (B) across the gait cycle, compared between the Study Group and the Control Group. The analysis is focused on the hip, including joint contact forces and major muscle forces grouped by function. The asterisk (*) indicates the maximum mean difference. Results from SPM t-tests are reported: when SPM t-values exceed the critical threshold (horizontal dotted lines), the differences between groups are significant, and when significant differences occurred for at least 4% of the gait cycle, the areas are reported in grey with the corresponding p-values.
Applsci 11 02123 g001
Figure 2. Boxplot distributions of the peaks of hip contact forces during gait compared between the Study and Control Groups, in the operated leg (A) and contralateral leg (B). P-values are reported for the significant differences between groups (Mann–Whitney U-test).
Applsci 11 02123 g002
Figure 3. Linear correlations between gait speed and hip contact force peaks in all walking trials, for the Study Group (A) and Control Group (B). Correlation coefficients (R) are reported and indicated with an asterisk (*) when statistically significant (p < 0.05).
Applsci 11 02123 g003
Table 1. General characteristics of the patients (Median (IQR)).
Study GroupControl Group
Sample Size126
Gender11 female/1 male5 female/1 male
Follow-up (months)7 (1)7 (1.5)
Age (years)58.2 (9.4)53 (6.8)
Body Mass (kg)63 (8.8)66 (15)
Height (m)1.6 (0.04)1.59 (0.13)
BMI (kg/m2)24 (3.1)23.3 (3.9)
Table 2. Comparison of time–distance parameters.
Study
Group
Control
Group
Mann–Whitney
U-Test
MedianIQRMedianIQRp-values
Stance time operated side
(% stride)
61.12.462.55.50.037
Stance time contralateral side
(% stride)
62.23.362.94.50.786
Stride length operated side
(% height)
72.99.267.99.20.062
Stride length contralateral side
(% height)
72.511.370.27.30.270
Cycle times
(s)
1.130.171.170.260.007
Cadence
(stride/m)
52.67.852.210.40.009
Speed
(cm/s)
105.521.696.330.90.017
Table 3. Comparison of maximum peaks in pelvic and hip kinematics.
Study
Group
Control
Group
Mann–Whitney
U-Test
MedianIQRMedianIQRp-values
Pelvic obliquity
max peak
2.74.12.31.20.658
Pelvic obliquity
min peak
−2.55.8−3.33.40.999
Hip flex/ext
ROM
32.45.234.616.10.999
Hip abd/add
ROM
10.94.910.130.999
Hip int/ext rotation
ROM
94.28.42.30.999
Publisher’s Note: MDPI stays neutral with regard to jurisdictional claims in published maps and institutional affiliations.