Article

A Digital Framework to Predict the Sunshine Requirements of Landscape Plants

1
Geodesign Research Centre, Jiangxi Normal University, Nanchang 330022, China
2
School of Urban Design, Wuhan University, Wuhan 430072, China
3
Department of Geography and Resource Management, Chinese University of Hong Kong, Hong Kong, China
*
Author to whom correspondence should be addressed.
Appl. Sci. 2021, 11(5), 2098; https://doi.org/10.3390/app11052098
Submission received: 7 January 2021 / Revised: 14 February 2021 / Accepted: 23 February 2021 / Published: 27 February 2021

Abstract

:
Knowledge of the sunshine requirements of landscape plants is important information for the adaptive selection and configuration of plants for urban greening, and is also a basic attribute of plant databases. In the existing studies, the light compensation point (LCP) and light saturation point (LSP) have been commonly used to indicate the shade tolerance for a specific plant; however, these values are difficult to adopt in practice because the landscape architect does not always know what range of solar radiation is the best for maintaining plant health, i.e., normal growth and reproduction. In this paper, to bridge the gap, we present a novel digital framework to predict the sunshine requirements of landscape plants. First, the research introduces the proposed framework, which is composed of a black-box model, solar radiation simulation, and a health standard system for plants. Then, the data fitting between solar radiation and plant growth response is used to obtain the value of solar radiation at different health levels. Finally, we adopt the LI-6400XT Portable Photosynthetic System (Li-Cor Inc., Lincoln, NE, USA) to verify the stability and accuracy of the digital framework through 15 landscape plant species of a residential area in the city of Wuhan, China, and also compared and analyzed the results of other researchers on the same plant species. The results show that the digital framework can robustly obtain the values of the healthy, sub-healthy, and unhealthy levels for the 15 landscape plant species. The purpose of this study is to provide an efficient forecasting tool for large-scale surveys of plant sunshine requirements. The proposed framework will be beneficial for the adaptive selection and configuration of urban plants and will facilitate the construction of landscape plant databases in future studies.

1. Introduction

The world’s urbanization prospects show that more people live in urban areas, with 55% of the world’s population residing in urban areas in 2019, and by 2050, 68% of the world’s population is projected to be urban [1]. This trend requires cities to provide more green spaces and welfares for recreation, relaxation, and leisure [2,3]. At the same time, urban problems and challenges, such as the excessive size, overcrowding, and the shortage of urban infrastructure, which follow the process of urbanization should also be taken seriously [4,5,6].
Numerous studies have demonstrated that the contribution of plants to the urban environment is extensive and far-reaching, as plants play an important role in biodiversity conservation [7,8], improving microclimates [9,10,11], relieving air pollution [12,13], enhancing aesthetic value [14], and even influencing the psychological behavior of city dwellers [15,16]. However, urban managers, urban forestry and landscape scientists are more concerned with the sustainable selection and cultivation of plants [17,18,19], these core benefits not only have advantages in planting and management costs, but the eco-functions are also dependent on their survival, growth, development and reproduction [20,21].
Therefore, the concept of “the right tree in the right place” in the field of forestry was advocated by foresters in the early stages and was used for the basis of plantation management [22], its main technique focuses on the matching of site soil types and tree species. In recent years, urban greening and forestry as the habitats for dweller have received increasing attention. Summarizing relevant research shows that plant selection in urban areas is limited by more stress factors, such as soil, drought, sunshine, climate, air pollution, pests, and diseases [23,24,25,26,27]. In North America, researchers such as the University of Minnesota Extension Department have raised concerns about the adaptability of urban plants, and provided suggestions for tree selection, and aiming to improve the adaptability of plants to the city [28]. Similarly, in studies of Utah [29] and Michigan [30], scholars also explored the adaptation of plant species to local environmental conditions. Solar radiation, in particular, is considered to be an important decision factor for plant selection. In addition, the variation of sunshine is also very obvious in urban built-up areas, due to the buildings and terrain [31]. Therefore, for urban greening, how to select adaptive plants more intelligently based on their ecological habits has become a research focus and challenge [19,21,32,33].
The requirement for solar radiation is a genetic feature for a specific plant, although it may change in different environments and growth periods [34,35]. In other words, the demand for solar radiation in plant species is also the type of ecological tolerance or the ecological amplitude. For example, a literature reveals the light and soil conditions impact on the ecological behavior of deciduous hardwood trees in Sweden [36], the results found that Fraxinus excelsior and Ulmus glabra are highly tolerant of shade. The researchers found that the shade tolerance of three tree species has variability [37], and others achieve similar results [38]. It can be seen that the sunshine tolerance for plants is a complex and important research content. Back to the field of landscape architecture, the basic data of landscape plants with regard to solar radiation response act as the key information for the practice of “right plants in the right place”, especially for the database construction of decision support systems used for the sustainable selection of trees and shrubs [19,21,32].
In reality, the light compensation point (LCP) and light saturation point (LSP) are the common indicators used to determine the shade tolerance of landscape plants [39,40,41]. The LCP is the amount of light intensity on the light curve where the rate of photosynthesis exactly matches the rate of respiration. Correspondingly, the LSP is the intensity at which additional increases in light do not increase photosynthesis. These two values can be determined by photosynthetic systems in the field for plants [42], such as the LI-6400XT Portable Photosynthetic System or later models. However, instruments to measure the values of gas exchange are susceptible to climate, operation method, and instrumental errors, as noted in a number of studies [43,44,45,46], the locations of these research sites are geographically similar. Furthermore, the values of LCP and LSP are difficult to adopt for reference in practice, because the landscape architect does not know what range of solar radiation is the best for maintaining plant health, i.e., normal growth and reproduction.
The computer-based digital software, such as solar radiation models, can be used for various types of practical activities or theoretical exploration. Such as the Meteorological Radiation Model (MRM) and the latest version [47,48,49], to adopted the type of models for obtaining daily global solar radiation [50]. It shows good stability and plays an important application value in the fields of solar power, biology, agriculture, and the study of urban environmental comfort [51,52,53]. The digital model of solar radiation, such as the Solar Analyst [54,55], combined with geographic vector data, has a lot of conveniences for solar radiation simulation in different time intervals. At the same time, the acquisition of analog values and parameter correction in different areas is also easy to implement. To this end, the solar model provides an opportunity to accurately describe the solar radiation conditions of the plant growth environment. However, there are few reports on the prediction for sunshine tolerance of plant by digital model. In order to fill the deficiencies of the existing research and to provide a more practical method to predict the sunshine requirements of landscape plants for landscape architects, we propose a novel forecasting framework based on the Solar Analyst, and combined with instrument verification to test the accuracy and stability of the proposed framework. In this paper, we attempt to prove the following inferences:
  • A plant will show different health responses under different conditions of solar radiation, if the other ecological factors remain the same.
  • If properly calibrated, digital technology can be used to accurately simulate solar radiation.
  • If the preconditions are true, two-factor linear fitting between the plant health response and solar radiation can be used to obtain the healthy, sub-healthy, and unhealthy levels of landscape plants.
The rest of this paper is organized as follows: In Section 2, the materials and methodology are introduced, including the digital framework, study area and location, plant samples and data management, equipment and instruments, and verification of the results. Section 3 describes the results of this study and discusses some of the specific phenomena observed during the study. A summary of the research is provided in Section 4.

2. Materials and Methodology

2.1. Digital Framework

2.1.1. Structure and Workflow of the Digital Framework

In systems theory, a black-box model is used to solve complex system problems [56,57]. The main advantage of the black-box model is that we only focus on the “input” and “output” and not on the internal connections and changes in the system. As a result, it simplifies the procedure.
The healthy growth of plants is affected by many factors. The soil characteristics (including soil type, water content, pH, etc.), atmospheric temperature, and solar radiation are the most important factors. However, it is very difficult to analyze the response of urban plants to the various factors, especially in the natural environment. In order to solve this problem, we adopt the black-box model to analyze the fitting relationship between solar radiation and plant growth status (Figure 1), thereby predicting the sunshine requirements of the landscape plants.
In a small-scale urban environment, it is difficult to obtain statistics on solar radiation due to the variation of sunshine caused by buildings and the terrain. To this end, we adopt a digital approach combined with instrument measurements to obtain the amount of solar radiation in different time scales and at different heights. The instruments and equipment are listed in Section 2.4. In previous studies, we used and verified this approach in the form of a case study [20,21].
The plant health standard is a core part of this study, whereby we establish a systematic index system, which contains both qualitative and quantitative indicators for different plant types, as described in Section 2.1.3. At the exit of the digital framework, we can obtain the adaptability, sensitivity, relevance, etc. of the plant to different levels of solar radiation based on the results of the data fitting, and we can then verify the reliability of the method.

2.1.2. Solar Radiation Simulation and Correction

The solar radiation simulation shown in Figure 1 was derived in Solar Analyst, which is a spatial analysis module in the ArcGIS desktop software [58,59]. For the model setting, we consider the geographic latitude and altitude where the study area is located, but we also balance the computer run time and the simulation accuracy. The model parameter settings are shown in Table 1.
In order to make the simulation results closer to the local real values, we adopted a LightScout Quantum Meter (Model: QMSS-S, Spectrum Technologies USA Inc., Fort Worth, TX, USA) to carry out the solar radiation test at the sample site, and to correct the model’s output. The formula is as follows:
R s o l a r = R t e s t R s i m u l a t i o n R m o d e l
In this formula, R s o l a r represents the solar radiation of the plant canopy; R t e s t is the solar radiation of the test point, as measured by the LightScout Quantum Meter; R s i m u l a t i o n is the simulated sunshine radiation of the test point, as generated by the Solar Analyst model (ArcGIS software); and R m o d e l is the maximum value of the model simulation. The simulation process and results of the robust model are shown in Figure 2.
The wavelength of solar energy which can be used by plant photosynthetic activity is in the band range of approximately 300–800 nm, which is known as “photosynthetically active radiation” (PAR). Another means of measuring light quantity for plant growth involves discrete units of quantum flux in the PAR region called "photons". Photosynthetic Photon Flux (PPF) is commonly measured in units of micromoles per square meter per second (µmoles/m2·s). In this paper, in order to maintain the accuracy of the numerical conversion between model and instrument, we adopted 4.57 as the coefficient [60], from solar radiation ( W / m 2 ) to PAR (µmoles/m2·s).

2.1.3. Health Criteria to Determine the State of Plant Growth

Plants are living organisms, and it is thus difficult to determine whether they are healthy or not, especially for laypersons who are not horticulturalists or botanists. The health problems of plants that are caused by solar radiation can be divided into two main categories: excessive solar radiation and inadequate solar radiation. In the former case, the high sunshine intensity causes plant damage, such as leaf burn, dead branches (young shoots), and so on. In the latter case, the ornamental value of the plants is reduced, poor growth occurs, and even death, due to the lack of sunshine.
There is no existing uniform standard for judging the health of plants, although this has been addressed in some studies dedicated to the protection of old and famous trees [61,62] and in studies of urban tree health management [63,64]. The Visual Tree Assessment (VTA) method can also be used to describe the health of trees [65]. For the evaluation of plant health problems caused by inappropriate sunlight, a literature introduced the “contrast method of plant growth” between normal sunlight and restricted sunlight by means of the analysis of leaf morphology and total growth [66].
In this study, we used the following indicators to judge the health of landscape plants, covering three types of plants, i.e., trees, shrubs, and ground-cover plants. The health evaluation system focuses on the state of plant growth in response to different solar radiation levels, and was set as follows (Table 2).

2.1.4. Data Fitting and Predictive Analysis

In order to reveal the pattern of the plant response to solar radiation, we adopted SigmaPlot 12.5 (SYSTAT, San Jose, CA, USA), MS Excel 2016 (Microsoft Corporation, Redmond, WA, USA), and MATLAB 2014 (MathWorks, Natick, MA, USA) for the data fitting of the health levels of the landscape plants and the photosynthetic photon flux (PPF) of the plant environment. The value of PPF is derived from the solar radiation model, which is mainly located in the canopy of the sample plant. The simulated height is set to 6 m, 3 m and 0.5 m, respectively, for trees, shrubs and ground cover plants, as shown in Figure 2. We could then infer the adaptability of the landscape plants for solar radiation based on the results of the data fitting, including the shade tolerance, sensitivity to sunlight, and the correlation between the health level of the plant and solar radiation.

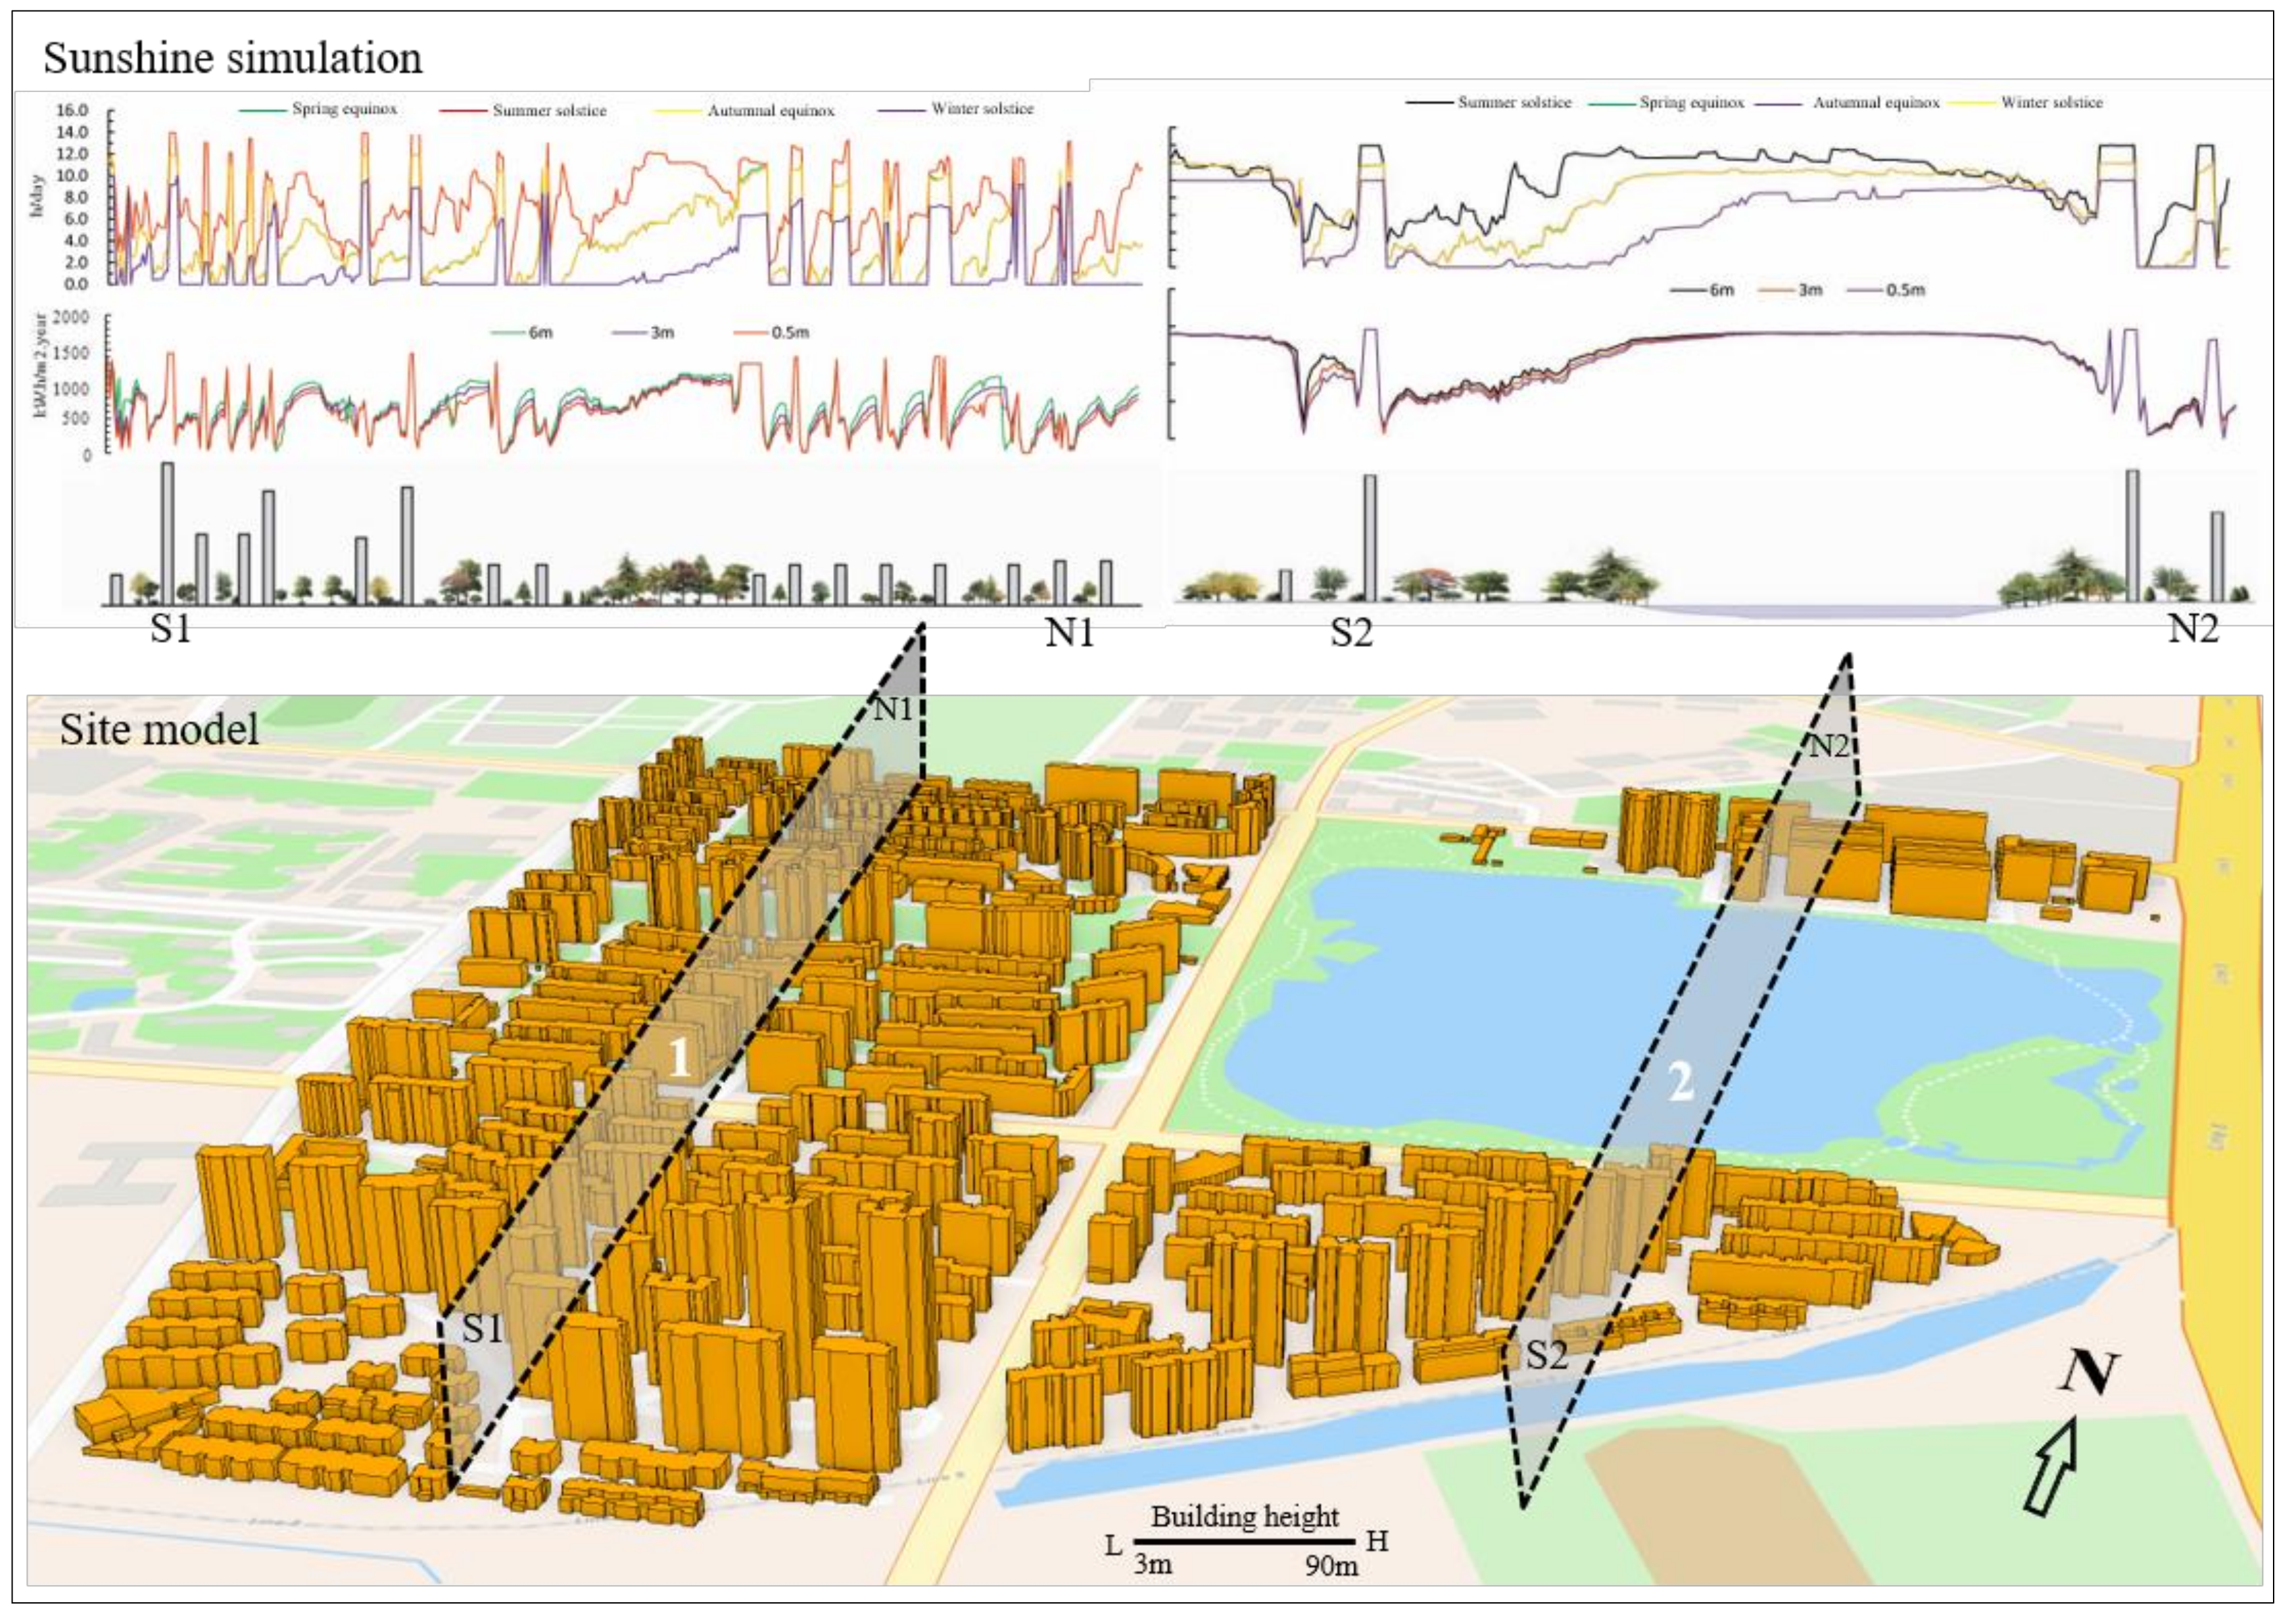
2.2. Study Area and Location

The city of Wuhan, central China, is located between latitude 29°58′–31°22′ N and longitude 113°41′–115°05′ E and is the capital of Hubei province. Wuhan features a subtropical monsoon humid climate, abundant rainfall, and adequate heat for plant growth. The annual average temperature is 15.8–17.5 °C, the frost-free period lasts from 211 to 272 days, there is abundant fresh water, and the city’s average annual rainfall is 1550–2050 mm. The above data and information are publicly available data from the Wuhan Bureau of Statistics website and Statistical Yearbooks. The study area consists of three residential areas, Jindi, Dahua, and Yayuan, and all plant samples are from this study area.

2.3. Plant Samples and Data Management

The sample survey was based on quadrats and serves as a plant community that includes both trees, shrubs, and ground-cover plants. The survey information was recorded and encoded in the form of digital photos. However, the sample positioning and the height of the plant canopy (trees or shrubs) are crucial in the processes of data collection, data normalization, and data management. To solve this problem, we adopted the measurement tools described in Section 2.4 and recorded the location data of the samples. The plant samples and data were managed in ArcGIS software after conversion between the MS Excel and GIS data tables, which is depicted in Figure 3.
In this research, we surveyed a total of 73 plant community quadrats, which covered 15 plant species and a total of 170 plant samples (Figure 3 and Table 3). The unified Latin names of the landscape plants in the samples were established using Flora of China (http://foc.eflora.cn/ (accessed on 25 February 2021)) and are used for the description of the plants in this study, as shown in Table 3.

2.4. Equipment, Instruments, and Techniques Used in the Study

The determination and analysis of the plant physiology, the determination of the geographical location of the plant samples, the simulation of solar radiation, and the correction of the model parameters are the core steps of this study. Therefore, a comprehensive application of various instruments, equipment, tools, and technologies was required for the completion of our research, as listed in Table 4.
We measured the photosynthetic rate of the sample plants using the LI-6400XT Portable Photosynthetic System on one fully expanded leaf from the newest leaf cohort of each plant obtained in the field surveys, and processed the labeled data indoors. For the chlorophyll content, handheld SPAD 502 are used to achieve these measurements. For the quantitative indicators, leaf color and the overall status of plant growth were mainly based on field imaging and laboratory judgments made by investigators and plant conservation staff. In addition, the number of dead branches (shrubs or small trees only) of the sample plants was recorded in the field. The determination of leaf area index (LAI) was also done in the field through the touch probe method. The level of soil exposure (SEL) is the percentage of exposed soil area with regard to the sample area, and is mainly used to analyze ground-cover plants or lawns. SEL was obtained through the MATLAB platform, using an image extraction technique.

3. Results and Discussion

3.1. Plant Health Level Response to Solar Radiation

The reason why the health level of landscape plants responds to solar radiation is that the amount of solar radiation flux determines the accumulation of photosynthetic substances, such as carbohydrates [67]. Therefore, the same plant in different solar radiation environments will show a different health status. The results depicted in Supplementary Materials show that there is a diverse range of health responses to solar radiation among the 15 species of landscape plants. Therefore, if the designer chooses different plant species for urban greening and forestry, this would increase the likelihood of plant health problems.
One obvious phenomenon is that the health of Podocarpus macrophyllus (Thunb.) D. Don and Aucuba japonica var. variegata D’Om-Brain is not affected by changes in solar radiation, based on our findings (no. 2 and no. 4 in Supplementary Materials), especially the PPF values of 16–120 μmol/m2·s and 9–325 μmol/m2·s, respectively. Therefore, it can be inferred that these plants have a wide range of applications for diverse solar radiation environments. Nevertheless, the literature [68] revealed that different solar radiation levels can affect root soil temperature and water content, thereby affecting plant growth. However, this factor is difficult to consider in a natural experiment. The small number of plant samples may also be an important reason for the two plant species, which will affect the fitted curve. In order to explore this linear law, the scope of investigation should be expanded in future research, even between different cities to obtain more sufficient data.
Cercis chinensis Bunge, Mahonia fortunei (Lindl.) Fedde, Nandina domestica Thunb., Ligustrum quihoui Carr., and Loropetalum chinense var. rubrum Yieh (nos. 1, 6, 7, 8, and 10 in Supplementary Materials) show more significant responses to changes in PPF. The five plant species show PPF thresholds of 78 μmol/m2·s, 78 μmol/m2·s, 10 μmol/m2·s, 150 μmol/m2·s, and 77 μmol/m2·s, respectively, for the transition from the sub-healthy to healthy status when the other ecological factors are the same. To this end, mapping the laws of health responses is very valuable information for adaptive plant selection and configuration based on the spatial pattern of solar radiation, especially when supported by digital technology, such as geographic information systems and decision support systems [20,21].
The health level is irregular in response to solar radiation for some plant species, such as Rhododendron simsii Planch., Euonymus japonicus var. alba-marginata T. Moore, Ophiopogon bodinieri Levl., and Zoysia matrella (L.) Merr., especially the transition from unhealthy to sub-healthy (nos. 9, 11, 13, and 15 in Supplementary Materials). For the above plants, the thresholds are 144 μmol/m2·s, 164 μmol/m2·s, 60 μmol/m2·s, and 208 μmol/m2·s, respectively, for the transition from sub-healthy to healthy status. Our results show that Ophiopogon bodinieri Levl. is more tolerant to shading, and Zoysia matrella (L.) Merr. needs more solar radiation to maintain vitality, because it belongs to the C4 Poaceae family and is considered a warm-season grass [69,70,71]. In the practice of adaptive planning of plants, these response characteristics can serve as the basic data for plant species selection and community configuration [72,73,74].

3.2. Plant Sensitivity to the Changes of Solar Radiation

We adopted the regression analysis method to reveal the sensitivity of landscape plants to PPF changes (Supplementary Materials, Figure 4 and Figure 5). In Supplementary Materials and Figure 5, linear regression models are applied for the 15 landscape plants between health levels and PPF. The R2 and slope values represent the degree of relevance and the sensitivity, respectively. At the same time, the positive and negative values of the slope indicate a positive or negative correlation, respectively, in Figure 4.
The results show that Mahonia fortunei (Lindl.) Fedde, Ligustrum quihoui Carr., and Rhododendron simsii Planch. are the top three most sensitive plants to changes in PPF (nos. 6, 8, and 9 in Supplementary Materials and Figure 4). Therefore, landscape architects should pay more attention to these plants, especially when the PPF is below 78 μmol/m2·s, 150 μmol/m2·s, and 144 μmol/m2·s, respectively, at which point the health status shifts from healthy to sub-healthy. In contrast, Podocarpus macrophyllus (Thunb.) D. Don and Aucuba japonica var. variegata D’Om-Brain are only slightly affected by the change in PPF, especially in the ranges of 16–120 μmol/m2·s and 9–325 μmol/m2·s, respectively (nos. 2 and 4 in Supplementary Materials). This means that both plants have a wide range of applications and are not limited by the solar radiation variation in urban areas. Meanwhile, for Aspidistra elatior Blume, Acer palmatum ‘Atropurpureum’, and Oxalis corymbosa DC., the slope of the linear fitting between health level and PPF is negative, which indicates that excessive solar radiation is unfavorable for their health. Related research has revealed that plant height, number of leaves, leaf blade length and width, leaf area, and fresh and dry weights of leaf are greatly increased in grown Aspidistra plants under shady conditions compared with those grown under full sunlight conditions [75]. From this, we can see that the above conclusion supports our fitting results for Aspidistra elatior Blume (Figure 6 and Supplementary Materials).
However, the effect of solar radiation on plant health is complex for some species. Therefore, our research attempted to reveal these response relationships through nonlinear fitting, as shown in Supplementary Materials. The results show that Aspidistra elatior Blume is a shade-loving plant species, and its health is not affected when the PPF of the planting environment is between 6–107 μmol/m2·s; however, when the PPF increases to 262 μmol/m2·s, the health status changes from healthy to sub-healthy. This conclusion has been confirmed in many other studies [75,76,77]. For other plants which are not shade-tolerant and cannot tolerate strong solar radiation, such as Acer palmatum ‘Atropurpureum’ and Oxalis corymbosa DC, the application scope of these plants is relatively narrow. However, planners could overcome this problem through solar analysis and then selecting adaptive plant species for urban greening [20].

3.3. Accuracy Analysis of the Forecasting Framework

In order to verify the accuracy of the digital forecasting framework, the LI-6400XT Portable Photosynthetic System was used for the field measurement of photosynthetic rate (Pn)-PAR response curves, and to obtain the values of LCP and LSP based on the different photosynthetic intensity settings of the red/blue LED light source, from 0 to 2000 μmol/m2·s. Our results show that the healthy level is higher than LCP, which are both much lower than LSP. However, the sub-healthy level is the survival line for landscape plants, which is more valuable for adaptive plant selection in practice. In addition, we cannot obtain the LCP and LSP data of Zoysia matrella (L.) Merr through the LI-6400XT, due to the fact that the leaves are too small to be measured by the needle chamber (2 × 6 cm). Our research indicates that the sub-healthy and healthy levels of Zoysia matrella (L.) Merr are higher (Figure 6). Therefore, this plant belongs to the sun-loving plant species, although some cultivars of zoysia grass have reported differences within a certain range of shading [78,79].
The sub-healthy level is higher than the healthy level for Aspidistra elatior Blume, which is able to tolerate extreme shading, even in a 6 μmol/m2·s PPF environment. Many studies have confirmed that the biomass of this species can be increased by reducing solar radiation [75,76,77], so it belongs to the shade-loving plant species. It is noteworthy that LCP is higher than the sub-healthy level for Cercis chinensis Bunge in Figure 6. The results reported by other scholars suggest that the LCP of this species is 31.98 μmol/m2·s [46]. From this, we can see that both the accuracy and stability of the LI-6400XT are greatly affected by the environment and the operator. Detailed comparison data are listed in Table 5. In addition, we found that the growth of Euonymus japonicus var. alba-marginata T. Moore was poorer than that of Euonymus japonicus (original species) at a PPF of 65 μmol/m2·s, and its sub-healthy and healthy levels are also higher than the original species, so we conclude that the lower chlorophyll content of the variegated leaf variety results in a decrease in its photosynthetic capacity [80,81]. Overall, our forecasting framework is relatively robust and can be used as an effective tool for the assessment of the solar radiation response of landscape plants.
Because of the ecological factors that affect plant health are diverse and can play a synergistic role. In this study, in order to verify the stability and reliability of our results, a comparison of the research is shown in Table 5, between our research and the results of others. The distribution of these experimental sites is located in the cities of Wuhan, Changsha, Nanjing and Chongqing, respectively. They have similar geographic latitudes and are used to eliminate interference from climatic and soil factors. The results show that the healthy level is much higher than the value of LCP, the sub-healthy level is also almost higher than the LCP, except Nandina domestica Thunb. and Mahonia fortunei (Lindl.) Fedde. In our research, it is found that the solar radiation of the planting site should meet the healthy level of landscape plants, so that its ecological functions and artistic effects can be better exerted. In practice, the value of healthy level can be converted into the percentage of total solar radiation, combined with GIS spatial analysis and the landscape plant database, techniques to achieve the goal of “right tree, right place” in future research. In contrast, the LCP and LSP data lack the practical values in the digital process of plant species selection and configuration for landscape architects.

4. Conclusions and Outlook

In this paper, a digital framework has been proposed to predict the sunshine requirements of landscape plants, combined with the digital simulation for solar radiation and some equipment. The results could be used for plant selection and configuration based on site adaptability, and could act as a basic reference for the practice of urban greening and sustainable urban forest management. The main innovation of this research is the introduction of a health standard system for landscape plants based on black-box thinking and digital technology. When combined with LI-6400XT validation, the results indicate that the digital framework has a good prediction accuracy and stability. From the comparison with the results of other scholars, we can see that the healthy level as an indicator used to test the solar radiation response of plants has more practical value than the LCP indicator, especially for the application of information technology in the future, such as intelligent decision support systems.
The biggest challenge for our research is to find more plant species and samples in different geographic latitudes and climate regions, and obtain their values of healthy level for sunshine requirements. In this study, we have predicted the sunshine demand values of 15 landscape plant species in the city of Wuhan, and proposed optimization strategies based on the site types, the annual total solar radiation, and growth status of plant (Figure 7). Under our technical guidance and suggestions, some dead landscape plants due to inappropriate sunshine in study areas, have been replaced with more adaptable plant species (Figure 8).
In natural planting sites, such as residential areas, the number of plant samples is often limited by many factors, which can affect the accuracy of the data fitting between the health responses of plants and solar radiation. Soil moisture is a very important factor for plant health. The reality is that our study cannot control this factor, to ensure absolute consistency for soil moisture. However, as a residential area with the complete irrigation facilities, we can assume the same soil conditions for study areas, especially in the case of a sufficiently large number of samples. In addition, we also found that the practical value of this research is greater in high latitude regions, because of the great changes in the solar altitude angle in a year. In our future research, we will collect more plant samples in similar geographic locations in built-up areas, and we will attempt to more accurately predict the healthy, sub-healthy, and unhealthy levels of a specific plant species. Furthermore, the solar radiation model reveals the distribution of plant species and plant diversity in urban built-up areas, which needs to be further explored.

Supplementary Materials

The following are available online at https://www.mdpi.com/2076-3417/11/5/2098/s1, Figure S1: study area; Figure S2: test location for the calibration of solar model; Figure S3: testing for PPF; Figure S4: Health level responses to Photosynthetic Photon Flux (PPF) in 15 landscape plants; Figure S5: Linear fitting between plant health level and solar radiation; Figure S6: Nonlinear fitting between plant health level and solar radiation. Table S1: sample screening; Table S2: linear model, and correlation coefficient (R2).

Author Contributions

For this research, H.W.: Conceptualization, Methodology, Software, Visualization, Data Acquisition and Analysis, Writing, and Funding Acquisition; W.J.: Data Acquisition; X.L.: Funding Acquisition, Reviewing and Editing; and B.H.: Conceptualization, Reviewing and Editing. All authors have read and agreed to the published version of the manuscript.

Funding

This research was funded by National Natural Science Foundation of China, grant number: 31860233 and 51579182.

Institutional Review Board Statement

Not applicable.

Informed Consent Statement

Not applicable.

Data Availability Statement

The data presented in this study are available on request from the corresponding author.

Acknowledgments

The authors would like to sincerely thank the editor and 4 anonymous reviewers for their comments and suggestions, which have greatly improved our manuscript.

Conflicts of Interest

The authors declare no conflict of interest.

References

  1. United Nations. World Population Prospects 2019. In Population Division; United Nations: New York, NY, USA, 2019. [Google Scholar]
  2. Zhou, X.; Wang, Y.-C. Spatial–temporal dynamics of urban green space in response to rapid urbanization and greening policies. Landsc. Urban Plan. 2011, 100, 268–277. [Google Scholar] [CrossRef]
  3. Wolch, J.R.; Byrne, J.; Newell, J.P. Urban green space, public health, and environmental justice: The challenge of making cities ‘just green enough’. Landsc. Urban Plan. 2014, 125, 234–244. [Google Scholar] [CrossRef] [Green Version]
  4. Kumar, M.; Gogoi, A.; Kumari, D.; Borah, R.; Das, P.; Mazumder, P.; Tyagi, V.K. Review of Perspective, Problems, Challenges, and Future Scenario of Metal Contami-nation in the Urban Environment. J. Hazard. Toxic Radioact. Waste 2017, 21, 04017007. [Google Scholar] [CrossRef]
  5. Rahman, M.M.; Haughton, G.; Jonas, A.E.G. The challenges of local environmental problems facing the urban poor in Chit-tagong, Bangladesh: A scale-sensitive analysis. Environ. Urban. 2010, 22, 561–578. [Google Scholar] [CrossRef] [Green Version]
  6. Zevenbergen, C.; Fu, D.; Pathirana, A. Transitioning to Sponge Cities: Challenges and Opportunities to Address Urban Water Problems in China. Water 2018, 10, 1230. [Google Scholar] [CrossRef] [Green Version]
  7. Teng, M.; Wu, C.; Zhou, Z.; Lord, E.; Zheng, Z. Multipurpose greenway planning for changing cities: A framework integrating priorities and a least-cost path model. Landsc. Urban Plan. 2011, 103, 1–14. [Google Scholar] [CrossRef]
  8. Filazzola, A.; Shrestha, N.; MacIvor, J.S. The contribution of constructed green infrastructure to urban biodiversity: A synthesis and meta-analysis. J. Appl. Ecol. 2019, 56, 2131–2143. [Google Scholar] [CrossRef]
  9. Erell, E. Urban Greening and Microclimate Modification. In Greening Cities; Springer: Singapore, 2017; pp. 73–93. [Google Scholar] [CrossRef]
  10. Duarte, D.H.; Shinzato, P.; Gusson, C.D.S.; Alves, C.A. The impact of vegetation on urban microclimate to counterbalance built density in a subtropical changing climate. Urban Clim. 2015, 14, 224–239. [Google Scholar] [CrossRef]
  11. Ferrini, F.; Fini, A.; Mori, J.; Gori, A. Role of Vegetation as a Mitigating Factor in the Urban Context. Sustainability 2020, 12, 4247. [Google Scholar] [CrossRef]
  12. Yli-Pelkonen, V.; Scott, A.A.; Viippola, V.; Setälä, H. Trees in urban parks and forests reduce O3, but not NO2 concentrations in Baltimore, MD, USA. Atmos. Environ. 2017, 167, 73–80. [Google Scholar] [CrossRef] [Green Version]
  13. Wang, X.; Teng, M.; Huang, C.; Zhou, Z.; Chen, X.; Xiang, Y. Canopy density effects on particulate matter attenuation coefficients in street canyons during summer in the Wuhan metropolitan area. Atmos. Environ. 2020, 240, 117739. [Google Scholar] [CrossRef]
  14. Chen, B.; Adimo, O.A.; Bao, Z. Assessment of aesthetic quality and multiple functions of urban green space from the users’ perspective: The case of Hangzhou Flower Garden, China. Landsc. Urban Plan. 2009, 93, 76–82. [Google Scholar] [CrossRef]
  15. Astell-Burt, T.; Feng, X.; Kolt, G.S. Mental health benefits of neighbourhood green space are stronger among physically active adults in middle-to-older age: Evidence from 260,061 Australians. Prev. Med. 2013, 57, 601–606. [Google Scholar] [CrossRef]
  16. Wan, C.; Shen, G.Q.; Choi, S. Effects of physical and psychological factors on users’ attitudes, use patterns, and perceived benefits toward urban parks. Urban For. Urban Green. 2020, 51, 126691. [Google Scholar] [CrossRef]
  17. Monteiro, M.V.; Handley, P.; Doick, K.J. An insight to the current state and sustainability of urban forests across Great Britain based on i-Tree Eco surveys. Forestry 2019, 93, 107–123. [Google Scholar] [CrossRef]
  18. Duinker, P.N.; Ordóñez, C.; Steenberg, J.W.N.; Miller, K.H.; Toni, S.A.; Nitoslawski, S.A. Trees in Canadian Cities: Indispensable Life Form for Urban Sustainability. Sustainability 2015, 7, 7379–7396. [Google Scholar] [CrossRef] [Green Version]
  19. Kirnbauer, M.C.; Kenney, W.A.; Churchill, C.J.; Baetz, B.W. A prototype decision support system for sustainable urban tree planting pro-grams. Urban For. Urban Green. 2009, 8, 3–19. [Google Scholar] [CrossRef]
  20. Wei, H.; Huang, Z. From Experience-Oriented to Quantity-Based: A Method for Landscape Plant Selection and Configuration in Urban Built-Up Areas. J. Sustain. For. 2015, 34, 698–719. [Google Scholar] [CrossRef]
  21. Wei, H.; Huang, Z.; Lin, M. A Decision Support System for Plant Optimization in Urban Areas with Diversified Solar Radiation. Sustainability 2017, 9, 215. [Google Scholar] [CrossRef] [Green Version]
  22. Minckler, L.S. The right tree in the right place. J. For. 1941, 39, 685–688. [Google Scholar]
  23. Bassuk, N. Recommended Urban Trees: Site Assessment and Tree Selection for Stress Tolerance; Cornell University, Urban Horticulture Institute: Ithaca, NY, USA, 2003. [Google Scholar]
  24. Sæbø, A.; Benedikz, T.; Randrup, T.B. Selection of trees for urban forestry in the Nordic countries. Urban For. Urban Green. 2003, 2, 101–114. [Google Scholar] [CrossRef] [Green Version]
  25. Sæbø, A.; Borzan, Ž.; Ducatillion, C.; Hatzistathis, A.; Lagerström, T.; Supuka, J.; Garcia-Valdecantos, J.L.; Rego, F.; Van Slycken, J. The Selection of Plant Materials for Street Trees, Park Trees and Urban Woodland. In Urban Forests and Trees; Springer: Berlin/Heidelberg, Germany, 2005; pp. 257–280. [Google Scholar] [CrossRef]
  26. Fini, A.; Ferrini, F.; Di Ferdinando, M.; Brunetti, C.; Giordano, C.; Gerini, F.; Tattini, M. Acclimation to partial shading or full sunlight determines the performance of container-grown Fraxinus ornus to subsequent drought stress. Urban For. Urban Green. 2014, 13, 63–70. [Google Scholar] [CrossRef]
  27. Fini, A.; Frangi, P.; Mori, J.; Donzelli, D.; Ferrini, F. Nature based solutions to mitigate soil sealing in urban areas: Results from a 4-year study comparing permeable, porous, and impermeable pavements. Environ. Res. 2017, 156, 443–454. [Google Scholar] [CrossRef]
  28. SULIS. Selecting Plants for an Upper Midwest Landscape. Available online: https://www.extension.umn.edu/garden/landscaping/plant/ (accessed on 25 February 2021).
  29. Hansen, S.M.; Gunnell, J.; Whaley, A.; Dai, X.; Harding, C.; Black, B.L. Adaptability of Tree Species as Windbreaks for Urban Farms in the US Inter-mountain West. Horticulturae 2020, 6, 17. [Google Scholar] [CrossRef] [Green Version]
  30. Wilson, M. Smart Trees and Shrubs Suitable for Michigan Landscapes. Available online: https://www.canr.msu.edu/news/smart_trees_and_shrubs_for_michigan_landscapes (accessed on 25 February 2021).
  31. Yu, B.; Liu, H.; Wu, J.; Lin, W.-M. Investigating impacts of urban morphology on spatio-temporal variations of solar radiation with airborne LIDAR data and a solar flux model: A case study of downtown Houston. Int. J. Remote Sens. 2009, 30, 4359–4385. [Google Scholar] [CrossRef]
  32. Vogt, J.; Gillner, S.; Hofmann, M.; Tharang, A.; Dettmann, S.; Gerstenberg, T.; Schmidt, C.; Gebauer, H.; Van De Riet, K.; Berger, U.; et al. Citree: A database supporting tree selection for urban areas in temperate climate. Landsc. Urban Plan. 2017, 157, 14–25. [Google Scholar] [CrossRef]
  33. Grant, S. The Right Tree in the Right Place: Using GIS to Maximize the Net Benefits from Urban Forests. Master’s Thesis, Lunds Universitet, Lund, Sweden, 2016. [Google Scholar]
  34. Ishida, A.; Nakano, T.; Matsumoto, Y.; Sakoda, M.; Ang, L.H. Diurnal changes in leaf gas exchange and chlorophyll fluorescence in tropical tree species with contrasting light requirements. Ecol. Res. 1999, 14, 77–88. [Google Scholar] [CrossRef]
  35. Toledo-Aceves, T.; Swaine, M.D. Biomass allocation and photosynthetic responses of lianas and pioneer tree seedlings to light. Acta Oecol. 2008, 34, 38–49. [Google Scholar] [CrossRef]
  36. Diekmann, M. Ecological behaviour of deciduous hardwood trees in Boreo-nemoral Sweden in relation to light and soil con-ditions. For. Ecol. Manag. 1996, 86, 1–14. [Google Scholar] [CrossRef]
  37. Carter, R.; Klinka, K. Variation in shade tolerance of Douglas fir, western hemlock, and western red cedar in coastal British Columbia. For. Ecol. Manag. 1992, 55, 87–105. [Google Scholar] [CrossRef]
  38. Henry, H.A.L.; Aarssen, L.W. Inter- and intraspecific relationships between shade tolerance and shade avoidance in temperate trees. Oikos 2001, 93, 477–487. [Google Scholar] [CrossRef]
  39. Huang, D.; Wu, L.; Chen, J.R.; Dong, L. Morphological plasticity, photosynthesis and chlorophyll fluorescence of Athyrium pachyphlebium at different shade levels. Photosynthetica 2011, 49, 611–618. [Google Scholar] [CrossRef]
  40. Zhao, D.; Hao, Z.; Tao, J. Effects of shade on plant growth and flower quality in the herbaceous peony (Paeonia lactiflora Pall.). Plant Physiol. Biochem. 2012, 61, 187–196. [Google Scholar] [CrossRef] [PubMed]
  41. Wang, Y.; Ma, W. Comparative studies on light utilization characteristics and shade tolerance of 7 climbing shrub species. For. Res. 2004, 17, 305–308. [Google Scholar]
  42. Qi, X.X.; Jiang, Y.S.; Wei, X.; Tang, H.; Xiong, Z.C.; Ye, W.H.; Wang, Z.M. Photosynthetic Characteristic of an Endangered Species Camellia Nitidissima and Its Con-servation Implications. Pakistan. J. Bot. 2012, 44, 327–331. [Google Scholar]
  43. Lin, S.; Zhang, Q.; Chen, Q. Shade-tolerance of ten species of garden plants. J. Northeast For. Univ. 2007, 35, 32–34. [Google Scholar]
  44. Yin, L. Research of Shaded Green Space Landscape Based on Natural Light Environment under the Urban Viaducts—Case Study on Viaducts in Wuhan City; Huazhong University of Science and Technology: Wuhan, China, 2012. [Google Scholar]
  45. Xia, L. Study on Eco-Photosynthetic Characteristics and Ecological Effects of Common Landscape Plants in Chongqing, China; SouthWest University: Chongqing, China, 2011. [Google Scholar]
  46. Chen, Y.; Liao, J.; Qin, S. Studies on photosynthetic characteristics and carbon fixation and oxygen release capabilities of 19 garden plants in Changsha area. J. Cent. S. Univ. For. Technol. 2012, 10, 116–120. [Google Scholar]
  47. Kambezidis, H.D.; Adamopoulos, A.D.; Sakellariou, N.K.; Pavlopoulos, H.G.; Aguiar, R.; Bilbao, J.; de Miguel, A.; Negro, E. The “Meteorological Radiation Model”. Mech.-Electr. Eng. 1998, 3, 38–42. [Google Scholar]
  48. Kambezidis, H.; Psiloglou, B.; Karagiannis, D.; Dumka, U.; Kaskaoutis, D. Recent improvements of the Meteorological Radiation Model for solar irradiance estimates under all-sky conditions. Renew. Energy 2016, 93, 142–158. [Google Scholar] [CrossRef]
  49. Kambezidis, H.D. Solar Radiation Modelling: The Latest Version and Capabilities of MRM. J. Fundam. Renew. Energy Appl. 2017, 7. [Google Scholar] [CrossRef] [Green Version]
  50. Kambezidis, H.D. The solar radiation climate of Athens: Variations and tendencies in the period 1992–2017, the brightening era. Sol. Energy 2018, 173, 328–347. [Google Scholar] [CrossRef]
  51. Kambezidis, H.D.; Psiloglou, B.E.; Kaskaoutis, D.G.; Karagiannis, D.; Petrinoli, K.; Gavriil, A.; Kavadias, K. Generation of typical meteorological years for 33 locations in Greece: Adaptation to the needs of various applications. Theor. Appl. Clim. 2020, 141, 1313–1330. [Google Scholar] [CrossRef]
  52. Kambezidis, H.D. Climate Change and Thermal Comfort in Greece. Climate 2021, 9, 10. [Google Scholar] [CrossRef]
  53. Kambezidis, H.D.; Psiloglou, B.E.; Kavadias, K.A.; Paliatsos, A.G.; Bartzokas, A. Development of a Greek solar map based on solar model estimations. Sun Geosph. 2016, 11, 137–141. [Google Scholar]
  54. Radosevic, N.; Duckham, M.; Liu, G.J.; Sun, Q. Solar radiation modeling with KNIME and Solar Analyst: Increasing environ-mental model reproducibility using scientific workflows. Environ. Model. Softw. 2020, 132, 104780. [Google Scholar] [CrossRef]
  55. Chow, A.; Fung, A.S.; Li, S. GIS Modeling of Solar Neighborhood Potential at a Fine Spatiotemporal Resolution. Buildings 2014, 4, 195–206. [Google Scholar] [CrossRef]
  56. Peitsman, H.C.; Bakker, V.E. Application of Black-Box Models to HVAC Systems for Fault Detection; American Society of Heating, Refrigerating and Air-Conditioning Engineers: Atlanta, GA, USA, 1996. [Google Scholar]
  57. Ljung, L. Black-box models from input-output measurements. In Proceedings of the 18th IEEE instrumentation and measurement technology conference, Budapest, Hungary, 21–23 May 2001; Volume 1, pp. 138–146. [Google Scholar] [CrossRef] [Green Version]
  58. Huang, S.; Fu, P. Modeling Small Areas Is a Big Challenge. ESRI ArcUser 2009, 2831, 2013. [Google Scholar]
  59. Fu, P.; Rich, P.M. Design and implementation of the Solar Analyst: An ArcView extension for modeling solar radiation at landscape scales. In Proceedings of the Nineteenth Annual ESRI User Conference, San Diego, CA, USA; 1999; pp. 1–31. [Google Scholar]
  60. Environmental Growth Chambers. Lighting Radiation Conversion. Available online: http://www.egc.com/useful_info_lighting.php (accessed on 25 February 2021).
  61. Liu, Y. Assessment on Ancient Trees Health on Basis of Morphological Characteristics in Beijing; Beijing Forestry University: Beijing, China, 2013. [Google Scholar]
  62. Chen, J. Health Assessment of Ancient Trees in Beijing; Beijing Forestry University: Beijing, China, 2014. [Google Scholar]
  63. Bond, J. Urban Tree Health: A Practical and Precise Estimation Method; Urban Forest Analytics LLC: Geneva, NY, USA, 2012. [Google Scholar]
  64. Winn, M.F.; Lee, S.-M.; Araman, P.A. Urban tree crown health assessment system: A tool for communities and citizen foresters. In Proceedings of the Emerging Issues Along Urban-Rural Interfaces II: Linking Land-Use Science and Society, Atlanta, GA, USA, 9–12 April 2007; pp. 180–183. [Google Scholar]
  65. Mattheck, C.; Breloer, H. Field guide for visual tree assessment (VTA). Arboric. J. 1994, 18, 1–23. [Google Scholar] [CrossRef]
  66. Chen, M.; Fu, H. A study on the environment of the viaduct shadow and its influence on the plant growth. Chin. Landsc. Archit. 2006, 09, 68–72. [Google Scholar]
  67. Bianculli, M.L.; Aguirrezábal, L.A.; Irujo, G.A.P.; Echarte, M.M. Contribution of incident solar radiation on leaves and pods to soybean seed weight and composition. Eur. J. Agron. 2016, 77, 1–9. [Google Scholar] [CrossRef]
  68. Díaz-Pérez, J.C. Bell Pepper (Capsicum annum L.) Crop as Affected by Shade Level: Microenvironment, Plant Growth, Leaf Gas Exchange, and Leaf Mineral Nutrient Concentration. HortScience 2013, 48, 175–182. [Google Scholar] [CrossRef] [Green Version]
  69. Cope, T.; Gray, A. Grasses of the British Isles; Botanical Society of the British Isles: London, UK, 2009; pp. 18–19. [Google Scholar]
  70. Kephart, K.D.; Buxton, D.R.; Taylor, S.E. Growth of C3 and C4 Perennial Grasses under Reduced Irradiance. Crop Sci. 1992, 32, 1033–1038. [Google Scholar] [CrossRef]
  71. Kephart, K.D.; Buxton, D.R. Forage Quality Responses of C3 and C4 Perennial Grasses to Shade. Crop Sci. 1993, 33, 831–837. [Google Scholar] [CrossRef]
  72. Wei, H. An Intelligent Decision-Making Method for Landscape Plant Selection Based on Their Habits of Sunshine Requirements; Wuhan University: Wuhan, China, 2016. [Google Scholar]
  73. Wei, H.; Liu, X.; Chen, X.; Liu, J.; Zhang, G. The Urban Environment with Diversified Solar Radiation and Adaptive Planning Strategies for Landscap Plants. J. Jiangxi Norm. Univ. 2019, 43, 433–440. [Google Scholar]
  74. Wei, H.; Huang, Z.; Liu, X. UP-DSS: A Decision Support System for Landscape Plant Selection and Community Configuration Based on Sunshine Adaptability. J. Jianghan Univ. 2019, 47, 258–264. [Google Scholar]
  75. Youssef, A.; Mady, M. Influence of light intensity and benzyladenine on growth performance of Aspidistra elatior Blume plant. Res. J. Agric. Biol. Sci. 2013, 9, 248–257. [Google Scholar]
  76. Stamps, R.H. Effects of Shade Level and Fertilizer Rate on Yield and Vase Life of Aspidistra elatior ‘Variegata’ Leaves. J. Environ. Hortic. 1995, 13, 137–139. [Google Scholar] [CrossRef]
  77. Stamps, R.; Chandler, A. International Symposium on Cultivation and Utilization of Asian; ISHS: Seoul, Korea, 2006; pp. 169–176. [Google Scholar]
  78. Trappe, J.M.; Karcher, D.E.; Richardson, M.D.; Patton, A.J. Shade and Traffic Tolerance Varies for Bermudagrass and Zoysiagrass Cultivars. Crop Sci. 2011, 51, 870–877. [Google Scholar] [CrossRef]
  79. Sladek, B.S.; Henry, G.M.; Auld, D.L. Evaluation of Zoysiagrass Genotypes for Shade Tolerance. HortScience 2009, 44, 1447–1451. [Google Scholar] [CrossRef] [Green Version]
  80. Raveh, E.; Wang, N.; Nobel, P.S. Gas exchange and metabolite fluctuations in green and yellow bands of variegated leaves of the monocotyledonous CAM species Agave americana. Physiol. Plant. 1998, 103, 99–106. [Google Scholar] [CrossRef]
  81. Zhang, Q.; Zhang, M.; Ding, Y.; Zhou, P.; Fang, Y. Composition of photosynthetic pigments and photosynthetic characteristics in green and yellow sectors of the variegated Aucuba japonica ‘Variegata’ leaves. Flora—Morphol. Distrib. Funct. Ecol. Plants 2018, 240, 25–33. [Google Scholar] [CrossRef]
Figure 1. The structure and workflow of the digital framework.
Applsci 11 02098 g001
Figure 2. Dynamic simulation of “Site-Plant-Sunshine” at three canopy heights in different seasons.
Applsci 11 02098 g002
Figure 3. Sample distribution and data management based on ArcGIS.
Applsci 11 02098 g003
Figure 4. Slope ranking of the linear models in the 15 landscape plant species.
Applsci 11 02098 g004
Figure 5. The ranking of the correlation coefficients (R2) for the 15 landscape plant species.
Applsci 11 02098 g005
Figure 6. Numerical comparison between LCP-LSP and the sub-healthy and healthy levels, as measured by LI-6400XT and forecast by our digital framework, respectively.
Applsci 11 02098 g006
Figure 7. Optimization for landscape plant selection and community configuration based on the site types and solar simulation.
Applsci 11 02098 g007
Figure 8. Planting areas for Zoysia matrella (L.) Merr., which was replaced with Ophiopogon bodinieri Levl.
Applsci 11 02098 g008
Table 1. Parameter settings for the solar simulation in ArcGIS Solar Analyst [20].
NameDescriptionNameDescription
Slope/aspectFlat surfaceBuilding heightN * 3.3 m
Time period2014 (whole year/average daily)Building grid size0.5 * 0.5
Latitude30.5° NTransmittance0.5
Sky size200 * 200Hour interval0.5
Proportion of diffuse radiation0.3Calculation directions32
Table 2. Health standard system used to determine the state of plant growth.
MethodIndicatorHealth LevelsDescription
Healthy (H)Sub-Healthy (S-H)Unhealthy (U-H)
Appearance judgmentLeaf colorNormalYellowed (parts of colorful plants turn green)Brown (for the growing season)Experience-based judgment
Dead branch rate (DBR)DBR ≤ 30%30% < DBR ≤ 50%DBR > 50%Quantitative calculation
Comprehensive status of plant growth (CSPG)ExuberSantWeakVery weak or witheredExperience-based judgment
Soil exposure level (SEL)SEL ≤ 10%10% < SEL ≤ 50%SEL > 50%Quantitative calculation
Physiological testsPhotosynthetic rate (PR)PR ± normal value × 10%PR ≥ normal value × 50%PR < normal value × 50%Quantitative calculation
Chlorophyll content (CC)CC ± normal value × 10%CC ≥ normal value × 50%CC < normal value × 50%Quantitative calculation
OtherLeaf area index (LAI)LAI ≥ normal value × 90%Normal value * 90% < LAI ≤ normal value × 50%LAI < normal value × 50%Quantitative calculation
Note: ‘normal values’ are the values of the comparative samples, which are plants under normal conditions.
Table 3. Description of the landscape plant samples.
Scientific Name of the Plant Samples (Latin Name)Number of SamplesFeatures
Type-1Type-2
TreeShrubGround-Cover PlantEvergreenDeciduous
Cercis chinensis Bunge7× ×
Podocarpus macrophyllus (Thunb.) D. Don5× ×
Acer palmatum ‘Atropurpureum’6× ×
Aucuba japonica var. variegata D’Om-Brain8 × ×
Fatsia japonica (Thunb.) Decne. et Planch.8 × ×
Mahonia fortunei (Lindl.) Fedde8 × ×
Nandina domestica Thunb.6 × ×
Ligustrum quihoui Carr.16 × ×
Rhododendron simsii Planch.19 × ×
Loropetalum chinense var. rubrum Yieh14 × ×
Euonymus japonicus var. alba-marginata T. Moore14 × ×
Aspidistra elatior Blume7 ××
Ophiopogon bodinieri Levl.19 ××
Oxalis corymbosa DC.8 ××
Zoysia matrella (L.) Merr.25 ××
Table 4. Equipment and techniques were used in this study.
FunctionSpecific Name
· Recording and drawing· Sample survey form, image maps of the study area
· Image acquisition· Digital camera (Nikon COOLPIX S8100), smartphone
· Measurement and analysis of physiological indices· LI-6400XT Portable Photosynthetic System (Li-Cor Inc.)
· SPAD 502 Plus Chlorophyll Meter
· Measurement of environmental light· LightScout Quantum Meter (Spectrum Technologies USA Inc., model: QMSS-S)
· Simulation and analysis of solar radiation· Solar Analyst model, ArcGIS 10.2 for desktop, ESRI.
· Distance measurement and parameter correction· Total station
· Tape measure
Table 5. Comparison between the results of our research and studies of other scholars.
Scientific Name
of Plant
LCP (μmole/m2·s)Data of this Research [72]
Data-1 [44]
Wuhan
Data-2 [46]
Changsha
Data-3 [43]
Nanjing
Data-4 [45]
Chongqing
Sub-HealthyHealthy
Fatsia japonica (Thunb.) Decne. et Planch.8.918------1138
Loropetalum chinense var. rubrum Yieh---82327.340120
Rhododendron simsii Planch.22.9716---32.2749153
Euonymus japonicus var. alba-marginata T. Moore23---------144295
Nandina domestica Thunb.17.68---------1038
Mahonia fortunei (Lindl.) Fedde42.29---------31110
Cercis chinensis Bunge---31.98------48321
Aucuba japonica var. variegata D’Om-Brain---8---------9
Note: ‘LCP’ is the abbreviation of light compensation point, and the symbol ‘---’ indicates no data.
Publisher’s Note: MDPI stays neutral with regard to jurisdictional claims in published maps and institutional affiliations.

