Article

Notch Fracture in Polymeric Specimens under Compressive Stresses: The Role of the Equivalent Material Concept in Estimating the Critical Stress of Polymers

1
Fracture Research Laboratory, Faculty of New Science and Technologies, University of Tehran, Tehran 16846, Iran
2
Fatigue and Fracture Research Laboratory, Center of Excellence in Experimental Solid Mechanics and Dynamics, School of Mechanical Engineering, Iran University of Science and Technology, Narmak, Tehran 16846, Iran
3
Laboratory of Materials Science and Engineering (LADICIM), University of Cantabria, E.T.S. de Ingenieros de Caminos, Canales y Puertos, Av/Los Castros 44, 39005 Santander, Spain
*
Authors to whom correspondence should be addressed.
Appl. Sci. 2021, 11(5), 2104; https://doi.org/10.3390/app11052104
Submission received: 1 February 2021 / Revised: 22 February 2021 / Accepted: 23 February 2021 / Published: 27 February 2021
(This article belongs to the Section Materials Science and Engineering)

Abstract

:
In this paper, the fracture of notched polymeric specimens under compressive stresses was investigated both experimentally and theoretically. In the experimental section, to determine the load-carrying capacity (LCC) of U-notched specimens made of general-purpose polystyrene (GPPS) and polymethyl-methacrylate (PMMA) polymers, tests were performed on notched square samples under compression, i.e., negative mode I loading. In the observation of the nonlinear behavior of the two polymers in the standard compressive tests, for the first time, the equivalent material concept (EMC) was used under compressive loading to theoretically estimate the critical stresses of the two polymers, which were shown to be significantly different from the ultimate strengths obtained from the standard compression tests. By linking the EMC to the maximum tangential stress (MTS) and mean stress (MS) criteria, the LCC of the notched specimens was predicted. The outcomes are twofold: First, MTS, MS, EMC–MTS, and EMC–MS criteria provide accurate predictions of the experimental critical loads observed in the U-notched polymeric specimens; second, the combination of the EMC with the MTS and MS criteria, allow such predictions to be obtained without any need for experimental calibration.

1. Introduction

The presence of discontinuities such as cracks and notches in structures leads to stress concentrations that increase the risk of failure under different kinds of loading condition, and significantly reducing the corresponding structural strength. Sometimes, the presence of these defects is unavoidable due, for example, to the manufacturing process of the material or the need for certain structural details (e.g., welds). Therefore, great attention has been paid by many researchers to studying the fracture behavior of components containing defects.
Most of the research dealing with the fracture of cracked or notched components has been performed under mode I and mixed mode I/II loading conditions, where fracture is caused by local tensile stresses. Under such conditions, physical aspects of failure are analogous between cracked and notched components, beyond the evident relaxation of the stress field when moving from cracked to notched conditions. However, under compressive stresses, defects experience closing mode loading, also known as negative mode I loading, and there is a greater difference between the behavior of components in cracked and notched conditions. In fact, when the cracked component is subjected to negative mode I loading, the crack faces contact each other and the crack mouth does not open. Consequently, crack growth is not expected. Conversely, in the case of notched components, the probability of contact between the notch faces is related to the distance between them, and a fracture may be expected because of damage nucleation and propagation from the notch tip.
Many researchers have investigated the fracture of notched components with different notch geometries. However, U- and V-shaped notches have been studied much more than the others due to their extensive engineering applications. Several papers have been published in the literature dealing with brittle fracture of U- and V-notched components under pure mode I and pure mode II loadings (e.g., [1,2,3,4,5,6,7,8,9]), as well as under mixed mode I/II loading (e.g., [10,11,12,13,14,15,16]). Different stress-based and energy-based failure criteria have been applied in these works for estimating the brittle fracture conditions in a wide variety of materials containing notches, generating estimations of their corresponding load-carrying capacity (LCC).
Nowadays, polymers are used increasingly in different engineering and industrial applications. These applications for polymeric materials are possible because of their satisfactory physical, mechanical, thermal, and chemical properties [17]. In engineering structures, polymeric components are usually subjected to mechanical and/or thermal loadings, and the prediction of their LCC requires their mechanical properties to be known. One of the main mechanical properties that is used for evaluating the fracture of polymeric components is the fracture toughness, which must be accurately specified. Since polymeric components in engineering structures may contain notches of various shapes, the resulting stress concentrations may cause their ultimate fracture. Therefore, it is important to evaluate the strength of notched polymeric components against fracture. This subject is studied nowadays by means of notch fracture mechanics (NFM).
The mechanical behavior of brittle polymeric components has been studied in various research works in the presence of cracks and notches (e.g., [18,19,20,21]). Polymethyl-methacrylate (PMMA) and general-purpose polystyrene (GPPS) are two commercial polymers whose fracture behaviors in the presence of different notches have already been investigated under various loading conditions [5,6,22,23].
Regarding a literature survey of the brittle fracture of notched components under compression, it should be mentioned that the first research works were conducted before 2000 (e.g., [24,25,26,27,28,29,30]). Afterwards, Berto et al. [31] returned to the research of this topic and performed numerous fracture experiments on rectangular graphite specimens containing double V-notches with end holes (VO-notches) under pure compression, and recorded the fracture loads of the specimens. By means of the strain energy density (SED) criterion, they could successfully estimate the observed experimental fracture loads. Torabi and Ayatollahi [32] used point stress (PS) and mean stress (MS) criteria to estimate the fracture loads reported in [31]. Ayatollahi et al. published a paper [33] on the compressive fracture of PMMA weakened by round-tip V-notches. They proposed two new test specimens for fracture testing under compression, and could predict the fracture loads using stress-based fracture criteria.
A few papers have also been published recently analyzing the brittle fracture of round-tip V-notched [34], key-hole notched [35], and VO-notched [36] specimens made of PMMA and GPPS polymers under mixed mode I/II loading with negative mode I contributions. These references report that two distinct areas form on the notch blunt border under tensile and compressive stresses, with the polymeric specimens breaking from the tensile side, given that the compressive critical stresses for these materials are significantly greater than the tensile ones.
Bura et al. [37] have recently performed compressive fracture tests on PMMA plane specimens containing sharp V-notches, blunt V-notches, and U-notches, and recording the deformations and fracture processes during loading/unloading process using a high-speed camera. Various fracture initiation points were indicated and discussed in this reference. It should be emphasized that the work reported in [37] is purely experimental, and no theoretical/numerical fracture prediction was performed.
The mechanical properties of polymers, especially their fracture toughness, depend significantly on whether or not they are able to develop ductile (i.e., non-linear) processes. Recently, a novel concept, the so-called the equivalent material concept (EMC), has been proposed by Torabi [38] and employed in several works as a simple method to predict the failure of notched/cracked ductile materials with nonlinear behavior, using linear-elastic approaches. This concept has been successfully used in conjunction with traditional linear elastic fracture mechanics (LEFM) criteria to estimate the non-linear fracture of components containing different kinds of defects (e.g., [38,39,40,41,42,43,44]).
In the present work, and for the first time, the fracture of U-notched polymeric components under negative mode I loading was investigated, both experimentally and theoretically. The critical loads of U-notched specimens made of general-purpose polystyrene (GPPS) and polymethyl-methacrylate (PMMA) were experimentally obtained under compressive loading. In the theoretical section, two brittle fracture criteria, namely the maximum tangential stress (MTS) and mean stress (MS) criteria, are described as engineering methodologies to predict the load-carrying capacity (LCC) of the polymeric specimens being tested. These approaches require previous time-consuming experimental calibration, but a comparison of the experimental results with the theoretical predictions derived from the two criteria showed that they could both accurately predict the LCC of the notched specimens. With the aim of avoiding any complex calibration processes, yet providing good LCC estimations, and due to the non-linear behavior of the polymers being analyzed, the equivalent material concept (EMC) was used for the first time under compressive loading to compute the critical stress of the two polymers and to predict the LCC of the U-notched specimens. It was found that the combination of the EMC with MTS and MS criteria also provides excellent predictions of the experimental critical loads.

2. Materials and Methods

2.1. Materials

As mentioned above, the main aim of this work was to analyze the fracture behavior of U-notched quasi-brittle polymers under compressive stresses. Therefore, the well-known PMMA and GPPS polymers were selected and tested. Generally, these two polymers have a brittle behavior, with negligible plastic (non-linear) deformations at room temperature during tensile loading. However, a considerable amount of plastic deformations has been reported for the standard un-notched PMMA and GPPS specimens during compression tests.
In order to determine the compressive properties of the polymers selected, compression tests were conducted on the standard specimens based on standard ASTM D695-10 [45].

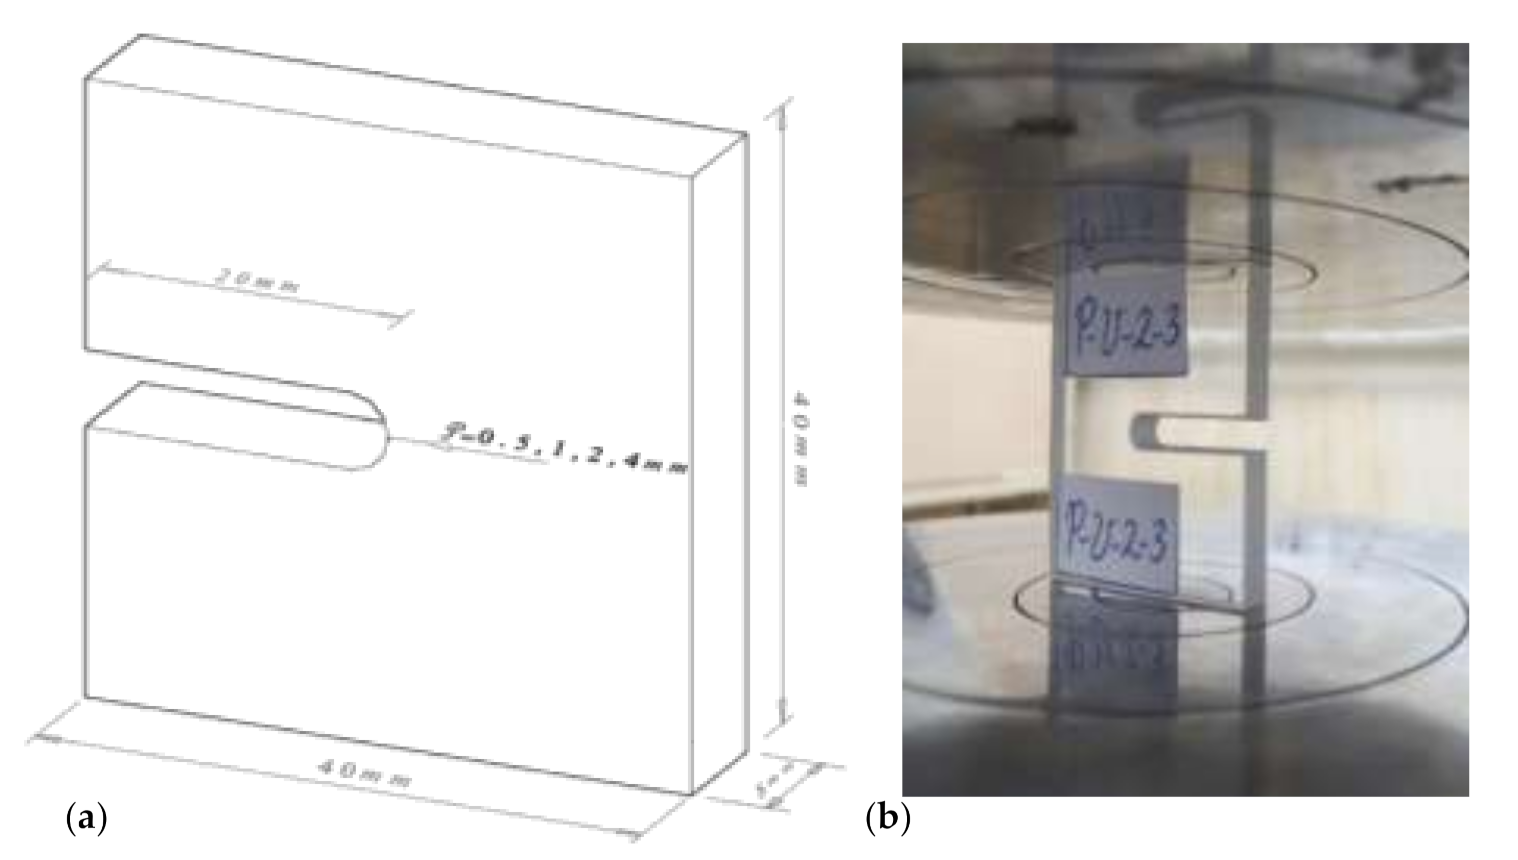
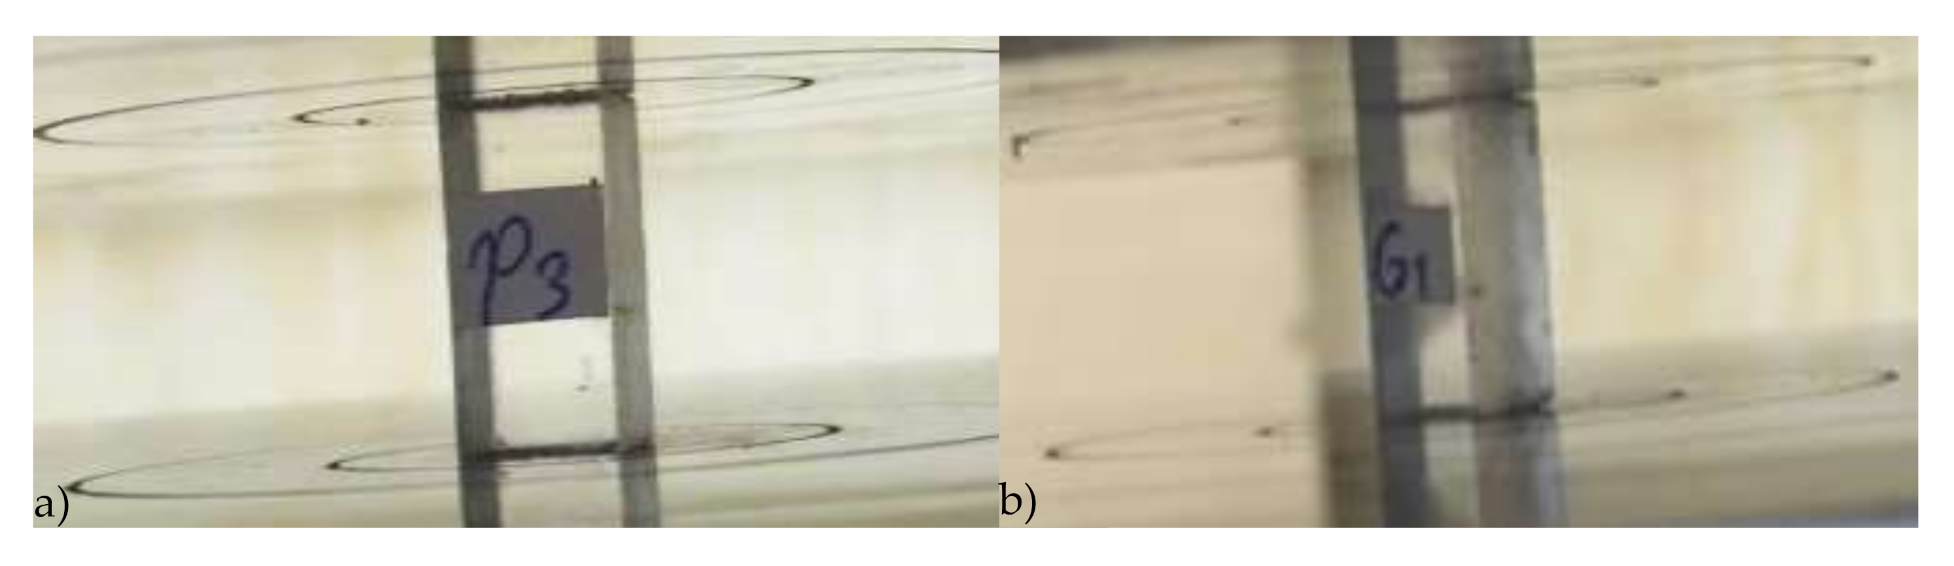
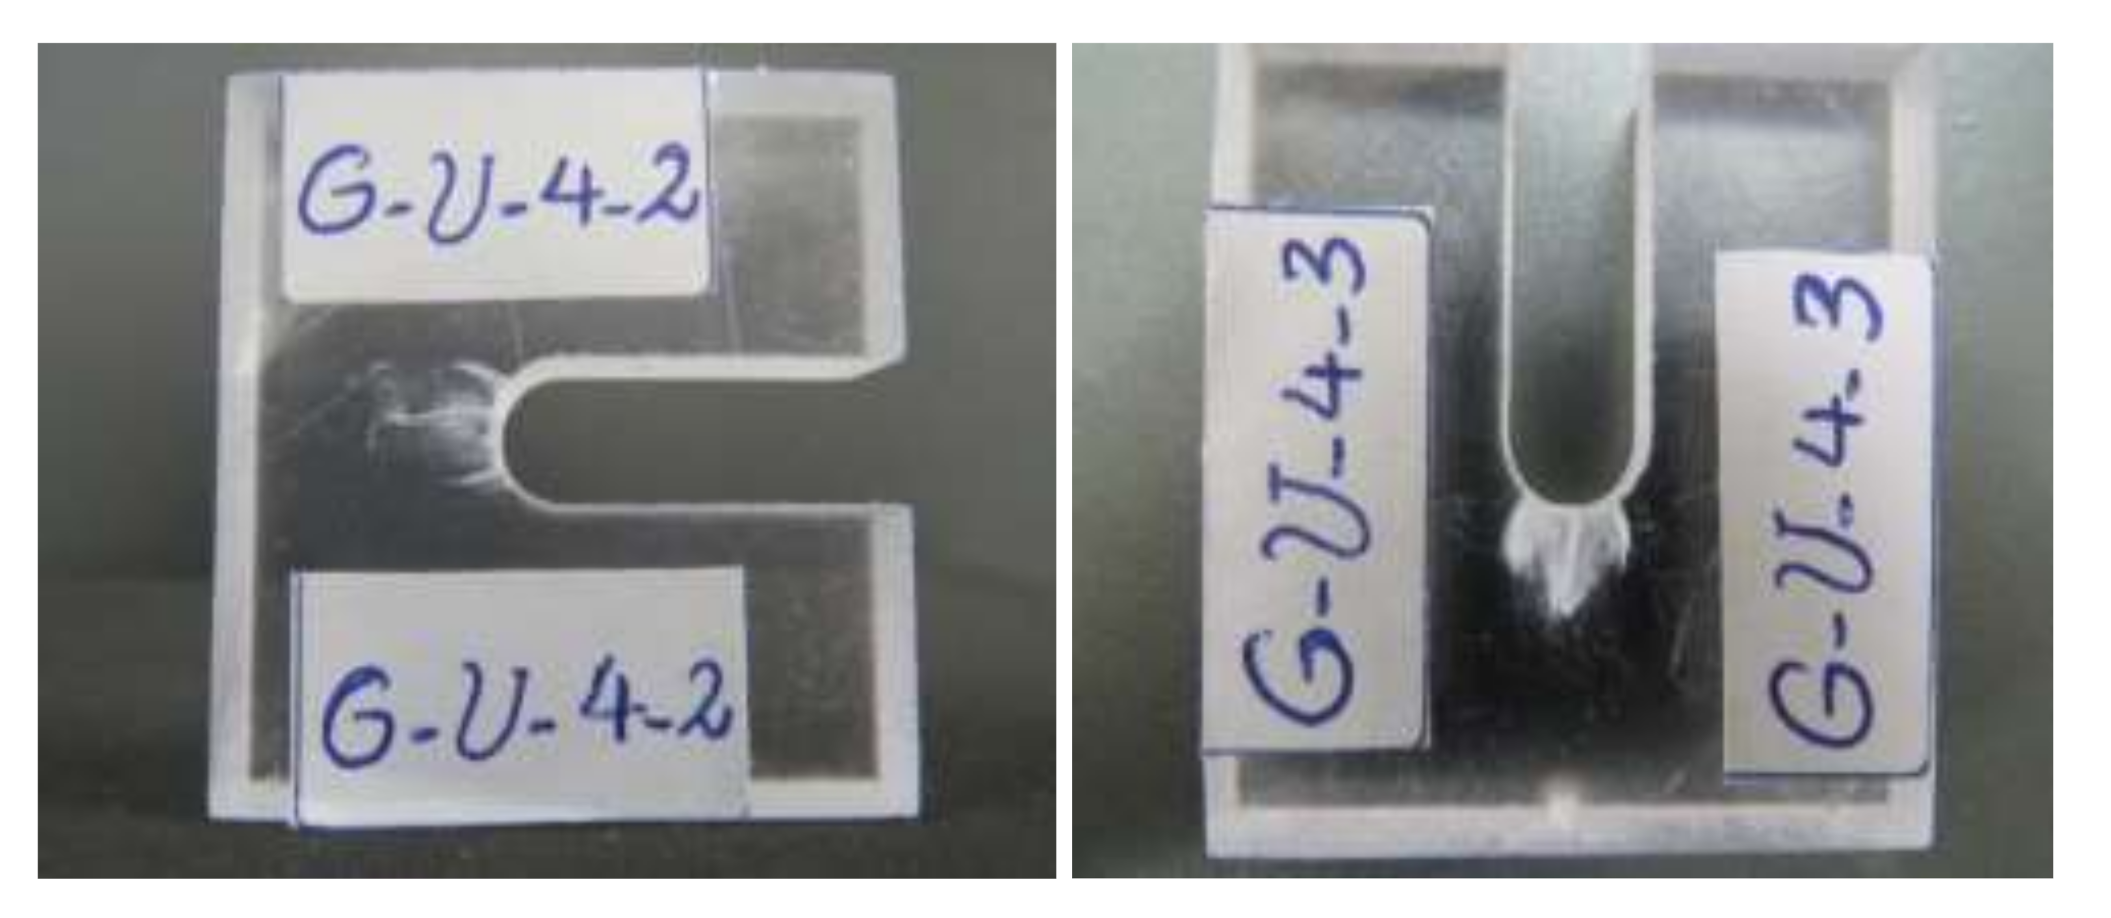
2.2. Fracture Tests on Notched Specimens

Figure 1a describes the geometry and dimensions of the fracture specimens. It can be observed that the specimens were of rectangular shape containing an edge U-shaped notch.
To prepare the U-notched specimens, 8-mm thick plates of PMMA and GPPS were first provided from the Cho Chen Industrial Company (Taiwan) and the Alborz Plastomer Company (Iran), respectively. Then, sketches of the U-notched samples were drawn and they were finally fabricated by cutting the plates using a two-dimensional water-jet cutting machine. It is notable that the formation of residual stresses around U-notches is avoided by employing this kind of fabrication process. For each material, four notch tip radii (0.5, 1, 2 and 4 mm) were considered. By performing three tests per combination of material and notch radius, 24 U-notched specimens were finally fabricated and tested under compression. As illustrated in Figure 1b, the U-notched polymeric specimens were tested under compressive loading with a displacement rate of 0.5 mm/min.
The experimental results of interest here are the fracture loads of the specimens, which were considered as the peak points of the corresponding load–displacement curves.

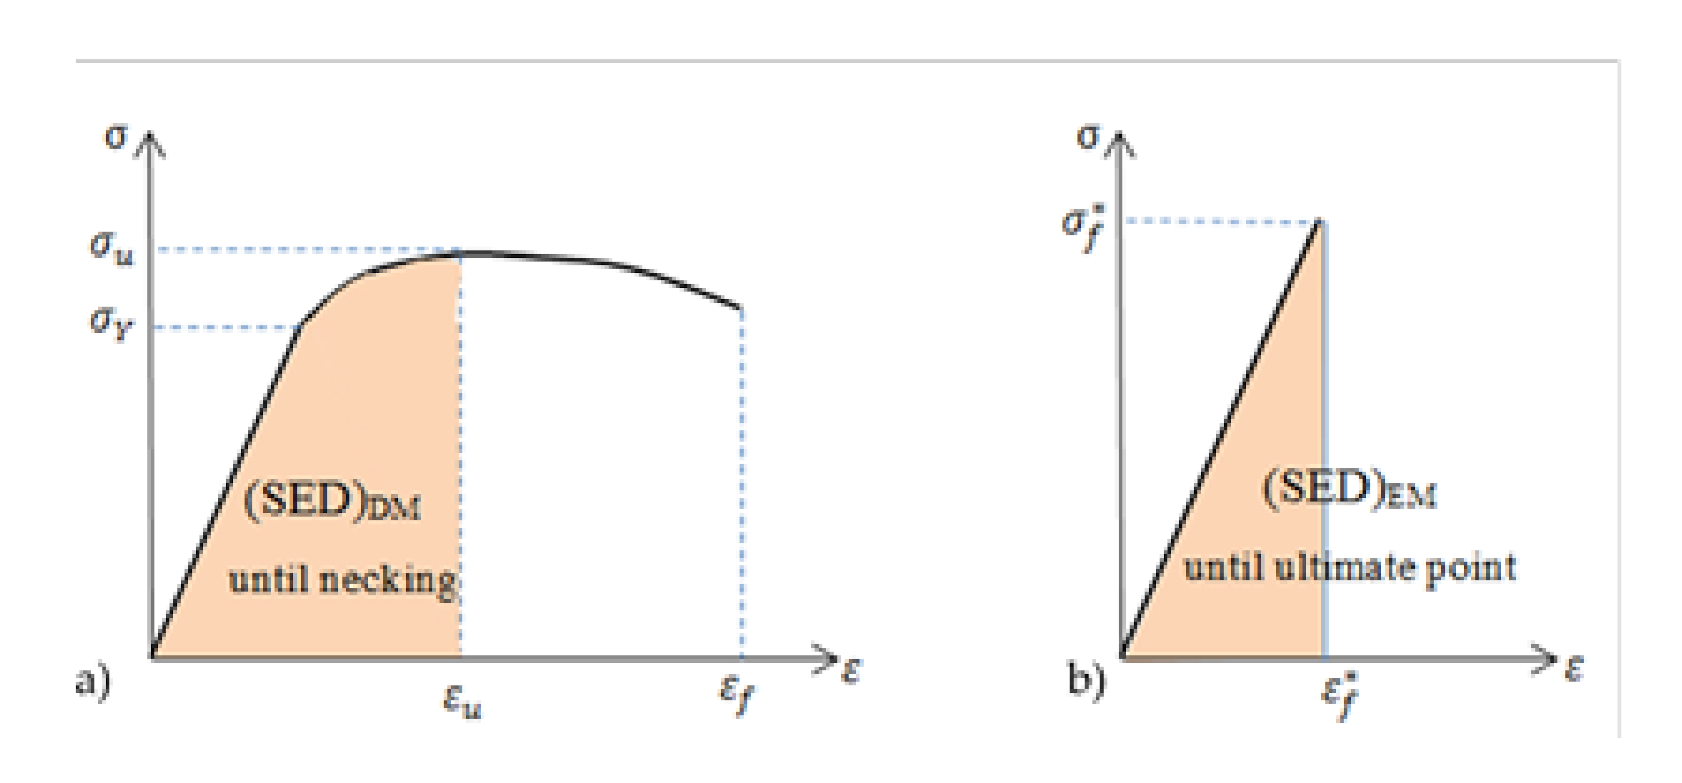
2.3. The Equivalent Material Concept under Compression Loading

In this research, by taking into account the nonlinear stress–strain curves of the two polymeric materials under compression, the equivalent material concept (EMC), proposed in 2012 by Torabi [38], under tensile loading is extended to compressive loading for obtaining the critical stress of the polymers tested under compression. The critical stress is used as an input in the traditional LEFM criteria to estimate the LCC of U-notched samples.
According to the original (tensile) formulation of the EMC, a real material with elastic-plastic behavior may be substituted in the analysis by a virtual brittle material with linear-elastic behavior [38]. This virtual brittle material is assumed to have the same elastic modulus and fracture toughness as the real elastic-plastic material. On the other hand, the tensile strengths of these materials (real vs. virtual) are different. More precisely, the tensile strength of the virtual material is obtained under the assumption that the strain energy density (SED) at failure is the same for both materials. This SED is equal to the areas under their corresponding tensile stress–strain curves (until the peak point), as shown in Figure 2. Torabi [38] obtained Equation (1) by comparing the expressions for the SED of the ductile (real) and the equivalent (virtual) materials:
S E D D M D u c t i l e   M a t e r i a l = S E D E M E q u i v a l e n t   M a t e r i a l = σ f * 2 2 E
where E and σ f * are the elastic modulus and the tensile strength of the virtual brittle material, respectively. Moreover, in Figure 2, σY, σu, and ε f * are the tensile yield strength, the ultimate tensile strength, and the fracture strain of the equivalent material, respectively.
The final expression for the tensile strength of the virtual brittle material is obtained by transforming Equation (1) as follows:
σ f * = 2 E · S E D D M 0.5
Then, by substituting the calculated area for the ductile material (i.e., SEDDM) into Equation (2), the tensile strength of the virtual brittle material is obtained.

2.4. Extension of the EMC to Compressive Loading

Analogously to the analysis of tensile loading conditions, the EMC can also be applied to compressive loading conditions for calculating the compressive strength of the equivalent material. Given that both stresses and strains have negative values in the standard compression test, the sign of SEDDM becomes positive. The main caution here is that the equivalent compressive strength must be negative. Mathematically:
σ f * = 2 E · S E D D M 0.5
Now that the compressive strength of the equivalent brittle material can be calculated, it can be substituted into various brittle fracture models to estimate the critical loads of U-notched GPPS and PMMA specimens tested under compression. In forthcoming sub-sections, two well-known simple stress-based fracture criteria are briefly described, and will be subsequently used to predict the LCCs obtained in the experimental program.

2.5. The maximum Tangential Stress and the Mean Stress Criteria under Positive Mode I Loading

Several failure criteria have been reported in the literature, dealing with the estimation of brittle fracture conditions in U-notched specimens under various types of loading condition. The maximum tangential stress (MTS) and the mean stress (MS) criteria are two of the most prominent.
The MTS criterion states that the crack nucleates from the U-notch tip in a brittle medium when the maximum tensile tangential stress attains the critical value, σC, at the critical distance, rC, from the notch tip [46]. For brittle and quasi-brittle materials, the critical stress is often assumed to be the same as the ultimate tensile strength, σu [47]. The critical distance of material can be computed as:
r c = 1 2 π K I c σ u 2
where KIc is the plane-strain fracture toughness of the material.
The second failure model is the MS criterion, proposed by Wieghardt [48] to estimate brittle fracture in cracked specimens, which establishes that fracture occurs when the average value of tangential stresses over the critical distance, dC, from the notch tip reaches the material critical stress, σC. Seweryn [49] proposed the following relation for computing the critical distance, dc, which depends on the material properties:
d c = 4 r c = 2 π K I c σ u 2

2.6. MTS and MS Criteria under Negative Mode I Loading

When analyzing a cracked component under negative mode I loading, it is evident that the plane-strain fracture toughness, KIc, is a physically meaningless parameter because the pre-existing crack does not grow and, instead, the crack faces contact each other, and failure would take place under different mechanisms. As a result, the expressions of rC and dC mentioned above would not seem to be applicable under such loading conditions. Therefore, it is necessary to determine the values of the two critical distances when dealing with negative mode I loading conditions.
A method based on experimental calibration has been proposed in [33] to calculate the critical distances under compression. Such critical distances have been successfully utilized to estimate the compressive fracture conditions of round-tip V-notched PMMA specimens [33]. A similar calibration was also used in the present study with a different appearance, in which the compressive tangential stress distribution, obtained directly from the finite element (FE) analysis, was employed. From this calibration carried out on the test data of the U-notched polymeric specimens, the critical stress, σC, and the critical distances, rC and dC, were determined. As an alternative, the critical stress was also calculated here by using the EMC under compressive conditions.
The LCCs obtained experimentally were predicted using the MTS and the MS criteria, in which the compressive critical stress comes either from the experimental calibration or from the EMC, while the critical distances always come from the calibration. Details of the experimental calibration are presented in Section 3.

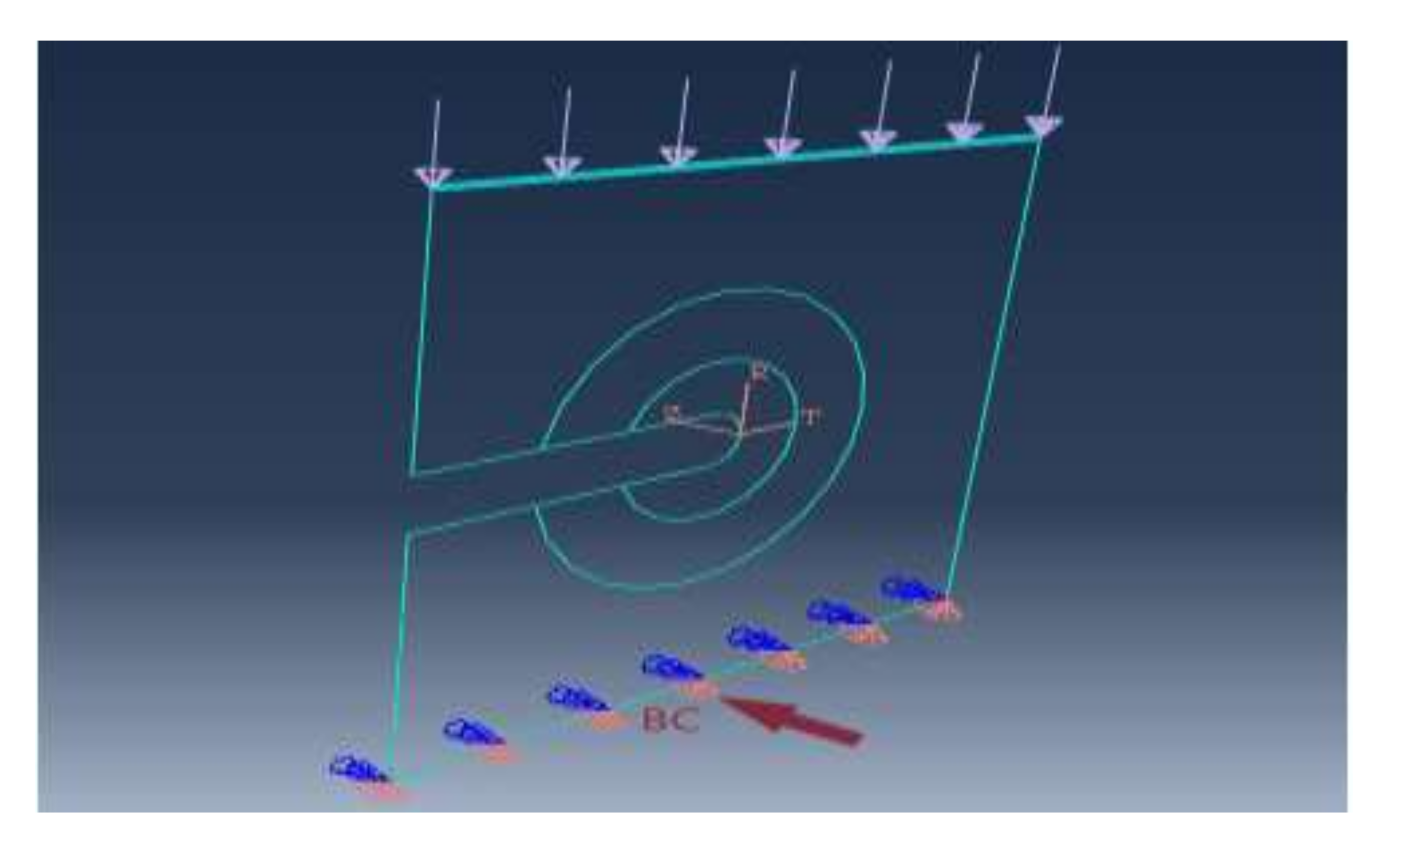
2.7. Finite Element Analysis

As mentioned above, in order to perform the experimental calibration of both the critical stress and the critical distances, and also with the aim of subsequently predicting the LCCs of the U-notched polymeric specimens, finite element (FE) analysis is required. Herein, FE analysis was conducted by employing the commercial code ABAQUS/CAE 6.10. Two-dimensional (2D) plane-stress FE models were created according to the dimensions of the U-notched specimens shown in Figure 2a. In order to apply the real loading conditions to the created model, the average critical load for each combination of notch radius and material (see Section 3) was applied to the top line of the specimen model as a uniformly distributed compressive load (see Figure 3). To create appropriate boundary conditions, as shown in Figure 3, the bottom line of the model was completely fixed by constraining the entire set of nodes located on this line.
Regarding the 3D effects, it should be underlined that the authors also created 3D models and performed the corresponding linear elastic analyses. As expected from previous experience, minor differences (always less than 4%) were found between the stress distribution in 2D plane-stress/plane-strain model and that in the 3D model, from which the stress values in the mid-plane were taken into consideration. Similar successful 2D FE simulation of 3D notched brittle specimens under compressive loading has also been reported previously in the literature (e.g., see [33]). For compressed notched components made of brittle materials with limited deformations, the stress triaxiality may be neglected. Thus, in notched brittle components, 3D specimens are usually simulated by 2D plane stress/strain models. This practice becomes inaccurate when the strain level (and triaxiality) becomes sufficiently large.
A suitable convergence of the FE results was obtained by performing several FE analyses with various numbers of elements. Finally, FE models containing around 161,000 eight-node plane-stress quadratic elements with a medial axis mesh algorithm were used to obtain the desired outputs. The fine sweep mesh pattern, with a size of 0.02 mm, utilized around the U-notch border is shown in Figure 4.

3. Results and Discussion

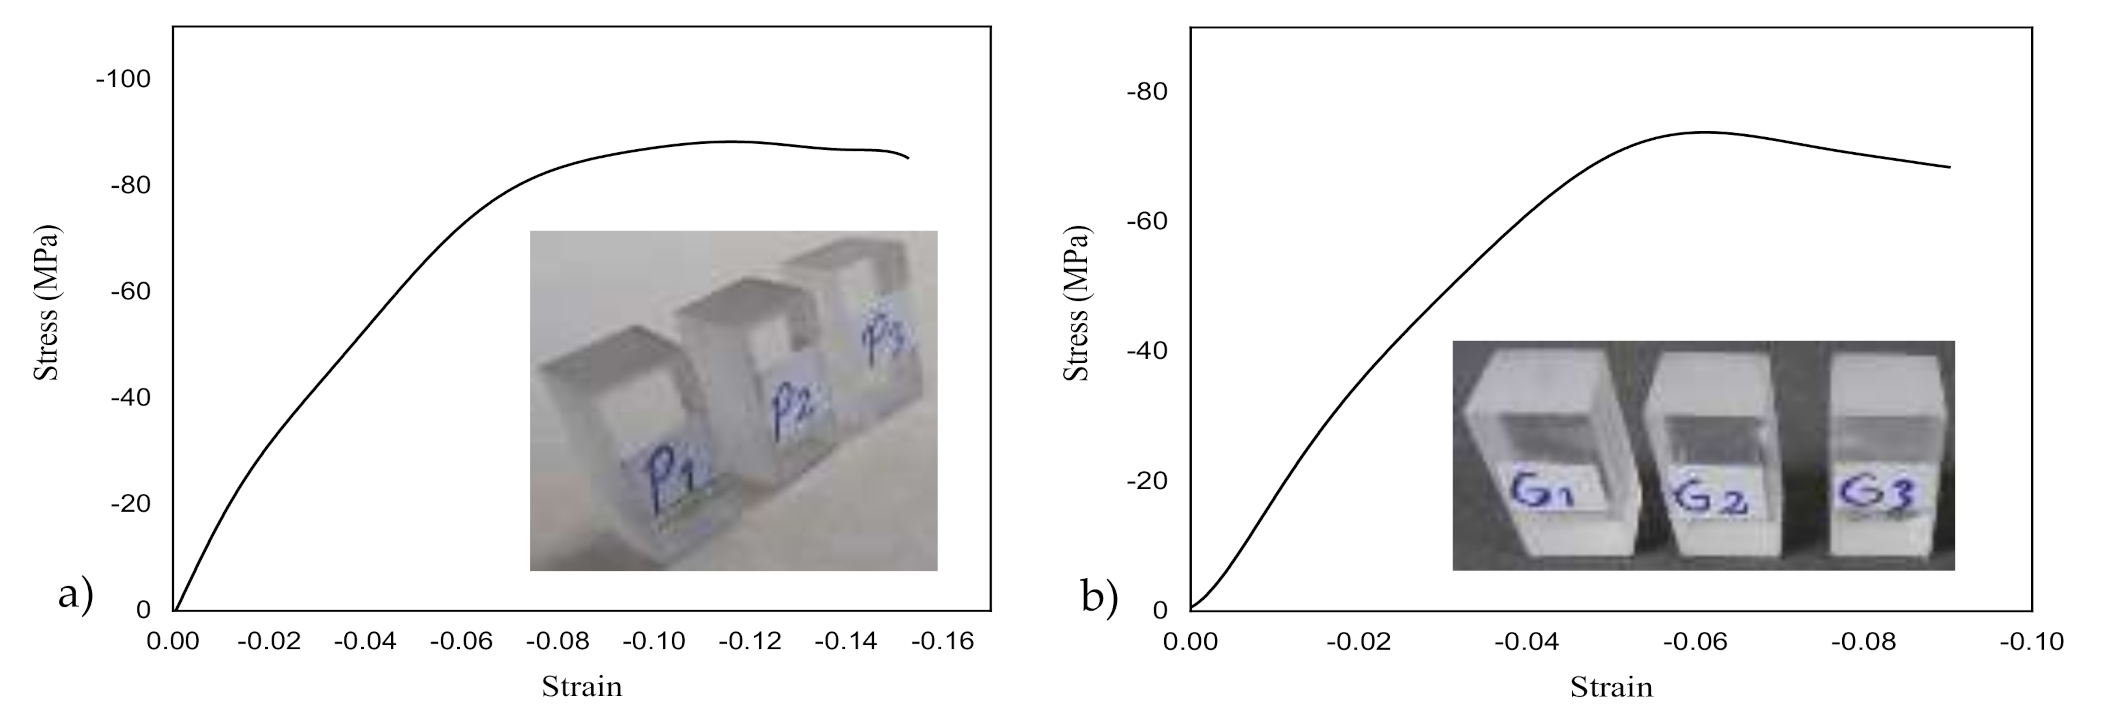
3.1. Material Characterization Tests

The compressive stress-strain curves (obtained in plain specimens [45]) and the test results for both polymeric materials are gathered in Figure 5 and reported in Table 1, respectively.
The results show a clear non-linear behavior in the compression curves of the two materials, although PMMA was more non-linear than GPPS.
These tests presented a peak or maximum load that is known in polymers as the compressive yield strength; with this property and the compressive ultimate strength usually being the same in this kind of material. After the maximum load, the stress–strain curve drops gradually. Usually, no fracture occurs in this kind of test, and instead it is simply observed that the specimen height (along the loading direction) always decreases and the cross-sectional area increases. Consequently, the standard stress–strain curve under compression test does not tend to stop, and hence, tests are usually stopped manually by the operator a while after the peak stress.
Figure 6 shows the specimens before testing, and one of them at the onset of the compressive strength. Beyond the obvious Poisson effect, it can be observed that barreling is not significant, given that both materials are not sufficiently non-linear to display this phenomenon.

3.2. Fracture Tests on Notched Specimens

The results of the fracture tests, in terms of LCCs, are summarized in Table 2. The notch tip radius, the critical loads of the corresponding three repetitions, and the average critical load are denoted in the table by ρ, Pi (i = 1, 2, 3), and Pavg, respectively. Two of the tested U-notched specimens are shown in Figure 7.
As is clear in Figure 7, unlike the tensile mode I loading (i.e., the notch opening mode), under which only a single crack initiates from the notch border and propagates suddenly, a noticeable damage zone first forms in the neighborhood of the U-notch blunt edge during the compression test and, second, a crack propagates from this region. This failure evidence for notched polymeric samples under compressive stresses has also been reported in [33].

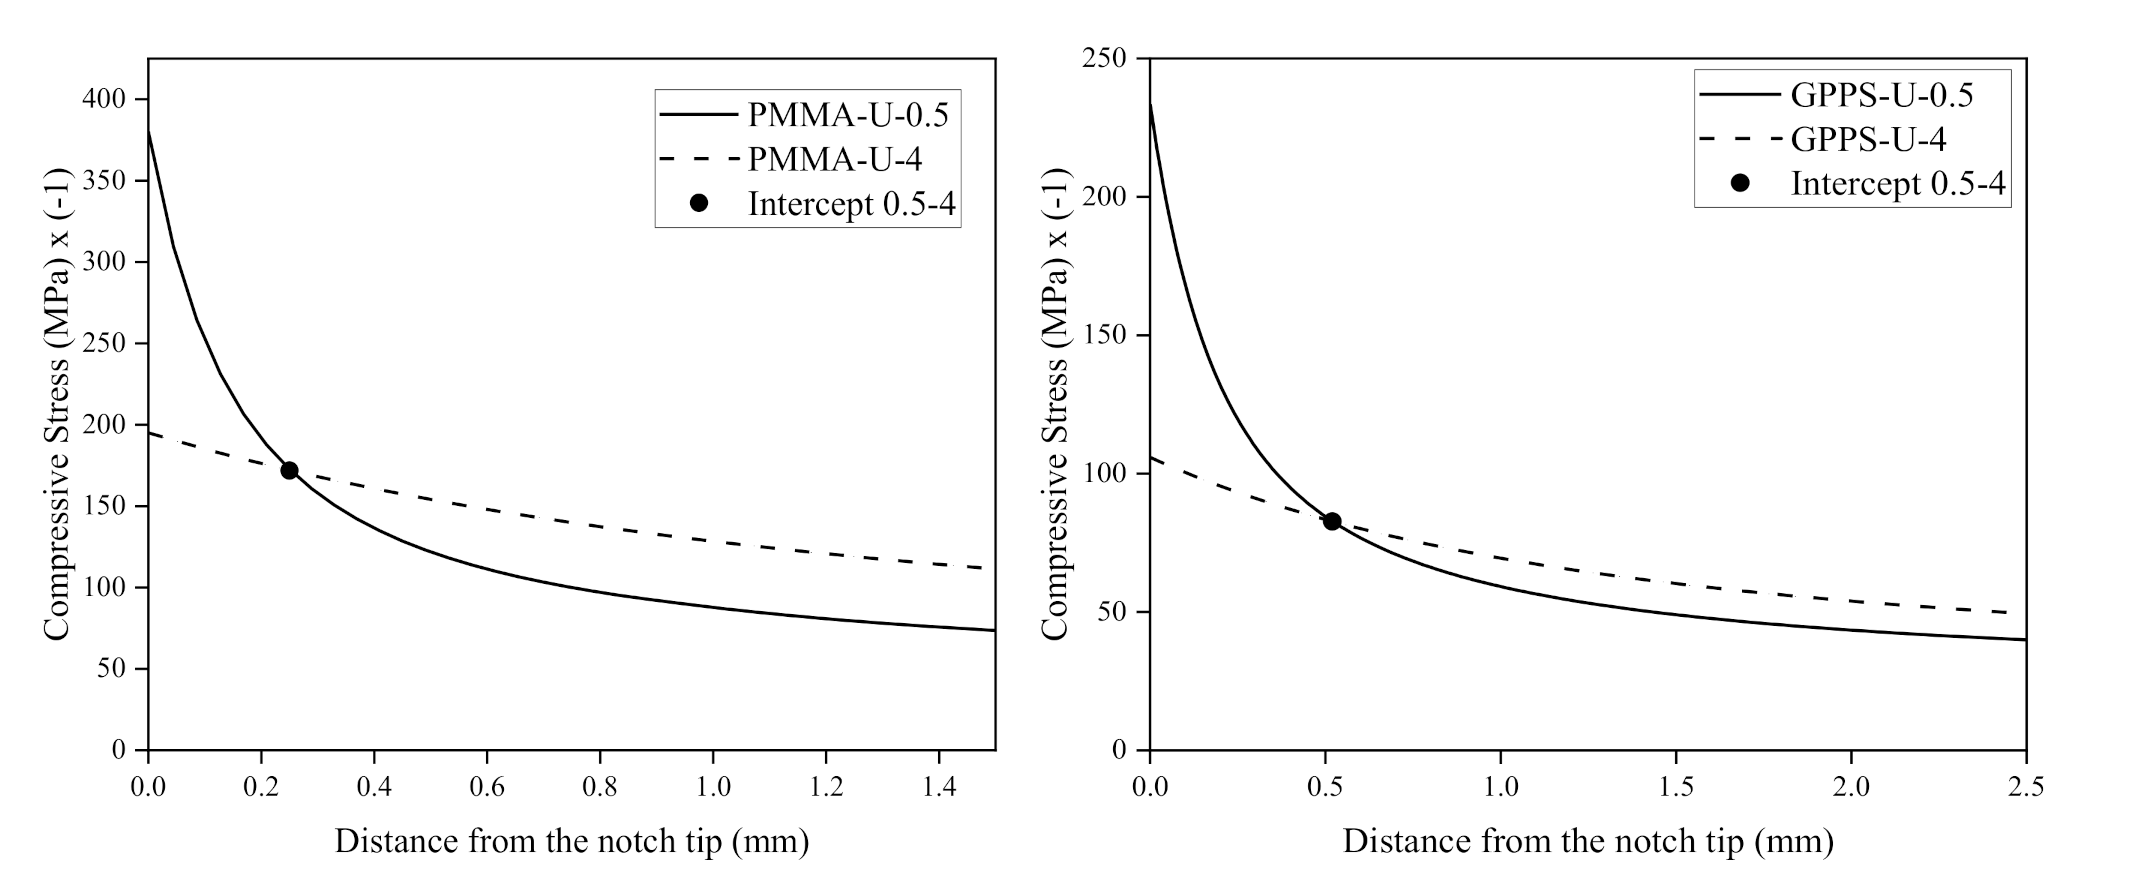
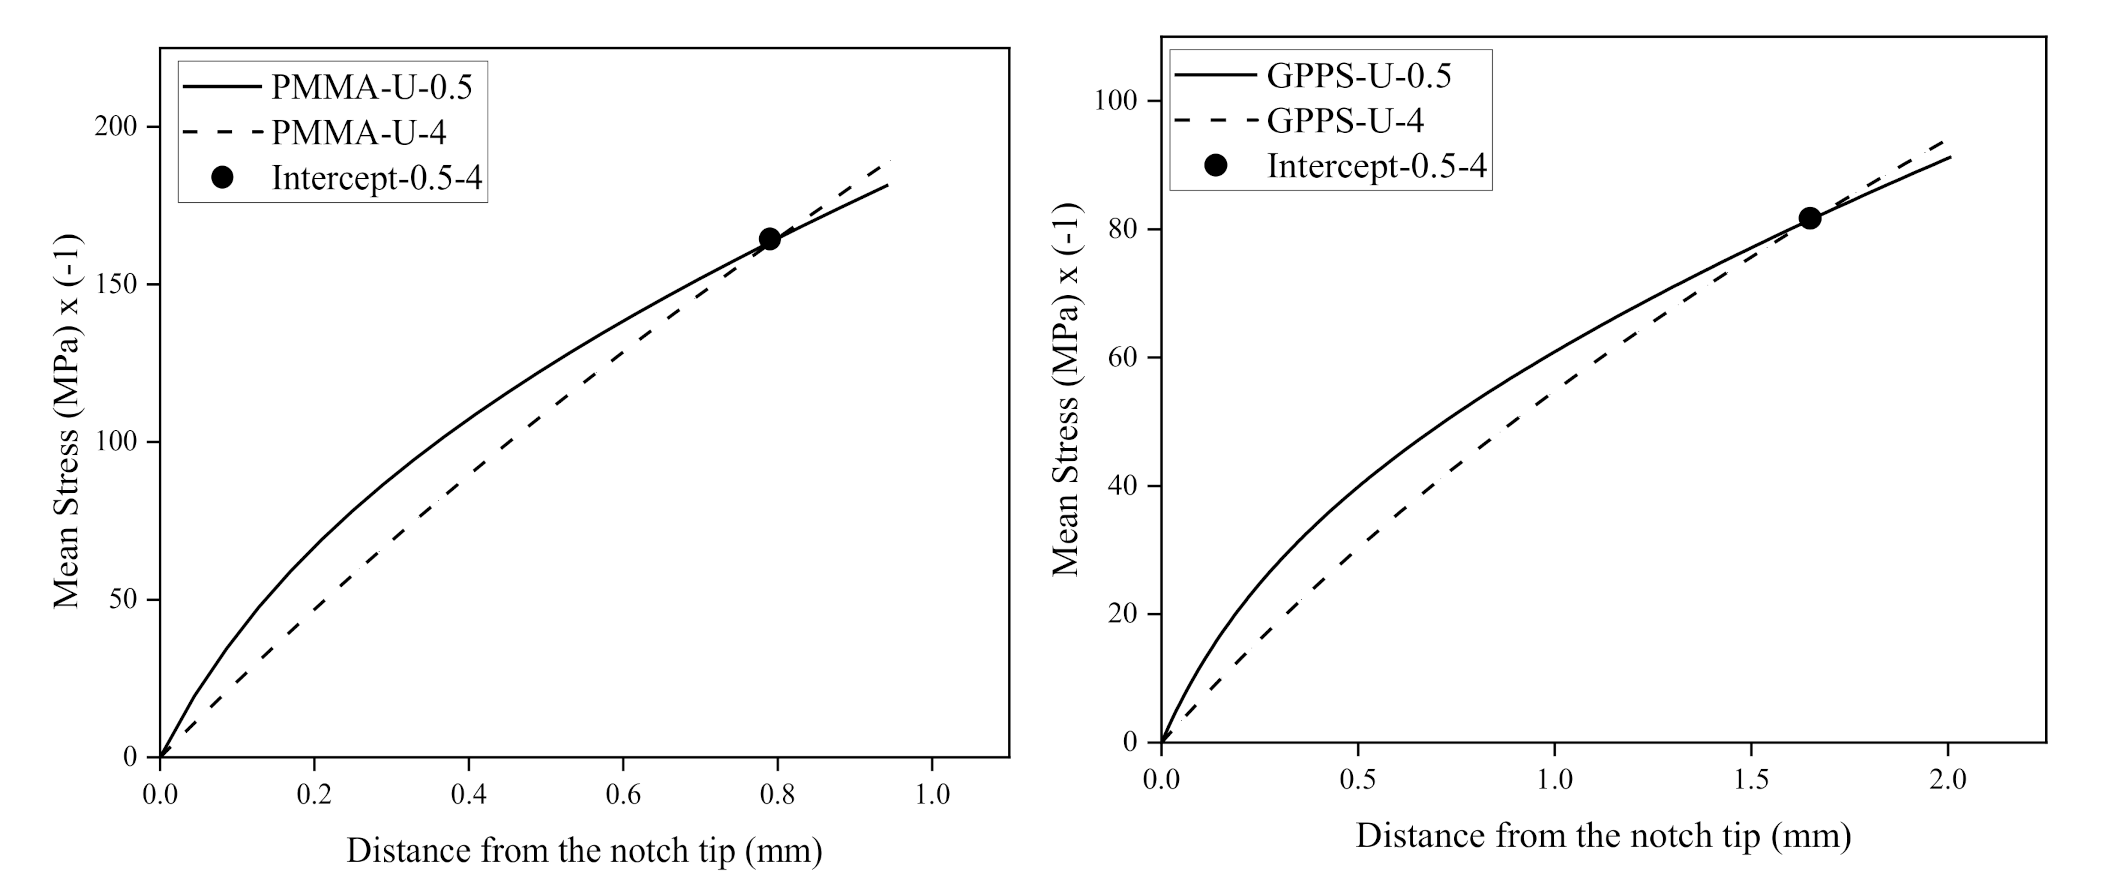
3.3. Calibration of Critical Stresses and Critical Distances

The completion of the FE analyses mentioned above, allowed the distribution of compressive stresses around the different U-notches (and materials) to be numerically obtained.
Moreover, as stated above, because the fracture toughness, KIc, defined in Equation (3) is not a meaningful fracture mechanics parameter under negative mode I loading, an alternative experimental calibration was required to obtain the critical stresses and the critical distances of GPPS and PMMA polymers, which were necessary parameters for theoretical predictions following the MTS and the MS criteria.
The calibration is elaborated as follows: in the first step, FE models are created for the specimens with a notch tip radii of 0.5 and 4 mm, having the maximum and the minimum stress concentration, respectively, and the mean values of their corresponding experimental fracture loads (see Table 2) are applied to them. Then, a straight path is defined on the bisector line of the U-notch from the notch tip. To employ the MTS model, the variation of compressive stress versus the distance from the notch tip is extracted for the PMMA and GPPS specimens, as shown in Figure 8. In both graphs, the tangential stress is shown (i.e., the stress along the loading direction, perpendicular to the notch middle plane; i.e., the Y-component). By drawing the stress–distance curves at failure conditions for 0.5 and 4 mm radii in a single graph, the point at which these two curves intersect each other is obtained. Finally, following the MTS criterion, the coordinates of this point are defined as the critical stress, σC, and the critical distance, rC, for each material, with the results being shown in Table 3. This kind of calibration can be considered as an extension of the well-established theory of critical distances (TCD) [50], from the positive mode I loading to negative mode I loading.
A similar method can also be followed when using the MS criterion by taking into account the mean compressive stress (again, the Y component). First, several distances from the notch tip are chosen on the notch bisector line, and over each distance, the mean stress is accurately computed by the integral method. Then, for each distance, one point is defined in a mean stress–distance (from the notch tip) plot. By connecting the points corresponding to the different distances together, a curve is obtained. Evidently, the accuracy of the curve increases as the number of distances chosen increases. By drawing the curves for 0.5 and 4 mm notch tip radii and illustrating them in a single plot, the intercept of the two curves gives the compressive critical stress, σC, and the critical distance, dC. Figure 9 represents the mean stress–distance plots of MS criterion for PMMA and GPPS polymers, respectively, with the critical parameters being included in Table 3.
Table 3 reveals that the critical stress values obtained from the experimental calibrations through the MTS and the MS criteria for PMMA deviated from each other by about 5%, which is quite acceptable. For GPPS, however, the values were much closer, with a deviation slightly higher than 1%. Regarding the values of the critical distances, it is evident that for both polymers studied, dC was moderately less than 4rC, and slightly higher than 3rC. This issue requires future research in other materials to study the relation between the two critical distances under compressive loading conditions.
Now, in order to obtain the theoretical values of the LCC for U-notch tip radii 1 and 2 mm, the critical load is determined from the MTS criterion by finding the load in the FE model for which the compressive stress at the critical distance, rC, in front of the notch tip attains the critical stress, σC. Similarly, for the MS criterion, the critical load is achieved in the FE model when the mean value of compressive stress over the critical distance, dc, reaches σC. The experimental and theoretical LCCs and their discrepancies are reported in Table 4. It should be noted that the discrepancies for the U-notch tip radii of 0.5 mm and 4 mm were zero, because the critical stress and the critical distances were calibrated from their experimental results. Hence, in computing the average discrepancies, these zero values were not considered. Table 4 shows that MTS and MS criteria can very well estimate the experimentally achieved fracture loads of the notched polymeric samples under the closing mode loading. Predictions were seen to be less accurate in PMMA (more non-linear), with the MTS criterion providing better predictions than the MS criterion. In all cases, predictions were conservative.
As mentioned in Section 2, the (compressive) critical stress of the two polymers analyzed could alternatively be determined by using the equivalent material concept (EMC), as the behaviors of these polymers under compression are nonlinear. Herein, it is verified whether the critical stress achieved from the EMC was close enough to that obtained from the experimental calibration when predicting the LCCs of the U-notched polymeric specimens using MTS and MS criteria.
To combine MTS and MS criteria with EMC, the critical stresses obtained above through the experimental calibration were substituted by the compressive strength of the equivalent linear elastic material achieved by EMC. For this purpose, the area under the compressive stress–strain curve (see Figure 5) until the peak point (maximum stress) was first computed for both polymeric materials. Then, by substituting this value into Equation (3), the compressive strength ( σ f * ) of the equivalent material was computed, a. For the PMMA and GPPS polymers being investigated, the compressive strength values were computed to be equal to −175.1 and −90.2 MPa, respectively, which are significantly close to the values of the critical stress obtained from the experimental calibration.
Finally, by replacing the value of σ f * instead of the critical stress, σC, for each polymer in the MTS and the MS criteria, the theoretical values of LCC were obtained, which are reported in Table 5.
From the results shown in Table 5, it is evident that, unlike in Table 4, for the notch tip radii of 0.5 mm and 4 mm the discrepancies are not equal to zero, given that the values of the critical stress were not derived from the experimental calibration on such radii. Moreover, it is interesting to note that for all notch tip radii, the discrepancies were very low, proving that: (i) both EMC–MTS and EMC–MS combined criteria were successful in predicting the fracture load of the U-notched polymeric specimens under compression; and (ii) the EMC was quite efficient in estimating the compressive critical stress of the two polymers.
In this case, all the predictions were slightly non-conservative (i.e., the predicted critical loads are a bit higher than the experimental ones). In this sense, the critical stress values obtained through the EMC were slightly larger (in absolute value) than those obtained from the experimental calibration, and this generates higher predictions of the critical loads. In the case of PMMA, the accuracy jumped from underestimations of −4.7% and −6.8% for MTS and MS criteria, respectively, to overestimations of +1.0 % and +4.6% for EMC–MTS and EMC–MS criteria; for GPPS (MTS), the accuracy changed from −1.4% and −1.5% (for MTS and MS) to +4.6% and +5.4% (EMC–MTS and EMC–MS, respectively).

4. Conclusions

In the present investigation, original fracture tests were carried out on U-notched rectangular specimens made of PMMA and GPPS polymers under compressive loading. As the main outcomes of the experimental campaign, the failure evidence and the load-carrying capacity (LCC) of the different notched specimens were obtained and analyzed. Experimental calibration methods based on the theory of critical distances (TCD) were implemented to obtain the critical stress and the critical distances of the MTS and the MS criteria. The compressive critical stress of the two analyzed polymers were also estimated through the equivalent material concept (EMC), which was extended for the first time from tensile loading to compressive loading. The results indicated that the EMC was quite successful in estimating the critical stress derived from the experimental calibration. It was also revealed that the MTS, MS, EMC–MTS, and EMC–MS criteria were all efficient in predicting the experimentally achieved fracture loads of the U-notched PMMA and GPPS samples under negative mode I loading conditions.

Author Contributions

Conceptualization, A.R.T.; methodology, A.R.T.; software, K.H.; validation, A.R.T., K.H., A.S.R., and S.C.; investigation, A.R.T., K.H.; writing—original draft preparation, A.R.T., S.C; writing—review and editing, A.R.T., K.H., A.S.R., and S.C.; project administration, A.R.T.; All authors have read and agreed to the published version of the manuscript.

Funding

This research received no external funding.

Institutional Review Board Statement

Not applicable.

Informed Consent Statement

Not applicable.

Data Availability Statement

The data presented in this study are available in the main text of this document.

Conflicts of Interest

The authors declare no conflict of interest.

References

  1. Lazzarin, P.; Zambardi, R. A finite-volume-energy based approach to predict the static and fatigue behavior of components with sharp V-shaped notches. Int. J. Fract. 2001, 112, 275–298. [Google Scholar] [CrossRef]
  2. Ayatollahi, M.R.; Torabi, A.R. Determination of mode II fracture toughness for U-shaped notches using Brazilian disc specimen. Int. J. Solids Struct. 2010, 47, 454–465. [Google Scholar] [CrossRef] [Green Version]
  3. Zappalorto, M.; Carraro, P.A. An efficient energy-based approach for the numerical assessment of mode I NSIFs in isotropic and orthotropic notched plates. Theor. Appl. Fract. Mech. 2020, 108, 102612. [Google Scholar] [CrossRef]
  4. Gogotsi, G.A. Fracture toughness of ceramics and ceramic composites. Ceram. Int. 2003, 7, 777–784. [Google Scholar] [CrossRef]
  5. Bura, E.; Seweryn, A. Mode I fracture in PMMA specimens with notches—Experimental and numerical studies. Theor. Appl. Fract. Mech. 2018, 97, 140–155. [Google Scholar] [CrossRef]
  6. Gomez, F.J.; Elices, M.; Valiente, A. Cracking in PMMA containing U-shaped notches. Fatigue Fract. Eng. Mater. Struct. 2000, 23, 795–803. [Google Scholar] [CrossRef]
  7. Gomez, F.J.; Guinea, G.V.; Elices, M. Failure criteria for linear elastic materials with U-notches. Int. J. Fract. 2006, 141, 99–113. [Google Scholar] [CrossRef]
  8. Torabi, A.R.; Berto, F. Strain energy density to assess mode II fracture in U-notched disk-type graphite plates. Int. J. Damage Mech. 2014, 23, 917–930. [Google Scholar] [CrossRef]
  9. Kim, J.K.; Cho, S.B. Effect of second non-singular term of mode I near the tip of a V-notched crack. Fatigue Fract. Eng. Mater. Struct. 2009, 32, 346–356. [Google Scholar] [CrossRef]
  10. Sangsefidi, M.; Akbardoos, J.; Mesbah, M. Experimental and theoretical fracture assessment of rock-type U-notched specimens under mixed mode I/II loading. Eng. Fract. Mech. 2020, 230, 106990. [Google Scholar] [CrossRef]
  11. Berto, F.; Lazzarin, P.; Gomez, F.J.; Elices, M. Fracture assessment of U-notches under mixed mode loading: Two procedures based on the equivalent local mode I concept. Int. J. Fract. 2007, 148, 415–433. [Google Scholar] [CrossRef]
  12. Campagnolo, A.; Berto, F.; Leguillon, D. Fracture assessment of sharp V-notched components under Mode II loading: A comparison among some recent criteria. Theor. Appl. Fract. Mech. 2016, 85, 217–226. [Google Scholar] [CrossRef]
  13. Berto, F.; Lazzarin, P.; Marangon, C. Brittle fracture of U-notched graphite plates under mixed mode loading. Mater. Des. 2012, 41, 421–432. [Google Scholar] [CrossRef]
  14. Gomez, F.J.; Elices, M.; Berto, F.; Lazzarin, P. Local strain energy to assess the static failure of U-notches in plates under mixed mode loading. Int. J. Fract. 2007, 145, 29–45. [Google Scholar] [CrossRef]
  15. Berto, F.; Lazzarin, P. A review of the volume-based strain energy density approach applied to V-notches and welded structures. Theor. Appl. Fract. Mech. 2009, 52, 183–194. [Google Scholar] [CrossRef]
  16. Chen, D.H.; Ozaki, S. Investigation of failure criteria for a sharp notch. Int. J. Fract. 2008, 152, 63–74. [Google Scholar] [CrossRef]
  17. Jin, F.L.; Li, X.; Park, S.J. Synthesis and application of epoxy resins: A review. J. Indust. Eng. Chem. 2015, 29, 1–11. [Google Scholar] [CrossRef]
  18. Rodriguez, J.; Salazar, A.; Gómez, F.J.; Patel, Y.; Williams, J.G. Fracture of notched samples in epoxy resin: Experiments and cohesive model. Eng. Fract. Mech. 2015, 149, 402–411. [Google Scholar] [CrossRef]
  19. Kanchanomaia, C.; Rattananona, S.; Soni, M. Effects of loading rate on fracture behavior and mechanism of thermoset epoxy resin. Polym. Test 2005, 24, 886–892. [Google Scholar] [CrossRef]
  20. Razavi, S.M.J.; Ayatollahi, M.R.; Esmaeili, E.; da Silva, L.F.M. Mixed-mode fracture response of metallic fiber-reinforced epoxy adhesive. Eur. J. Mech. A Solids 2017, 65, 349–359. [Google Scholar] [CrossRef]
  21. Fiedler, B.; Hojo, M.; Ochiai, S.; Schulte, K.; Ando, M. Failure behavior of an epoxy matrix under different kinds of static loading. Comp. Sci. Tech. 2001, 61, 1615–1624. [Google Scholar] [CrossRef]
  22. Aliha, M.R.M.; Bahmani, A.; Akhondi, S. Mixed mode fracture toughness testing of PMMA with different three-point. bend type specimens. Eur. J. Mech. A Solids 2016, 58, 148–162. [Google Scholar] [CrossRef]
  23. Berto, F.; Campagnolo, A.; Elices, M.; Lazzarin, P. A synthesis of Polymethylmethacrylate data from U-notched specimens and V-notches with end holes by means of local energy. Mater. Des. 2013, 49, 826–833. [Google Scholar] [CrossRef]
  24. Cottrell, B. Brittle fracture in compression. Int. J. Fract. Mech. 1972, 8, 195–208. [Google Scholar] [CrossRef]
  25. Hoek, E.; Bieniawski, Z.T. Brittle fracture propagation in rock under compression. Int. J. Fract. Mech. 1965, 1, 137–155. [Google Scholar] [CrossRef]
  26. Kawakami, H. Notch sensitivity of graphite materials for VHTR. J. Atom. Energy Soc. Jpn. 1985, 27, 357–364. [Google Scholar] [CrossRef] [Green Version]
  27. Wang, E.Z.; Shrive, N.G. Brittle fracture in compression: Mechanisms, models and criteria. Eng. Fract. Mech. 1995, 52, 1107–1126. [Google Scholar] [CrossRef]
  28. Lajtai, E.Z. Brittle fracture in compression. Int. J. Fract. 1974, 10, 525–536. [Google Scholar] [CrossRef]
  29. Lajtai, E.Z.; Carter, B.J.; Ayari, M.L. Criteria for brittle fracture in compression. Eng. Fract. Mech. 1990, 37, 59–74. [Google Scholar] [CrossRef]
  30. Bell, J.F. The experimental foundations of solid mechanics. In Encyclopedia of Physics; Springer: Berlin, Germany; New York, NY, USA, 1973; Volume 1, Section 3.3. [Google Scholar]
  31. Berto, F.; Lazzarin, P.; Ayatollahi, M.R. Brittle fracture of sharp and blunt V-notches in isostatic graphite under pure compression loading. Carbon 2013, 63, 101–116. [Google Scholar] [CrossRef]
  32. Torabi, A.R.; Ayatollahi, M.R. Compressive brittle fracture in V-notches with end holes. Eur. J. Mech. A/Solids 2014, 45, 32–40. [Google Scholar] [CrossRef]
  33. Ayatollahi, M.R.; Torabi, A.R.; Firoozabadi, M. Theoretical and experimental investigation of brittle fracture in V-notched PMMA specimens under compressive loading. Eng. Fract. Mech. 2015, 135, 187–205. [Google Scholar] [CrossRef]
  34. Torabi, A.R.; Bahrami, B.; Ayatollahi, M.R. Mixed mode I/II brittle fracture in V-notched Brazilian Disk specimens under negative mode I conditions. Phys. MesoMech. 2016, 19, 332–348. [Google Scholar] [CrossRef]
  35. Torabi, A.R.; Majidi, H.R.; Ayatollahi, M.R. Brittle failure of key-hole notches under mixed mode I/II loading with negative mode I contributions. Eng. Fract. Mech. 2016, 168, 51–72. [Google Scholar] [CrossRef]
  36. Majidi, H.R.; Ayatollahi, M.R.; Torabi, A.R.; Zaheri, A. Energy-based assessment of brittle fracture in VO-notched polymer specimens under combined compression-shear loading conditions. Int. J. Damage Mech. 2019, 28, 664–689. [Google Scholar] [CrossRef]
  37. Bura, E.; Derpeński, Ł.; Seweryn, A. Fracture in PMMA notched specimens under compression—Experimental study. Polym. Test 2019, 77, 105923. [Google Scholar] [CrossRef]
  38. Torabi, A.R. Estimation of tensile load-bearing capacity of ductile metallic materials weakened by a V-notch: The equivalent material concept. Mater. Sci. Eng. A 2012, 536, 249–255. [Google Scholar] [CrossRef]
  39. Majidi, H.R.; Razavi, S.M.J.; Torabi, A.R. Application of EMC-J criterion to fracture prediction of U-notched polymeric specimens with nonlinear behaviour. Fatigue Fract. Eng. Mater. Struct. 2019, 42, 352–362. [Google Scholar] [CrossRef]
  40. Torabi, A.R.; Berto, F.; Campagnolo, A. Elastic-plastic fracture analysis of notched Al 7075-T6 plates by means of the local energy combined with the Equivalent Material Concept. Phys. Mesomech. 2016, 19, 204–213. [Google Scholar] [CrossRef]
  41. Majidi, H.R.; Golmakani, M.E.; Torabi, A.R. On combination of the equivalent material concept and J-integral criterion for ductile failure prediction of U-notches subjected to tension. Fatigue Fract. Eng. Mater. Struct. 2018, 41, 1476–1487. [Google Scholar] [CrossRef]
  42. Cicero, S.; Torabi, A.R.; Madrazo, V.; Azizi, P. Prediction of fracture loads in PMMA Unotched specimens using the equivalent material concept and the theory of critical distances combined criterion. Fatigue Fract. Eng. Mater. Struct. 2017, 41, 688–699. [Google Scholar] [CrossRef]
  43. Rahimi, A.S.; Ayatollahi, M.R.; Torabi, A.R. Fracture study in notched ductile polymeric plates subjected to mixed mode I/II loading: Application of equivalent material concept. Eur. J. Mech. A Solids 2018, 70, 37–43. [Google Scholar] [CrossRef]
  44. Rahimi, A.S.; Torabi, A.R.; Ayatollahi, M.R. Ductile failure analysis of blunt V-notched epoxy resin plates subjected to combined tension-shear loading. Polym. Test 2018, 70, 57–66. [Google Scholar] [CrossRef]
  45. ASTM D695-10. Standard Test Method for Compressive Properties of Rigid Plastics; American Society of Testing and Materials: Philadelphi, PA, USA, 2010. [Google Scholar]
  46. Erdogan, F.; Sih, G.C. On the crack extension in plates under plane loading and transverse shear. J. Basic Eng. Trans. ASME 1963, 85, 525–527. [Google Scholar] [CrossRef]
  47. Ayatollahi, M.R.; Torabi, A.R.; Rahimi, A.S. Brittle fracture assessment of engineering components in the presence of notches: A review. Fatigue Fract. Eng. Mater. Struct. 2016, 39, 267–291. [Google Scholar] [CrossRef]
  48. Wieghardt, K. Ueber das Spalten und Zerreissen elastischer Koerper. Z. Mathematik und Physik 1995, 55, 60–103. [Google Scholar]
  49. Seweryn, A. Brittle fracture criterion for structures with sharp notches. Eng. Fract. Mech. 1994, 47, 673–681. [Google Scholar] [CrossRef]
  50. Taylor, D. The theory of critical distances. Eng. Fract. Mech. 2008, 75, 1696–1705. [Google Scholar] [CrossRef]
Figure 1. Fracture specimens tested under compressive loads: (a) geometry and dimensions; (b) example of Polymethyl-methacrylate (PMMA) specimen (ρ = 2.0 mm) during the fracture test.
Applsci 11 02104 g001
Figure 2. Schematic of tensile stress–strain curves: (a) ductile material; (b) equivalent material.
Applsci 11 02104 g002
Figure 3. Loading and boundary conditions for the U-notched specimen subjected to compressive loading.
Applsci 11 02104 g003
Figure 4. Mesh pattern in the vicinity of the U-notch tip.
Applsci 11 02104 g004
Figure 5. Compressive stress–strain curves for (a) PMMA and (b) general-purpose polystyrene (GPPS).
Applsci 11 02104 g005
Figure 6. Examples of specimens at the onset of the compressive stress. (a) PMMA; (b) GPPS.
Applsci 11 02104 g006
Figure 7. Example of two tested specimens made of GPPS (ρ = 4.0 mm).
Applsci 11 02104 g007
Figure 8. Compressive stress–distance curves at fracture for PMMA and GPPS materials.
Applsci 11 02104 g008
Figure 9. Compressive mean stress–distance curves at fracture for PMMA and GPPS materials.
Applsci 11 02104 g009
Table 1. Mechanical properties of the tested polymers under compression.
MaterialElastic Modulus, E (GPa)Poisson’s Ratio
υ
Ultimate Compressive Stress, σu (MPa)
PMMA1.700.3486
GPPS2.140.3468
Table 2. Experimentally achieved load-carrying capacities (LCCs) for the U-notched specimens made of PMMA and GPPS. SD: standard deviation.
Materialρ (mm)P1 (N)P2 (N)P3 (N)Pavg (N)SD (N)
PMMA0.56663647468976678173.0
1.07471687975457298298.0
2.0857584938681858376.9
4.09065946492719266162.9
GPPS0.54028383941213996117.3
1.04543432342314365130.8
2.05396512949965173166.3
4.05950600464236125211.3
Table 3. Critical distance (rC) and critical stress (σC) of PMMA and GPPS materials when following maximum tangential stress (MTS) and mean stress (MS) criteria.
MaterialrC (mm), MTSσC (MPa), MTSdC (mm), MSσC (MPa), MS
PMMA0.25−171.90.79−164.4
GPPS0.52−82.71.65−81.7
Table 4. Comparison between experimental (exp.) fracture loads and fracture prediction (pred.) derived from MTS and MS criteria (experimental calibration of critical parameters).
MaterialFracture
Criterion
Notch
Radius, mm
Fracture
Load (pred.),
N
Fracture
Load (exp.),
N
Discrepancy,
%
Average
Discrepancy,
%
PMMAMTS0.5667866780.04.7
1.068647298−5.9
2.084338681−3.5
4.0926692660.0
MS0.5667866780−6.8
1.070367298−3.5
2.077978681−10.1
4.0926692660
GPPSMTS0.5399639960.0−1.4
1.043094365−1.2
2.050485173−1.7
4.0612561250.0
MS0.5399639960.0−1.5
1.043204365−1.0
2.050615173−2.1
4.0612561250.0
Table 5. Comparison between experimental (exp.) fracture loads and fracture prediction (pred.) derived from MTS and MS criteria (experimental calibration of critical parameters).
MaterialFracture
Criterion
Notch
Radius,
mm
Fracture
Load (pred.),
N
Fracture
Load (exp.),
N
Discrepancy,
%
Average
Discrepancy,
%
PMMAEMC–MTS0.567266678+0.7+1.0
1.073697298+0.9
2.087948681+1.3
4.094039266+1.4
EMC–MS0.568886678+3.1+4.6
1.076167298+4.3
2.091358681+5.2
4.098359266+6.1
GPPSEMC–MTS0.541233996+3.2+4.6
1.045304365+3.8
2.054045173+4.4
4.065586125+7.0
EMC–MS0.541313996+3.4+5.4
1.045724365+4.7
2.054835173+6.0
4.065916125+7.6
Publisher’s Note: MDPI stays neutral with regard to jurisdictional claims in published maps and institutional affiliations.

