Article

Evaluation of Emotional Satisfaction Using Questionnaires in Voice-Based Human–AI Interaction

1
Department of Industrial Engineering, Kumoh National Institute of Technology, Gumi 39177, Korea
2
Department of Electronics and Information Engineering, Korea University, Sejong 30019, Korea
*
Author to whom correspondence should be addressed.
Appl. Sci. 2021, 11(4), 1920; https://doi.org/10.3390/app11041920
Submission received: 1 January 2021 / Revised: 17 February 2021 / Accepted: 19 February 2021 / Published: 22 February 2021
(This article belongs to the Special Issue Applied Cognitive Sciences)

Abstract

:
With the development of artificial intelligence technology, voice-based intelligent systems (VISs), such as AI speakers and virtual assistants, are intervening in human life. VISs are emerging in a new way, called human–AI interaction, which is different from existing human–computer interaction. Using the Kansei engineering approach, we propose a method to evaluate user satisfaction during interaction between a VIS and a user-centered intelligent system. As a user satisfaction evaluation method, a VIS comprising four types of design parameters was developed. A total of 23 subjects were considered for interaction with the VIS, and user satisfaction was measured using Kansei words (KWs). The questionnaire scores collected through KWs were analyzed using exploratory factor analysis. ANOVA was used to analyze differences in emotion. On the “pleasurability” and “reliability” axes, it was confirmed that among the four design parameters, “sentence structure of the answer” and “number of trials to get the right answer for a question” affect the emotional satisfaction of users. Four satisfaction groups were derived according to the level of the design parameters. This study can be used as a reference for conducting an integrated emotional satisfaction assessment using emotional metrics such as biosignals and facial expressions.

1. Introduction

Recently, artificial intelligence based on various technologies, such as machine learning, natural language processing, machine vision, and big data, has been applied to systems in various fields to be used as user agents or mutual cooperation models [1]. A representative intelligent system is a voice-based intelligent system (VIS) in the form of a chatbot, which is created from developed speech recognition technology, such as natural language processing and text-to-speech. Fierce competition is underway to preempt the market for agent technology using VIS in artificial intelligence speakers and smartphones [2]. Currently, VIS is mainly used to meet customer information requirements through the role of a chatbot helper or virtual assistant, which is used to interact with customers. Interaction with AI-infused systems is defined as human–AI interaction (HAII) [3] and conceived as a modified version of human–computer interaction (HCI), which provides differentiated interaction [4]. Humans have performed system-driven interaction in HCI, whereas intelligent systems are required to provide user-centered interaction that adapts to a specified context of use in HAII. Purington et al. [5] investigated the impact of satisfaction and personalization using user reviews of VIS integrated into real life, and Cárdenas et al. [6] reported that there is a need for personalization and customization in interaction with intelligent systems. Therefore, there is a demand to create an interaction design that can secure the emotional satisfaction of various users as an intelligent system is developed.
According to Walter’s “hierarchy of human needs”, the final expectation of a user from the system is defined as satisfaction (Figure 1) [7]. This means that the user wants to be satisfied emotionally while interacting with the system, beyond usability. Satisfaction is a feeling that arises from the mind during the process of perceiving and recognizing the information presented by the system, indicating a state or feeling in which a need is fulfilled. Therefore, it can be stated that a person is satisfied when that person is fulfilled emotionally during interaction with the system.
To quantitatively identify personal satisfaction, human emotions should first be addressed accurately. Brain–computer interface (BCI) technology is a way to quantify human emotions that can be used to infer satisfaction [8]. The BCI uses one of the biosignals, brain activity, to decode human thoughts, such as emotion [9,10], attention [11,12,13,14,15], and vigilance [16]. The decoded outputs can be used to identify the type of emotion (e.g., happy, angry, and excited), level of attention, or vigilance directly. Eye movement can also be used to explore the current status (emotion) of a human during a specific task [17]. To utilize these methods to decode human emotion in detail, however, the characteristics of biosignals in each emotional state need to be defined precisely in advance. It is difficult to secure sufficient sensitivity for classification without these precise criteria.
On the contrary, there is another way to quantitatively identify emotional satisfaction, called Kansei engineering or affective engineering [18]. Through this, it is possible to evaluate the user’s emotional satisfaction with the product, or to identify the design parameters of the system to enhance the emotional satisfaction of the user. Li et al. [19] presented a method for optimizing user emotion using the Kansei engineering approach for product design, and Kim et al. [20] proposed a framework for evaluating users’ emotional satisfaction using Kansei engineering. One advantage of the Kansei engineering approach is its relatively higher resolution in classifying users’ emotional states, because they are evaluated in terms of a questionnaire consisting of a variety of adjectives that express feelings and emotions [21]. If it is possible to address the changes in emotional states of the users in detail using the Kansei engineering approach when interacting with intelligent systems, this information can be provided as the criteria for classifying biosignals of different emotions.
In this study, we utilized the Kansei engineering approach to identify users’ emotional satisfaction during interaction with a VIS using a variety of conversation styles. The purpose of this study is to confirm that the Kansei engineering approach can be used as a sensitivity measure in the evaluation of emotional satisfaction for HAII in VIS. In addition, design parameters that have a significant influence on emotional satisfaction and the degree of their influence are identified.

2. Materials and Methods

To build human-centered interaction, the VIS needs to modify its style of conversation according to the context of use by changing the design parameters that complete the style of VIS. This section describes the development of the VIS software, evaluation scenarios, and design parameters of the VIS to be evaluated.

2.1. Voice-Based Intelligent System Design

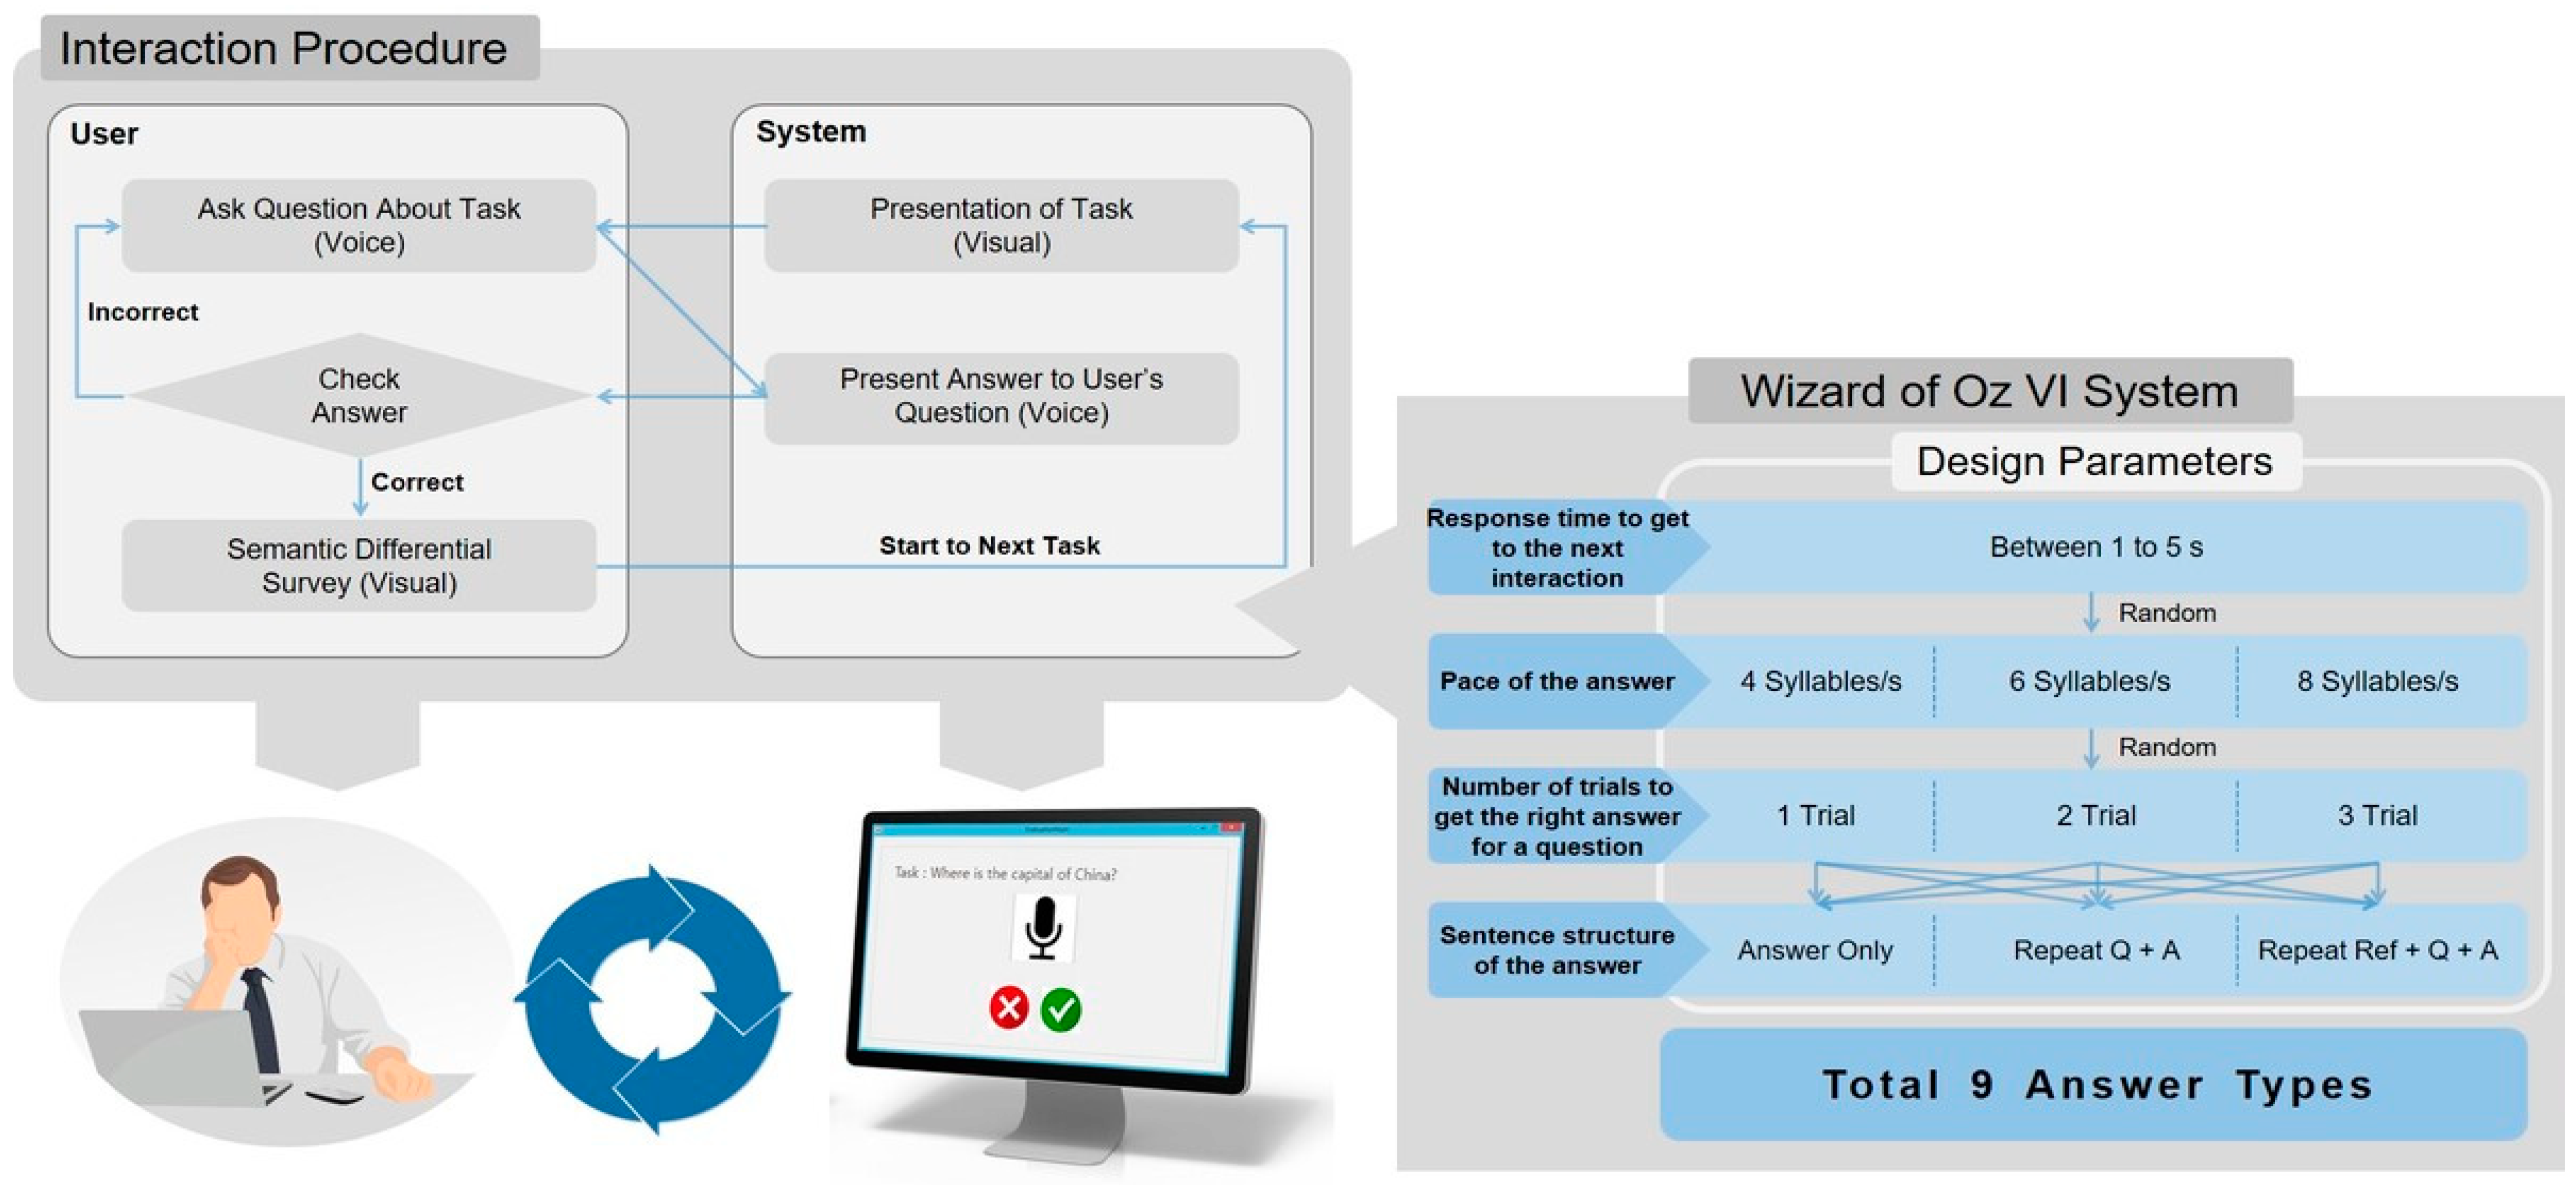
The currently launched VIS (Bixby (Samsung Electronics), Siri (Apple Inc.), etc.) are complete systems, but the design parameters cannot directly be controlled; therefore, we have conducted research to develop an evaluation system using the Wizard of Oz (WoZ) experiment [22]. In the field of HCI, a WoZ experiment is a research experiment in which subjects interact with a computer system that they believe to be autonomous, but the system is actually being operated or partially operated by an unseen human being [23,24]. Large et al. [25] developed and evaluated a WoZ-type voice interface to implement an interaction situation with a voice-based interface during driving conditions. In addition, Howland and Jackson [26] conducted a study to mitigate the problems arising from interaction with users using a WoZ-type VIS. In this study, a WoZ-based adjustable VIS was constructed to evaluate the changes in user satisfaction according to the design parameters. The final four design parameters were selected based on the user requirements revealed in previous studies [27,28,29] and are listed in Table 1.
The level of the design parameters was selected based on existing research and Bixby. The “response time to get to the next interaction” is defined as the time taken by the VIS to respond to the user’s request after the user requests information. The range of this parameter was selected based on Bixby’s average response time of 2 s in order to check if there was a difference in user satisfaction when a certain amount of time was spent on the information to be presented. The experiment was designed such that the information was presented randomly between 1 and 5 s, so that the subject was unaware of the presented time. For the analysis, this parameter was classified as 1, 2, 3, and 4 s.
The “number of trials to get the right answer for a question” is defined as the number of times a user tries to obtain the desired answer. This parameter was set based on a study in which the system is reset if an error occurs up to two times; it was designed to obtain the correct answer after two attempts [30].
The “pace of the answer” is defined as the number of syllables per second of the answer; here, 4, 6, and 8 syllables/s were selected and set in three steps. Four syllables and eight syllables were added to determine the highest level of satisfaction, focusing on the six syllables per second applied to the existing Bixby.
Finally, the “sentence structure of the answer” is defined as the amount of information present in the response based on the user’s needs. The “sentence structure of the answer” was divided into three levels—“answer only”, “repeat the question and then answer”, and “repeat the question and then answer with a clear reference source”—considering the format of the answer of Bixby.
When the structure was designed by combining these four parameters, 108 interactions per subject were determined. However, considering the time, cost, and fatigue of the subject, “response time to get to the next interaction” and “pace of the answer” were designed to appear randomly in all the experiments, and nine interaction scenarios were determined by combining the remaining two parameters (“number of trials to get the right answer for a question” and “sentence structure of the answer”).
The user’s emotional satisfaction was evaluated based on the set parameters and their levels, and the hypotheses of the final study were as follows:
Hypothesis 1 (H1).
User satisfaction differs depending on the level of “response time to get to the next interaction”.
Hypothesis 2 (H2).
User satisfaction differs depending on the level of “number of trials to get the right answer for a question”.
Hypothesis 3 (H3).
User satisfaction differs depending on the level of “pace of the answer”.
Hypothesis 4 (H4).
User satisfaction differs depending on the level of the “sentence structure of the answer”.

2.2. Experiment Procedure

The experiment is conducted in such a way that the VIS is produced by the WoZ method, and the user confirms the answer to the question presented through the interaction. After confirming the proposed task, the user presses the “microphone” button and inputs the task through voice. In response to this, the VIS presents one of the scenarios that have been prepared by considering the design parameters in advance. If the user finds that the suggested answer is wrong, the user presses the “X” button and enters the command again until the correct answer is presented. If the answer is correct, the user presses the “check” button, conducts a satisfaction evaluation, and waits for the next task to appear. The interaction process can be expressed according to the flowchart shown in Figure 2.

2.3. Participants

Participants who used a VIS were selected for the experiments on satisfaction evaluation. As a basic study to measure emotional satisfaction using a VIS, 23 participants (17 males and 6 females having an average age of 27.4 years) were selected; these were young people with little reluctance to new technologies. Before the experiment was conducted, the VIS, the method of using the system, the experimental procedure, and the purpose of the study were described. After conducting the experiment, it was observed that three datasets had outliers in the data and were, therefore, not used for analysis. Thus, the evaluation results were derived based on the datasets of the final 20 experiments. Figure 3 shows the environment of the interaction experiment.

2.4. Data Collection

In this study, Kansei engineering was used to measure emotional satisfaction with the HAII. Kansei engineering can measure emotions using Kansei words (KWs). A KW is a word that expresses emotion and is mainly used as an adjective. This was derived using the semantic differential method. Osgood et al. [31] developed the semantic differential method as an application of Osgood’s more general attempt to measure the semantics or meaning of words, particularly adjectives, and their referent concepts. The KWs derived using the semantic differential method extracted only the significant words that helped in expressing the user’s emotion through three preliminary tests (Table 2). For the nine interaction scenarios of the VIS, the final 30 KWs were measured on a 7-point Likert scale to check which user’s emotion was closer.

2.5. Statistical Method

In this study, exploratory factor analysis (EFA) and analysis of variance (ANOVA) were used to statistically analyze emotional satisfaction data. All analyses were conducted using Minitab 18. EFA serves to identify potential structures based on the correlations between measured variables [32]. In this study, EFA was used to derive KW clusters with commonality based on the correlation between KW scores, and ANOVA was used to test the four aforementioned hypotheses. Differences in each parameter level were statistically analyzed using the mean and variance values of the KW score. The overall statistical analysis was performed based on a significance level (α) of 0.05.

3. Results

The emotional axes and the user’s emotional scores were derived using EFA. ANOVA was performed using the mean and variance values of the emotional scores to analyze whether there was a difference in satisfaction for each design parameter. Finally, the emotional differentiation of the user based on the design parameters was performed on the emotional axes.

3.1. Exploratory Factor Analysis

The emotional scores collected using 30 pairs of KWs were analyzed using EFA. The analysis was conducted using varimax rotation and principal component extraction. From the scree plot, it was confirmed that the KWs were structured by two factors. Factor 1 includes ten KWs, and factor 2 includes nine KWs, as shown in Table 3.
Table 3 summarizes the two factors that reduced using factor analysis and the KWs belonging to those factors. It is evident that 10 and 9 KWs, respectively, were aggregated as two factors, and 65% of the total KWs explained the emotion in the interaction situation. Based on the factor score of the KWs, which belong to the two factors, the names of the factors were determined based on the opinions of three Kansei engineering experts. The name of the suggested factor was set as the emotion that can be expressed on behalf of the feeling that occurs when interacting with the VIS. The first axis was named “pleasurability” because the cluster of emotions that occur when interacting can be referred to as pleasant and lighthearted with no difficulty. The second axis was called “reliability” because the cluster of emotions that arise refers to communication skills, such as the ability to speak clearly and respond to VIS interactions. To check the difference in emotions according to the design parameters of the VIS around the derived emotion axis, the user’s emotional scores were mapped, and ANOVA was used to evaluate the difference in emotional satisfaction.

3.2. Analysis of Variance

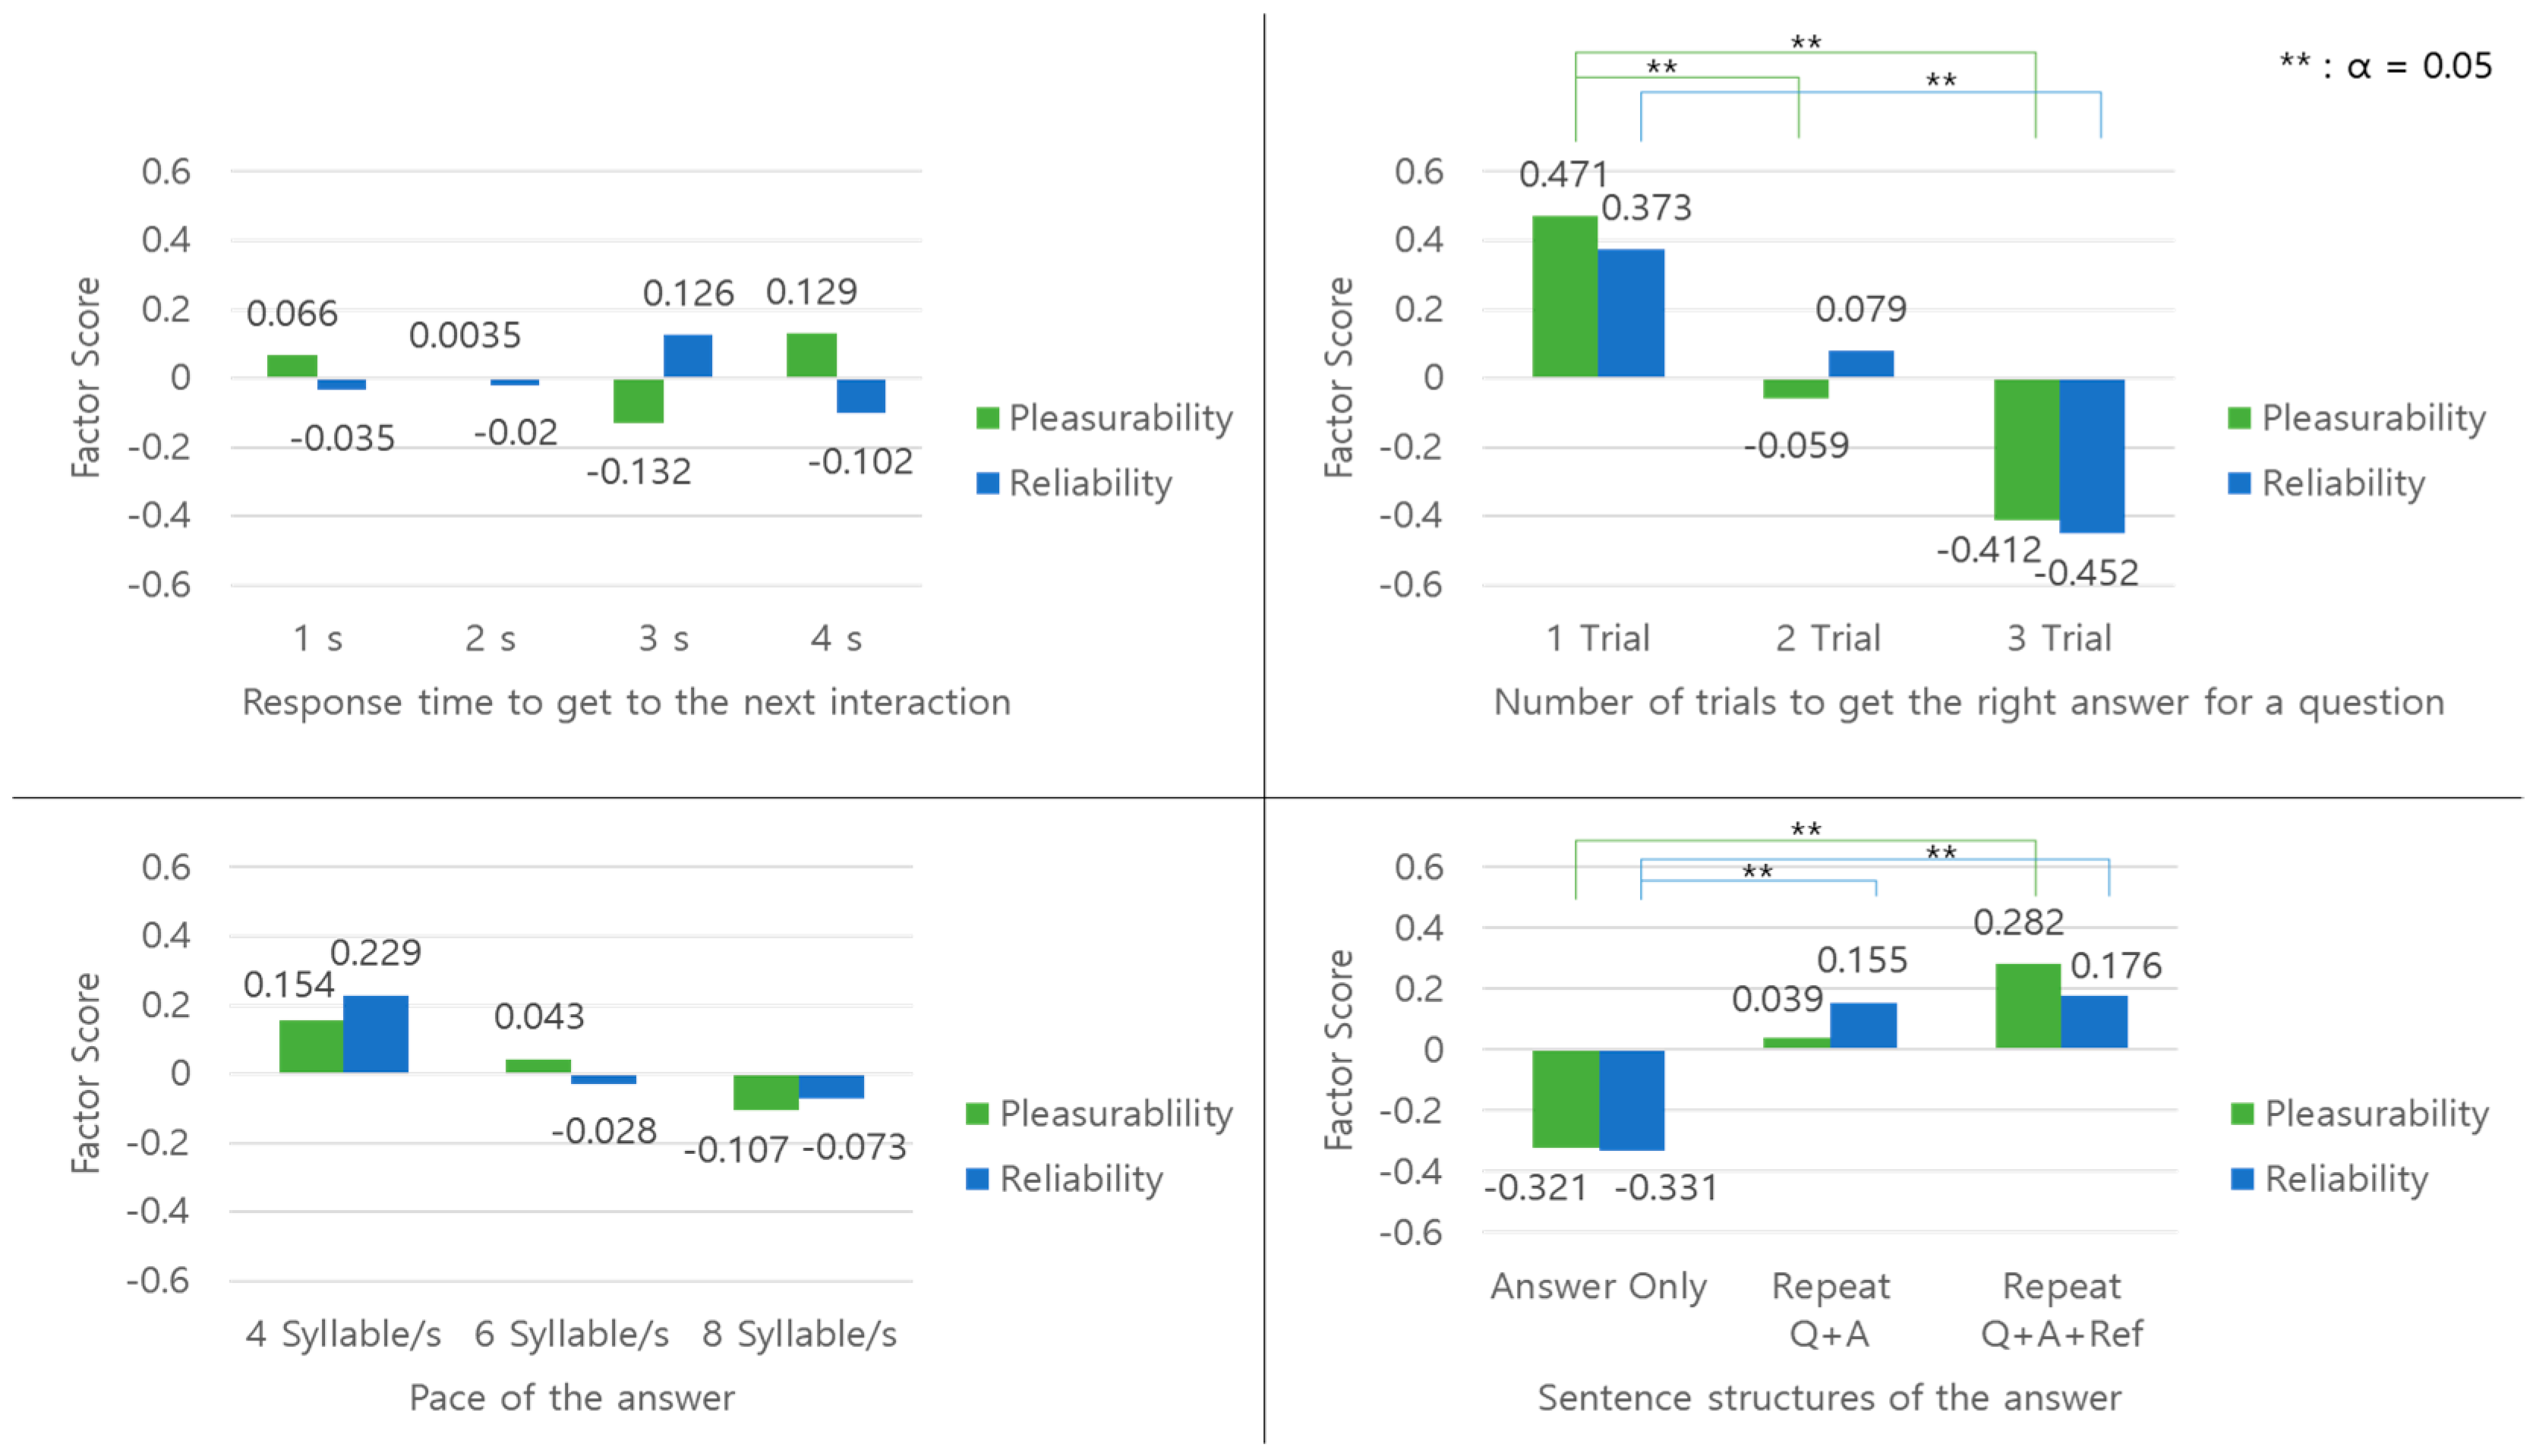
As shown in Figure 4, the emotional scores of users were analyzed based on the four design parameters and two derived axes (pleasurability and reliability). The ANOVA results obtained for the four design parameters are presented in Appendix A.
Of the four design parameters, “response time to get to the next interaction” and “pace of the answer” exhibited no difference between levels in terms of both pleasurability and reliability. Among them, “pace of the answer” exhibited relatively high emotional satisfaction with four syllables/s; however, statistically, there was no significant difference. The “number of trials to get the right answer for a question” shows that both pleasurability and reliability decrease as the number of trials increases. On the pleasurability axis, when the question needs to be asked more than once, the satisfaction decreases significantly, and there is a statistical difference. For reliability, it was observed that up to two trials, the statistically significant difference did not decrease the satisfaction sufficiently, but when three trials were conducted, satisfaction decreased significantly. The “sentence structure of the answer” showed that the satisfaction in the pleasurability axis increased significantly when detailed information was presented rather than a simple answer, and it was confirmed that there exists a statistically significant difference. In the case of reliability, because the emotions of “repeat the question and then answer” and “repeat the question and then answer with a clear reference source” are similar, it is thought that the action that informs the system that the user understands the intention of the user’s question is the key to securing trust.

3.3. Classification of Emotional Satisfaction According to the Design Parameters

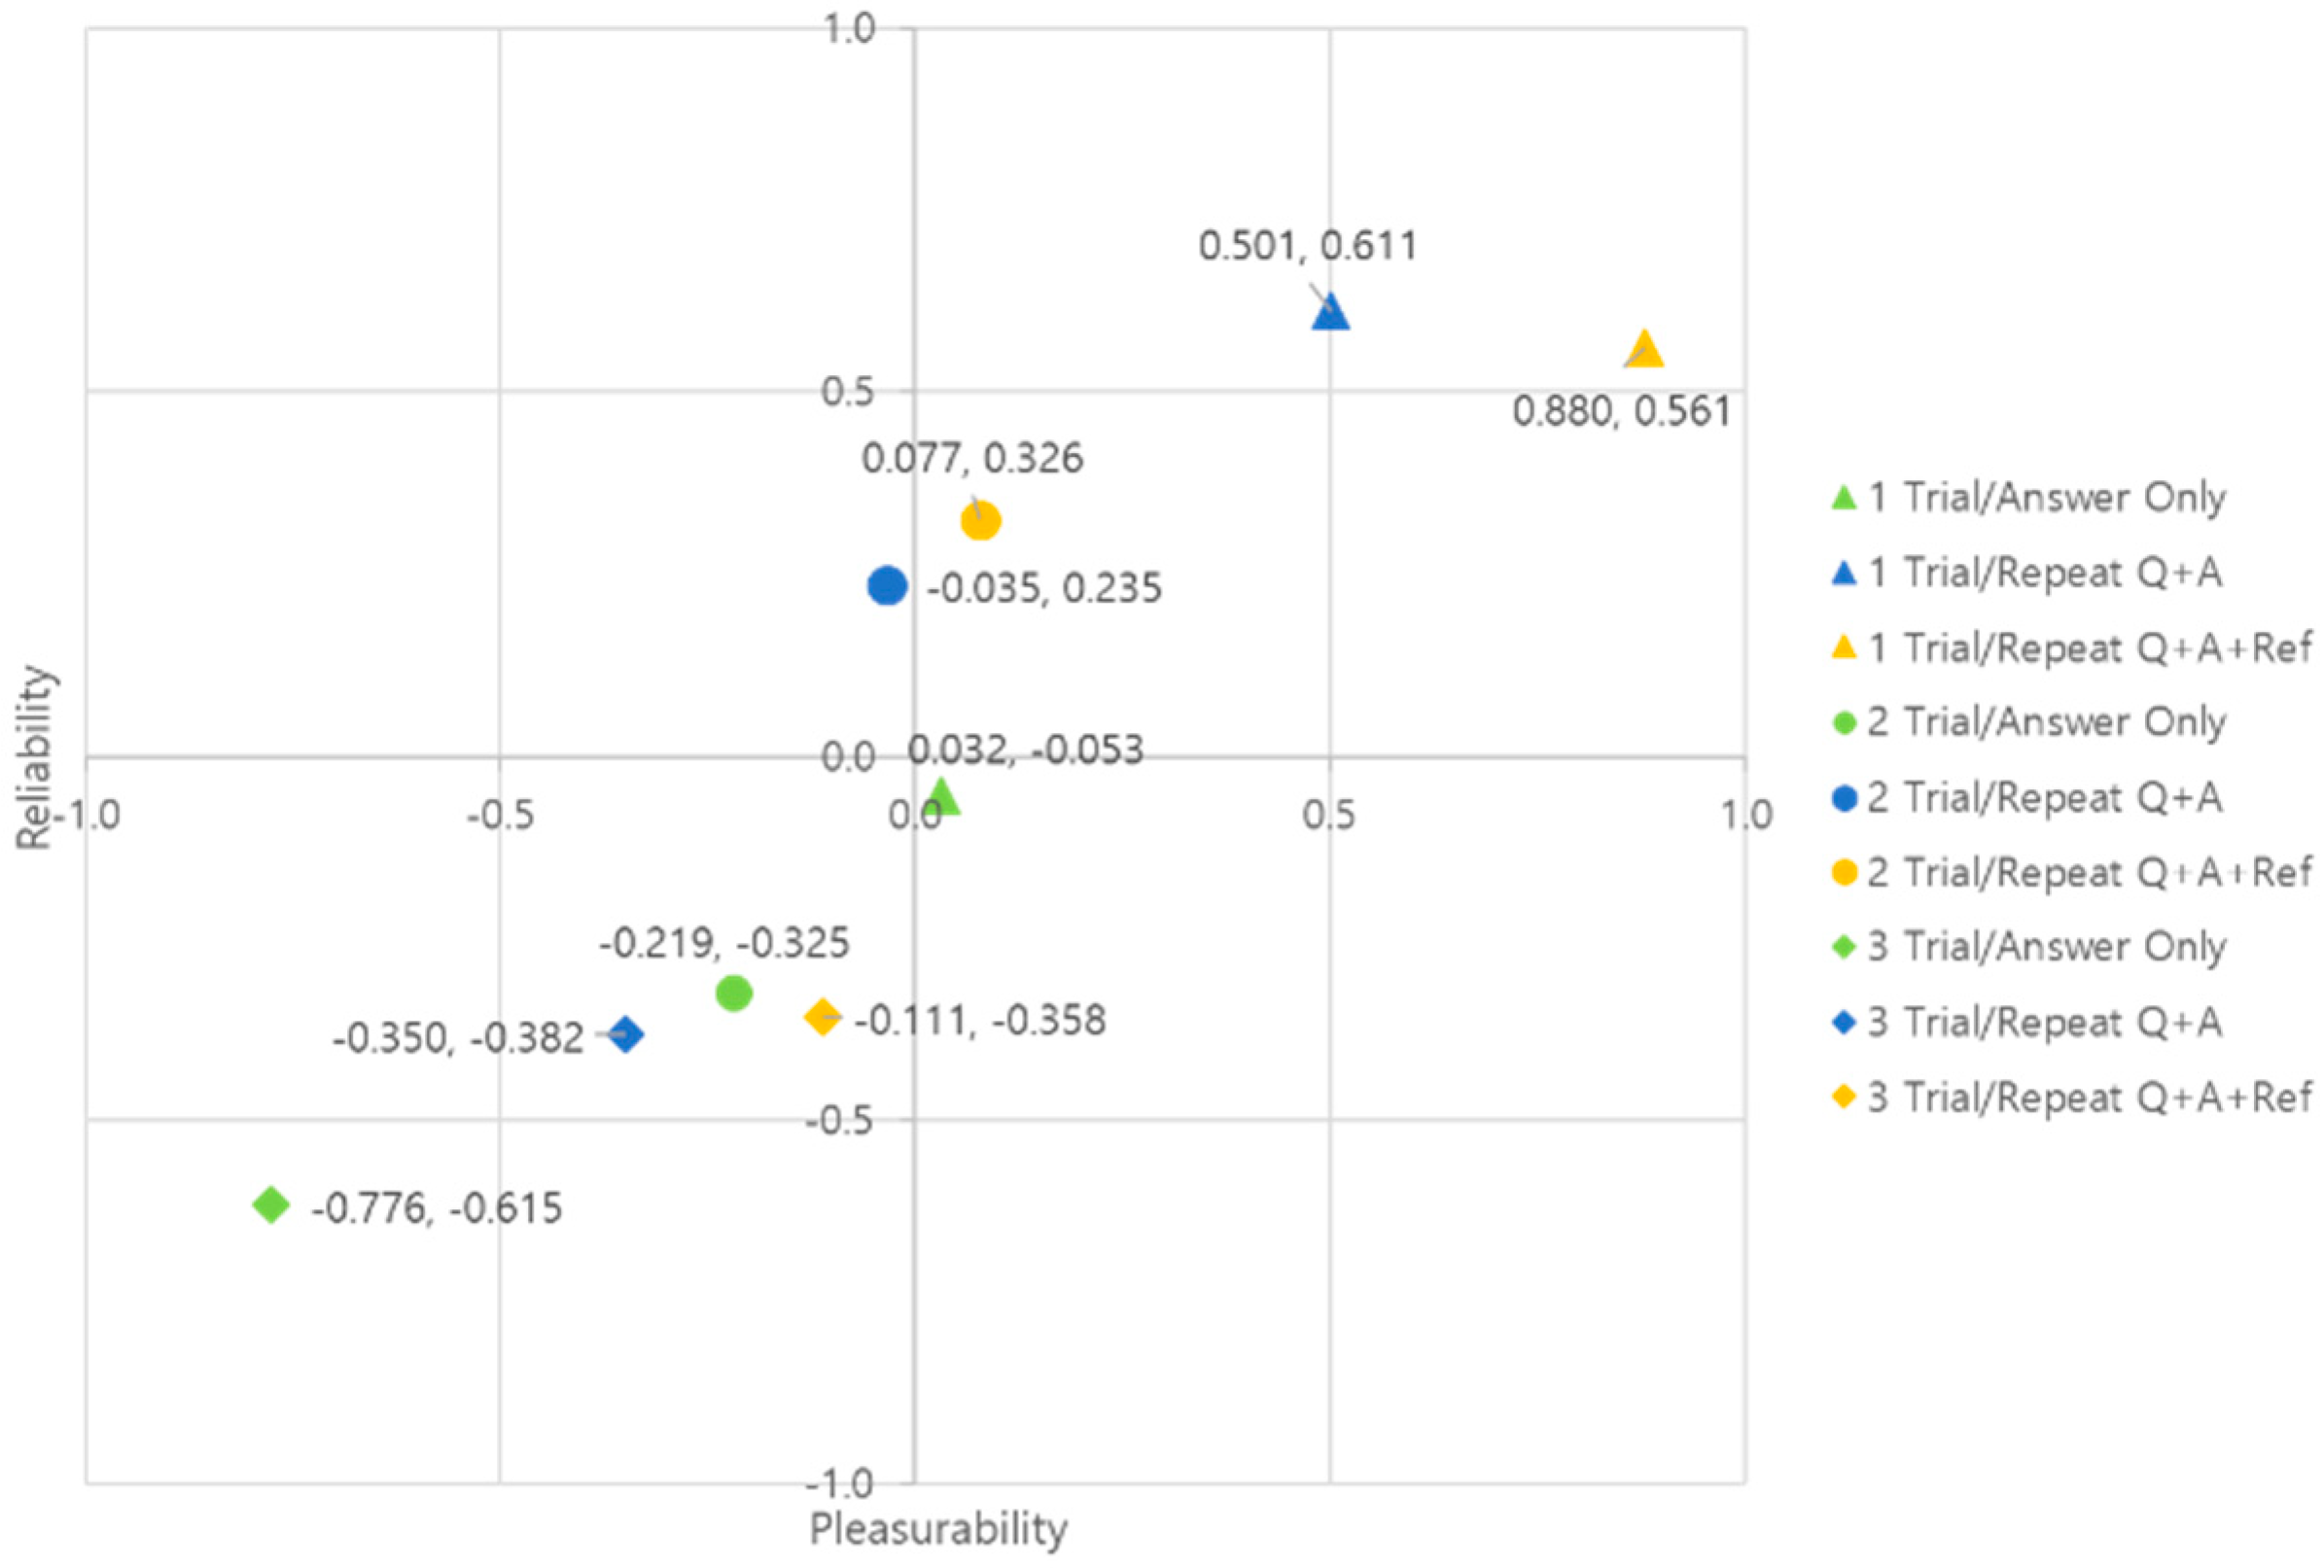
The ANOVA results proved that among the four hypotheses, H2 and H4 caused a difference in emotional satisfaction. The results of the classification of user emotional satisfaction for the final VIS obtained by integrating the proven “number of trials to get the right answer for a question” (three levels) and “sentence structure of the answer” (three levels) are shown in Figure 5.
In the graph, “number of trials to get the right answer for a question” can be distinguished by shape, and “sentence structure of the answer” can be identified by color. The influence of these two parameters on each other was confirmed using ANOVA, and it was confirmed that the two parameters independently influenced emotional satisfaction with pleasurability (p = 0.749) and reliability (p = 0.808) axes. Furthermore, emotional satisfaction was classified using Tukey analysis, and the pleasurability and reliability axes were classified into three and four levels, respectively, as shown in Table 4.
Clusters that share texts have similar relationships. Both pleasure and confidence are detailed concerning the answer and obtain high emotional satisfaction when the user understands it at once. In terms of pleasure, “2 Trials/Answer Only” has a lower satisfaction than “3 Trials/Q + A + Ref”. Therefore, the “sentence structure of the answer” seems to have a greater influence on the satisfaction of the pleasurability axis as compared to that of the “number of trials”. In addition, in terms of reliability, “number of trials” is the key to increasing the user’s voice recognition rate of the system to obtain reliability because attempting three questions is the least satisfactory, regardless of the structure of the answer.

4. Discussion

4.1. Validity of the Kansei Engineering Approach

Identifying the user’s emotional satisfaction that occurs in the process of interacting with an intelligent system is a very important point in designing high-quality HAII. In particular, it is necessary to understand what kind of emotions are generated and develop in a direction that can increase the satisfaction level of emotions. In this study, we confirmed the emotions generated by users in voice-based HAII using the Kansei engineering approach. By quantitatively evaluating the emotions through 30 KWs, two representative emotions were derived—“pleasurability” and “reliability”—and emotion classification was conducted. Human emotions are mostly classified based on Ekman’s six basic human emotions (joy, sadness, anger, fear, disgust, and surprise) [33] or valence-arousal (positive/negative and active/passive, VA) [34]. This method is simple for setting emotion standards; however, it may have the disadvantage of being limited in expressing the complex emotions of human beings specifically. The Kansei engineering approach used in this study can measure complex emotions because it is free to select any KW. In the case of pleasurability, it is possible to confirm it as a basic emotion, but reliability is difficult to confirm with basic emotions or the VA model. Several studies have been conducted to evaluate satisfaction with a VIS in advance. Purington et al. [5] conducted a qualitative evaluation of Amazon Echo, focusing on interaction satisfaction and personalization based on user reviews. Pyae and Joelsson [35] qualitatively evaluated Google Home using a survey on usability and user experience. Qualitative evaluation is difficult to express clearly in expressing satisfaction in a way that draws conclusions through subjective evaluation of experts based on individual opinions of users. In contrast, this study designed a VIS using the WoZ method based on user requirements and implemented an environment in which users can interact directly. The data were collected and evaluated using KWs, which express the user’s emotions. This study can be seen as a more detailed study in that it goes beyond the verification of the effect of the VIS on the user’s emotions, and identifies design parameters of the system that affect the user’s emotions. Thus, it is believed that this study is the first to quantitatively confirm the direct emotion of the user in the interaction. In addition, our study can be viewed as more detailed in that it is possible to identify design parameters that influence the user’s emotion among design parameters of the VIS and to quantitatively grasp the degree of its influence. Through this, it was confirmed that the Kansei engineering approach can derive the user’s detailed emotions in HAII and clearly present the level that is suitable for use in evaluating the user’s emotional satisfaction.

4.2. User Emotion Classification According to Design Parameters

In this study, various styles of conversation based on four design parameters were presented in dialog with the VIS, and the emotions felt toward the users were evaluated. As a result of identifying the difference in emotion according to the level of the used design parameters, a difference in emotional satisfaction was observed depending on the number of trials and the sentence structure, and the response time and pace of the answer did not significantly affect the user’s “pleasurability” and “reliability.” It can be seen that the number of trials and the sentence structure are more sensitive to changes in the user’s emotions than the response time and pace of the answer. The response time and pace of the answer did not significantly affect emotion in this study, but since they are important parameters that can be changed in real products, it is judged that additional research needs to be conducted by diversifying the level of the parameters in order to confirm the change in emotion. In contrast, it was confirmed that the two design parameters (number of trials and sentence structure) that showed a statistically significant difference in emotional satisfaction were classified into three levels of pleasurability and four levels of reliability. Table 5 shows the structure of the level of satisfaction classification in an integrated manner for pleasurability and reliability.
Table 5 shows that the user’s emotions can be subdivided according to the style of conversation, rather than simply classifying satisfaction as high/low. As a result of this study, the form of dialogue that belongs to the highest level of satisfaction in the four levels of satisfaction classification was found to be one trial, when the question or the reference was mentioned. However, in terms of pleasurability, the number of trials was 1 and the reference was mentioned; in the case of reliability, the number of trials was 1, and the satisfaction was highest in the form of mentioning the question. This shows that there is a need to lead a conversation in a form tailored to a group that values reliability more among users and a group that values pleasurability more. To overcome this, the VIS must understand the characteristics of the user and secure a conversation that considers the user, and finally, establish a customized interaction. In this study, the possibility of classifying design parameters was secured, but an experiment was performed on 20 subjects that did not consider their characteristics. Therefore, among the variety of styles of conversations classified into four levels of satisfaction, there is a limitation in that it was not possible to identify the most suitable conversation type for individual users. Personalization and customization need to be fully implemented in order to optimize user-adaptive interactions, but there are still technical limitations. To overcome these limitations, it is necessary to secure as many user characteristics (human factors) as possible, and design accordingly. Moscato et al. described a novel music recommendation technique based on the identification of personality traits, moods, and emotions [36], and a novel recommender system that provides recommendations based on the interaction between users and multimedia content [37]. Cárdenas et al. [6] conducted a study to derive the human factors of a user that need to be considered when designing information systems for autonomous vehicles. If the user’s human factors are structured, the VIS can be designed, and personalized interaction according to the human factors is possible; it is then possible to obtain a considerable level of personalization and customization. The limitations of this study can be supplemented by conducting subsequent evaluation studies.

4.3. Integration of Kansei Engineering Approach and Biosignals

In this study, evaluation was conducted through a questionnaire using the Kansei engineering approach. The Kansei engineering approach has the advantage of being able to identify various sensibilities and easy classifications. However, since the questionnaire is conducted based on the perceived sensibility that occurs after the interaction, the truth of the user’s emotional expression may be distorted. In addition, the evaluation method in the form of a questionnaire has a major disadvantage in that it cannot be evaluated in real time during HAII, which is an obstacle for constructing adaptive interaction in real time. To overcome these disadvantages, efforts should be made to overcome the limitations of the survey method presented in this study. In recent years, many studies using biosignals or facial expressions have been conducted to evaluate emotions. Electroencephalography is used to check real-time emotional changes [38], and it is possible to evaluate integrated emotions using multiple biosignals, such as photoplethysmography or electrocardiograms [39]. However, because most studies do not have a standard for evaluating emotions using biosignals, they display it using pictures or photos that can induce emotions, and infer the emotion based on the changes in biosignals that occur accordingly [40,41]. It is believed that in the future, it will be extremely important to collect real-time biodata in an interaction situation and analyze the emotional changes in terms of “pleasurability” and “reliability” using biosignals in this research environment. Therefore, in future research, a framework that integrates biosignals and Kansei engineering data should be created to evaluate the user’s emotional satisfaction, and the questionnaire data using the Kansei engineering approach are used as supervised learning labels for biosignal data. It is expected that HAII will be able to evaluate real-time user emotional satisfaction. This can lay an important foundation for evaluating a user’s emotional satisfaction during interaction with various intelligent systems, which can ensure user satisfaction when designing intelligent systems.

5. Conclusions

In this study, the user satisfaction of HAII, which is different from the existing HCI, was evaluated using a VIS. Among the design parameters constituting the VIS, parameters for user emotional satisfaction were identified, and the degree of emotional classification between the levels of design parameters was evaluated. In this process, it was confirmed that the emotions generated in HAII were pleasure and trust. In addition, the validity of the Kansei engineering approach was established. As a result of classifying emotions around the two design parameters that affect satisfaction among the four design parameters, it was proved that emotions can be classified by subdividing them into four levels of satisfaction. Furthermore, future studies should evaluate the optimal form of dialog for a group of subjects that considers human factors to establish personalization and customization, and more varying design parameters defined in advance should be applied [42]. In addition, we will conduct research integrating the Kansei engineering approach and biosignal data to secure real-time data.
In this study, a method for evaluating emotional satisfaction was presented to implement a user-adaptive interaction. Our findings and future research can be applied to other intelligent HCI applications that can utilize a VIS, such as autonomous cars and smart homes, through changes in design parameters to be considered. Furthermore, our findings can be extended to the evaluation of multimodal interaction using other senses, such as vision and sensation.

Author Contributions

Conceptualization, J.-G.S., G.-Y.C., H.-J.H., and S.-H.K.; Methodology, J.-G.S. and S.-H.K.; Software, J.-G.S. and G.-Y.C.; Validation, J.-G.S. and G.-Y.C.; Formal analysis, J.-G.S. and G.-Y.C.; Investigation, J.-G.S. and G.-Y.C.; Resources, S.-H.K.; Data curation, H.-J.H. and S.-H.K.; Writing—original draft preparation, J.-G.S., G.-Y.C., and H.-J.H.; Writing—review and editing, J.-G.S., G.-Y.C., H.-J.H., and S.-H.K.; Visualization, J.-G.S. and G.-Y.C.; Supervision, S.-H.K.; Project administration, H.-J.H. and S.-H.K.; Funding acquisition, H.-J.H. and S.-H.K. All authors have read and agreed to the published version of the manuscript.

Funding

This research was supported by the Basic Research Program through the National Research Foundation of Korea (NRF) funded by the MSIT (2020R1A4A1017775).

Institutional Review Board Statement

The study was conducted according to the guidelines of the Declaration of Helsinki and approved by the Ethics Committee of Kumoh National Institute of Technology (202007-HR-003-01).

Informed Consent Statement

Informed consent was obtained from all subjects involved in the study.

Data Availability Statement

The data presented in this study are available on request from the corresponding author. The data are not publicly available due to privacy.

Conflicts of Interest

The authors declare no conflict of interest.

Appendix A. ANOVA Tables for Design Parameters

Table A1. One-way ANOVA for “Response time to get to the next interaction”.
Pleasurability
SourceDFAdj SSAdj MSF-Valuep-Value
Response time31.3730.4580.450.715
Error176177.6271.009
Total179179.000
Reliability
SourceDFAdj SSAdj MSF-Valuep-Value
Response time31.0680.3560.350.788
Error176177.9321.011
Total179179.000
Table A2. One-way ANOVA for “Number of trials to get the right answer for a question”. **: p-value < 0.05.
Pleasurability
SourceDFAdj SSAdj MSF-Valuep-Value
Number of trials223.7211.85913.520.000 **
Error177155.280.877
Total179179.000
Reliability
SourceDFAdj SSAdj MSF-Valuep-Value
Number of trials220.9610.48211.740.000 **
Error177158.040.8929
Total179179.000
Table A3. One-way ANOVA for “Pace of the answer”.
Pleasurability
SourceDFAdj SSAdj MSF-Valuep-Value
Pace of the answer21.7930.8970.90.41
Error177177.2071.0012
Total179179.000
Reliability
SourceDFAdj SSAdj MSF-Valuep-Value
Pace of the answer22.1871.0941.090.337
Error177176.8130.999
Total179179.000
Table A4. One-way ANOVA for “Sentence structure of the answer”. **: p-value < 0.05.
Pleasurability
SourceDFAdj SSAdj MSF-Valuep-Value
Sentence structure211.055.5275.830.004 **
Error177167.950.949
Total179179.000
Reliability
SourceDFAdj SSAdj MSF-Valuep-Value
Sentence structure29.8844.9425.170.007 **
Error177169.1160.955
Total179179.000
Table A5. Two-way ANOVA for “Number of Trials and Sentence structure”. **: p-value < 0.05.
Pleasurability
SourceDFAdj SSAdj MSF-Valuep-Value
Number of trials223.71811.85914.220.000 **
Sentence structure211.0555.5276.630.002 **
Trials X Structure41.6080.4020.0480.749
Error171142.6190.834
Total179179.000
Reliability
SourceDFAdj SSAdj MSF-Valuep-Value
Number of trials220.96410.48212.210.000 **
Sentence structure29.8844.9425.760.004 **
Trials X Structure41.3750.3450.40.808
Error171146.7770.858
Total179179.000

References

  1. Mhatre, O.; Barshe, S.; Jadhav, S. Invoice: Intelligent Voice System for Mobile Phones. Int. J. Innov. Adv. Comput. Sci. 2018, 7, 153–160. [Google Scholar]
  2. Choe, J.H.; Kim, H.T. A Survey Study on the Utilization Status and User Perception of the VUI of Smartphones. J. Soc. e-Bus. Stud. 2017, 21, 29–40. [Google Scholar] [CrossRef] [Green Version]
  3. Amershi, S.; Weld, D.; Vorvoreanu, M.; Fourney, A.; Nushi, B.; Collisson, P.; Suh, J.; Iqbal, S.; Bennett, P.N.; Inkpen, K.; et al. Guidelines for Human-AI Interaction. In Proceedings of the 2019 CHI Conference on Human Factors in Computing Systems, Glasgow, Scotland, 4–9 May 2019; pp. 1–13. [Google Scholar]
  4. Pandita, R.; Bucuvalas, S.; Bergier, H.; Chakarov, A.; Richards, E. Towards JARVIS for Software Engineering: Lessons Learned in Implementing a Natural Language Chat Interface. In Proceedings of the Workshops at the Thirty-Second AAAI Conference on Artificial Intelligence, New Orleans, LA, USA, 2–7 February 2018; pp. 779–782. [Google Scholar]
  5. Purington, A.; Taft, J.G.; Sannon, S.; Bazarova, N.N.; Taylor, S.H. Alexa is my new BFF: Social Roles, User Satisfaction, and Personification of the Amazon Echo. In Proceedings of the 2017 CHI Conference Extended Abstracts on Human Factors in Computing Systems, Denver, CO, USA, May 2017; pp. 2853–2859. [Google Scholar]
  6. Cárdenas, J.F.S.; Shin, J.G.; Kim, S.H. A Few Critical Human Factors for Developing Sustainable Autonomous Driving Technology. Sustainability 2020, 12, 3030. [Google Scholar] [CrossRef] [Green Version]
  7. Walter, A. Designing for Emotion, 2nd ed.; A Book Apart: New York, NY, USA, 2011; pp. 1–978. [Google Scholar]
  8. Hwang, H.J.; Kim, S.; Choi, S.; Im, C.H. EEG-based brain-computer interfaces: A thorough literature survey. Int. J. Hum. Comput. Interact. 2013, 29, 814–826. [Google Scholar] [CrossRef]
  9. Pan, J.; Xie, Q.; Huang, H.; He, Y.; Sun, Y.; Yu, R.; Li, Y. Emotion-related consciousness detection in patients with disorders of consciousness through an EEG-based BCI system. Front. Hum. Neurosci. 2018, 12, 198. [Google Scholar] [CrossRef] [Green Version]
  10. Al-Nafjan, A.; Hosny, M.; Al-Wabil, A.; Al-Ohali, Y. Classification of human emotions from electroencephalogram (EEG) signal using deep neural network. Int. J. Adv. Comput. Sci. Appl. 2017, 8, 419–425. [Google Scholar] [CrossRef]
  11. Katona, J.; Kovari, A. A Brain–Computer Interface Project Applied in Computer Engineering. IEEE Trans. Educ. 2016, 59, 319–326. [Google Scholar] [CrossRef]
  12. Katona, J.; Ujbanyi, T.; Sziladi, G.; Kovari, A. Electroencephalogram-based brain-computer interface for internet of robotic things. In Cognitive Infocommunications, Theory and Applications; Springer: Berlin/Heidelberg, Germany, 2019; Volume 13, pp. 253–275. [Google Scholar]
  13. Katona, J.; Ujbanyi, T.; Sziladi, G.; Kovari, A. Speed control of Festo Robotino mobile robot using NeuroSky MindWave EEG headset based brain-computer interface. In Proceedings of the 2016 7th IEEE international conference on cognitive infocommunications, Wroclaw, Poland, 16–18 October 2016; pp. 251–256. [Google Scholar]
  14. Katona, J. Examination and comparison of the EEG based Attention Test with CPT and TOVA. In Proceedings of the 2014 IEEE 15th International Symposium on Computational Intelligence and Informatics, Budapest, Hungary, 19–21 November 2014; pp. 117–120. [Google Scholar]
  15. Katona, J.; Ujbanyi, T.; Sziladi, G.; Kovari, A. Examine the effect of different web-based media on human brain waves. In Proceedings of the 2017 8th IEEE International Conference on Cognitive Infocommunications, Debrecen, Hungary, 11–14 September 2017; pp. 407–412. [Google Scholar]
  16. Katona, J.; Kovari, A. Examining the learning efficiency by a brain-computer interface system. Acta Polytech. Hung. 2018, 15, 251–280. [Google Scholar]
  17. Kovari, A.; Katona, J.; Costescu, C. Evaluation of eye-movement metrics in a software debugging task using gp3 eye tracker. Acta Polytech. Hung. 2020, 17, 57–76. [Google Scholar] [CrossRef]
  18. Nagamachi, M. Kansei engineering: A new ergonomic consumer-oriented technology for product development. Int. J. Ind. Ergon. 1995, 15, 3–11. [Google Scholar] [CrossRef]
  19. Li, Y.; Shieh, M.D.; Yang, C.C. A posterior preference articulation approach to Kansei engineering system for product form design. Res. Eng. Des. 2019, 30, 3–19. [Google Scholar] [CrossRef]
  20. Kim, S.H.; Kim, S.A.; Shin, J.K.; Ahn, J.Y. A Human Sensibility Ergonomic Design for Developing Aesthetically and Emotionally Affecting Glass Panels of Changing Colors. J. Ergon. Soc. Korea 2016, 35, 535–550. [Google Scholar] [CrossRef] [Green Version]
  21. Daud, N.A.; Aminudin, N.I.; Redzuan, F.; Ashaari, N.S.; Muda, Z. Identification of persuasive elements in Islamic knowledge website using Kansei engineering. Bull. Electr. Eng. Inform. 2019, 8, 313–319. [Google Scholar] [CrossRef]
  22. Shin, J.G.; Kim, J.B.; Kim, S.H. A Framework to Identify Critical Design Parameters for Enhancing User’s Satisfaction in Human-AI Interactions. J. Phys. Conf. Ser. 2019, 1284, 237–243. [Google Scholar] [CrossRef]
  23. Kelley, J.F. An iterative design methodology for user-friendly natural language office information applications. ACM Trans. Inf. Syst. 1984, 2, 26–41. [Google Scholar] [CrossRef]
  24. Martin, B.; Hanington, B. Universal Methods of Design 100 Ways to Research Complex Problems, Develop Innovative Ideas, and Design Effective Solutions; Rockport Publishers: Beverly, MA, USA, 2012. [Google Scholar]
  25. Large, D.R.; Clark, L.; Quandt, A.; Burnett, G.; Skrypchuk, L. Steering the conversation: A linguistic exploration of natural language interactions with a digital assistant during simulated driving. Appl. Ergon. 2017, 63, 53–61. [Google Scholar] [CrossRef]
  26. Howland, K.; Jackson, J. Investigating Conversational Programming for End-Users in Smart Environments through Wizard of Oz Interactions. In Proceedings of the Psychology of Programming Interest Group—29th Annual Workshop, London, UK, 5–7 September 2018; pp. 107–110. [Google Scholar]
  27. Dybkjær, L.; Minker, W. Recent Trends in Discourse and Dialogue; Springer Science & Business Media: Berlin, Germany, 2008. [Google Scholar]
  28. Farinazzo, V.; Salvador, M.; Kawamoto, A.L.S.; de Oliveira Neto, J.S. An empirical approach for the evaluation of voice user interfaces User Interfaces. IntechOpen 2010, 153–164. [Google Scholar] [CrossRef]
  29. Kouroupetroglou, G.; Spiliotopoulos, D. Usability Methodologies for Real-Life Voice User Interfaces. Int. J. Inf. Technol. Web Eng. 2009, 4, 78–94. [Google Scholar] [CrossRef] [Green Version]
  30. Lee, M.J.; Hong, K.H. Design and implementation of a usability testing tool for user-oriented design of command and control voice user interfaces. Phon. Speech Sci. 2011, 3, 79–87. [Google Scholar]
  31. Osgood, C.E.; Suci, G.J.; Tannenbaum, P.H. The Measurement of Meaning, 1st ed.; University of Illinois press: Urbana, IL, USA, 1957; pp. 18–30. [Google Scholar]
  32. Fabrigar, L.R.; Wegener, D.T.; MacCallum, R.C.; Strahan, E.J. Evaluating the use of exploratory factor analysis in psychological research. Psychol. Methods 1999, 4, 272–299. [Google Scholar] [CrossRef]
  33. Eckman, P. Universal and cultural differences in facial expression of emotion. Neb. Symp. Motiv. 1972, 19, 207–283. [Google Scholar]
  34. Russell, J.A. A circumplex model of affect. J. Personal. Soc. Psychol. 1980, 39, 1161–1178. [Google Scholar] [CrossRef]
  35. Pyae, A.; Joelsson, T.N. Investigating the usability and user experiences of voice user interface: A case of Google home smart speaker. In Proceedings of the 20th International Conference on Human-Computer Interaction with Mobile Devices and Services Adjunct, Barcelona, Spain, 3–6 September 2018; pp. 127–131. [Google Scholar]
  36. Moscato, V.; Picariello, A.; Sperli, G. An emotional recommender system for music. IEEE Intell. Syst. 2020. [Google Scholar] [CrossRef]
  37. Amato, F.; Moscato, V.; Picariello, A.; Sperlí, G. Recommendation in social media networks. In Proceedings of the 2017 IEEE Third International Conference on Multimedia Big Data, Laguna Hills, CA, USA, 19–21 April 2017; pp. 213–216. [Google Scholar]
  38. Liu, Y.J.; Yu, M.; Zhao, G.; Song, J.; Ge, Y.; Shi, Y. Real-time movie-induced discrete emotion recognition from EEG signals. IEEE Trans. Affect. Comput. 2017, 9, 550–562. [Google Scholar] [CrossRef]
  39. Ayata, D.; Yaslan, Y.; Kamasak, M.E. Emotion Recognition from Multimodal Physiological Signals for Emotion Aware Healthcare Systems. J. Med Biol. Eng. 2020, 40, 1–9. [Google Scholar] [CrossRef] [Green Version]
  40. McFarland, D.J.; Parvaz, M.A.; Sarnacki, W.A.; Goldstein, R.Z.; Wolpaw, J.R. Prediction of subjective ratings of emotional pictures by EEG features. J. Neural Eng. 2016, 14, 016009. [Google Scholar] [CrossRef] [PubMed]
  41. Costa, A.; Rincon, J.A.; Carracsosa, C.; Julian, V.; Novais, P. Emotions detection on an ambient intelligent system using wearable devices. Future Gener. Comput. Syst. 2019, 92, 479–489. [Google Scholar] [CrossRef] [Green Version]
  42. Shin, J.G.; Jo, I.G.; Lim, W.S.; Kim, S.H. A Few Critical Design Parameters Affecting User’s Satisfaction in Interaction with Voice User Interface of AI-Infused Systems. J. Ergon. Soc. Korea 2020, 39, 73–86. [Google Scholar] [CrossRef]
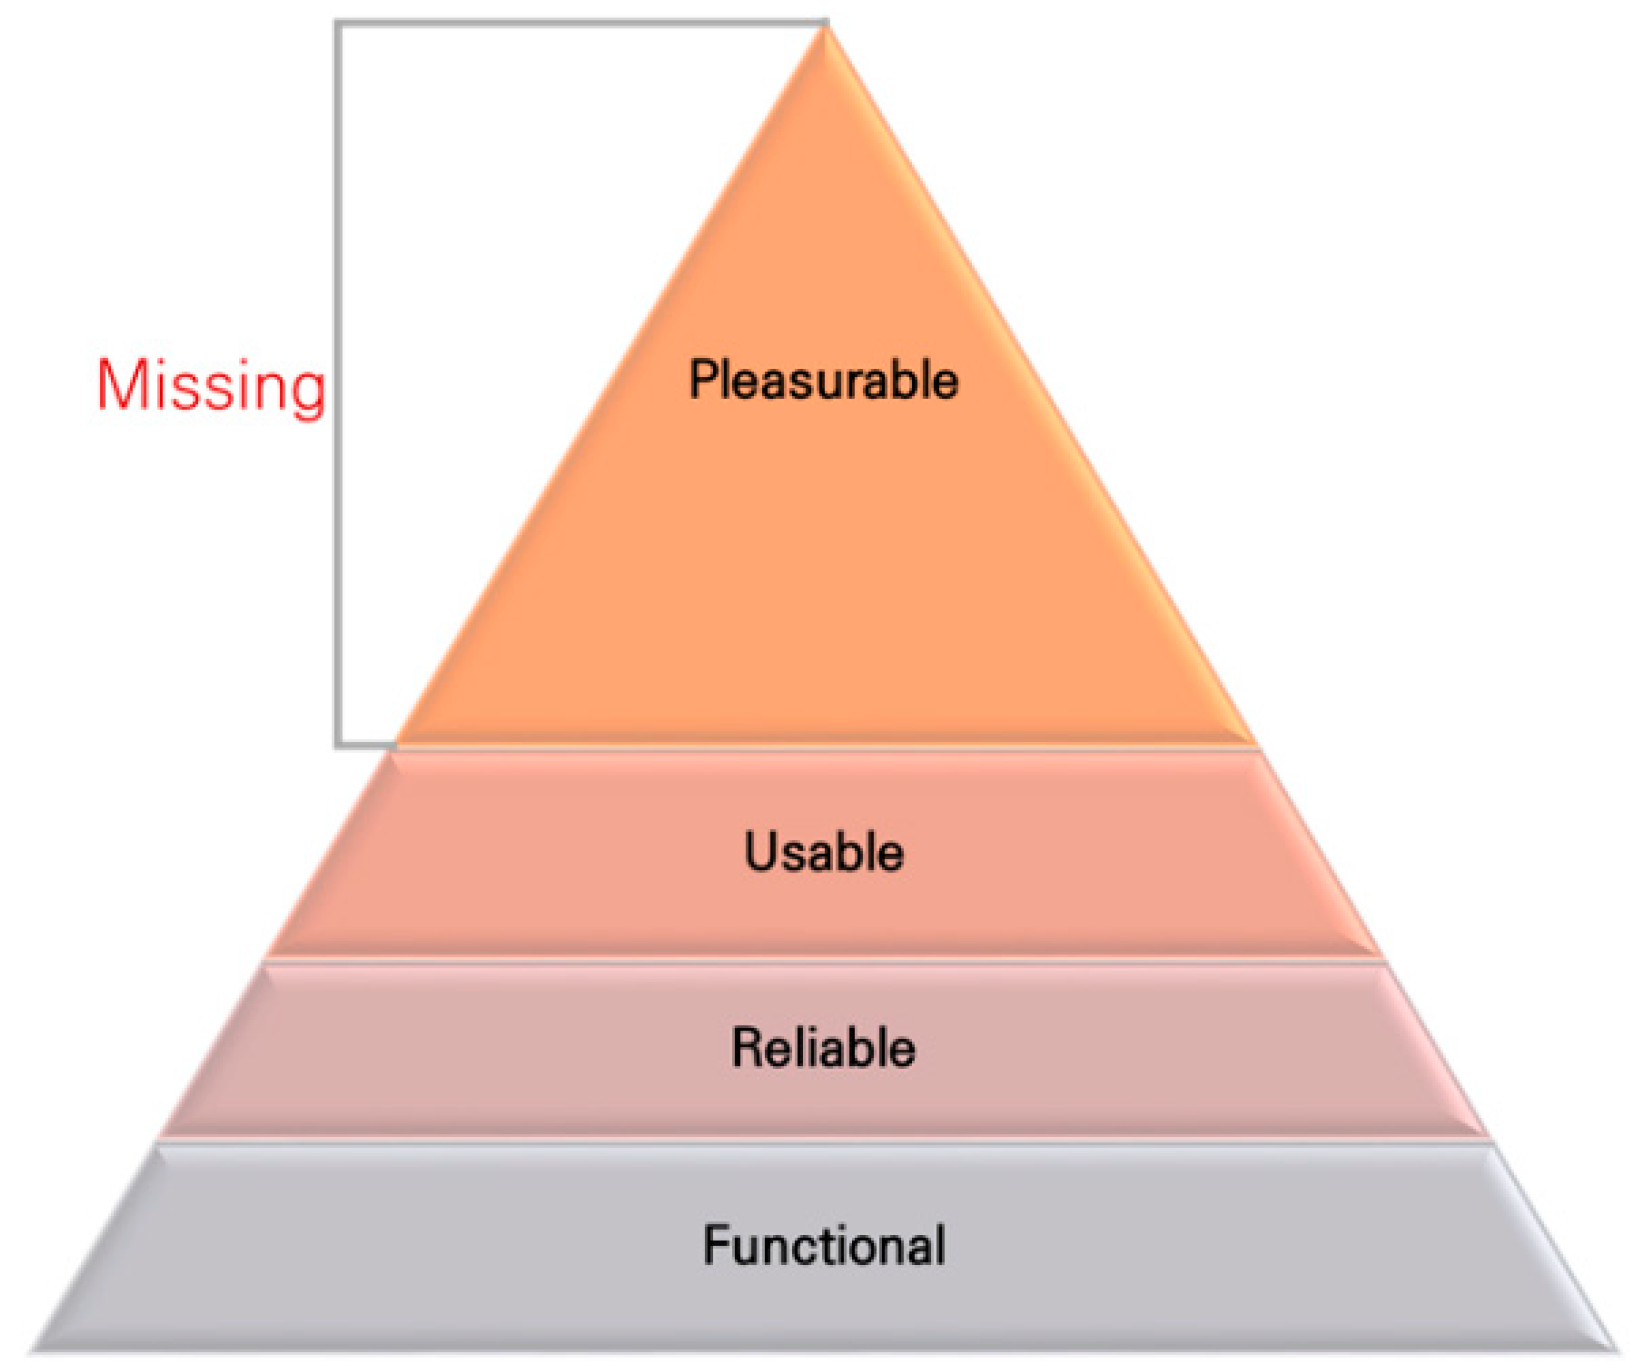
Figure 1. Hierarchy of human needs.
Applsci 11 01920 g001
Figure 2. Voice-based intelligent system satisfaction evaluation procedure.
Applsci 11 01920 g002
Figure 3. Environment of the experiment.
Applsci 11 01920 g003
Figure 4. Emotional factor scores obtained using ANOVA for different voice-based intelligent system design parameters.
Applsci 11 01920 g004
Figure 5. Classification map of emotional satisfaction.
Applsci 11 01920 g005
Table 1. Scope of voice-based intelligent system design parameters.
Design ParametersScope
Response time to get to the next interactionBetween 1 and 5 s
Number of trials to get the right answer for a question1 trial
2 trials
3 trials
Pace of the answer4 syllables/s
6 syllables/s
8 syllables/s
Sentence structure of the answerAnswer only
Repeat the question and then answer
Repeat the question and then answer with a clear reference source
Table 2. Pairs of Kansei words.
NoPositiveNegativeNoPositiveNegative
1RefreshingUncomfortable16CleverSilly
2InterestingIndifferent17ProperRidiculous
3AnticipatedBroken hearted18SpontaneousAwkward
4GladPerplexed19SuitableInappropriate
5NaturalAbrupt20GoodIrritated
6ConfidentAnxiety21PleasantBoring
7DetailedSloppy22ConcentratedDejected
8PerspicuousExtensive23OrganizedConfused
9ReliableUnreliable24FriendlyPicky
10BracingUnpleasant25LightheartedBothersome
11SimpleVague26ObviousSuspicious
12EasyDifficult27Feel UnburdenedStuffy
13FreshTrite28SatisfiedInsufficient
14ReassuredConcerned29AttractiveBanal
15StablePrecarious30HopefulHopeless
Table 3. Kansei word cluster obtained using factor analysis.
Kansei WordFactor 1Kansei WordFactor 2
Natural–Abrupt0.804Lighthearted–Bothersome0.789
Bracing–Unpleasant0.783Interesting–Indifferent0.768
Reassured–Concerned0.751Hopeful–Broken hearted0.744
Refreshing–Uncomfortable0.739Detailed–Sloppy0.744
Spontaneous–Awkward0.690Friendly–Picky0.734
Reliable–Unreliable0.679Feel Unburdened–Stuffy0.728
Good–Irritated0.677Satisfied–Insufficient0.685
Concentrated–Dejected0.674Suitable–Inappropriate0.680
Glad–Perplexed0.658Pleasant–Boring0.655
Attractive–Banal0.646
Variance10.253Variance9.233
% Variance0.342% Variance0.308
PleasurabilityReliability
Table 4. Emotional classification using Tukey analysis.
PleasurabilityReliability
Number of TrialsSentence StructureAvgClusterNumber of TrialsSentence StructureAvgCluster
1 TrialQ + A + Ref0.88A 1 TrialRepeat Q + A0.611A
1 TrialRepeat Q + A0.501AB 1 TrialQ + A + Ref0.561AB
2 TrialsQ + A + Ref0.077ABC2 TrialsQ + A + Ref0.326ABC
1 TrialAnswer only0.032ABC2 TrialsRepeat Q + A0.235ABCD
2 TrialsRepeat Q + A−0.035 BC1 TrialAnswer only−0.053ABCD
3 TrialsQ + A + Ref−0.111 BC2 TrialsAnswer only−0.325 BCD
2 TrialsAnswer only−0.219 BC3 TrialsQ + A + Ref−0.358 BCD
3 TrialsRepeat Q + A−0.349 BC3 TrialsRepeat Q + A−0.382 CD
3 TrialsAnswer only−0.776 C3 TrialsAnswer only−0.615 D
Table 5. Classification of emotional satisfaction of voice-based intelligent systems.
Level of SatisfactionDesign Parameters
High Satisfaction1 Trial, Repeat the question and then answer with a clear reference source
1 Trial, Repeat the question and then answer
Mid-High Satisfaction1 Trial, answer only
2 Trials, Repeat the question and then answer with a clear reference source
2 Trials, Repeat the question and then answer
Mid-Low Satisfaction2 Trials, answer only
3 Trials, Repeat the question and then answer with a clear reference source
3 Trials, Repeat the question and then answer
Low Satisfaction3 Trials, answer only
Publisher’s Note: MDPI stays neutral with regard to jurisdictional claims in published maps and institutional affiliations.