1. Introduction
Distribution centers (DC) perform many essential functions, such as receiving, putting away, cross-docking, order-picking, sorting and shipping hundreds of products [
1]. Notwithstanding that all DC functions are essential, order picking, particularly manual-based order picking, is the most resource-intensive and represents one of the highest DC costs [
2].
In manual order picking, order pickers receive work assignments, which specify the stock keeping units (SKUs) and other relevant attributes describing the order, such as the number of units per SKU, the physical storage address of each of the SKU (slot) and the weight of the SKUs. Order pickers travel around the DC to collect SKUs from their slots. Minimizing the order picker’s travel distance is a crucial decision problem that has received considerable attention from researchers and practitioners [
2,
3,
4], which includes optimizing picking routes, zoning, storage location assignment and order batching.
The physical location of the SKU is a factor affecting the order picking routes. The SKU assignment to picking slots—a decision problem well known as SLAP—attempts to determine the best location of the SKU to optimize the order picking travel distance. The detailed literature reviews in [
2,
3,
4] discuss several types of storage assignment policies, including random storage, closest open location storage, dedicated storage, full turnover storage, class-based storage and family grouping. From these policies, only family grouping considers the relationship between the SKUs. Family groupings are defined in [
2] as a set of items, referred to in this paper as “itemsets”, frequently found in the same order. Items belonging to the same itemset have storage locations close to each other. Itemsets are created using frequency-based methods [
5,
6], quantity-based methods [
7,
8,
9] and datamining-based methods [
10,
11,
12]. Data mining methods have shown promising results since they discover the correlations between the SKUs contained in large volumes of data, particularly because high computing power capabilities are more accessible to run the necessary data mining algorithms. Previous research has largely used data mining for computing similarities between SKUs, for batching orders and for calculating the fitness of SKUs to slots. The focus of this paper is on the sequencing of SKUs based on data mining-generated groupings.
This paper aims to develop a heuristic method to optimize the order picking travel distance based on two considerations: frequent itemset grouping and nonuniform SKU weights. The proposed heuristic uses association rule mining (ARM), a well-known data mining algorithm. The association-based postprocessing method assigns positively associated items, found by applying ARM, to slots in proximity. Furthermore, our heuristic also takes into consideration the weight distribution of the items to be picked up.
(A) Frequent itemset grouping: The literature shows heuristic methods for SLAP, which typically assign SKUs with higher turnover rates to slots near the input/output (I/O) points [
4]. Other approaches are based on family groupings. In this paper, we propose using a frequent itemset grouping. A frequent itemset is defined as a nonempty set of SKUs that meet a minimum threshold. The threshold sets a level of accepted correlation between SKUs that will belong to a family, and this is determined by how often the SKUs are ordered together. To the best our knowledge, no other papers found in the literature have taken this approach.
(B) Nonuniform SKU weights: DCs handle items with significant differences in weights, which impacts the order picking travel distance [
13]. As order pickers collect the SKUs from the prescribed slots, they build a work order forming a stack of SKUs with varying shapes and weights. The variation in SKU weights creates a particular disruption in the order picking travel sequence because there is a preference in building stacks with the heaviest SKUs at the base and mounting less heavier items on top of the base. Such a strategy increases the integrity of SKUs in the work order and influences the location of the items by inducing a preferred pick-up sequence. The proposed approach is similar to the simulation-based zoning strategy approach in [
9]. Our focus is to introduce weight classes into the ARM-based heuristic.
A case study is provided in this paper to illustrate the application of the proposed heuristic. The case is motivated by a company in the food and grocery retail industry. The experimental work uses data obtained from an actual DC and compares the ARM-based method results with a more traditional approach, such as the Class-Based Location (CBL) approach.
The remainder of this paper has the following structure.
Section 2 provides a review of the current literature.
Section 3 presents a seven-step framework by detailing the dataset definition and data collection through layout generation. The case study in
Section 4 illustrates the proposed framework.
Section 5 provides conclusions and future work opportunities to extend this research.
2. Literature Review
Table 1 shows a summary of the methods for creating family groupings that predominate in the literature of DC operation management. These methods include frequency-based methods, quantity-based methods and data mining-based methods. Frequency-based methods [
5,
6] determine groupings by the number of orders containing two items at the same time. Quantity-based methods [
7,
8,
9] determine the groupings by the quantity of items in an order. Data mining methods used algorithms, such as ARM, to estimate the correlation between items based on levels of support, lift and confidence [
10,
11,
12]. Most of the methods summarized in this table evaluate the relationship between a pair of items (itemset size = 2); thus, every possible combination of two items is evaluated.
Frazelle and Sharp [
5] propose storing together correlated SKUs consisting of the items ordered together to a distribution center. The authors show that this approach reduces the order picking time when compared to the random assignment policy. The authors note that this approach requires a large dataset of SKUs to obtain statistically significant results. Liu [
7] uses cluster analysis to create groups of correlated items based on metrics that measure the demand relationship between two items that appear on the same order together and the demand relationship between customers. The author formulates a mathematical program to create the clusters, and a primal–dual solution approach was followed to solve the clustering model. The author also uses simulations to evaluate the layout solutions.
Chuang et al. [
6] define the “between-items associations” as the probability that a pair of items are ordered together. The authors note that Liu [
7] ignores the association between the items, so they formulate a two-stage Clustering Assignment Problem Model (CAPM) to determine the optimal SKU storage locations. A mathematical model assigns products to groups based on a high association between the products in the first stage. In the second stage, a mathematical model assigns the products to storage locations based on order frequency. Their experiments show that this two-phase clustering approach reduces order picking times when compared to the random storage.
Liu [
8] proposes a Quadratic Generalized Assignment Model. This model receives as inputs the similarity between SKU, the throughput-to-storage ratios, the distance between pairs of storage slots and the distance from the input/output point to the storage slots. Since this model is NP-hard, the author proposes a novel heuristic to achieve a quick practical layout using a three-step solution approach: (1) rank items based on ordering frequency, (2) cluster items based on their similarities and (3) interchange storage locations to minimize order pick time. Diaz [
9] extends the work by Liu [
8] to account for nonuniform density SKU. The author highlights that it is frequently overlooked to analyze retail stores’ ordering practices related to how items are ordered together. Our paper is motivated by this premise, and it tries to close the gap by using a data mining approach to discover groups of items that are ordered frequently.
Chiang et al. [
10] introduce data mining for order picking and propose using a popular market basket analysis tool known as ARM algorithms to form the family of correlated products. As the author notes, most methods to determine relationships between the SKUs are frequency-based or quantity-based. Chiang et al. [
10] propose a similarity coefficient that considers the distance and the turnover rate of the SKUs, the frequency that a pair of SKUs occur together in an order and the complementary/substitutive relationship between SKUs. Chiang et al. [
11] propose two heuristics that use a weighted support count to measure the intensity and the nature of the relationship between pairs of products. The first heuristic, called the modified class-based heuristic, divides the distribution center into classes. Each class contains products with a similar turnover rate and maximizes products’ associations with storage locations by considering one class time. The second heuristic, called the Association Seed-Based Heuristic, maximizes associations of products stored in the same aisle by considering one aisle at a time. Their experiments show that these two heuristics outperform other methods based on the class-based heuristic. Kim et al. [
12] developed ARM-based sequencing-based storage location assignment heuristics for item slot selection and sequencing order picking routes. The slot selection heuristic assigns the most desirable slots (i.e., those closest to the input/output points) to items with high demand, and then locates highly correlated items closer to each other. The route sequencing policies explored by the authors are flexible. Authors show that the order picking times are reduced significantly when slot selection and order picking sequencing are considered concurrently.
Pang and Chan [
14] present a mathematical model for the storage location assignment problem for both putaway and order picking operations. They propose a datamining-based algorithm that uses association rules to minimize total traveling distances when both processes are carried out. The algorithm’s performance outperforms other policies, such as the dedicated storage policy and the closest open location policy in terms of total travel distance, order-picking time and computing time.
Other association rule implementations in distribution centers are reported in [
15,
16]. Chen et al. [
15] use ARM algorithms for batching formation. A two-phase heuristic recognizes the associations between orders and then forms the batches with highly associated orders. Chen et al. [
16] present an extension of this model. In their extension, the authors use 0–1 integer programming to represent the facility’s capacity constraints.
The analysis of the literature suggests papers on SLAP using ARM have usually calculated support metrics for two-level itemsets; thus, they measure the similarity between only two SKUs at a time. In contrast, our paper forms itemsets consisting of two or more associations SKUs, which has not been previously considered. Another gap in the ARM-based SLAP papers is the lack of integration of the SKU’s weights in the determination of itemsets. As explained before, this attribute increases the integrity of orders and affects the sequence of the order picking route, and it is, therefore, among the considerations of this paper.
3. Methodology
3.1. Formulating and Solving the Storage Location Assignment Problem
Let us consider the Storage Location Assignment Problem in Liu [
7]. This problem is represented by a Quadratic Generalized Assignment Model. This model seeks to determine the optimal storage location of SKUs, herein referred to as “items”, for inputs, such as the similarity coefficients between items, the throughput-to-storage ratios, the distance between pairs of storage slots and the distance from the input/output point to the storage slots. Unlike Liu [
8], this paper computes the similarity coefficients by using ARM, and thereby the resulting mathematical programming model is as follows:
subject to:
where:
K = the total number of items to be allocated.
P = the total number of existing available slots.
xij = a binary decision variable, with xij = 1 if item i is assigned to slot j, and xij = 0 otherwise.
ti = throughput-to-storage ratio for item i.
djl = the picker’s travel distance between slots j and l.
rj = the relative distance of slot j to the input/output point.
ςi = the support of item i (obtained from association rule mining).
ςik = the support of itemset { i, k } (obtained from association rule mining).
The objective function in Equation (1) minimizes the total expected travel distance to complete all order picking operations in a given amount of time. The first term in Equation (1) represents the expected distance to travel from slot
j to slot
l provided that item
i is assigned to slot
j and item
k is assigned to slot
l. The parameter
ti represents the rate at which an item is ordered. The parameter
ςik is the probability, or support, of having items
i and
k together in an order as measured by ARM. A high value of the parameter
ςik indicates that the item
i is ordered together with item
k with higher frequency. In contrast, a low value indicates that item
i is ordered together with item
k with lower frequency. The parameter
djl is the distance traveled from slot
j to pick up item
i to slot
l to pick up item
k. Therefore,
tiςikdjl estimates the expected distance traveled from slot
j to slot
l. The second term in Equation (1) represents the expected distance to travel from the input/output point to slot
j provided that item
i is assigned to slot
j. The parameter
ςi represents the support value of each item
i as determined by the ARM algorithm. A high value of the parameter
ςi indicates that item
i is ordered with a higher frequency. In contrast, a low value of the parameter
ςi suggests that item
i is ordered with a lower frequency. We refer the reader to
Section 3.2. for more details on how the parameters
ςi and
ςik are obtained from ARM.
Equations (2)–(4) are the constraints for this mathematical model. The constraint in (2) ensures that one item is assigned to precisely one slot. The constraint in (3) ensures that one slot contains exactly one item. The constraint in (4) restricts the decision variable to assume zero or one values.
The SLAP model formulated in (1)–(4) is NP-hard; thus, finding the optimal solution for the most common applications is exceptionally challenging. Liu [
8] proposed a novel heuristic to achieve a quick practical layout. Liu’s heuristic uses three phases: ranking, clustering and interchanging. A modified version of the heuristic is presented below, which incorporates parameters obtained with ARM.
Diaz [
9] explains that weight is a critical item attribute that must be considered to maintain the integrity of products while building an order. Order pickers built their pallets by placing the heaviest items at the bottom of the pallet to give a solid foundation to the pallet; lighter items are placed on heavier items, with the lightest items placed at the top of the pallet. Order pickers try to follow this sequence to reduce the number of damaged products. Thus, our heuristic also divides unique SKUs by their weight distribution (in pounds).
Heuristic 1 (H1):
Step 1—Allocate SKUs into
w weight classes (in pounds). Peterson et al. [
17] suggest practical implementations of two to four classes. The weight classes in this study are “heavy”, “medium” and “light.” The weight distributions for each class are case driven.
Step 2—Starting with the heavy weight class, sort individual support coefficients ςi from the highest to the lowest value.
Step 3—Assign the first slot to the item with the highest individual support ςi, the second slot to the item with the second-highest individual support ςi, and so on, until all the items have an assigned slot. This step generates a layout that places an item with a higher frequency in an order closer to the input/output point.
Step 4
Step 4-1—Set u = 1 and i(u) = an item assigned to slot u, a slot the uth closest to the input/output point.
Step 4-2—Create a set of frequent itemsets, F = {{i(u),i(v)} | v > u, ςi(u)i(v)3ε}, where ε = the minimum support threshold and {i(u), i(v)} is chosen from a set of all frequent itemsets extracted by ARM analysis, to be explained in the next section. Note that i(v) is less frequent than i(u).
Step 4-3—Let f(o) be a frequent itemset with oth highest support in F and v(o) the slot dedicated to the less frequent item of f(o) (o = 1, 2, …, n(F)). Note that v(0) > u for “o”.
Step 4-4—For each o= 1, 2, …, n(F), move i(v(o)) to slot u + o and move the items at i(u + o), i(u + o + 1),…, i(v(o) − 1) to the next slots. This step generates a layout that forms itemsets with SKUs with high support coefficients placed in adjacent slots.
Step 4-5—Set u = u + n(F) + 1. If u is larger than the number of items within the current weight class, terminate the class. Otherwise, go to Step 4-2.
Step 5—Evaluate the total order picking time of the layout generated in Step 4-1~Step 4-5.
Repeat Steps 2–5 for the next weight classes.
3.2. Using Association Rule Mining to Create Itemsets
ARM is a datamining approach used in this paper to examine the large transactional databases available at the distribution centers to create itemsets with items frequently found together in the order picking transactions.
Let
I =
{i1,
i2,
...,
iK} be a set of 0-1 binary variables referred to items; also let
X,
Y ∈
I and
X ∩ Y = ∅. An association rule is expressed as an implication, which is expressed as follows:
The set X is called the antecedent and Y is called the consequent. Within the context of our application, if X = {SKU1, SKU2} and Y = {SKU3}, the association rule states that a transaction with items {SKU1, SKU2} implies that {SKU3} is also present in the transaction.
The Apriori algorithm, introduced in [
18], is a datamining technique designed to extract, in an efficient manner, frequent itemsets and useful association rules from large transactional datasets, such as those available in distribution center applications. The extraction of itemsets and association rules must satisfy minimum thresholds for support and confidence, two of the item relationship measurements of association rules obtained with the Apriori algorithm:
Support, ςθ: A number between 0 and 1. Support is the probability of measures the importance of a rule. For |θ| = 1, ςi is the proportion of order picking transactions that contain item i. For |θ| = 2, ςik is the proportion of order picking transactions that contain items i and k, concurrently. For |θ| = 3, ςikm is the proportion of order picking transactions that contain items i,k and m, concurrently, and so forth. The minimum support threshold is expressed as ε.
Confidence, conf(X⇒Y): A number between 0 and 1. Confidence of a rule X⇒Y is calculated as support(X∩Y)/support(X). Confidence is the likelihood that the order contains itemset (i.e., Y), given itemset (i.e., X) is already picked up in the same order.
Lift: the strength of the rules. It is calculated as P(X∪Y)/[P(X)P(Y)] for an association rule X⇒Y. If lift > 1, X and Y are positively correlated with each other, and vice versa.
Apriori discards sets that do not meet minimum support or minimum confidence conditions at the same time. It is essential to specify a threshold value to determine at which level an itemset is deemed to be nonfrequent. R statistical software is used for the implementation of the Apriori algorithm. The pseudo-code for Apriori is presented in Algorithm 1. The Apriori algorithm result is an itemset
Ls, which consists of those itemsets of size less than or equal to
s that meet the minimum support threshold,
ε.
| Algorithm 1 Apriori algorithm |
Cs: a candidate itemset of size S
Ls: frequent itemset of size S
T: database of transactions/trips
Apriori(T, ε)
L1 ← {large 1-itemsets appear in more than ε transactions}
s ← 2
while (Ls − 1 ≄ ∅)
Cs ← generate itemsets from Ls − 1
for (transactions t ∈ T)
Ct ← subset(Cs,t) generate candidate transactions size s
for (candidates c ∈ Ct) determines
frequency of c-candidates
count[c] ← count[c] + 1
Lk ← {c: c ∈ Cs ⋀ count[c] ≥ ε} Pruning
s ← s + 1
return ∪s Ls union of sets of frequent items
s = 1,2,... S |
When relatively small values of support (i.e., the sample space includes itemsets that are not frequent) are involved, the computational expense can become extreme due to the plethora of frequent itemsets. In contrast, we have only few frequent itemsets if the minimum support threshold is too high. This paper used a calibration experiment to find support values that are small enough to detect enough rules to make a difference in the total performance of the order-picking tasks. Nonetheless, the support values should not be too small. Otherwise, the computational algorithm time may increase significantly.
4. Numerical Study
4.1. System Description
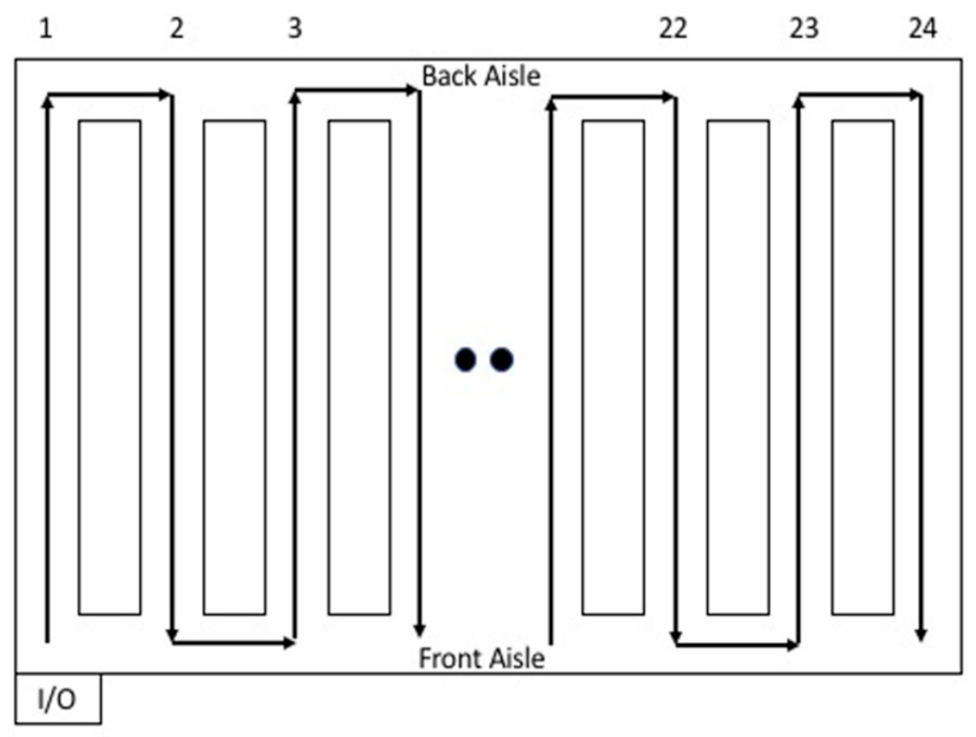
The ARM-based SLAP methodology was applied to a distribution center in the United States’ food retail industry. This distribution center services more than 500 unique stores. The distribution center has a configuration of 24 aisles. There are storage racks in with 135 slots in each side of the aisle. The distance between positions is 40 inches. The distribution center’s order-picking process is as follows. Order picking is performed by human operators (i.e., order pickers). The workforce comprises 113 order pickers. The order pickers drive powered vehicles to move around the distribution center. Each order picker processes one order at a time. The traveling routes follow the sequence shown in
Figure 1. The operator arrives at the first SKU location to retrieve the required cases from the shelves and then loads the items into the vehicle. The operator then follows the rest of the route and repeats the picking process until all the SKUs contained in the order are retrieved. The order picking time is correlated to the number of items. A completed order is palletized and sent to the docks, loaded into a truck and transported to the retail store.
The DC receives approximately 200 orders per day, and it performs between 50 and 100 shipments per day. The DC fills up these orders in the morning and replenishes the items at night. The data were cleaned up and transformed. The resulting dataset contains 7881 unique SKUs. The dataset also contains 388 unique orders. Each order contains between 4 and 350 different SKUs. There is a total of 63,000 records, resulting in a 624 × 7881 transaction-to-item matrix.
We set up an experiment to calibrate the association rule mining algorithm. This experiment runs 16 unique combinations of support and confidence, with support changing from 0.10 to 0.25, in increments of 0.05, and confidence changing from 0.5 to 0.8, in increments of 0.10. These combinations generate association rules ranging between 64 and 11,965. The trend indicates that as support and confidence increase, the number of association rules increases; computational time shows a similar increasing trend. The combination that shows the best performance for the dataset considered in this paper is for support = 0.2 and confidence = 0.8. Setting the algorithm parameters of support and confidence at these values results in fewer itemsets with highly correlated items within each itemset.
Our numerical analysis is based on experimental results obtained with the R package named “arules” [
19] to extract the association rules. It was run in a MacBook Pro microcomputer with an Intel 43 2.5 GHz Core i7 processor and 16 GB 1600 MHz DDR3 memory. The procedure to generate the layouts was also coded in R.
4.2. Comparison between the Association Rule Mining-Based and the Class-Based Methods
We further designed and analyzed a statistical experiment to compare the ARM algorithm to the traditional class-based layout (CBL) method. In these experiments, the class-based method was applied separately to each of the weight categories (heavy, medium, light) to make a direct comparison to the ARM-based method.
Two partitions were obtained from the dataset to test for repeatability of the proposed algorithms. SKUs were selected at random to form the partitions. The first partition (referred to as Scenario 1) included 39 orders with a total number of 8141 SKUs. The number of unique SKUs in this test scenario was 2638. The second partition (referred to as Scenario 2) included 39 orders with 8122 SKUs with 2721 unique SKUs.
For the implementation of the ARM-based heuristic’s step 1, Scenarios 1 and 2 were divided into three weight classes: heavy, medium and light.
Table 2 and
Table 3 show the weight distributions per class. For Scenario 1, Class 1-1 accounts for 30.40% of all the SKUs in the sample dataset containing 802 SKUs with weight greater than 9 pounds; Class 1-2 includes 756 SKUs with weight between 5.28 and 9 pounds, which is 28.66% of all the sample SKUs; Class 1-3 has 1080 SKUs with weight less than 5.28 pounds, which is 40.94% of all the SKUs in the selected sample. For Scenario 2, Class 2-1 accounts for 29.58% of all the SKUs in the sample dataset containing 805 SKUs with weight greater than 8.85 pounds; Class 2-2 includes 902 SKUs with weight between 5 and 8.85 pounds, which is 33.15% of all the sample SKUs; Class 2-3 has 1014 SKUs with weight less than 5 pounds, which is 37.27% of all the SKUs in selected sample.
The application of the ARM-based heuristic found a total of 74 association rules in Scenario 1 (i.e., 10 rules in Class 1-1, 48 rules in Class 1-2 and 18 rules in Class 1-3), and a total of 59 association rules in Scenario 2 (i.e., 14 rules in Class 2-1, 32 rules in Class 2-2, and 13 rules in Class 2-3).
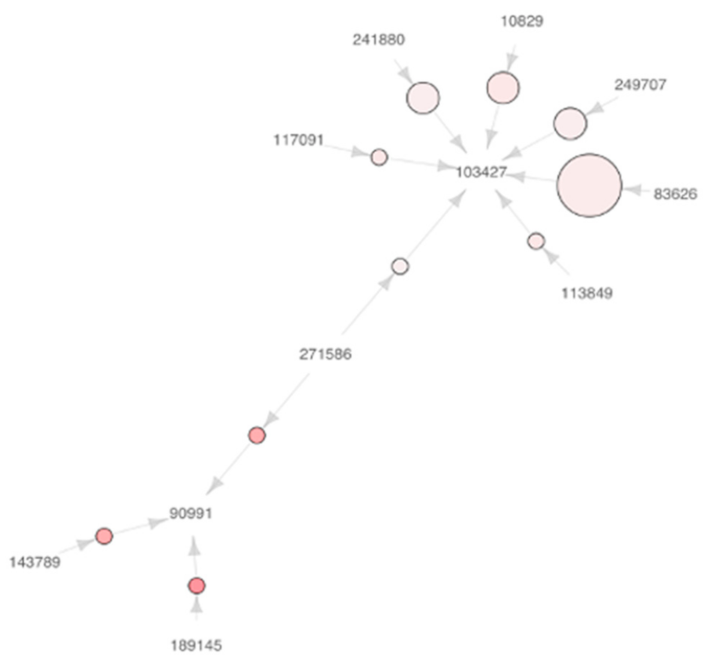
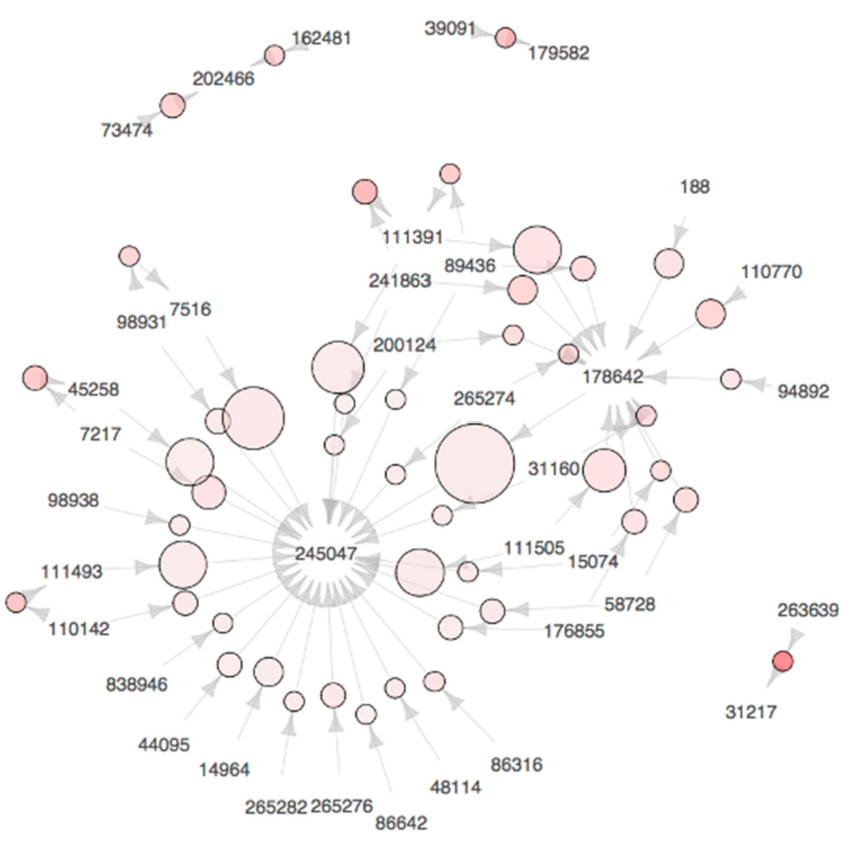
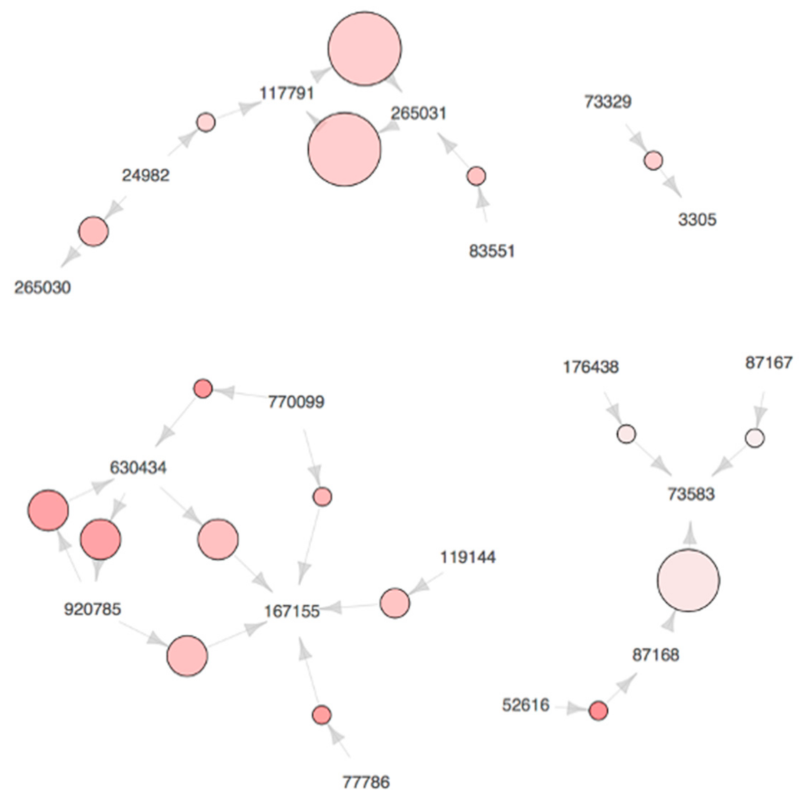
Figure 2,
Figure 3 and
Figure 4 show the plots of association rules in each weight class for Scenario 1. The numbers in these plots are the SKUs, while the circles represent the associations between SKUs. The size of circles is proportional to the level of support of the rules (i.e., a larger circle size represents a higher level of support). Thus, we can see that SKU 83,626 is frequently ordered together with SKU 103,427 in
Figure 2. Additionally, the color of the circles is indicative of the lift of the rule (i.e., a darker circle color represents a higher lift). The arrow starts from the antecedent of the rule and ends at the consequent of the rule. It is important that the family of SKUs can be discovered from the results of ARM analysis. For instance, SKUs 10,829, 83,626, 103,427, 241,880 and 249,707 in the upper right corner of
Figure 2 can be regarded as the members of a family, since SKU 103,427 is frequently ordered together with the others. Moreover, such SKUs are assigned to the slots in proximity by the heuristic method proposed in this paper. Similar trends are observed in the plots we obtained for Scenario 2, but we omitted these figures from this paper due to space limitations.
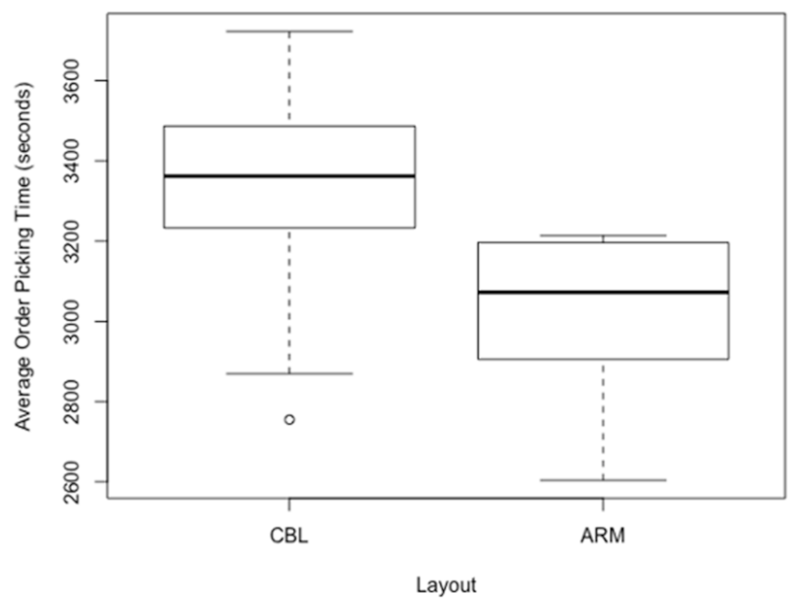
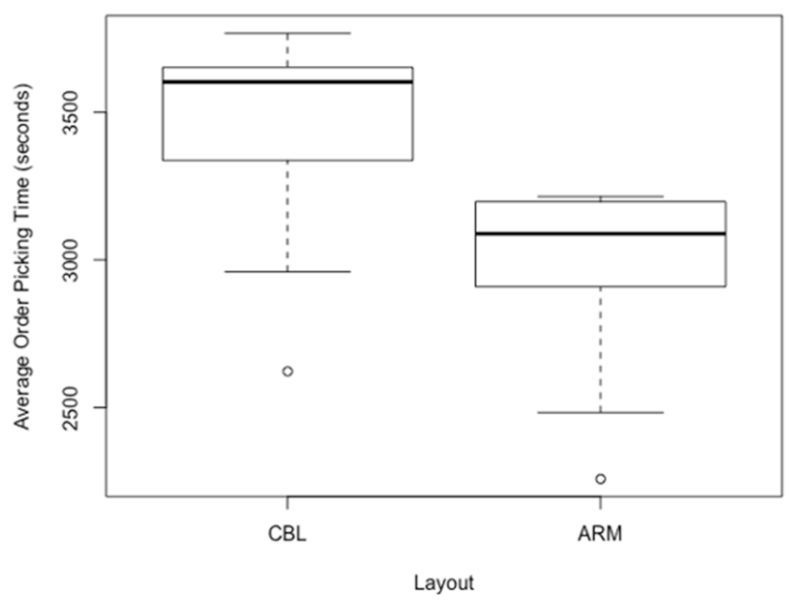
Figure 5 and
Figure 6 show the average order picking times for Scenarios 1 and 2, as generated by CBL and ARM.
Table 4 shows the mean order picking completion times and standard deviation for Scenarios 1 and 2. As the results show, the mean order picking time decreased from 3345.4 to 3006.9 s in Scenario 1, which represents a 10.1% improvement by applying the ARM-based method over the class-based layout method. Similar trends were observed in the second scenario. The mean order picking time decreased from 3489.0 to 3010.8 s in Scenario 2, which represents a 13.7% improvement by applying the ARM-based method over the class-based layout method.
4.3. Managerial Implications to Industry
The total sales generated by supermarkets and grocery stores in the United States in 2019 amounted to USD 682.86 billion [
20]. The industry works on a very tight margin, with approximately 1.7 percent of net profit margins [
21]. Efficient and coordinated supply chains of high volume goods are critical for these companies to generate profit [
22]. Such supply chains generally involve sensitive logistics, suppliers, DCs, retail stores and the end customers. Moving high volumes of goods, particularly between the DC and the retail stores, is resource-intensive and complex.
Distribution centers become critical components of the supply chains to yield satisfactory results in such a tight industry—supermarkets and grocery stores. Supermarket and grocery store practitioners at the distribution centers have at their disposition detailed transaction data. These data are vast and available from a database across the entire enterprise. The body of data is constantly increasing in number of transactions, number of items and in the diversity of types and sources. The use of the proposed framework in a real setting showed that datamining techniques might efficiently and effectively be used to discover useful trends in the data to increase delivery speeds, and ultimately cut logistical costs. Our research provides a managerial tool to DC managers that might facilitate strategic initiatives to increase net profit margins.
5. Conclusions
This paper proposes the use of an ARM-based heuristic for solving SLAP. The proposed heuristic consists of the following main steps: (1) dividing the SKUs into weight classes, i.e., heavy, medium and light; (2) choosing levels of support and confidence to generate rules with the Apriori algorithm; (3) extracting frequent itemsets; and (4) generating a layout with SKU locations placing frequently ordered itemsets near to each other. The higher the frequency with which items are ordered, the closer they are located to the input/output point. The resulting layouts were tested to estimate the total order picking times. The datamining approach was applied to a real case. The layouts generated by ARM resulted in lower average order picking times than those layouts generated using class-based layout. The ARM layout seeks faster order picking times by considering itemsets that are ordered frequently, not just individual items.
For the operation in this study, the amounts of data are vast and are available from a database across the entire enterprise. The body of orders data is constantly increasing in number of transactions, number of items and in the diversity of types and sources. Therefore, the method proposed in this study requires hardware and software capable of storing and processing large sparse matrices of data. The authors recommend an implementation using a software environment such as R [
18], Python [
22] or Julia [
23]. All three environments offer at least one implementation of the Apriori algorithm. This study has shown how this data mining algorithm can be applied efficiently and effectively in a real setting to discover trends in data useful to increase delivery speeds, and ultimately cut logistical costs. For instance, this paper applied the ARM technique to discover the family of correlated SKUs that should be assigned to slots in proximity.
During the conduct of this study, the authors devised three paths for further research. First, instances that the authors have designated as singletons. Singletons are items that are not grouped with any others as a result of the mining processes. These instances represent an inefficiency in the implementation of ARM, which has not been mentioned in the prior literature. During the experimentation, it was observed that the appearance of a singleton could force the picker to deviate far from the I/O point, thus markedly increasing the order picking completion time. These particular items can cause disruptions in the design of the order picking routes. The opportunity is in the development of algorithms that minimize the effects of the singletons, seeking to improve the efficiency of the order picking process and possibly improving the performance of ARM. A second extension of this study concerns the implementation of ARM to cases in which the demand pattern of high-selling items is not stable. In this method, high-selling items that sell together greatly influence the resulting items’ locations in the warehouse. An unstable demand of such itemsets would imply a periodically changing layout. Lastly, in designating the item locations, this study only considers the loading process. The authors conjecture that considering the unloading process as well as the unloading process will result in a product location that could achieve a lower overall warehouse operating cost.


 ,
, 
