Article

Measurement of the Degree of Coordination in Regard to Carbon Emissions, Economic Development, and Environmental Protection in China

1
College of Geography and Environmental Science, Northwest Normal University, Lanzhou 730070, China
2
School of Architecture & Urban Planning, Lanzhou Jiaotong University, Lanzhou 730070, China
3
Information Center for Global Change Studies, Lanzhou Information Center of Chinese Academy of Sciences, Lanzhou 730000, China
*
Author to whom correspondence should be addressed.
Appl. Sci. 2021, 11(4), 1750; https://doi.org/10.3390/app11041750
Submission received: 25 January 2021 / Revised: 12 February 2021 / Accepted: 13 February 2021 / Published: 16 February 2021
(This article belongs to the Section Environmental Sciences)

Abstract

:
Driven by economic development, the dramatic increase in carbon emissions has led to global warming and a series of environmental problems. The question of how to ensure harmonized coordination between economic development, carbon emissions and environmental protection has become increasingly important. The conflicts between the use of energy and emission reductions in China have become more intense. It is an inevitable requirement for China’s sustainable development to promote a low-carbon circular economy and the simultaneous and coordinated development of carbon emissions, the economy and the environment. The present study took 30 provinces (municipalities and autonomous regions directly under the Central Government) as the research objects (Tibet, Hong Kong, Macau, and Taiwan are not included in the study due to the lack of relevant data), and applied quantitative analysis methods, such as three-stage data envelopment analysis (DEA) models, coupling coordination degree models and spatial analysis models, to construct a measurement index system. On the basis of the measurement of its carbon emission efficiency, the level of China’s coordination degree in regard to carbon emissions, economic development, and environmental protection at both spatial and temporal dimensions was analyzed comprehensively in order to reveal its temporal and spatial characteristics. The conclusions are as follows: (1) China’s overall carbon emission efficiency displayed a gradual upward trend, although the overall level was not that high. Therefore, there is still much scope for further improvement. (2) The level of China’s coordination degree in regard to carbon emissions, economic development, and environmental protection showed a steady yet rising trend. All provinces reached different levels of coordination development, and there was no province that displayed a disorderly declining trend. However, the number of provinces that reached or went beyond the intermediate level of coordination development was quite limited. (3) The level of China’s coordination degree in regard to carbon emissions, economic development, and environmental protection displayed obvious spatial aggregation patterns at the provincial level, showing an apparent spatial dependence and heterogeneity. Over time, the level of spatial aggregation patterns in regard to coordination degree tended to weaken. Overall, the values were high in the eastern region and low in the western region, decreasing from the eastern coastal zone towards the western inland zone, thus demonstrating a contrasting east-west spatial distribution pattern.

1. Introduction

The dramatic increase in carbon emissions, driven by economic development, has led to global warming and a series of environmental problems. Global sea levels have risen unprecedently, the diversity of species is declining sharply, and extreme weather events that have become more frequent pose a serious threat to human beings and the environment. The conflicts between the use of energy and the reduction in emissions, or between economic development and environmental protection, have become increasingly intense [1]. Therefore, the question of how to coordinate harmonious development between economic development, carbon emissions and environmental protection has become increasingly important, as well as a research topic of great interest. Historical evidence has proved that carbon emissions, the economy and the environment represent interconnected parts of a complex system, and the implementation of a coordinated development of carbon emissions, economic development, and environmental protection is essential for the achievement of sustainable development goals [2]. Therefore, the effective coordination of the relationships between these three factors and how to efficiently explore the underlying principles for change have become important issues that need to be addressed urgently by governments and academia.
As the world’s largest developing country and second largest economy, China has made some spectacular achievements in economic development. However, with the rapid development of its economy, a large number of carbon emissions have inevitably been produced, and such development comes with a high cost with regard to China’s ecological environment. Moreover, the increase in carbon emissions intensifies the greenhouse effect, and the conflicts between the use of energy and emission reductions in China have become more intense [3]. President Xi Jinping has pointed out that “Clear waters and green mountains are as valuable as mountains of gold and silver”. Economic development is no longer just about the growth of gross domestic product (GDP). Rather, the protection of the ecological environment has become an important indicator by which to measure the comprehensive development level of a nation. Therefore, the promotion of a low-carbon circular economy and the simultaneous and coordinated development of carbon emissions, the economy and the environment are inevitable requirements for China’s sustainable development. Circular economy is an optimal mode to realize sustainable development. One of the main requirements of circular economy is to realize the coordinated development of carbon emissions, the economy and the environment. The idea of circular economy sprouted from “spaceship economy” [4,5], and the concept was first put forward by Pearce [6]. At the end of the 20th century, the concept of circular economy was systematically introduced into China. Circular economy is a systematic thinking to solve the increasingly serious conflict between economic growth and ecological environment. The idea pursues the sustainable development of “optimal production, moderate consumption and minimum waste”. The core goal is to make better use of resources and materials through reuse and recycling, so as to minimize the impact on the environment [7,8,9,10]. Under the guidance of circular economy, it is necessary to realize the coordinated development of carbon emissions, the economy and the environment. Therefore, the coordination of the relationships between carbon emissions, economic development, and environmental protection in China represents an important issue that needs to be addressed urgently.
The present study took 30 provinces (municipalities and autonomous regions directly under the Central Government) as the research objects (Tibet, Hong Kong, Macau, and Taiwan are not included in the study due to the lack of relevant data), and applied quantitative analysis methods, such as three-stage data envelopment analysis (DEA) models, coupling coordination degree models and spatial analysis models, to construct a measurement index system. On the basis of the measurement of its carbon emission efficiency, the level of China’s coordination degree in regard to carbon emissions, economic development, and environmental protection at both spatial and temporal dimensions was analyzed comprehensively in order to reveal its temporal and spatial characteristics. On the one hand, the present study serves as a vital complement to current research on the topic of a low-carbon economy, both theoretically and empirically, and enriches the theoretical content of human geography and sustainable development with theoretical significance. On the other hand, the present study can help promote the coordinated development of China’s carbon emissions, economic development, and environmental protection simultaneously, and thus provide theoretical support and a decision-making basis for China to further improve its low-carbon economy and promote the smooth implementation of the construction of an ecological civilization and sustainable development strategies.

2. Literature Review

2.1. Research on Carbon Emission Efficiency

Currently, research on carbon emission efficiency abroad mainly focuses on the selection of appropriate indexes that reflect carbon emission efficiency and the methods for quantifying it. The selection of appropriate indexes mainly focuses on either a single element or full elements. A single element is the ratio of carbon emissions to a certain element. For example, Alcantara et al. [11] and Sun [12] defined carbon emission efficiency as the amount of carbon emissions per unit of GDP. Mielnik et al. believed that it is more realistic to measure the carbon emission efficiency of developing countries in regard to the amount of carbon emissions per unit of energy consumption [13]. Ang also thought that energy consumption intensity is the best indicator to measure a country’s carbon emission efficiency [14]. However, the single-element method applied to measure carbon emission efficiency is prone to certain errors and uncertainties, and thus cannot objectively and comprehensively reflect the results of carbon emission efficiency. Consequently, researchers have proposed all-element indexes to quantify carbon emission efficiency. For example, Ramanathan proposed an assessment framework of energy consumption, economic development, and carbon emissions [15]. Zaim et al. developed the concept of a comprehensive index system for measuring carbon emission efficiency, and provided environmental efficiency assessment indices for the Organization for Economic Co-operation and Development (OECD) countries [16]. Zofio et al. evaluated the carbon emission efficiency of manufacturing industries in OECD countries on the basis of DEA models (with undesired output included) [17]. Zhou et al. considered slack variables in their assessment framework to measure the efficiency of all-element carbon emissions, and measured the overall carbon emission efficiency of OECD countries [18]. Currently, the main methods used to measure carbon emission efficiency abroad include DEA and stochastic frontier analysis (SFA). DEA has been widely used; for example, Bekun et al. applied DEA to analyze the carbon emission efficiency in South Africa [19]. Moreover, Liimatainen et al. used DEA to assess the carbon emission efficiency of some industries and regions [20]. Iftikhar et al. successfully applied DEA to measure the carbon emission efficiency of various countries [21]. However, traditional DEA has certain limitations, and thus is unable to eliminate some uncertain elements. SFA, by contrast, can make up for the shortcomings of the traditional DEA method, and represents another important method for measuring carbon emission efficiency. For example, Herrala et al. measured the carbon emission efficiency of 170 countries based on the SFA method [22] and Mohiuddin et al. applied SFA to measure the carbon emission efficiency in Pakistan [23].
Research on carbon emission efficiency in China is consistent with the international trend, with specific focuses on the selection of measurement indices that reflect carbon emission efficiency and the measurement methods that can help quantify it. The selection of appropriate indices is mainly concentrated on the question of whether to choose single-element or all-element methods. The single-element method used to measure carbon emission efficiency is mainly based on carbon productivity and carbon emission intensity. For example, Wang Kang measured the carbon productivity in China at the provincial level [24]. Zhou Sijun et al. [25], Qiaojian et al. [26], and Yin Weihua et al. [27] considered carbon emission intensity as an important indicator reflecting the carbon emission efficiency of the manufacturing industry or in a region. In regard to the all-element method used to measure carbon emission efficiency, Xie Zhixiang et al. evaluated the low-carbon economic development performance of 31 provinces in China on the basis of the all-element Malmquist productivity index [28]. Guo Bingnan et al. applied the all-element method to reflect the carbon emission efficiency around the region of the Yangtze River Delta [29]. Measurement methods commonly applied to quantify carbon emission efficiency include DEA and SFA. The former has been widely applied; for example, Li Jian et al. used DEA to measure the carbon emission efficiency in the region of the Yangtze River Delta, Pearl River Delta, and Beijing-Tianjin-Hebei region [30]. Dong Feng et al. and Chen Xiaohong et al. applied DEA to quantify the efficiency of China’s regional carbon emissions [31,32]. In regard to the application of SFA, Yu Dunyong et al. used this method to analyze the carbon emission efficiency in Tianjin [33], Wang Tianfei et al. applied SFA to quantify the carbon emission efficiency in Shandong Province [34], and Zhou Rui et al. used SFA to calculate and analyze the carbon emission efficiency in Xinjiang [35].

2.2. Research on the Relationship between Carbon Emissions, Economic Development, and Environmental Protection
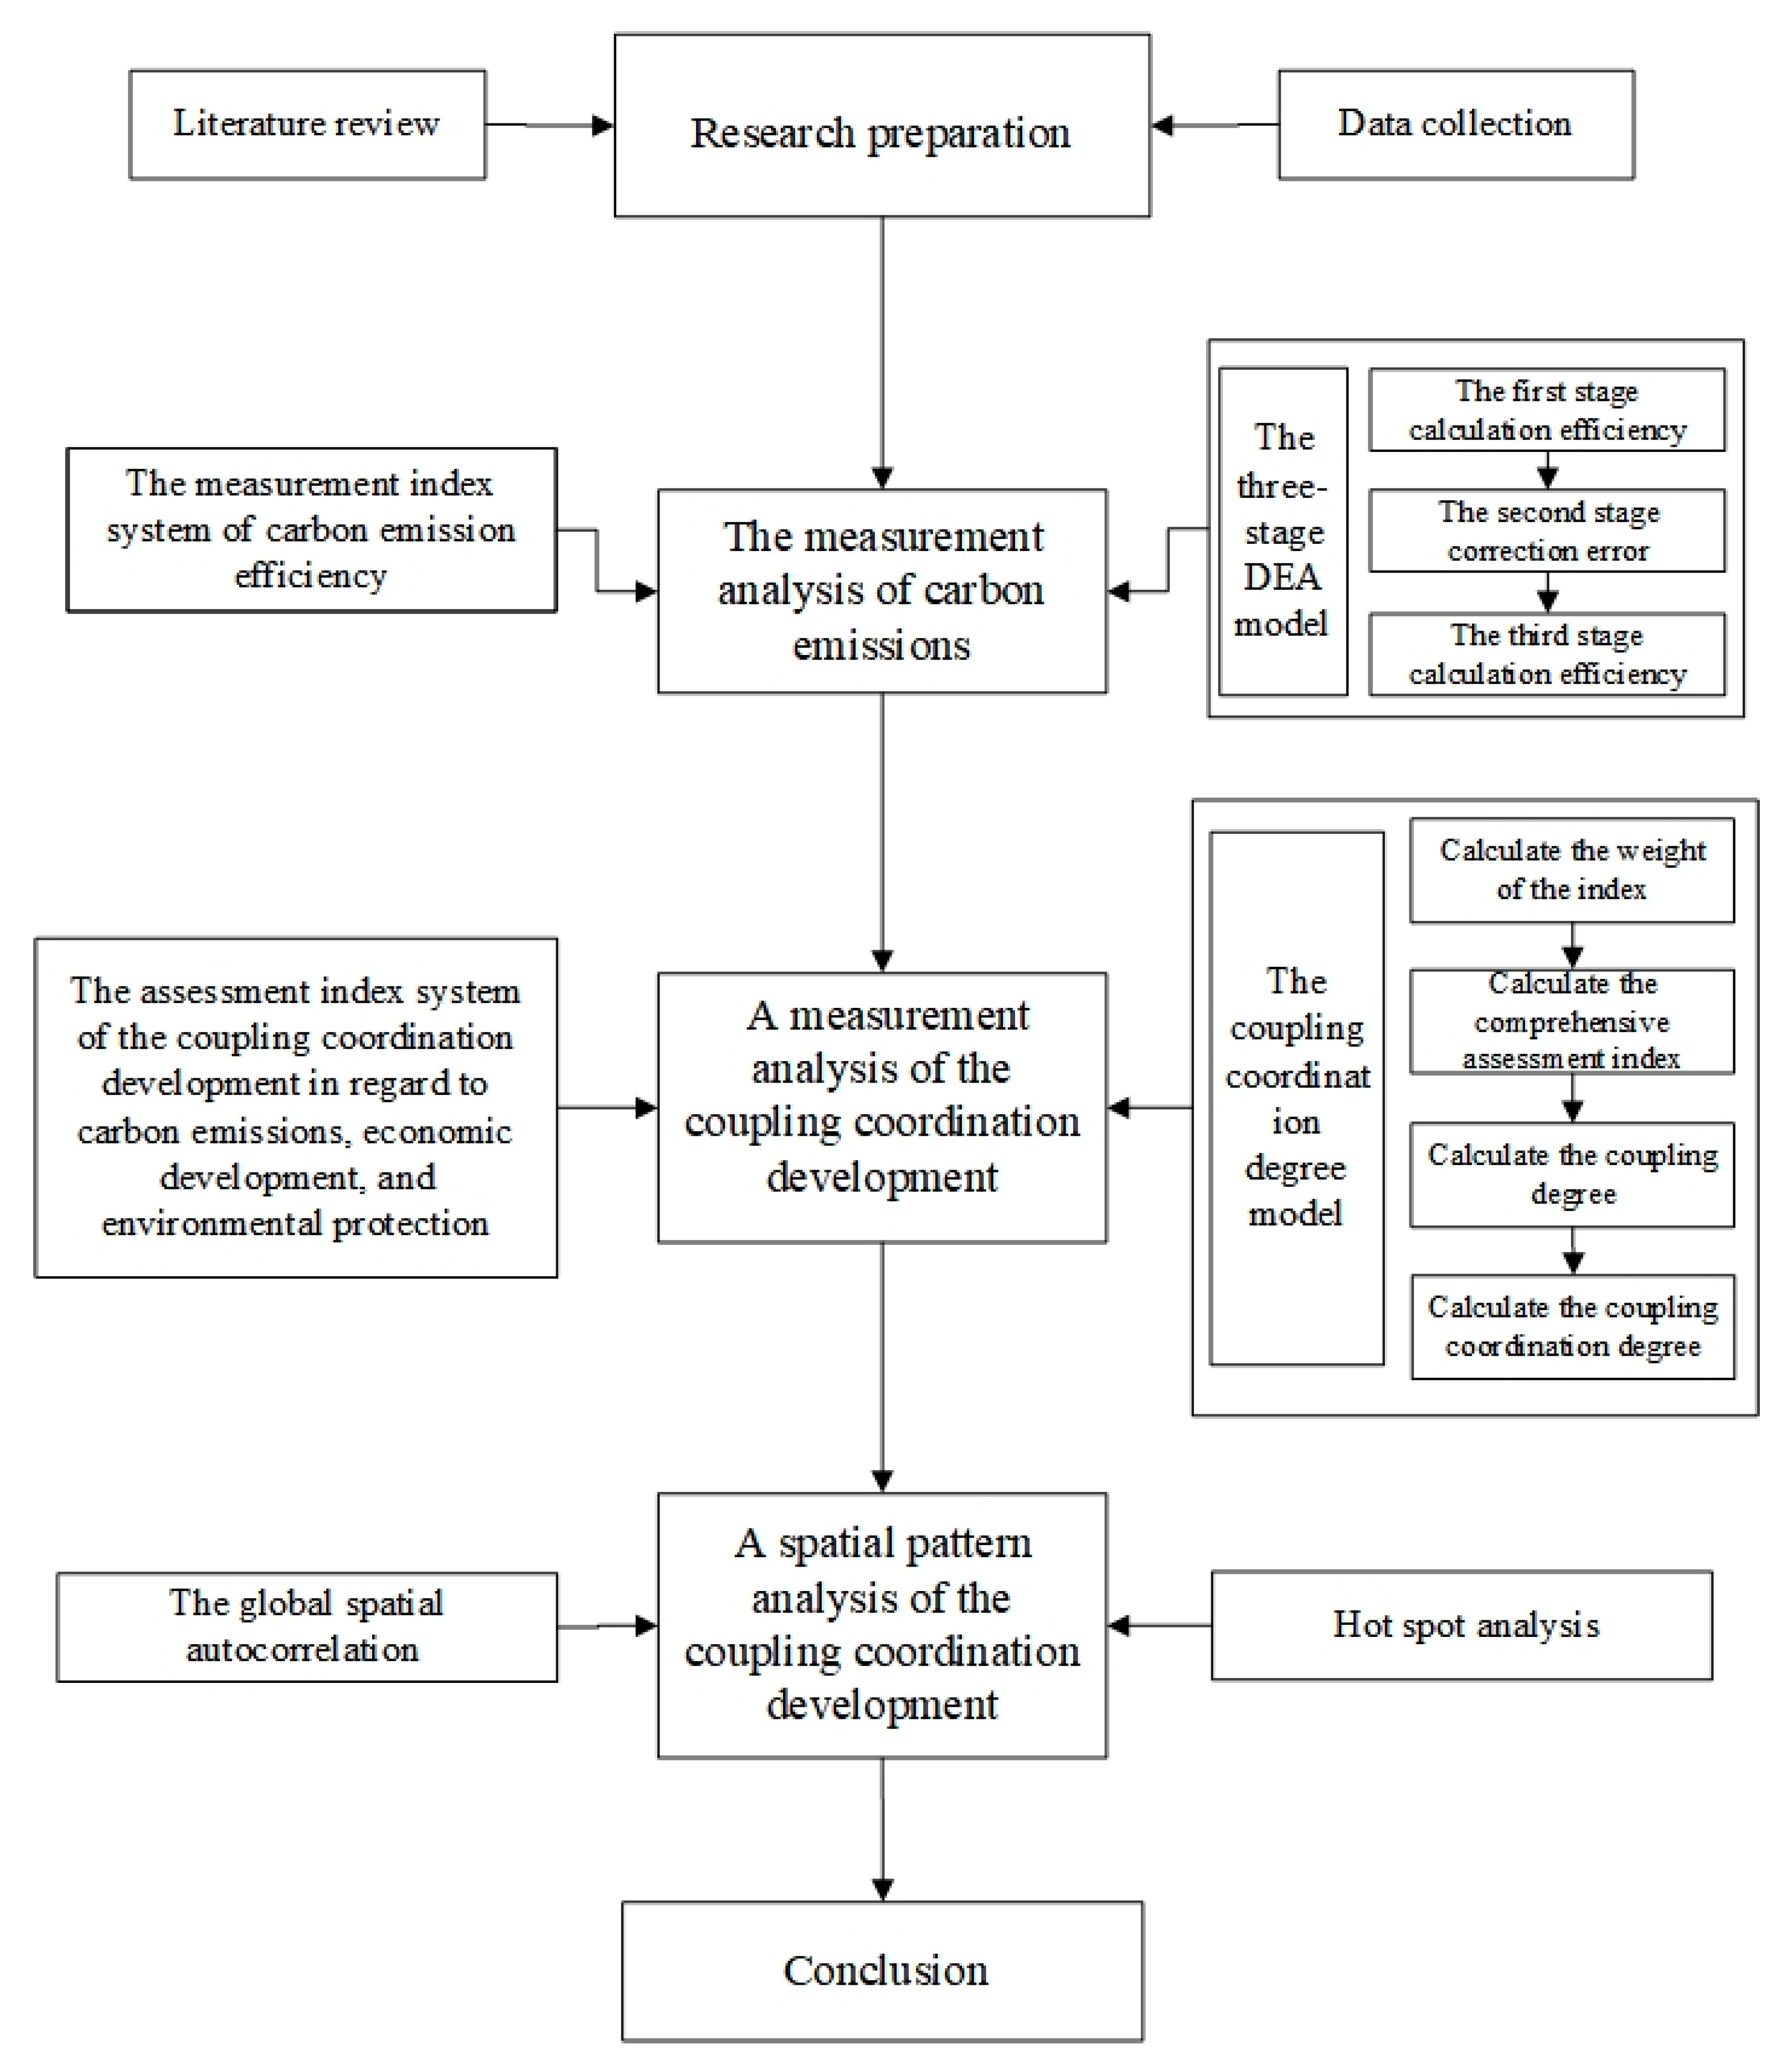
There are few studies on the ternary relationship between carbon emissions, economic development, and environmental protection abroad. Instead, the focus is often on the dual relationship between carbon emissions and economic development, or between economic development and environmental protection, with a specific focus on the selection of appropriate measurement models. Commonly used measurement models include neoclassical growth models, endogenous growth models, input-output models, environmental computable general equilibrium (CGE) models, environmental Kuznets curve (EKC) models, and comprehensive assessment models [36,37,38]. For example, Grossman et al. proposed an inverted U-shaped relationship between carbon dioxide emissions and economic growth [39]. Tucker analyzed the relationships between per capita carbon emissions and per capita GDP across 137 countries [40]. Ramos et al. analyzed the level of the coordinated development of the economy and the environment in Scotland [41]. Ramanathan studied the relationship between global CO2 emissions and GDP growth [42], and Bildirici et al. studied the relationship between CO2 emissions and economic growth across various countries [43].
In China, research on the relationship between carbon emissions, economic development, and environmental protection mainly focuses on binary relationship analysis and the selection of appropriate measurement models, including EKC, decoupling models, and coupling coordination models. For example, Wang Jian et al. used the EKC to analyze the relationship between carbon emissions and economic development in the Yangtze River Economic Zone [44]. Fan Dan quantified the EKC between carbon dioxide emissions and economic growth in China [45]. Sun Yefei et al. analyzed the decoupling relationship between China’s economic development and carbon emissions [46]. Huang Yusheng et al. quantified the relationship between China’s carbon emissions and environmental protection by measuring the carbon carrying capacity [47]. By contrast, domestic research on the ternary relationship between carbon emissions, economic development, and environmental protection started late, with relatively few research results. Among the few related studies, the research focus is on the aspect of the measurement and quantification of the coordination degree of the 3E (energy-economy-environment) system. For example, Huang Xinhuan et al. analyzed the coordination degree of China’s 3E system [48], Cao Ruirui et al. quantified the coordination degree of Shanghai’s 3E system [49] and Liu Qian et al. analyzed the coordination degree of the 3E system in Guangdong province [50].
Overall, although related research has achieved some fruitful results, a number of obvious shortcomings still persist. Firstly, research on the ternary coordination relationship between carbon emissions, economic development, and environmental protection is still lacking, and relevant research on the basis of the core perspective of carbon emissions is especially rare. Secondly, judged from the perspective of research ideas and methods, and given the fact that geographic information system (GIS) technology and spatial analysis models keep advancing, the number of studies that address the three-dimensional coordination relationship between carbon emissions, economic development, and environmental protection, and that consider spatial and temporal aspects explicitly and simultaneously, is surprisingly limited. The present study should be able to make up for the lack of knowledge referred to above.

3. Data and Method

3.1. Index System and Data Sources

Having summarized and integrated the existing research results [51,52,53] and considered China’s actual situation, the present study develops a measurement index system to quantify carbon emission efficiency from three aspects; namely, input variables, output variables, and external environmental variables (Table 1). Additionally, through following the principles of comprehensiveness, effectiveness, systematicness, representativeness, and independence and by analyzing the existing research results [54,55,56], a three-dimensional coordination degree assessment index system is further developed, which reflects the relationship between carbon emissions, economic development, and environmental protection on the basis of carbon emission efficiency (Table 2). The present study uses 2009–2018 as the research period. The original data come from the “China Statistical Yearbook”, “China Environmental Statistics Yearbook”, “China Energy Statistical Yearbook”, and “China Employment Statistical Yearbook”, the Statistical Yearbook of all provinces, with municipalities and autonomous regions included, the National Economic and Social Development Statistical Bulletin, Environmental Status Bulletin, and other relevant statistical materials and literature.

3.2. Research Method

As shown in Figure 1, three-stage DEA model is used to calculate carbon emission efficiency. Then, the coupling coordination degree model is used to calculate the coordination degree of carbon emissions, economic development, and environmental protection. At last, the spatial pattern of coordination degree is analyzed by the global spatial autocorrelation model and hot spot analysis model.

3.2.1. Three-Stage DEA Model

The three-stage DEA model has three stages, as its name suggests. The environmental conditions of the samples are different, and the management level and technology are also different, which will lead to the deviation of the results. It is believed that the main environmental factors are energy efficiency, dependence on foreign trade, industrial structure and government intervention. Compared with the traditional DEA, the three-stage DEA model can effectively remove the influence of environmental variables and random errors, making the measurement results more accurate and objective [57].
The first stage: the slacks-based measure (SBM)-DEA model is as follows:
ρ = min 1 1 N n = 1 N S n x x kn t 1 + 1 M + 1 ( m = 1 M S m y y km y + i = 1 L S i b b ki t ) s . t . k = 1 , k j k z k t x kn t + S n x = x kn t , n = 1   N k = 1 , k j k z k t y kn t S m y = y km t , m = 1   M k = 1 , k j k z k t b ki t + S i b = b ki t , i = 1   I z k t 0 , S n x 0 , S m y 0 , S i b 0 , k = 1   K
In this formula: ρ is the efficiency value, N is the number of inputs, M is the number of expected outputs, ( S n x , S m y , S i b ) represent the slack variables of input and output, ( x kn t , y km t , b k i t ) is the input-output value of the k-th production unit within the t-th period, and z k t represents the input-output weight, with 0 < ρ 1 . When ρ = 1 , the production unit is fully effective, but when ρ < 1 , there is an efficiency loss in the production unit.
The second stage: an SFA regression model is developed to decompose the slack variables into three independent variables, namely, environmental factors, random factors, and management inefficiency. The function model of SFA is as follows:
S ni = f n ( Z i , β n ) + V ni + U ni n = 1 , 2 ,   N . ; i = 1 , 2 , I
In this formula: the slack variable, S ni , is the i-th decision-making unit of the n-th input. Z i = ( Z 1 i , Z 2 i , , Z ki ) represent K environmental variables. f n ( Z i , β n ) reflect the influence of environmental variables on the slack variable S ni ; ( V ni + U ni ) represent mixed error terms, and V ni represents a random interference term.   U ni means that the management has no performance term, and V ni , U ni means they are independent of each other.
The new input value is quantified in a homogeneous environment:
X ni * = X ni + [ max ( Z i β n ) Z i β n ] + [ max ( V ni ) V ni ] n = 1 , 2 ,   N . ; i = 1 , 2 ,   I
In this formula: X ni * is the new input value, X ni is the original input value, and [ max ( Z i β n ) Z i β n ] , [ max ( V ni ) V ni ] are the adjustment items.
The third stage: the original input data are replaced by the adjusted input data from the second stage, with the operation process of the first stage repeated.

3.2.2. Coupling Coordination Degree Model

Calculate the ratio coefficient P ij of the index x ij :
P ij = x ij i = 1 m x ij
Calculate the entropy value e j of the index:
e j = k i = 1 m p ij ln ( p ij ) ,   k = 1 ln ( m )
Calculate the information entropy redundancy d j :
d j = 1 e j
Calculate the weight of the index:
w j = d j j = 1 n d j
Calculate the comprehensive assessment index of carbon emissions, economic development, and environmental protection, respectively [58,59]. The formula is as follows:
U i = j = 1 n w j x ij
In this formula: w j is the weight of each index, x ij is the standardized value of each index, and U i represents the comprehensive assessment index of carbon emissions, economic development, and environmental protection, respectively.
The coupling degree and coordination degree are quantified, respectively, using the following formula [60]:
C = { ( X × Y × Z ) / [ ( X + Y + Z ) / 3 ) ] 3 } 1 / 3
D = C × T ,   where   T = α X + β Y + γ Z
In this formula: D is the coordination degree between carbon emissions, economic development, and environmental protection. C is the coupling degree between the three factors. X ,   Y , and Z represent the comprehensive assessment index of carbon emissions, economic development, and environmental protection, respectively. T is the comprehensive assessment index. α ,   β ,   and   γ are undetermined coefficients. Based on the existing research literature, carbon emissions, economic development, and environmental protection are equally important [51,61,62]. Given that carbon emissions, economic development, and environmental protection are of equal importance, the value is set at 1/3 here for each undetermined coefficient.
In reference to the classification method of the coordination degree in the relevant literature, we divide the coordination degree into ten levels [63] (Table 3).

3.2.3. Global Spatial Autocorrelation

The global spatial autocorrelation can be applied to test whether the regional coordination degree in regard to carbon emissions, economic development, and environmental protection displays some dispersion or aggregation patterns statistically. The formula is as follows [64,65,66,67]:
I   = n i = 1 n j = 1 n W ij ( Y i Y ¯ ) ( Y j Y ¯ ) i = 1 n j = 1 n W ij i = 1 n ( Y i Y ¯ ) 2
In which I is the global Moran’s I index, n is the number of evaluation objects, and Y ¯ is the average of the sample values of all evaluation objects. Y i and Y j represent the sample values of the i-th and j-th evaluation objects, respectively, and W ij is the spatial weight matrix.
In order to further determine whether there is a spatial autocorrelation relationship, the significance test of I is required. The test formula is:
Z = I   E ( I ) Var ( I )
In which Z is the global Moran’s I test value, E ( I ) is the expectation of I, and Var ( I ) is the variance of I.

3.2.4. Hot Spot Analysis (Partial Getis-Ord G*index)

The hot spot analysis method is applied to reflect the local spatial dependence and spatial heterogeneity in regard to the coordination degree of regional carbon emissions, economic development, and environmental protection, and to explore the characteristics and principles of the local spatial autocorrelation. The calculation formula is as follows [68,69]:
G i * = j = 1 n W ij x j j = 1 n x j ( j i )
In which x j is the sample value of the j-th evaluation object, n is the number of evaluation objects, and W ij is the spatial weight matrix. If the value of G i * is significantly positive, it suggests that the value around area i is relatively higher, and such an area represents a hot spot. Otherwise, the area represents a cold spot.

4. Results and Discussions

4.1. Measurement Analysis of Carbon Emissions

It can be seen from Table 4 that for the first stage, the overall national carbon emission efficiency was 0.514, out of which 10 provinces had higher levels beyond the national average, and the remaining provinces had lower levels than the national average. This finding clearly shows that the overall carbon emission efficiency in China remains low, and the situation regarding energy conservation and emission reduction is still suboptimal. The national average of the pure technical efficiency of carbon emissions was 0.608, and provinces with a higher efficiency include Beijing, Guangdong, and Hainan. The average scale efficiency of national carbon emissions is 0.865. Apart from provinces such as Qinghai, Ningxia, and Hainan, which have a lower scale efficiency, the scale efficiency of the other provinces is generally higher. Compared with the first stage, the national average level of comprehensive carbon emissions in the third stage dropped slightly, with an average value of 0.500, and the differences in comprehensive carbon emissions across different provinces increased. Zhejiang, Guangdong, Jiangsu, and other provinces with high efficiency levels further improved their efficiency, whereas the efficiency of Ningxia, Qinghai, and other provinces with low efficiency levels further decreased. Out of these, the overall carbon emission efficiency of 17 provinces was higher than the national average, and that of 13 provinces was lower than the national average. The average value of pure technical efficiency of national carbon emissions was 0.778, which displayed an increasing trend when compared to the first stage. Provinces with a higher efficiency included Guangdong, Hainan, and Zhejiang. The national average carbon emission scale efficiency was 0.638, which displayed a decreasing trend when compared to the first stage. Qinghai, Ningxia, Hainan, and other provinces had a lower scale efficiency, whereas the rest of the provinces generally displayed a higher scale efficiency.
It can be seen from Table 5 that between 2009 and 2018, the comprehensive carbon emission efficiency of Jiangsu, Zhejiang, Beijing, and other provinces showed a rapid rise with a high magnitude of change. The comprehensive carbon emission efficiency of Guangdong, Heilongjiang, and Liaoning displayed a fluctuating trend, whereas the rest of the provinces generally showed a slow upward trend. The national average carbon emission efficiency gradually increased, and the magnitude of the increase was about 41%. Specifically, Jiangsu’s comprehensive carbon emission efficiency value in 2017 and 2018 was 1, which was at the forefront of the entire production, although it did not reach such an effective state in the remaining years. In 2018, Beijing’s overall carbon emission efficiency value was 1, which was also at the forefront of the entire production. Similarly, Beijing’s carbon emission efficiency in other years was relatively low. Guangdong’s comprehensive carbon emission efficiency value in 2011 and 2018 was 1, which was again at the forefront of the entire production. Although the comprehensive efficiency value of the remaining years did not reach 1, it was relatively high. By contrast, the overall carbon emission efficiency of the remaining provinces did not reach the aforementioned frontier production level. It can be seen that the provinces with a low overall carbon emission efficiency (e.g., lower than the national average) throughout the year were mainly distributed around economically underdeveloped areas within the central and western regions.

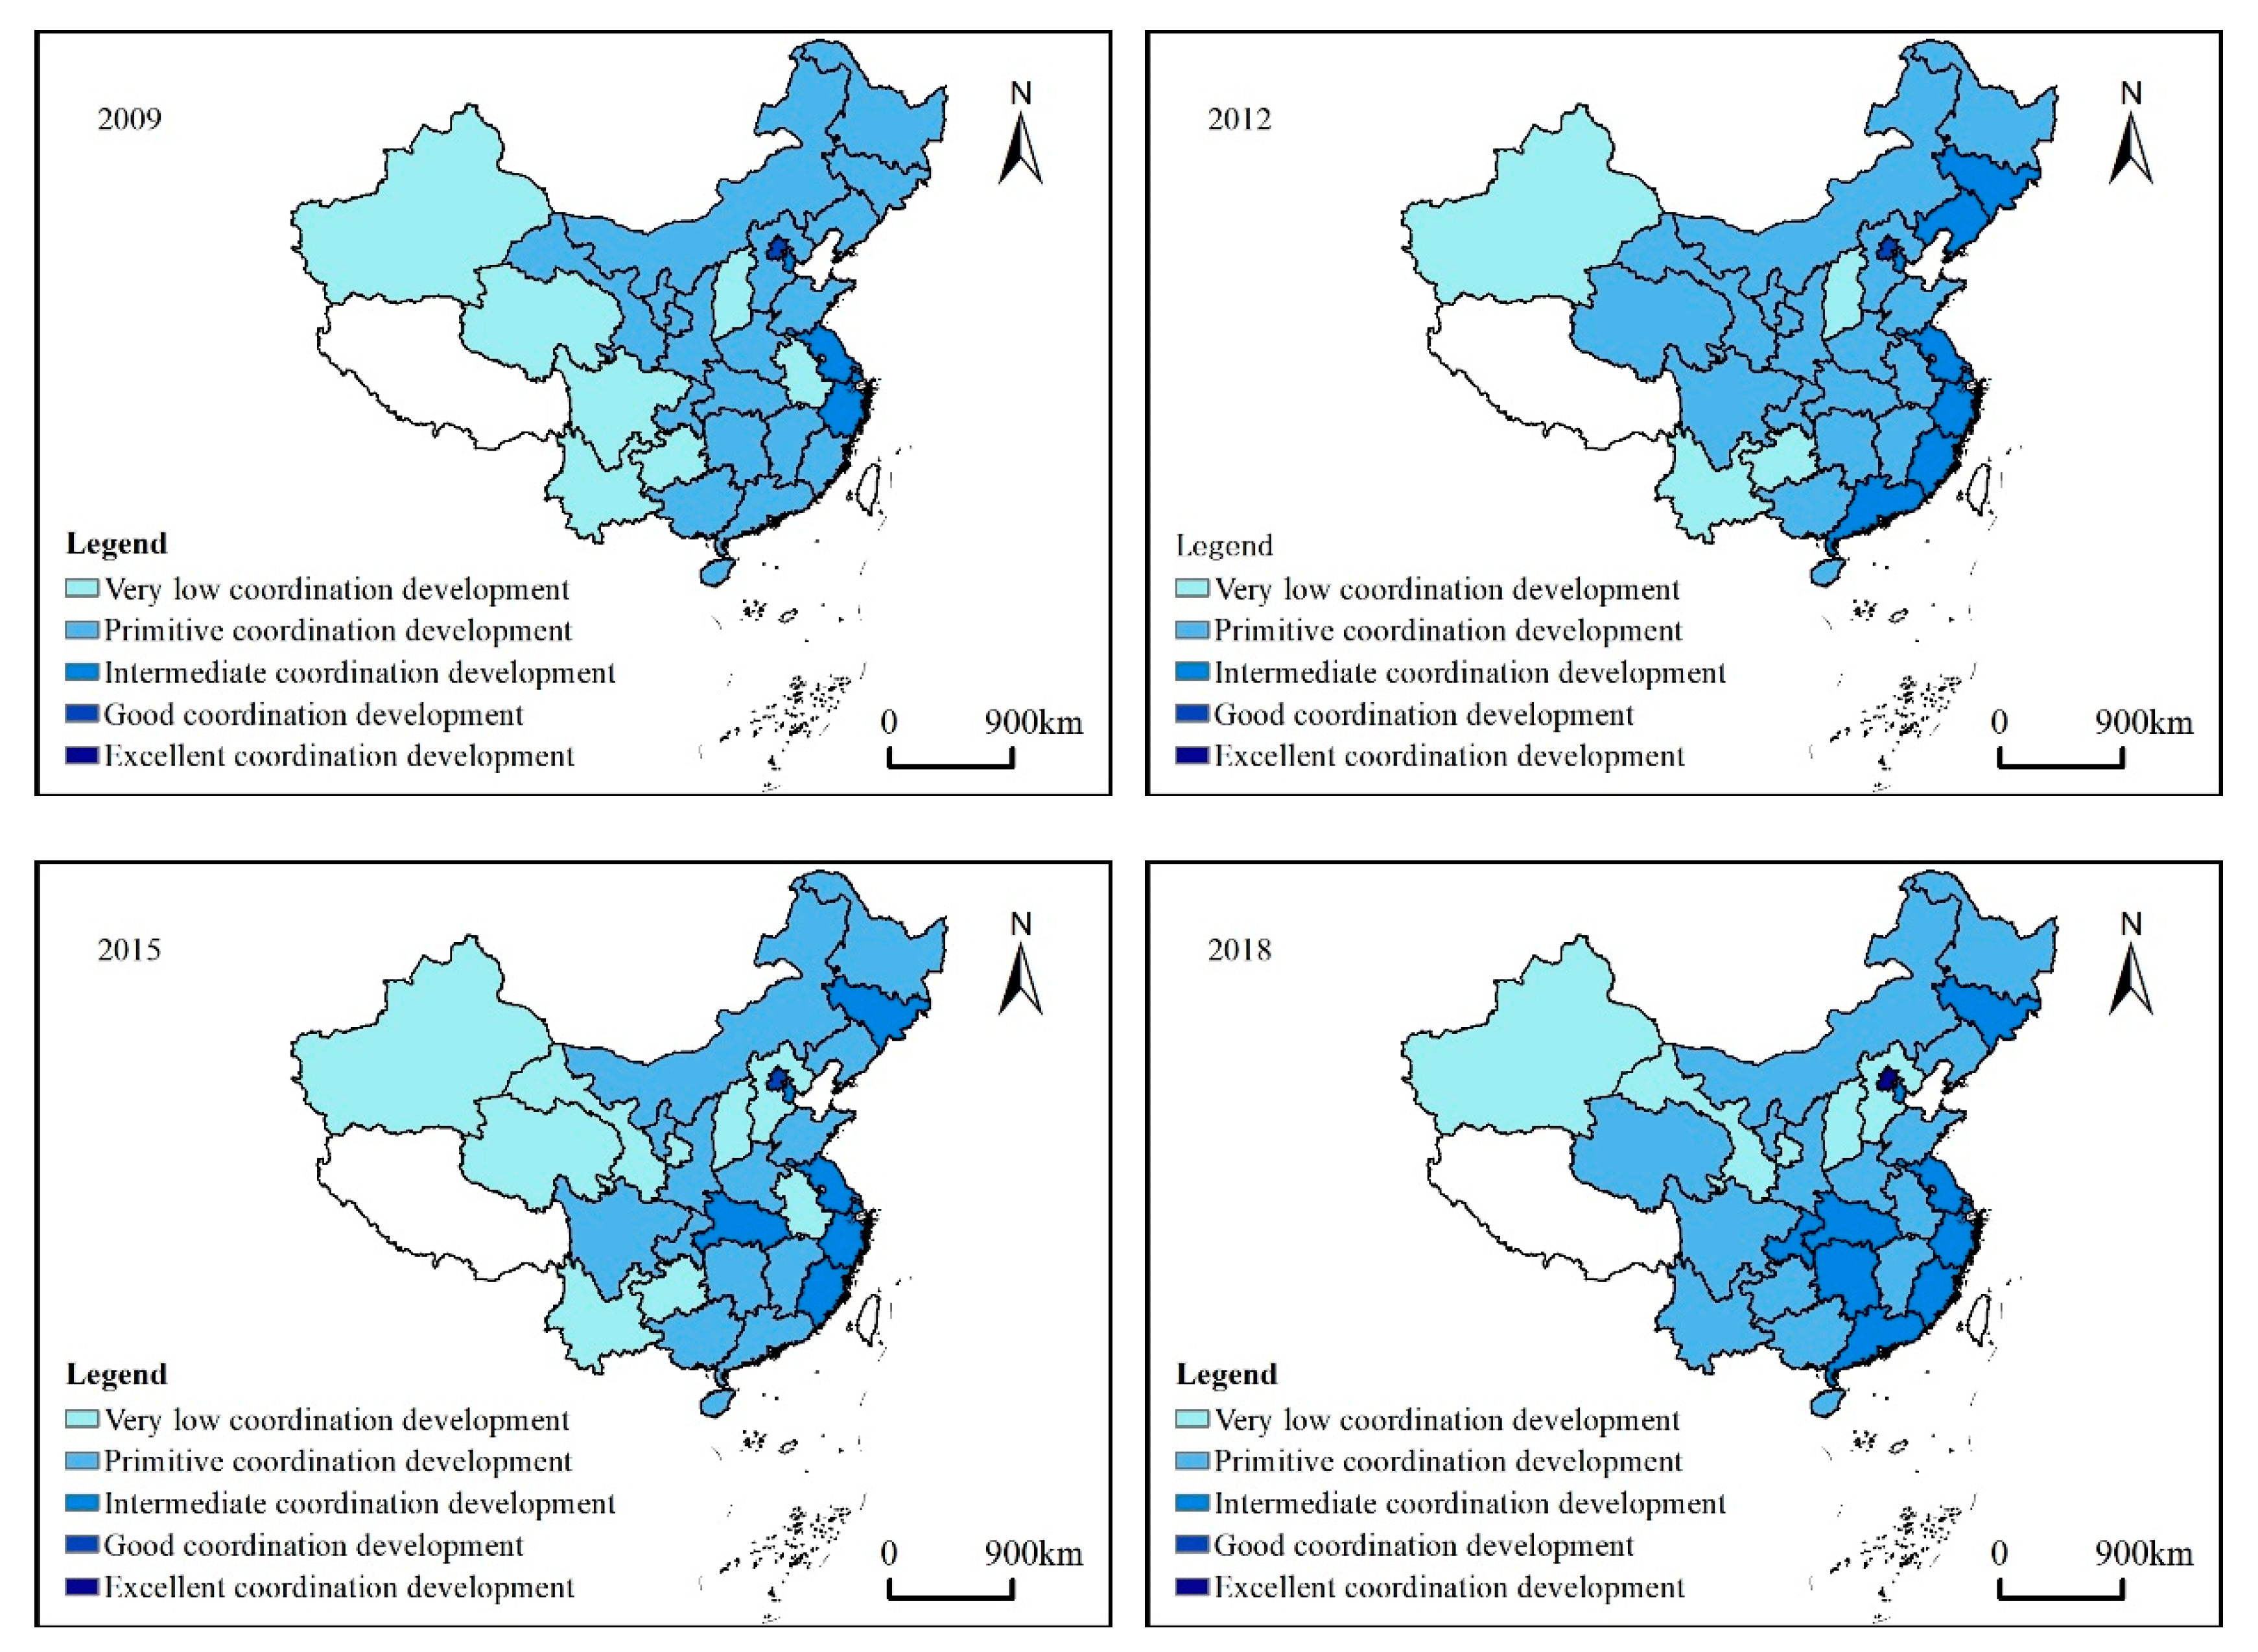
4.2. Measurement Analysis of the Coordination Degree

China’s coordination degree in regard to carbon emissions, economic development, and environmental protection generally displayed a slow upward trend. The magnitude of such an increase was relatively small, with the coordination degree generally displaying a steady rising trend. The average coordination degree was 0.669, suggesting that such a coordination development remains at the primitive level (Table 6). Specifically, the coordination degree decreased slightly between 2013 and 2015, suggesting a slight decrease in the level of coordination development. From the perspective of coordination, the coordination degree of most provinces displayed a slow upward trend. Only a few provinces showed a slight declining trend, suggesting that the coordination level of most provinces generally exhibited a steady rising trend. According to the average value of the coordination degree, only Beijing has achieved a good level of such a coordination development. Seven provinces, including Jilin, Zhejiang, and Guangdong, have reached the intermediate level of coordination development, and they are also in the first echelon of the entire country. Seventeen provinces, including Heilongjiang, Liaoning, and Inner Mongolia, are at the primitive level of coordination development. Xinjiang, Guizhou, Yunnan, and the other five provinces are at the lowest level of coordination development. For the present study, there are no provinces in a state of dysregulation or recession.
It can be seen from Figure 2 that in 2009, only five provinces, including Zhejiang, Beijing, and Shanghai, reached or went beyond the intermediate level of coordination development. Eight provinces, including Xinjiang, Qinghai, and Guizhou, were at the very low coordination level of development, and the rest of the provinces were at the primitive level of coordination development. In 2012, the number of provinces that reached or went beyond the intermediate level of coordination development increased to nine, and the newly added provinces included Guangdong, Fujian, Jilin, and Liaoning. By contrast, the number of provinces at the very low coordination development stage was reduced to five (e.g., Xinjiang, Yunnan, and Shanxi), and the rest of the provinces were at the primitive level of coordination development. In 2015, there were eight provinces at the intermediate or higher level of coordination development, among which Liaoning and Guangdong were withdrawn while Hubei was added. The number of provinces with a very low level of coordination development increased to eight, and the newly added provinces included Gansu, Qinghai, and Hebei. The remaining provinces were at the primitive level of coordination development. In 2018, eleven provinces, including Beijing, Tianjin, and Zhejiang, reached the intermediate or higher level of coordination development, of which Beijing reached the level of high-quality coordination development. By contrast, Gansu, Xinjiang, Hebei, and Shanxi were still at the very low coordination development stage. The rest of the provinces were all at the primitive level of coordination development. Overall, provinces with a high level of coordination development in terms of carbon emissions, economic development, and environmental protection were mainly distributed around the eastern coastal regions, and provinces with a low level of coordination development were mainly distributed in the underdeveloped areas within the central and western regions, with an increase in the inter-regional gap.

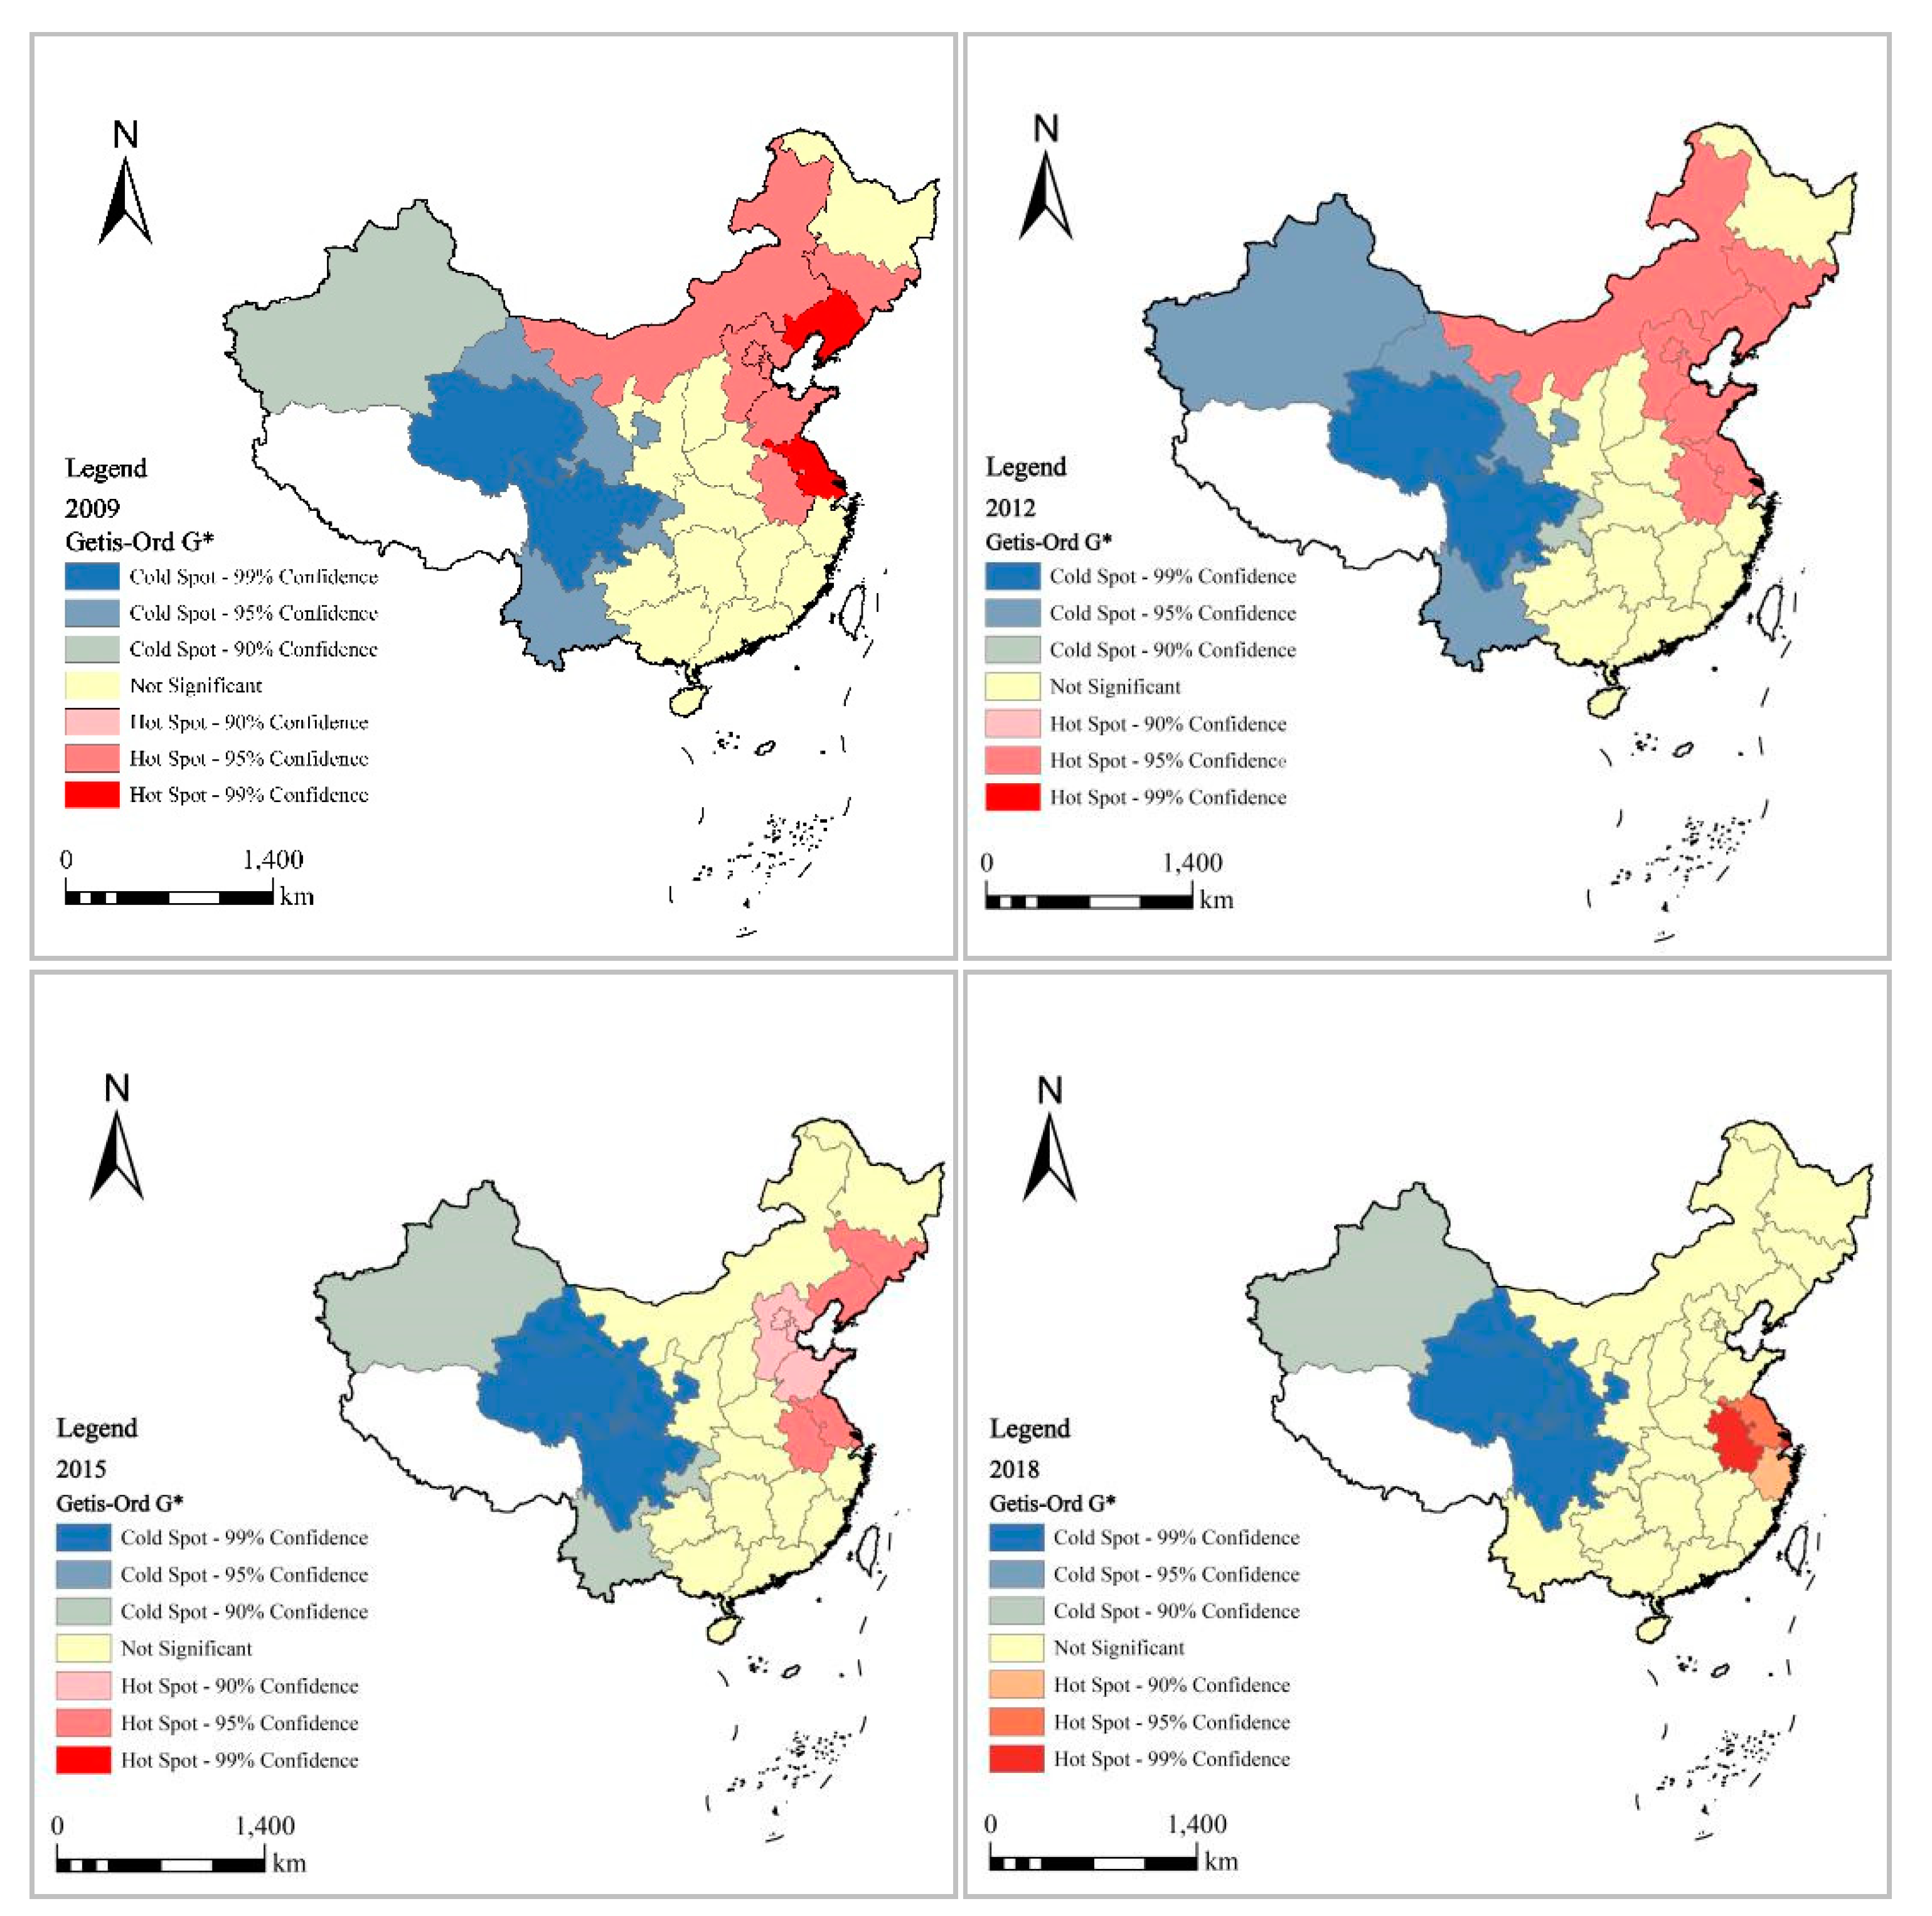
4.3. Spatial Pattern Analysis of the Coordination Degree

4.3.1. Global Spatial Autocorrelation Analysis

The global Moran’s I values of the coordination degree in regard to China’s carbon emissions, economic development, and environmental protection between 2009 and 2018 (Table 7) were calculated. Such values were all positive over the years, with the z-test values greater than the test critical value of 2.58, and were statistically significant at the 1% level, with the statistical significance passing the 99% confidence level. It can be seen that the level of China’s coordination degree in terms of carbon emissions, economic development, and environmental protection displayed a positive spatial autocorrelation, with certain aggregation patterns found at the provincial level. In other words, China’s coordination degree was not randomly distributed. Rather, regions with a high or low degree generally exhibited obvious spatial aggregation patterns. Specifically, provinces with a relatively high level of coordination degree tended to be adjacent to each other, and provinces with a relatively low level of coordination degree tended to be neighbors. Judging from the change trend of the global Moran’s I index, the overall index shows a downward trend, suggesting that the degree of spatial autocorrelation kept decreasing. Or, in other words, the degree of spatial aggregation and distribution of provinces with high or low levels of coordination has weakened to a certain extent.

4.3.2. Local Spatial Autocorrelation Analysis

The present study selected the years 2009, 2012, 2015, and 2018 to further conduct a local spatial autocorrelation analysis in terms of the level of China’s coordination degree regarding carbon emissions, economic development, and environmental protection, and we also calculated the local Getis-Ord G* index to reflect the coordination degree. China’s provinces were categorized into seven types of regions, including 99% hot spot aggregation regions, 95% hot spot aggregation regions, 90% hot spot aggregation regions, non-significant regions, 90% cold spot aggregation regions, 95% cold spot aggregation regions, and 99% cold spot aggregation regions (Figure 3).
In 2009, Shanghai, Liaoning, and Jiangsu belonged to the category of 99% hot spot aggregation regions, whereas Hebei, Beijing, and Shandong belonged to the category of 95% hot spot aggregation regions. There were no provinces belonging to the category of 90% hot spot aggregation regions. By contrast, Qinghai and Sichuan belonged to the category of 99% cold spot aggregation regions, Gansu, Chongqing, and Yunnan belonged to the category of 95% cold spot aggregation regions, Xinjiang belonged to the category of 90% cold spot aggregation regions, and the rest of the provinces belonged to the category of non-significant regions. The number of provinces belonging to the category of hot spot aggregation regions accounted for 33% of the total, those belonging to the category of cold spot aggregation regions accounted for 20% of the total, and the number of those belonging to the category of hot spot aggregation regions was higher than those belonging to the category of cold spot aggregation regions. In 2012, Shanghai, Liaoning, and Jiangsu evolved into the category of 95% hot spot aggregation regions, although the spatial scope of the hot spot aggregation regions remained the same as that for the original provinces. Xinjiang evolved into the category of 95% cold spot aggregation regions, and Chongqing evolved into the category of 90% cold spot aggregation regions, although the overall spatial scope of the cold spot aggregation regions remained the same as that for the original provinces. In 2015, Inner Mongolia was withdrawn from the list of hot spot aggregation regions, and some provinces such as Hebei and Beijing evolved into the category of 90% hot spot aggregation regions. The spatial scope of the hot spot aggregation regions showed a significant contraction trend, and the number of relevant provinces kept decreasing. Gansu evolved into the category of 99% cold spot aggregation regions, and Xinjiang and Yunnan evolved into the category of 90% cold spot aggregation regions. However, the spatial scope of cold spot aggregation regions remained the same as that for the original provinces. In 2018, Hebei, Beijing, and Liaoning were withdrawn from the list of hot spot aggregation regions. The spatial scope of hot spot aggregation regions further shrank, and the number of relevant provinces decreased rapidly. Only four provinces, namely, Anhui, Jiangsu, Shanghai and Zhejiang, belonged to the category of hot spot aggregation regions. Yunnan and Chongqing were withdrawn from the list of cold spot aggregation regions, and the spatial scope of cold spot aggregation regions also showed a significantly shrinking trend, as the number of relevant provinces kept decreasing. Only Qinghai, Gansu, Sichuan and Xinjiang remained in the category of cold spot aggregation regions.
Overall, the level of China’s coordination degree in regard to carbon emissions, economic development, and environmental protection across all provinces exhibited spatial aggregation patterns, with an obvious spatial dependence and heterogeneity. As time went by, both hot spot aggregation regions and cold spot aggregation regions generally shrank, suggesting that the spatial aggregations and distributions of high-value and low-value provinces in regard to coordination degree tended to weaken, which is in line with previous analysis results based on the global Moran’s I index. Hot spot aggregation regions were mainly distributed along the eastern coastal area, while cold spot aggregation regions were mainly distributed along the western inland areas, developing a transition path from hot spot aggregation regions in the east towards cold spot aggregation regions in the west. It can be seen that the level of China’s coordination degree in regard to carbon emissions, economic development, and environmental protection is generally higher in the east and lower in the west, exhibiting a decreasing trend from the east coast towards the west inland, and demonstrating a contrasting east-west spatial distribution pattern.

4.4. Discussions

In recent years, other scholars have also conducted similar research for the carbon emission efficiency in China. For instance, Wang et al. found that urban carbon emission performance in China increased steadily from 1992–2013. However, the overall level of carbon emission performance remains low, and the spatial pattern of urban carbon emission performance in China can be described as “high in the south and low in the north” [70]. Sun et al. found that the steady improvement for China’s carbon emission efficiency is obvious, and there is an inverted U-shaped relationship between urbanization and carbon emission efficiency [71]. Li et al. took the Yangtze River Delta, the Pearl River Delta and the Beijing-Tianjin-Hebei Region as research objects, and found that regional industrial structure, energy efficiency, FDI(Foreign Direct Investment) dependence, and urbanization have a significant impact on the carbon emission efficiency [30].
In recent years, other scholars have also conducted similar research for the relationship of carbon emissions, economic development, and environmental protection. However, such studies remain limited, and some related studies focus on the coordination degree of the 3E (energy-economy-environment) system. For instance, Zhang found that the coupling of carbon emissions, economic development, and environmental protection in Liaoning Province is still at a low level [72]. Hu et al. found that economic growth is related to the environmental input, and there is an inverted U-shape relationship between the environmental input and carbon emissions [73]. Su et al. found that the coordination level of the 3E system is not optimistic, and there are 26 provinces at different levels of maladjustment in China [74]. Yan et al. found that China’s 3E system is in an intermediate coordination state, and that the contradiction between energy consumption and environmental protection is the biggest obstacle to the overall coordination of the 3E system [75].
Studies about spatial pattern analysis of the coordination degree of carbon emissions, economic development, and environmental protection are still lacking, and some related studies focus on the spatial pattern of the coordination degree of the 3E system. For instance, Wang et al. found that the spatial pattern of the coordination degree of China’s 3E system shows a positive spatial correlation on the global perspective [76]. Luo et al. analyzed the spatial distribution of the coordination degree of China’s 3E system, and found the spatial pattern of the coordination degree from the eastern coastal areas to the surrounding provinces [77]. Su et al. found that the spatial correlation of the coordination level distribution of China’s 3E system is weak, and the spatial distribution lacks the obvious positive effect of spatial agglomeration [78].

5. Conclusions

Between 2009 and 2018, China’s overall carbon emission efficiency displayed a gradual upward trend, although the overall level was not that high. Therefore, there is still much scope for further improvement. For most of the provinces, the overall carbon emission efficiency displayed an upward trend, although a few provinces showed fluctuations, and a few provinces even exhibited a downward trend. The overall carbon emission efficiency varied significantly across the provinces, and the gap among these provinces kept increasing. Provinces with low levels of carbon emission efficiency, especially those with lower levels than the national average level throughout the years, were mainly distributed along economically underdeveloped areas within the central and western regions, whereas provinces with high levels of carbon emission efficiency were mainly found in economically developed areas within the eastern coast regions.
Between 2009 and 2018, the level of China’s coordination degree in regard to carbon emissions, economic development, and environmental protection showed a steady yet rising trend. For most provinces, the level of coordination degree kept increasing slowly, although a limited number of provinces showed a slightly declining trend. All provinces reached different levels of coordination development, and there was no province that displayed a disorderly declining trend. However, the number of provinces that reached or went beyond the intermediate level of coordination development was quite limited. Indeed, most provinces were at the primitive level of coordination development or at the very low level of coordination development. Generally, areas with higher levels of coordination development were mainly distributed along the eastern coastal regions, and areas with lower levels of coordination development were mainly distributed along underdeveloped areas within the central and western regions. Moreover, the gap between such regions kept increasing.
Between 2009 and 2018, the level of China’s coordination degree in regard to carbon emissions, economic development, and environmental protection displayed obvious spatial aggregation patterns at the provincial level, showing an apparent spatial dependence and heterogeneity. Provinces with a relatively high level of coordination degree tended to be adjacent to each other, and provinces with a relatively low level of coordination degree tended to be neighbors. Over time, the level of spatial aggregation patterns in regard to coordination degree tended to weaken. Provinces displaying hot spot aggregation patterns with high levels of coordination degree were mainly distributed around the eastern coastal regions, whereas provinces displaying cold spot aggregation patterns with low levels of coordination degree were mainly distributed in the western inland regions. Overall, the values were high in the eastern region and low in the western region, decreasing from the eastern coastal zone towards the western inland zone, thus demonstrating a contrasting east-west spatial distribution pattern.
When exploring the coordination degree of carbon emissions, economic development, and environmental protection, the development advantages of provinces should be combined in order to effectively improve the coordination level. For the eastern region, based on strong economic strength, the technological innovation and efficient use of energy should be strengthened. For the western region and the central region, while pursuing economic growth, the guidance policy of green development should be adhered to, such as green finance. The support of financial regulatory policies is required, and coordination and positive interaction between financial and tax policies and industrial policies are also required. The government needs to further improve the transmission effect of incentive policies and guide capital to invest in green industries.
The spatial pattern analysis in this study is based on the provincial scale, so the results and conclusions can be contributed to the decision-making process of regional development at the provincial level. However, the provincial scale is relatively large, and there will be some differences among the internal areas, so the current study is still open to further research at smaller spatial units. In future studies, smaller spatial units within the province, such as the municipal scale and county-level scale, should be focused on. Spatial analysis methods for small-scale regions should be carried out in further research in order to explore differences within the province.

Author Contributions

C.L. and H.L. designed the study and wrote the paper. D.W. and W.C. analyzed the data. X.T. and W.L. contributed to data collection and processing. All authors have read and agreed to the published version of the manuscript.

Funding

This research was funded by [National Natural Science Foundation of China] grant number [42061054], [41561110], [51568033]; by [Science and Technology program of Gansu Province] grant number [20CX4ZA039].

Institutional Review Board Statement

Not applicable.

Informed Consent Statement

Not applicable.

Data Availability Statement

The data presented in this study are available on request from the corresponding author.

Acknowledgments

Thanks to the anonymous reviewers and all the editors in the process of revision.

Conflicts of Interest

The authors declare no conflict of interest.

References

  1. Xue, B.; Lu, C.Y.; Geng, Y.; Liu, Z.; Zhang, W.W.; Li, C.R. Practice and Prospect of Low Carbon City Development in China. Econ. Geogr. 2012, 32, 51–56. (In Chinese) [Google Scholar]
  2. Fan, F.Y.; Lei, Y.L. An Review on Energy, Economy and Environment (3E) System. Ecol. Econ. 2013, 12, 42–48. (In Chinese) [Google Scholar]
  3. Li, H.J.; Qu, J.S. Social public participation mechanism in low-carbon development. Peoples Trib. 2016, 14, 53–55. (In Chinese) [Google Scholar]
  4. Jarrett, H. Environmental Quality in a Growing Economy. Baltim; The Johns Hopkins University Press: Baltimore, MD, USA, 1966. [Google Scholar]
  5. Lu, X.; Chen, X.P. A Review of Circular Economy. China Popul. Resour. Environ. 2014, 24, 204–208. [Google Scholar]
  6. Pearce, D.W.; Turner, R.K. Economics of Natural Resources and the Environment; JHU Press: Baltimore, MD, USA, 1990. [Google Scholar]
  7. Larissa, H.M.; Diego, C.P.; Frederico, C.J. Circular economy engagement: Altruism, status, and cultural orientation as drivers for sustainable consumption. Sustain. Prod. Consum. 2021, 27, 523–533. [Google Scholar]
  8. Pasquale, M.F. Tourism-Based Circular Economy in Salento (South Italy): A SWOT-ANP Analysis. Soc. Sci. 2019, 8, 216. [Google Scholar]
  9. Idiano, D.A.; Pasquale, M.F.; Donald, H. A circular economy model based on biomethane: What are the opportunities for the municipality of Rome and beyond? Renew. Energy 2021, 163, 1660–1672. [Google Scholar]
  10. Tuomo, J.; Harry, E.; Arto, S. Circular economy practices in the built environment. J. Clean. Prod. 2020, 276, 124215. [Google Scholar]
  11. Alcantara, V.; Roca, J. Energy and CO2 emissions in Spain: Methodology of analysis and some results for 1980–1990. Energy Econ. 1995, 17, 221–230. [Google Scholar] [CrossRef]
  12. Sun, J.W. The decrease of CO2 emission intensity is decarbonization at national and global levels. Energy Policy 2005, 33, 975–978. [Google Scholar] [CrossRef]
  13. Mielnik, O.; Goldemberg, J. Communication the evolution of the “Carbonization Index” in developing countries. Energy Policy 1999, 27, 307–308. [Google Scholar] [CrossRef]
  14. Ang, B.W. Is the energy intensity a less useful indicator than the carbon factor in the study of climate change? Energy Policy 1999, 27, 943–946. [Google Scholar] [CrossRef]
  15. Ramanathan, R. Combining indicators of energy consumption and CO2 emissions: A cross-country comparison. Int. J. Glob. Energy Issues 2002, 17, 214. [Google Scholar] [CrossRef]
  16. Zaim, O.; Taskin, F. Environmental efficiency in carbon dioxide emissions in the OECD: A non-parametric approach. J. Environ. Manag. 2000, 58, 95–107. [Google Scholar] [CrossRef]
  17. Zofio, J.L.; Prieto, A.M. Environmental efficiency and regulatory standard: The case of CO2 emissions form OECD industries. Resour. Energy Econ. 2001, 23, 63–83. [Google Scholar] [CrossRef]
  18. Zhou, P.; Ang, B.W.; Han, J.Y. Total factor carbon emission performance: A Malmquist index analysis. Energy Econ. 2010, 32, 194–201. [Google Scholar] [CrossRef]
  19. Bekun, F.V.; Emir, F.; Sarkodie, S.A. Another look at the relationship between energy consumption, carbon dioxide emissions, and economic growth in South Africa. Sci. Total Environ. 2019, 655, 759–765. [Google Scholar] [CrossRef] [PubMed]
  20. Liimatainen, H.; Arvidsson, N.; Hovi, I.B.; Jensen, T.C.; Nykänen, L. Road freight energy efficiency and CO2 emissions in the Nordic countries. Res. Transp. Bus. Manag. 2014, 12, 11–19. [Google Scholar] [CrossRef]
  21. Iftikhar, Y.; Wang, Z.; Zhang, B.; Wang, B. Energy and CO2 emissions efficiency of major economies: A network DEA approach. Energy 2018, 147, 197–207. [Google Scholar] [CrossRef]
  22. Herrala, R.; Goel, R.K. Global CO2 efficiency: Country-wise estimates using a stochastic cost frontier. Energy Policy 2012, 45, 762–770. [Google Scholar] [CrossRef]
  23. Mohiuddin, O.; Asumadu-Sarkodie, S.; Obaidullah, M.; Dubey, S. The relationship between carbon dioxide emissions, energy consumption, and GDP: A recent evidence from Pakistan. Cogent Eng. 2016, 3, 1210491. [Google Scholar] [CrossRef]
  24. Wang, K. Spatial Heterogeneity Analysis of the Impact of Different Types of Environmental Regulation on Carbon Productivity. Master’s Thesis, Harbin Normal University, Harbin, China, 2019. (In Chinese). [Google Scholar]
  25. Zhou, S.J. A Study on Spatial Effect of Regional Carbon Emission Intensity based on Dynamic SDM in China. J. Hunan Univ. Soc. Sci. 2020, 34, 40–48. (In Chinese) [Google Scholar]
  26. Qiao, J.; Wu, Q.L. Analysis on the Evolution and Driving Factors of China’s Carbon Emission Intensity. Econ. Probl. 2017, 8, 63–67, 110. (In Chinese) [Google Scholar]
  27. Yin, W.H.; Zhang, Y.X.; Li, J.F.; Xu, L.P.; Wang, B. Decomposition of carbon emission intensity in China’s eight regions according to CMRIO. Resour. Sci. 2017, 39, 2258–2264. (In Chinese) [Google Scholar]
  28. Xie, Z.X.; Qin, Y.C.; Shen, W.; Rong, P.J. Efficiency and Impact Factors of Low Carbon Economic Development in China. Econ. Geogr. 2017, 37, 1–9. (In Chinese) [Google Scholar]
  29. Guo, B.N.; Lin, J. Research on Efficiency of Carbon Emissions in Yangtze River Delta Based on the SBM-undesirable Model. J. Ind. Technol. Econ. 2017, 36, 108–115. (In Chinese) [Google Scholar]
  30. Li, J.; Ma, X.F.; Yuan, Q.M. Evaluation and influencing factors′ analysis of regional carbon emission efficiency. Acta Sci. Circumstantiae 2019, 39, 4293–4300. (In Chinese) [Google Scholar]
  31. Dong, F.; Liu, X.Y.; Long, R.Y.; Zhou, D.Q. Analysis of Carbon Emission Efficiency in China Based on Three-Stage DEA Model. Oper. Res. Manag. Sci. 2014, 23, 196–205. (In Chinese) [Google Scholar]
  32. Chen, X.H.; Yi, G.D.; Liu, X. Analysis of the Low Carbon Economy Efficiency in China: Based on a Method of Three Stage SBM-DEA Model with Undesirable Outputs. Oper. Res. Manag. Sci. 2017, 26, 115–122. (In Chinese) [Google Scholar]
  33. Yu, D.Y.; Zhang, X.H. Analysis of Carbon Emission Efficiency of Tianjin Based on Stochastic Frontier. Environ. Eng. 2016, 34, 152–154. (In Chinese) [Google Scholar]
  34. Wang, T.F. A Comparative Study of Carbon Emission Efficiency in Shandong Province Based on a Random Frontier Model. Master’s Thesis, Qingdao University, Qingdao, China, 2018. (In Chinese). [Google Scholar]
  35. Zhou, R.; Sun, H.; Zhang, Z.Q. Evaluation of Carbon Emission Efficiency for Fifteen Prefectures of Xinjiang Based on Stochastic Frontier Analysis. J. Xinjiang Univ. Nat. Sci. Ed. 2014, 31, 369–373. (In Chinese) [Google Scholar]
  36. Bastianoni, S.; Coscieme, L.; Pulselli, F.M. The input-state-output model and related indicators to investigate the relationships among environment, society and economy. Ecol. Model. 2016, 325, 84–88. [Google Scholar] [CrossRef]
  37. Tapia, G.; Jose, A.; Ionides, E.L. Population health and the economy: Mortality and the Great Recession in Europe. Health Econ. 2017, 26, 219–235. [Google Scholar]
  38. Yahoo, M.; Othman, J. Employing a CGE model in analysing the environmental and economy-wide impacts of CO2 emission abatement policies in Malaysia. Sci. Total Environ. 2017, 584, 234–243. [Google Scholar] [CrossRef]
  39. Grossman, G.M.; Krueger, A.B. Environmental Impacts of a North American Free Trade Agreement; Woking Paper No. 3914; National Bureau of Economic Research: Cambridge, MA, USA, 1991. [Google Scholar]
  40. Tucker, M. Carbon dioxide emissions and global GDP. Ecol. Econ. 1995, 15, 215–223. [Google Scholar] [CrossRef]
  41. Ramos, T.; Pires, S.M. Sustainability Assessment: The Role of Indicators. In Sustainability Assessment Tools in Higher Education Institutions, 1st ed.; Caeiro, S., Filho, W., Jabbour, C., Azeiteiro, U., Eds.; Springer International Publishing: Berlin, Germany, 2013; Volume 1, pp. 81–100. [Google Scholar]
  42. Ramanathan, R. A multi-factor efficiency perspective to the relationships among world GDP, energy consumption and carbon dioxide emissions. Technol. Forecast. Soc. Chang. 2006, 73, 483–494. [Google Scholar] [CrossRef]
  43. Bildirici, E.M.; Bakirtas, T. The relationship among oil and coal consumption, carbon dioxide emissions, and economic growth in BRICTS countries. J. Renew. Sustain. Energy 2016, 8, 1–15. [Google Scholar] [CrossRef]
  44. Wang, J.; Zhen, Q.Y. Growth and Carbon Dioxide Emissions—Taking the Yangtze Economic Belt as an Example. Financ. Econ. 2018, 4, 36–45. (In Chinese) [Google Scholar]
  45. Fan, D. Spatial measurement analysis of china’s CO2 EKC curve expansion model. Macroeconomics 2014, 5, 83–91. (In Chinese) [Google Scholar]
  46. Sun, Y.F.; Zhou, M. Decoupling and Driving Factors Analysis between the Energy Carbon Emissionsand Economic Growth in China. Rev. Econ. Manag. 2017, 33, 21–30. (In Chinese) [Google Scholar]
  47. Huang, Y.S.; Qu, J.S.; Liu, L.N. Research on the Differences of Carbon Footprint and Carbon Carrying Capacity Based on Provincial Level in China. Ecol. Econ. 2016, 32, 38–43. (In Chinese) [Google Scholar]
  48. Huang, X.H.; Wang, W.P.; Cai, B.Q. Evaluation of the coordinated development of China’s energy-economic-environmental system. Stat. Decis. 2015, 9, 68–70. (In Chinese) [Google Scholar]
  49. Cao, R.R.; Jiang, Z. An empirical study of the coordinated development of the energy-economy-environment (3E) system in Shanghai. Stat. Decis. 2015, 12, 134–136. (In Chinese) [Google Scholar]
  50. Liu, Q.; Zhou, W. An empirical study of the coordinated development of economic, energy and environmental systems in Guangdong Province. Econ. Forum 2014, 2, 19–24. (In Chinese) [Google Scholar]
  51. Gai, M.; Zhang, F.X. Regional Carbon Emissions, Economic Development and Environmental Protection Coupling in Liaoning Province. Sci. Geogr. Sin. 2018, 38, 764–772. (In Chinese) [Google Scholar]
  52. Xiang, T.D. China Regional Carbon Efficiency and Total Factor Productivity Research—Based on the Three-Phase DEA Model. Econ. Surv. 2017, 34, 20–25. (In Chinese) [Google Scholar]
  53. Wasti, S.K.A.; Zaidi, S.W. An empirical investigation between CO2 emission, energy consumption, trade liberalization and economic growth: A case of Kuwait. J. Build. Eng. 2019, 28, 101104. [Google Scholar] [CrossRef]
  54. Huang, Y. Study on the Relationship between Energy Consumption, Environmental Pollution and Economic Growth of Hu-Bao-E-Yu Urban Agglomeration. Master’s Thesis, lnner Mongolia University of Science and Technology, Baotou, China, 2020. (In Chinese). [Google Scholar]
  55. Li, Y. Nonlinear relationship between carbon emissions and economic growth—a threshold effect test based on inter-provincial panel data. China Bus. Trade 2020, 19, 8–10. (In Chinese) [Google Scholar]
  56. Hdom, H.A.D.; Fuinhas, J.A. Energy production and trade openness: Assessing economic growth, CO2 emissions and the applicability of the cointegration analysis. Energy Strategy Rev. 2020, 30, 100488. [Google Scholar] [CrossRef]
  57. Zhang, Y.L. Comparison of regional energy efficiency measurement and input redundancy in China. Coal Econ. Res. 2020, 40, 4–12. (In Chinese) [Google Scholar]
  58. Babu, S.S.; Datta, S.K. Revisiting the link between socio-economic development and environmental status indicators—focus on panel data. Environ. Dev. Sustain. 2015, 17, 567–586. [Google Scholar] [CrossRef]
  59. Lu, C.Y.; Zhu, W.L.; Li, H.J. Study on Comprehensive Measurement of Regional Sustainable Development in the Loess Plateau of East Gansu Province—A Case of Qingyang City. Res. Soil Water Conserv. 2015, 22, 210–217, 222. (In Chinese) [Google Scholar]
  60. Lu, J.; Chang, H.; Wang, Y.B. Dynamic evolution of provincial energy economy and environment coupling in China’s regions. China Popul. Resour. Environ. 2017, 27, 60–68. (In Chinese) [Google Scholar]
  61. Yang, H.R.; Yang, H.L. Research on the Coordinated Development of Energy-Economy-Environment (3E) System in Inner Mongolia. Int. J. Educ. Manag. 2020, 5, 284–288. [Google Scholar]
  62. Qiu, W. Cointegration Analysis on the Relationship of Agricultural Economic Development, Environmental Regulation and Agricultural Carbon Emission. J. Yan’an Univ. 2019, 41, 59–64. [Google Scholar]
  63. Yuan, C.G.; Liang, L.T.; Tang, L.H.; Chen, C.Y.; Ma, J.F. Land Economic Density Spatial Differences in Henan Industrial Cluster Area. Areal Res. Dev. 2019, 38, 25–29, 40. (In Chinese) [Google Scholar]
  64. Yu, X. Spatial Correlation Analysis of Economic Development in Liaoning Province. Master’s Thesis, Liaoning Normal University, Dalian, China, 2012. (In Chinese). [Google Scholar]
  65. Gao, C.C.; Zhu, H.F.; Xiao, H.L.; Sun, L.Q.; Xu, Y.F.; Pan, W.S. Dynamic Evolution of Spatial Difference of Regional Economy in Hunan Province Based on Spatial Statistical Analysis. Geomat. Spat. Inf. Technol. 2019, 42, 46–51. (In Chinese) [Google Scholar]
  66. Fang, L.; Wang, X.Y. Comprehensive Assessment and Temporal and Spatial Evolution of Agroeconomic System in Guanzhong Area. J. Financ. Econ. Theory 2019, 3, 60–67. (In Chinese) [Google Scholar]
  67. Shen, W. Analysis of Temporal-Spatial Patterns Evolution and Influence Factors of Urban Ecological Carrying Capacity in the Yangtze River Middle Reaches Urban Agglomeration. Master’s Thesis, Henan University, Kaifeng, China, 2018. (In Chinese). [Google Scholar]
  68. Qi, Y.J.; Yang, Y.; Jin, F.J. China’s economic development stage and its patio-temporal evolution: A prefectural-level analysis. Acta Geogr. Sin. 2013, 68, 517–531. (In Chinese) [Google Scholar]
  69. Zhang, H.J.; Zhao, W.F.; Zheng, Q. An Analysis of Spatial and Temporal Evolution of Regional Economic Disparity in Anhui Province Based on GeoDa. J. Hunan Univ. Technol. 2019, 33, 66–72. (In Chinese) [Google Scholar]
  70. Wang, S.J.; Gao, S.; Huang, Y.Y. Spatiotemporal evolution of urban carbon emission performance in China and prediction of future trends. J. Geogr. Sci. 2020, 30, 757–774. [Google Scholar] [CrossRef]
  71. Sun, W.; Huang, C.C. How does urbanization affect carbon emission efficiency? Evidence from China. J. Clean. Prod. 2020, 272, 122828. [Google Scholar] [CrossRef]
  72. Zhang, F.X. Regional Carbon Emissions, Economic Development and Environmental Protection Coupling in Liaoning Province; Liaoning Normal University: Dalian, China, 2018. [Google Scholar]
  73. Hu, B.; Wang, X.F. Research on the Relationship between Environmental Input, Economic Growth and Carbon Emission in China—Based on the Provincial Threshold Panel Model. Collect. Essays Financ. Econ. 2018, 233, 3–11. [Google Scholar]
  74. Su, J.; Hu, Z.Y.; Tang, L.W. The Geographic Distribution Characters and Dynamic Evolution for the Coordination Degree of Energy-Economic-Environmental (3E) in China. Econ. Geogr. 2013, 33, 19–30. [Google Scholar]
  75. Yan, Q.Y.; He, S.Q.; Liu, Z.Y. Empirical Research on Coordination Degree of 3E System of China. Adv. Mater. Res. 2012, 1792, 2533–2537. [Google Scholar] [CrossRef]
  76. Wang, F.; Fu, L.F.; Qin, Y.H. Spatial-temporal Difference Analysis and Trend Prediction of the Provincial Energy-Economy-Environment (3E) System Coordination Degree. J. Shanxi Univ. Financ. Econ. 2016, 6, 15–27. [Google Scholar]
  77. Luo, F.Z.; Zhang, N.N. Analysis on spatio-temporal coupling coordination of China’s inter-provincial energy use-economic development-environmental protection system. Environ. Pollut. Control. 2020, 42, 884–889. [Google Scholar]
  78. Su, H.W.; Pang, D.L. Geographical spatial distribution and dynamic evolution of coordination level of economy energy environment system in China. Inq. Into Econ. Issues 2017, 3, 1–9. [Google Scholar]
Figure 1. Technology Roadmap.
Applsci 11 01750 g001
Figure 2. A diagram of China’s coordination level in regard to carbon emissions, economic development, and environmental protection.
Applsci 11 01750 g002
Figure 3. China’s cold versus hot spot spatial evolution on coordination degree in regard to carbon emissions, economic development, and environmental protection.
Applsci 11 01750 g003
Table 1. The measurement index system of carbon emission efficiency.
Target LayerCriterion LayerIndex Layer
Carbon emission efficiencyInput variablesNumber of employees
Capital stock
The amount of energy consumption
Output variablesGDP
The amount of CO2 emissions
External environmental variablesEnergy consumption per ten thousand GDP
The total import and export volume accounting for the proportion of GDP
The added value of the secondary industry accounting for the proportion of GDP
The fiscal expenditure accounting for the proportion of GDP
Table 2. The assessment index system of the coordination degree in regard to carbon emissions, economic development, and environmental protection.
Target LayerCriterion LayerIndex Layer
Economic developmentEconomic scaleGDP per capita
The per capita disposable income of urban
residents
The per capita disposable income of rural
residents
The per capita investment in fixed assets
The per capita retail sales of consumer goods
Growth
potential
Engel coefficients of urban residents
The added value of the tertiary industry as a proportion of GDP
Fiscal expenditure per capita
Environmental
protection
Environmental pressureThe amount of wastewater discharge
The amount of exhaust emissions
The average temperature
The amount of solid waste discharge
Environmental managementWastewater discharge compliance rate
Comprehensive utilization rate of solid waste
Exhaust emission compliance rate
Environmental protection investment as a
proportion of GDP
Vegetation coverage
Carbon emissionsCurrent status of carbon
emissions
Carbon emissions per capita
Carbon productivity
Carbon emission intensity
Carbon emission density
Carbon emission efficiencyComprehensive efficiency
Pure technical efficiency
Scale efficiency
Table 3. The classification of the coordination degree.
TypeThe Coordination Degree TypeThe Coordination Degree
Extremely imbalanced
recession
[0, 0.1)Very low coordination
development
[0.5, 0.6)
Severely imbalanced
recession
[0.1, 0.2)Primitive coordination
development
[0.6, 0.7)
Intermediate imbalanced
recession
[0.2, 0.3)Intermediate coordination
development
[0.7, 0.8)
Mild imbalanced
recession
[0.3, 0.4)Good coordination
development
[0.8, 0.9)
Near imbalanced
recession
[0.4, 0.5)Excellent coordination
development
[0.9, 1]
Table 4. Carbon emission efficiency during China’s first and third stages (2009–2018 annual average values).
ProvinceThe First Stage DEA Measurement ResultsThe Third Stage DEA Measurement Results
Comprehensive Efficiency
(TE)
Pure Technical Efficiency
(PTE)
Scale Efficiency
(SE)
Comprehensive Efficiency
(TE)
Pure Technical Efficiency
(PTE)
Scale Efficiency
(SE)
Heilongjiang0.4590.5120.8980.4250.6910.617
Jilin0.4330.5100.8490.4530.8770.516
Liaoning0.4730.4890.9670.5030.7050.712
Inner Mongolia0.4390.4920.8940.4050.6780.597
Shaanxi0.4740.5180.9140.5030.8120.617
Ningxia0.3290.7460.4440.1610.6730.240
Gansu0.3510.4580.7660.3100.7410.419
Xinjiang0.4060.5150.7910.3120.6410.491
Qinghai0.3200.9640.3320.1530.8270.191
Sichuan0.5580.5760.9690.6080.7720.784
Chongqing0.5400.6100.8820.5110.8930.572
Guizhou0.4150.4900.8440.3560.6820.517
Yunnan0.3810.4280.8900.3750.6490.578
Guangxi0.4320.4750.9100.5030.8350.603
Anhui0.3920.4240.9250.4370.6780.645
Zhejiang0.7070.7570.9390.7590.9180.824
Fujian0.4890.5110.9590.5380.7540.715
Guangdong0.8700.9210.9450.9290.9510.976
Hainan0.5360.9440.5700.3030.9310.327
Beijing0.8210.8740.9350.6800.8730.768
Tianjin0.6370.7450.8570.4980.8750.570
Hebei0.4420.4500.9820.5030.6510.774
Shanxi0.4000.4540.8810.3490.5990.582
Shanghai0.7490.7840.9530.5620.7650.732
Jiangsu0.7260.7850.9300.8180.8760.930
Jiangxi0.5490.5990.9150.5670.9350.608
Shandong0.5330.5830.9180.6550.7140.916
Henan0.4280.4460.9620.5240.6410.816
Hubei0.5640.5850.9650.6490.8590.753
Hunan0.5710.5900.9680.6380.8420.754
Average0.5140.6080.8650.5000.7780.638
Table 5. The comprehensive carbon emission efficiency during China’s third stage (2009–2018).
Province2009201020112012201320142015201620172018Average
Heilongjiang0.4270.4050.4440.4370.4390.4330.4250.420.4150.4060.425
Jilin0.3680.3870.4220.4440.470.4820.4830.4970.4960.4770.453
Liaoning0.4240.4610.50.5160.5520.5650.5910.4510.4710.4980.503
Beijing0.470.5080.5320.560.6140.6460.7020.8390.92510.680
Tianjin0.4130.430.460.4720.4940.5050.5110.5470.5760.5740.498
Hebei0.4690.4810.5180.5110.5080.5120.4910.5050.5130.5240.503
Shandong0.5410.5660.60.6150.6620.6770.6820.7090.7420.7590.655
Shanghai0.4530.4850.5130.5220.5530.5780.5690.6130.6560.6820.562
Jiangsu0.6150.6710.7280.7520.7950.8320.8640.93110.818
Zhejiang0.590.6580.7120.7360.7530.7750.7820.8210.860.9010.759
Guangdong0.8340.9410.9640.9390.8830.8590.910.96210.929
Hainan0.2380.2580.2830.2910.3030.3020.2940.3340.3620.370.303
Fujian0.4710.5010.5210.5260.530.5320.5330.5560.5880.6250.538
Shanxi0.2870.3320.3670.3570.3460.3280.3330.3370.3950.4120.349
Inner Mongolia0.3640.3850.4210.4230.4420.4390.4160.410.3640.3850.405
Shaanxi0.3830.4310.4570.4930.5130.5230.4970.5280.5710.6320.503
Henan0.4590.4790.4980.4990.5180.5190.5190.5460.5870.6140.524
Hubei0.4820.5410.6420.6560.6870.6860.6460.6850.7150.7490.649
Hunan0.4980.5380.5890.5990.6080.6630.6740.7080.740.7650.638
Jiangxi0.4380.4920.5480.5520.5680.5720.5650.610.6360.6850.567
Anhui0.360.4060.4490.4390.440.4440.4450.4630.440.4860.437
Sichuan0.4750.5040.5550.5760.5990.6110.620.6610.7160.7660.608
Chongqing0.3710.390.4260.4510.4940.5120.5430.6030.6460.6740.511
Guizhou0.2550.2630.2840.3020.3380.3590.3850.4130.4680.4930.356
Yunnan0.3230.3130.3470.3580.3820.3840.3860.4010.4240.4310.375
Guangxi0.4450.460.4920.4930.5020.5090.5150.540.5240.5480.503
Ningxia0.1220.1380.150.1560.1620.1630.1630.1760.1830.1950.161
Gansu0.2630.2860.3170.3240.3330.330.3010.3060.3060.3280.31
Xinjiang0.2590.2880.3070.3130.3250.3260.3170.3110.3310.3460.312
Qinghai0.1080.130.1440.1510.1580.1590.1580.1760.1710.1750.153
Average0.407 0.438 0.474 0.483 0.501 0.508 0.508 0.534 0.559 0.583 0.500
Table 6. The coordination degree in regard to carbon emissions, economic development, and environmental protection.
Province2009201020112012201320142015201620172018Average
Heilongjiang0.6720.6750.6780.6860.7050.6890.6610.6680.6620.6620.676
Jilin0.6930.7040.7030.7200.7180.7330.7230.7210.7230.7090.715
Liaoning0.6770.7060.7080.7250.7350.7530.6850.6540.6390.6390.692
Inner Mongolia0.6810.6850.6890.6940.6910.6990.6640.6700.6650.6170.676
Shaanxi0.6520.6610.6640.6820.6690.6460.6310.6660.6790.6970.665
Ningxia0.6340.6450.6410.6440.6360.6450.6190.6330.6220.6360.635
Gansu0.6000.6180.6260.6260.6050.6030.5950.6290.5890.5850.607
Xinjiang0.5680.5940.5800.5900.5920.5940.5770.5830.5850.5690.583
Qinghai0.5780.5900.5950.6090.6170.6110.5880.6050.6140.6070.601
Sichuan0.5880.6020.5880.6090.6130.6200.6180.6540.6530.6740.622
Chongqing0.6730.6880.6830.6880.6830.6750.6950.6980.7150.7180.692
Guizhou0.5330.5520.5600.5760.5890.5510.5600.5980.6080.6220.575
Yunnan0.5470.5780.5820.5900.5890.5660.5730.6070.6140.6190.586
Guangxi0.6110.6460.6320.6400.6310.6230.6270.6380.6370.6500.634
Anhui0.5740.6080.5920.6000.5860.5470.5510.5910.5960.6170.586
Zhejiang0.7520.7570.7680.7740.7750.7780.7770.7830.7730.7700.771
Fujian0.6940.7100.7170.7460.7430.7430.7370.7440.7530.7470.733
Guangdong0.6970.7130.7100.7140.6870.6780.6840.7070.7120.7030.701
Hainan0.6120.6320.6320.6410.6500.6510.6470.6550.6710.6660.646
Beijing0.8530.8510.8490.8490.8540.8530.8680.8800.8950.9030.865
Tianjin0.7950.7890.7880.7870.7810.7860.7890.7910.7780.7770.786
Hebei0.6400.6480.6240.6250.6210.6140.5950.6060.5780.5830.613
Shanxi0.5730.5950.5830.5980.6050.6060.5800.5920.5720.5930.590
Shanghai0.7770.7770.7700.7660.7600.7660.7580.7680.7690.7630.767
Jiangsu0.7200.7300.7210.7380.7360.7390.7390.7320.7440.7300.733
Jiangxi0.6200.6440.6370.6420.6340.6180.6220.6580.6660.6700.641
Shandong0.6900.6990.6890.6890.6920.6880.6600.6620.6730.6670.681
Henan0.6340.6470.6350.6420.6360.6300.6160.6380.6360.6430.636
Hubei0.6500.6800.6680.6880.6930.7130.7040.7150.7150.7170.694
Hunan0.6390.6630.6650.6720.6750.6800.6780.6980.7100.7120.679
Average0.6540.6700.6660.6750.6730.6700.6610.6750.6750.6750.669
Table 7. Global Moran’s I Index of the coordination degree in regard to carbon emissions, economic development, and environmental protection.
YearMoran’s I Z ValueP Value
20090.4236326.0348980.000000
20100.4021815.7530210.000000
20110.3693655.3255450.000000
20120.3467115.0255790.000010
20130.3534625.0955330.000000
20140.3445814.9756840.000001
20150.3414904.9408820.000001
20160.3129484.5746580.000005
20170.2660983.9510920.000078
20180.2727294.0415450.000053
Publisher’s Note: MDPI stays neutral with regard to jurisdictional claims in published maps and institutional affiliations.

