Article

Imaging the Human Thyroid Using Three-Dimensional Diffuse Optical Tomography: A Preliminary Study

1
Preeminent Medical Photonics Education and Research Center, Hamamatsu University School of Medicine, 1-20-1 Handayama, Higashi-ku, Hamamatsu, Shizuoka 431-3192, Japan
2
Department of Medical Engineering, National Defense Medical College, 3-2 Namiki, Tokorozawa, Saitama 359-8513, Japan
3
Human Informatics Research Institute, National Institute of Advanced Industrial Science and Technology (AIST), 1-1-1 Higashi, Tsukuba, Ibaraki 305-8566, Japan
*
Author to whom correspondence should be addressed.
Appl. Sci. 2021, 11(4), 1670; https://doi.org/10.3390/app11041670
Submission received: 22 January 2021 / Revised: 4 February 2021 / Accepted: 8 February 2021 / Published: 12 February 2021
(This article belongs to the Special Issue Optical Biomedical Imaging)

Abstract

:

Featured Application

Diffuse optical tomography of the thyroid provides great promise for more accurate diagnosis of thyroid cancers.

Abstract

Thyroid cancer is usually diagnosed by ultrasound imaging and fine-needle aspiration biopsy. However, diagnosis of follicular thyroid carcinomas (FTC) is difficult because FTC lacks nuclear atypia and a consensus on histological interpretation. Diffuse optical tomography (DOT) offers the potential to diagnose FTC because it can measure tumor hypoxia, while image reconstruction of the thyroid is still challenging mainly due to the complex anatomical features of the neck. In this study, we attempted to solve this issue by creating a finite element model of the human neck excluding the trachea (a void region). By reconstruction of the absorption coefficients at three wavelengths, 3D tissue oxygen saturation maps of the human thyroid are obtained for the first time by DOT.

1. Introduction

The incidence of thyroid cancer has been increasing in many parts of the world over the past decades, although thyroid cancer remains among the less common cancers [1,2]. The etiology of the increasing incidence is not established. An analysis of data from the Surveillance Epidemiology and End Results (SEER) database has indicated that the increase is due to improved detection and not to a rise in occurrence [3]. However, the worldwide increase cannot be explained simply by noting earlier discovery [1], and there is increasing interest in the diagnosis and treatment of thyroid cancers.
There are four main types of thyroid cancer. Papillary thyroid carcinoma (PTC) and follicular thyroid carcinoma (FTC) are categorized among the differentiated thyroid cancers that are not usually aggressive. PTC is by far the most common form and is usually slow-growing, but it can mutate into more aggressive variants. Thyroid cancer is often diagnosed after nodules in the thyroid are discovered as a lump in the neck or by routine image examination, such as an ultrasound scan performed on the carotid arteries [4].
Other than FTC, which is more aggressive than PTC, thyroid cancers can be diagnosed by ultrasound scanning and fine-needle aspiration biopsies. Since FTC lacks the nuclear atypia seen in PTC and is encapsulated like a benign tumor (i.e., follicular adenoma), diagnosis of FTC is based on the histologic demonstration of capsular and/or vascular invasion after total thyroidectomy [5]. However, it is difficult to diagnose capsular invasion because of a lack of consensus on the histologic interpretation of findings: some argue that penetration into the tumor capsule by lesional cells is indicative of malignancy, while others argue that infiltration of tumor cells into the surrounding thyroid parenchyma through the entire thickness of the capsule is capsular invasion [5,6]. Thus, noninvasive and more sensitive diagnostic approaches to FTC would be helpful.
X-ray CT (computed tomography) and MRI (magnetic resonance imaging) are common diagnostic imaging techniques. Since, however, the ability to characterize thyroid nodules and detect small carcinomas is inferior to ultrasound scanning, X-ray CT and MRI are mainly used to evaluate extrathyroidal carcinoma extensions [7]. With 18FDG PET/CT (fluorine-18 fluorodeoxyglucose positron emission tomography/computed tomography) it is possible to detect solid tumors but not thyroid cancers, as there is uptake of 18FDG in chronic thyroiditis [8]. Thyroid cancer is accompanied by functional changes, including angiogenesis [9] and its related molecular responses [10,11], as well as structural changes. Optical imaging with near-infrared light, including photoacoustic imaging (PAI), diffuse optical spectroscopy (DOS), and diffuse optical tomography (DOT), can noninvasively evaluate hemodynamic and metabolic changes associated with thyroid cancer, and offers the potential for a diagnostic approach to FTC.
To date, PAI has been applied to the detection of angiogenesis in thyroid cancer. Yang et al. demonstrated that PAI detected small blood vessels that color Doppler flow imaging (CDFI) could not, whereas it has also been reported that acoustic reflection at large impedance-mismatched boundaries at the trachea caused artifacts in PAI images [12]. This approach could be useful in diagnosing PTC but not for FTC, because FTC is not accompanied by angiogenesis [9]. It has also been suggested that two members of the matrix metalloproteinase family (MMP-2, MMP-9) are biomarkers for FTC [10]. Using an MMP-activatable photoacoustic probe, Levi et al. demonstrated that molecular PAI offers great promise for the diagnosis of FTC, but clinical application appears difficult [13]. Lindner et al. employed custom time-resolved spectroscopy and a diffuse correlation spectroscopic system to the measurements of total hemoglobin (Hb) concentrations, tissue oxygen saturation (StO2), and blood flow indexes in the thyroid and also in muscles [14]. Several studies have suggested that hypoxia contributes to the progression of thyroid cancer, especially via the hypoxia-inducible factor-1α (HIF1-α) [11,15], and a lower StO2 has the potential to be an indicator of malignancy. However, with the DOS system of Lindner et al., it is difficult to measure the thyroid separately from muscles, while it would be possible with DOT.
Diffuse optical tomography is an imaging modality that reconstructs absorption (μa) and reduced scattering (μs’) coefficients from boundary measurements [16]. From the reconstructed μa, the Hb concentration and StO2 can be calculated. The μs’ reflects morphological and structural changes, such as cell swelling caused by cell injuries, whereas it is unlikely that μs’ is altered by capsular and/or vascular invasion by FTC. Cytochrome c oxidase (cyt. ox.) in mitochondria is also a biological chromophore that can be measured by DOT. The redox state of cyt. ox. is dependent on the intracellular oxygen concentration, and its reduction occurs under severe hypoxic conditions [17]. From this, it may be expected that DOT will be able detect FTC by measuring the StO2 and cyt. ox. in the thyroid.
To the best of our knowledge, DOT images of the human thyroid have not been reported, except for those in our simulation study [18]. This may be attributed to the fact that the human neck is a heterogeneous medium; it is composed of the trachea, the thyroid, the vertebrae, large blood vessels, muscles, adipose tissue, and others. The thyroid is located in a narrow region between the skin and trachea, and DOT image interpretation of the thyroid is not straightforward. In this study, we attempted to solve this issue by extracting the minimum volume of the human neck that is required for the image reconstruction, with the void region of the trachea excluded, and creating a finite element grid. In a clinical study, we conducted DOT measurements of a healthy human thyroid and reconstructed the spatial distribution of μa to create a 3-dimensional (3D) image of the whole of the thyroid. Then, using the μa values at three wavelengths, StO2 maps were created.

2. Subjects and Methods

2.1. Instrumentation

A multichannel time-domain measurement instrument (TRS-80, Hamamatsu Photonics K.K., Hamamatsu, Japan) was used to measure the human neck (Figure 1a). This instrument was developed from TRS-20SH, which has a single channel. See [19] for details of the TRS-20SH. Briefly, the TRS-80 consists of three pulsed laser diodes at wavelengths of 763, 801, and 836 nm (the pulse width is less than 100 ps for each wavelength) with a repetition rate of 5 MHz. All laser diodes are pigtailed and coupled into one optical fiber by the fiber coupler. The fiber is coupled to eight source fibers (core diameter 200 μm, NA (numerical aperture) = 0.25) via the optical switch (switching time, about 1 s), and the tip of each source fiber is attached to a measurement target (average power 200 μW). Transmitted light through the target is detected by eight fiber bundles (diameter 3 mm, NA = 0.29) and transferred to eight high-speed photomultiplier tubes (PMTs) (H7422P-50 SEL, Hamamatsu Photonics K.K., Japan) for single photon detection. The electrical output of a PMT is transmitted to the time correlated single photon counting (TCSPC) unit. It takes 1 s to obtain the time-of-flight (TOF) distribution of photons (time step size, 10 ps) in the time range from 0 to 10.24 ns for each wavelength. The TOF distributions with adequate signal-to-noise ratios (SNRs) are acquired by summation of signals for 10 s. The criterion of adequate SNR is that the maximum count of TOF distribution is greater than 2,000 and the dark count is less than 10. The average of the full width half maximum of the instrumental response function (IRF) is 390 ps. The TRS-80 is portable and available for use at the bedside. In this study, the measurement of the neck was conducted by a TRS-80 at the bedside while the subject lay on the bed.

2.2. Human Neck Measurements

The subject is a healthy woman who was informed of the aim and procedures of this study. This study was approved by the ethical committee of Hamamatsu University School of Medicine (No. 15-082). To confirm the tracheal and thyroid positions, a cervical MRI scan was performed (Discovery MR750, GE Healthcare, Waukesha, WI, USA). The MR images were also used to make an optical fiber holder in our laboratory. Since the same neck position must be reproduced in the DOT measurements, a vacuum cushion for radiotherapy was used for the MRI scan to fix the neck position.
The holder (Figure 1b,c) was made based on the 3D MR neck images by using 3D-computer-aided design (CAD) software (Fusion360, Autodesk, San Rafael, CA, USA) and a 3D printer (Agilista, Keyence, Osaka, Japan). Since the thyroid is a superficial organ and the minimum distance between the skin and the thyroid was about 1 cm in this subject, 1.5 cm was used as the shortest source–detector distance. A total of 15 holes in the holder were arranged at an interval of 1.5 cm and 7 source and 8 detector fibers were inserted into the holes alternately so that the whole thyroid was illuminated (Figure 1d). As a result, 56 datasets (7 × 8) were obtained. Each fiber was placed perpendicular to the skin surface. Optical fibers were fixed firmly to the holder by the screw cap on each hole of the holder. Moreover, the empty holes were filled with black polyoxymethylene (POM) cylinders. This fiber arrangement enables us to detect light passing through the thyroid and reduce influences of any strong absorption occurring in the internal jugular vein and the common carotid artery, which are far from the optical fibers. The black natural rubber (KSNR-10054T, HIKARI CO., LTD., Osaka, Japan) inside the holder (Figure 1c) is used to absorb light at the interface between air and the skin so that the Robin boundary condition is applied to numerical modeling of light propagation. In addition, it plays the role of a cushion between the rigid holder and the neck. The holder with the optical fibers was attached to the neck of the subject using the triumphal-arch shaped support. The subject was lying down on the vacuum cushion to be able to reproduce the neck position for the MRI scan.
Prior to the neck measurements, we measured the IRFs (Figure 2b–d) in all combinations of the source and detection fibers by using an 8ch IRF module, which enabled us to obtain eight IRFs for one source fiber simultaneously. The 8ch IRF module (7.6 (D) × 10 (W) × 10 (H) cm) has one source fiber port on one side and eight detection fiber ports on the other side (Figure 2a). A diffuser is placed inside each port. The detection fiber ports are arranged at regular intervals on the circumference of a circle (a diameter of 30 mm) of which center is opposite to the source fiber port. The space between the source fiber and the detection fibers is filled with air, and the distance between every source–detection pair is 7.5 cm.
Light was emitted from each source fiber about every 11 s, and light transmitted through the neck was detected at all the eight detection fibers simultaneously. The TRS-80 automatically adjusted the optical attenuators placed in front of each PMT. A total measurement time was about 120 s, including the switching time of the optical switch and the time for adjusting the attenuators. Forty-nine TOF distributions with an average photon counting rate of more than 115,000 count/s and a peak count over 3,000 counts were used for image reconstruction. Figure 2b–d show the TOF distribution at S2D2. The remaining seven TOF distributions measured at seven source–detector pairs (S2-D1, S2-D6, S3-D3, S3-D8, S5-D1, S5-D6, and S7-D6) were excluded from the image reconstruction because of insufficient SNR.

2.3. Grid Excluding the Trachea

The DOT images suffer from a void region if no care is taken for the grid used for the finite element method [20,21]. To create a grid excluding the void region of the trachea, we made use of MR neck images.
The MR neck image was processed with the open-source software platform for medical image processing (3D-Slicer, version 4.10.2) [22] to generate the 3D surface geometry of the neck. First, the T2-weighted MR image was saved as the DICOM standard, which contains multiple slices and all pixels of each of the slices related to the real position and scale. Then, 3D-Slicer loaded the MRI DICOM file and contours of the neck, shoulder, trachea, and thyroid were delineated by the Segment Editor module. Finally, the Segmentations module exported the 3D surface geometry of the various objects (Figure 3a) in a standard triangulated language (STL) file format at LPS (Left, Posterior, Superior) coordinates. In Figure 3a, the grid region (see below) is indicated in yellow. All STL files contain real-scale anatomical structures of the neck using the coordinates of the MR image.
Next, 3D-CAD imported the STL files and extracted the minimum volume that is required for the image reconstruction. Since the number of photons quickly decays when near-infrared light propagates in the neck, there is no need to make the grid using the entire volume. Here, light propagation around the thyroid was numerically studied, and this rapid decay was observed [23]. The upper and lower boundaries of the volume were set as horizontal sections 10 mm above the top row and 10 mm below the bottom row of the optical fibers, respectively. The sides of the volume were sagittal sections 10 mm away from the left and right columns of the optical fibers. The posterior limit was a plane that divided the void region approximately into halves. This grid is termed the trachea–tissue boundary grid. The processed surface geometry is shown in Figure 3b. As a comparison, we made another grid by disregarding the presence of the trachea. This grid is termed the homogeneous grid (Figure 3c).
As a last step, the processed STL files were imported into the Gmsh version 4.6.0 [24] to create 3D volume grids for use with the finite element method. The Gmsh generates a very nearly uniform volume of tetrahedral grids where nodes of the surface are not necessarily identical to the nodes from the STL file. The side length of a tetrahedron was about 1 mm. In this way, uniform grids of tetrahedrons were used for the DOT. The trachea–tissue boundary grid (Figure 3b) has 53,611 nodes and 264,526 elements, and the homogeneous grid (Figure 3c) has 57,433 nodes and 291,968 elements.

2.4. Image Reconstruction

2.4.1. Light Transport Model

The light transport model considered in this study is the time-dependent diffusion equation (TD-DE), which is the diffusion approximation of the radiative transport equation. The TD-DE form is
1 c t κ r + μ a r ϕ i r , t = 0 , r Ω , 0 < t < T ,
with the Robin boundary condition
ϕ i r , t + ζ c κ r ν ϕ i r , t = q i r , t , r Ω , 0 < t < T ,
which describes the change in the fluence rate φ at time t and position vector r within a domain Ω, bounded by a surface ∂Ω. Here, T is the maximum time, c = c0/n is the speed of light in the medium with refractive index n, and c0 is the speed of light in a vacuum. The refractive index of the neck is assumed to be 1.37; μa and μs are the absorption and reduced scattering coefficients, respectively; κ (r) = {3[μa (r)+ μs (r)]}−1 is the diffusion coefficient; ζ is for the refractive index mismatch parameter at the surface ∂Ω; qi (r, t) = δ (rri, t) is the ith isotropic source term at source position ri ∈ ∂Ω (i = 1, …, NS); the measured quantity is the flux Γi,j (t) at the detection position rj ∈ ∂Ω (j = 1, …, ND). The relation between φ and Γ is given by Fick’s law,
Γ i , j t = c κ r j ν r j ϕ i r j , t ,
where ν is the outer normal vector of ∂Ω at rj.
To solve the inverse problem in Section 2.4.3, we used the normalized first-order moment of the flux
g i , j = 0 T t Γ i , j t d t 0 T Γ i , j t d t ,
To remove unknown constants in the measured TOF distribution (T = 10.24 ns). It takes a great deal of computational time to solve Equation (1), and, as a result, we obtained gi,j by the solution of the time-independent diffusion equation [25].

2.4.2. Finite Element Method

To find the optimum solution of the time-independent diffusion equation, we used the finite element method (FEM). With φh (r, t) as the solution to Equation (1),
ϕ i r , t ϕ i h r , t   =   k = 1 N N Φ k , i t u k r ,
where uk (r) (k = 1, …, NN) is the basis function and NN is the number of nodes in the grid. We introduced a vector Φi (t) = (…, Φk,i (t), …)T of nodal coefficients, and to discretize the zeroth-order and the first-order moments of TD-DE (Equation (1)), we used a Galerkin approach [25]. The forms are
ζ c A + K κ + C μ a E i = q i ,
ζ c A + K κ + C μ a M i = B E i ,
where
E i = 0 Φ i t d t ,
M i = 0 t Φ i t d t .
The individual integrals are given by
A i , j = Ω u i r u j r d r , K i , j κ = Ω κ r u i r u j r d r , C i , j μ a = Ω μ a r u i r u j r d r , q i = Ω u i r δ r r i d r , B i , j = 1 c Ω u i r u j r d r .
The flux is expressed as
Γ i , j t = k = 1 N N P k , j Φ i , k t ,
where
P k , j = c κ r j χ k r j ν r j u k r j .
Here, χk (rj) = 1 when the element τk belongs to rj ∈ ∂Ω and χk = 0 otherwise. Then, Equation (4) is expressed as
g i , j g i , j h = P j M i P j E i ,
where Pj = (…, Pk,j, …)T.

2.4.3. Inverse Problem
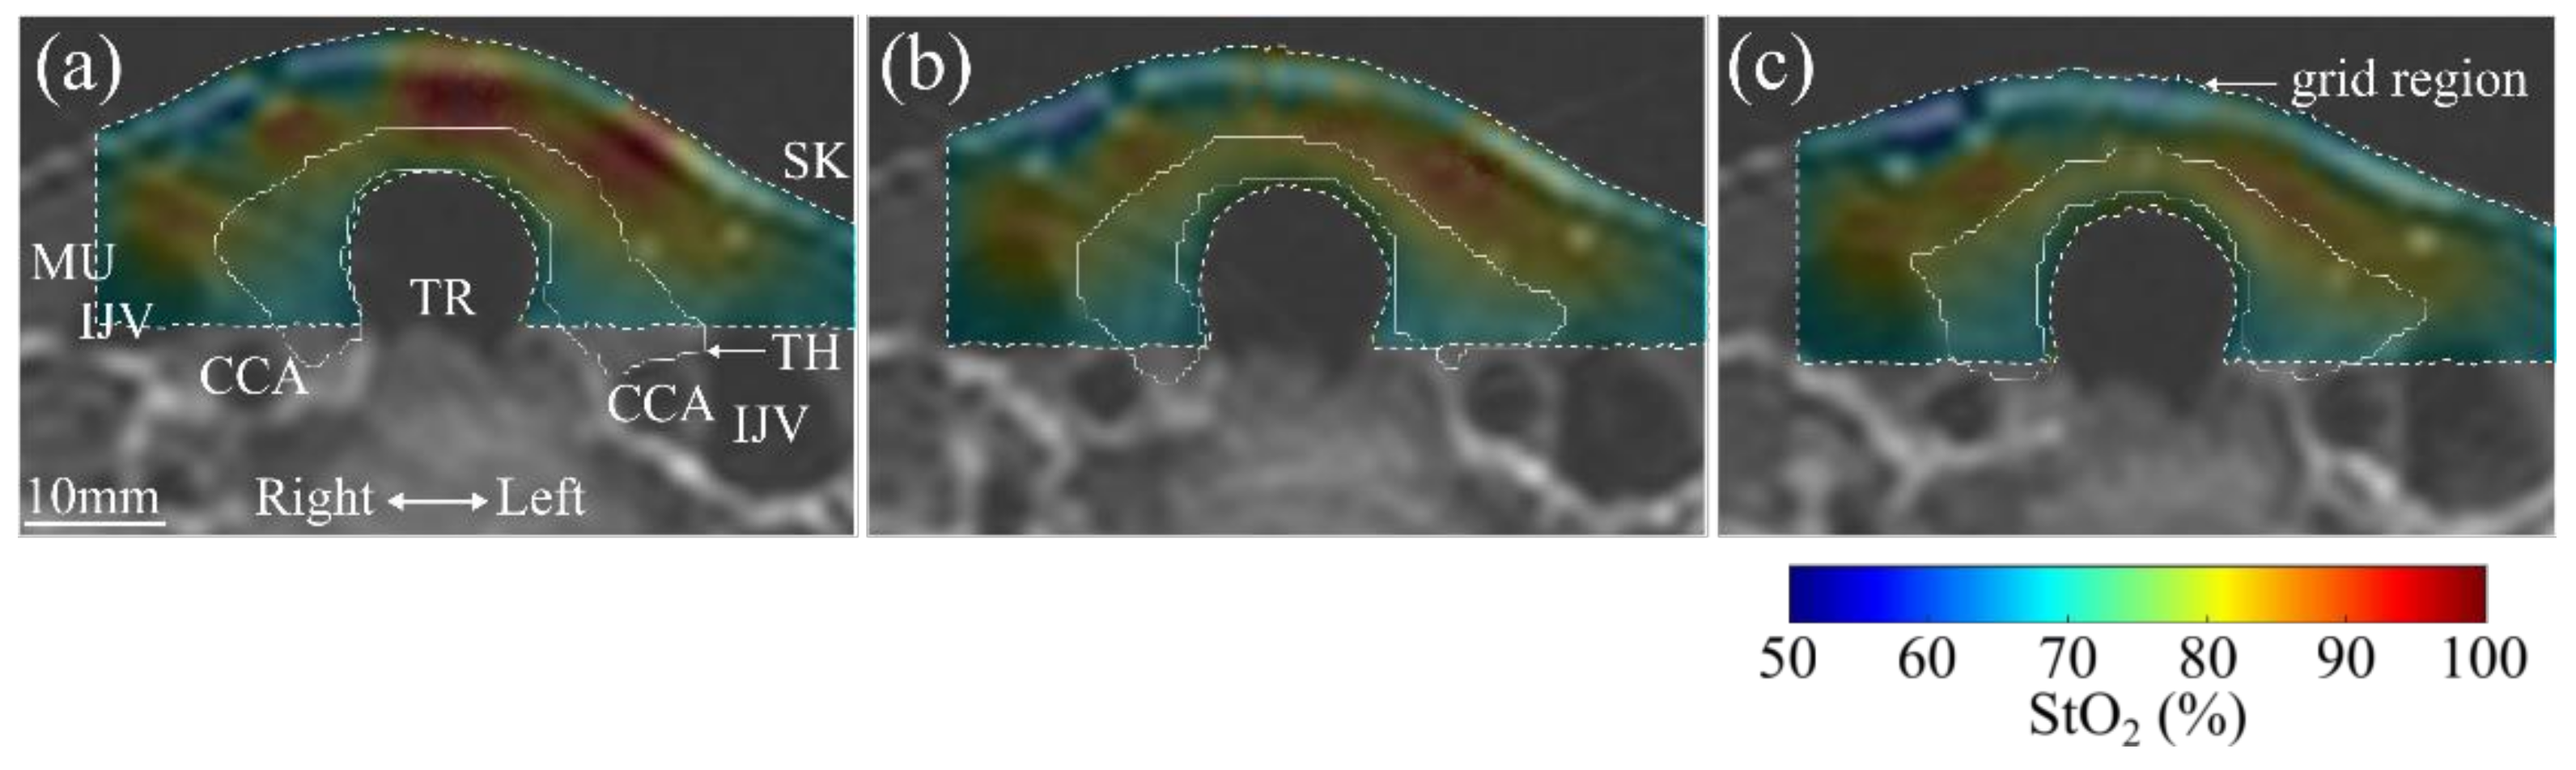
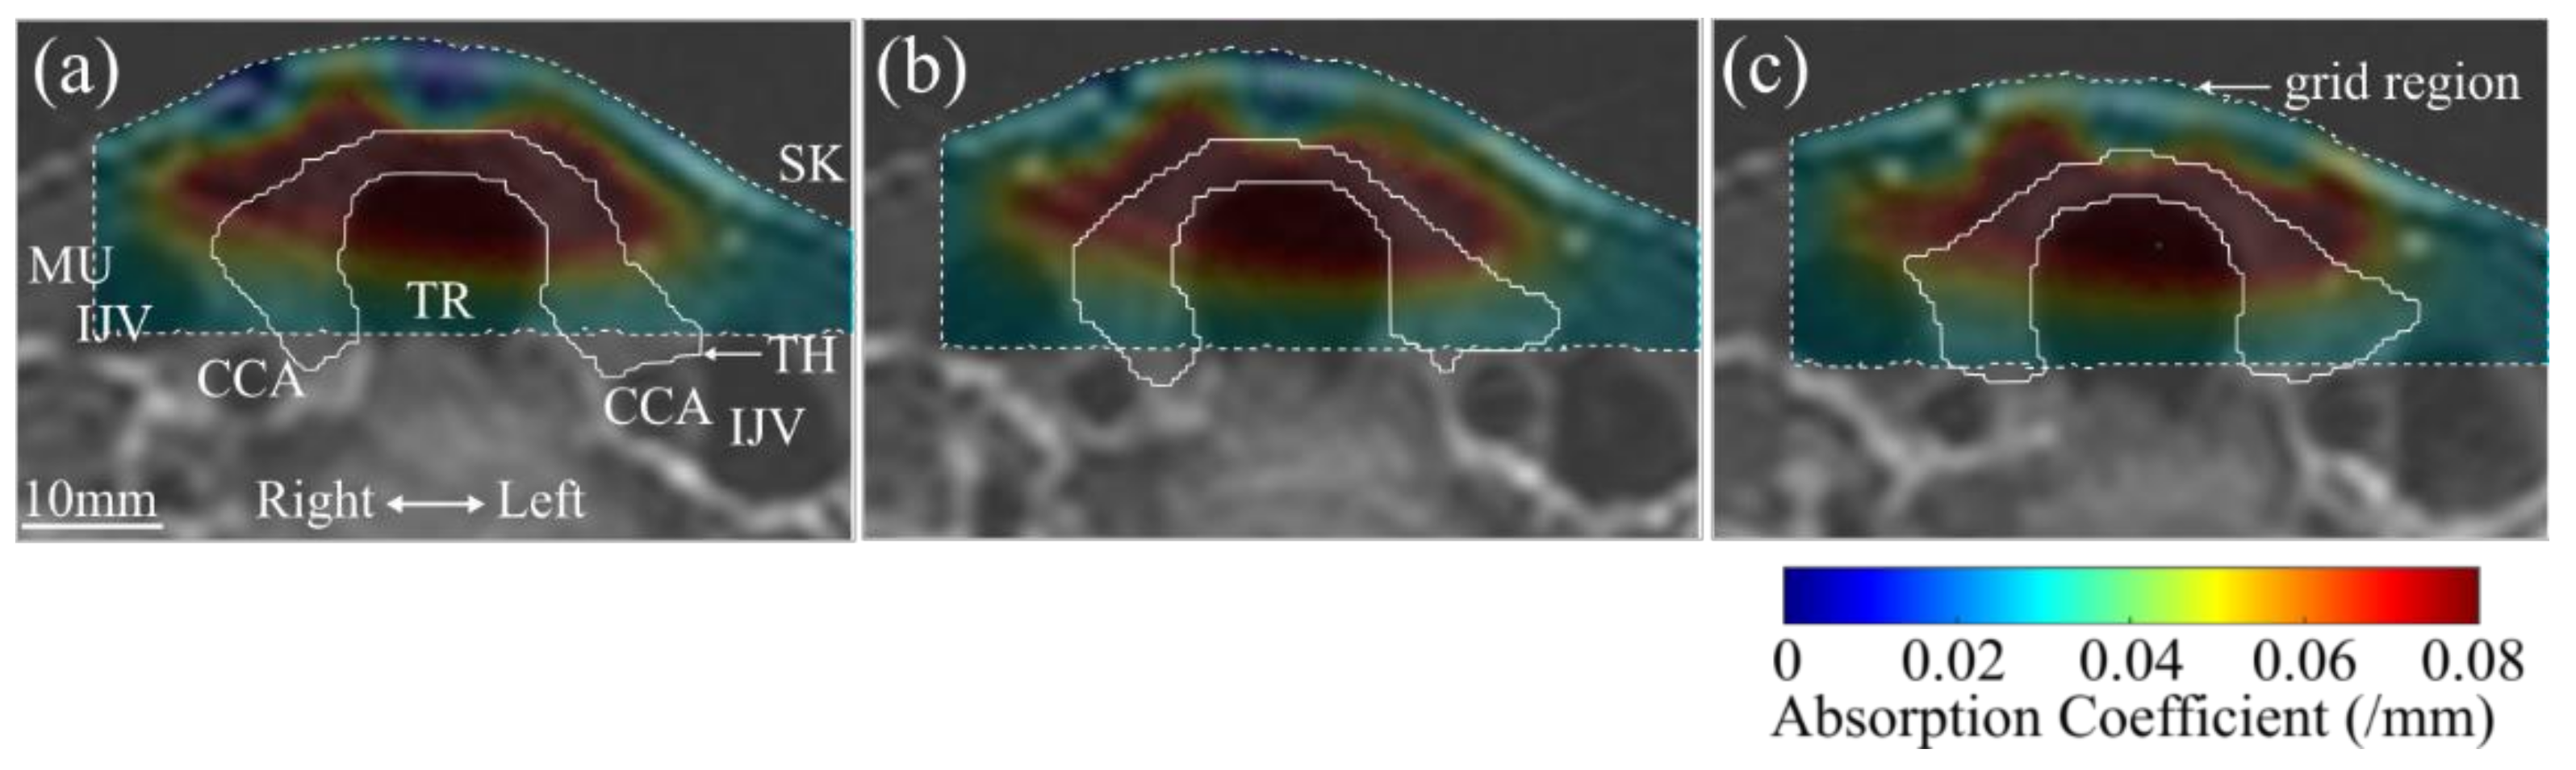
We solved the inverse problem by minimizing the objective function given by
ψ μ a = 1 2 i = 1 N S j = 1 N D H i , j y i , j f i , j μ a , κ 2 + τ k = 1 N R μ a , k μ a 0 , k 2 ,
which is the least square method for the measured result yi,j and the calculated result fi,j; NS and ND are the numbers of the sources and detection fibers used in measurements, respectively; Hi,j = 1 except for seven source–detection combinations that were excluded due to insufficient SNR. For the excluded pairs (i, j) = (2, 1), (2, 6), (3, 3), (3, 8), (5, 1), (5, 6), and (7, 6), Hij = 0. We used Tikhonov regularization, and τ is the hyper parameter; NR is the number of points of the reconstructed grid used to solve the inverse problem. The grid consists of rectangular voxels converted from the FEM grid, and one voxel size is 1.6 (L) × 1.9 (W) × 2.5 mm (H). The value of NR is 8,014 in the trachea–tissue boundary grid (Figure 3b), and NR is 8,992 in the homogeneous grid (Figure 3c); μa0 is the initial absorption coefficient at the start of the reconstruction.
The measured TOF distribution, Yi,j(t), contains unknown constants from the measurement setup. To remove these constants, we used the normalized first-order moment, yi,j, as the measured result. The form is
y i , j = 0 T t Y i , j t d t 0 T Y i , j t d t ,
and the calculated result fi,j corresponding to yi,j can be computed as
f i , j μ a , κ = 0 T t D i , j t d t 0 T D i , j t d t + 0 T t Γ i , j μ a , κ , t d t 0 T Γ i , j μ a , κ , t d t ,
where Di,j (t) is IRF.
To minimize Equation (14), we used the nonlinear conjugate gradient method with the Polak–Ribière method [26,27], which is implemented in TOAST++ [28]. The gradient of the objective function was obtained with the adjoint method; μa = 0.027/mm and μs’ = 0.95/mm were employed as the initial values for all the three wavelengths (763, 801, and 836 nm), which were taken from [14]. During the iteration process, the μs’ value was fixed.
The thyroid is a richly vascular organ and consists of a large number of thyroid follicles of which walls are made up of a large number of cells, mainly follicular cells. Follicles are filled with colloid (thyroglobulin). Thyroglobulin contributes to the absorption coefficients in the three wavelengths used in this study [29]. Since, however, it is difficult to estimate its contributions quantitatively, treating thyroglobulin as water, it is assumed that Hb and water are the main chromophores of the thyroid. Wavelengths of 763, 801, and 836 nm are commonly used to measure tissue Hb, and taking account of the water contribution to μa at each wavelength, Hb concentrations are calculated. The molar absorption coefficients of oxygenated Hb (oxy-Hb) and deoxygenated Hb (deoxy-Hb) were taken from [30] and the absorption coefficient of water was taken from [31]. Based on the assumption that the water concentration was 78% [32], the value of StO2 (oxy-Hb/(oxy-Hb+deoxy-Hb)) was calculated.

3. Results

Figure 4 shows horizontal sections of DOT images of μa at 801 nm, which is an isosbestic point for oxy-Hb and deoxy-Hb, at the 15th iteration by the trachea–tissue boundary grid (Figure 3b) at different slices. The DOT images are shown on the T2-weighted MR images. Figure 4b shows the section at the middle of the isthmus of the thyroid. Figure 4a,c are sections 3 mm above and below the middle of the isthmus of the thyroid. The trachea–tissue boundary grid region is shown in Figure 4c (dashed white line). The color bar shows the reconstructed μa values. In Figure 4a–c, the outline of the thyroid is denoted by white lines. The shape of the thyroid, where the μa values are about 0.075/mm, is reconstructed in the DOT images, while the position of the reconstructed thyroid shifts slightly towards the skin. The μa values of the background tissue (muscles) were about 0.02/mm. Although the right internal jugular vein (IJV) was included in the grid, it was not reconstructed in the image because the optical fibers were arranged far from the IJV. In fact, the μa values in the IJV were not updated and the initial ones remained (0.027/mm) during the iteration process.
Figure 5 shows tomographic images of StO2 calculated from the μa values at the three wavelengths. High StO2 (around 90%) regions were observed, which corresponded approximately to the reconstructed thyroid regions in Figure 4. The StO2 in the background tissues, mainly muscles, was around 65%. Although the μa values at the isthmus of the thyroid were much smaller than those in the bilateral lobes, the StO2 distribution was relatively homogeneous, and StO2 of the thyroid was 82% to 92%. As a result, the isthmus of the thyroid was more clearly imaged compared to that in Figure 4.
Figure 6 shows horizontal sections of DOT images of μa at 801 nm at the 35th iteration by the homogeneous grid (Figure 3c). Although the existence of the thyroid may be read from these reconstructed images, the shape of the thyroid is not correctly reconstructed.

4. Discussion

This is the first study reporting the reconstruction of the spatial distribution of μa and StO2 in the whole human thyroid with DOT. The neck is composed of various organs, and the refractive index inside the neck is heterogeneous. Notably, between the tissue and the trachea, there is a strong refractive index mismatch. To date, whether the thyroid can be imaged accurately by DOT has been regarded as a seriously nontrivial question, but in this paper, we have shown that the whole shape of the thyroid can be reconstructed if the grid for the calculations excludes the trachea void region. However, the reentrance of light, which propagates through the trachea, was not taken into account in the present study. It is expected that reconstructed images will be improved if the reentrant light is taken into account [23].
In this paper, the thyroid was reconstructed at a position closer to the skin than its actual position. This can be understood from the structure of the objective function used in our numerical reconstruction. Since the diffuse fluence of near-infrared light decays exponentially with increased depth in biological tissue, measurement sensitivity decreases along the depth direction. Spatially variant regularization has been proposed to compensate for this [33,34]. However, we did not employ depth-dependent regularization, which is one reason why the position of the reconstructed thyroid shifted slightly towards the skin.
The obtained μa values in the present study were much larger than the published values that have been obtained with time-domain measurements. In a study preceding this, the μa values were estimated by fitting the TOF distribution derived from the analytical solution of the DE for a semi-infinite homogeneous medium to the measured TOF distribution [14]. However, it cannot be assumed that the human neck is homogeneous, and as the thyroid is covered by muscles, it is likely that the published μa values should be partly attributed to the μa of muscle tissue. Here, the present study indicates the possibility of selectively measuring the μa of the thyroid, and the μa values in the present paper may also be assumed to deviate from the true situation to some extent, because the reduced scattering coefficient was not updated during the iterations of the nonlinear conjugate gradient method. An accurate quantification of μa requires the simultaneous reconstruction of both μa and μs’ [35], which are subjected to artifacts caused by cross-talk between the two parameters. To suppress cross-talk artifacts, the use of multiple datasets for the objective functions, such as a combination of skew and Laplace transform of the TOF distribution (Equation (3)), has been proposed [36].
The present DOT is still insufficient for the quantitative measurement of optical properties and Hb concentrations; however, the map of StO2 (Figure 5) indicates that the thyroid is distinguishable from the background tissue (muscles): the StO2 of the thyroid was around 90%, while that of the muscles was around 65%. A high StO2 is the more favorable option for detecting cancer hypoxia, because the difference in StO2 between normal and cancerous tissue is thought to be larger than that when the StO2 of the thyroid is lower. Cytochrome c oxidase is a more sensitive indicator of cell hypoxia than StO2 [17]. However, TRS-80 with three wavelengths cannot measure the redox state of cyt. ox., and an instrument with four or more wavelengths is required.
Regarding treatment of thyroid diseases, it is important that the shape and size of the thyroid are tracked over time, which can be conducted with ultrasound scanning. Hence, several 2D segmentation algorithms for thyroid ultrasound images have been developed, and 3D segmentation is now possible [37,38]. Three-dimensional visualizations of the thyroid are also crucial for surgical intervention [39]. Recent advances in segmentation and image processing techniques have enabled 3D thyroid reconstruction from 2D ultrasound slices [40,41].
The present study has the three main limitations described above, but it has still paved the way for functional optical imaging of the human thyroid. The combination of DOT with ultrasound scanning will be complementary in the course of diagnosis and treatment of thyroid cancers.

5. Conclusions

This paper presents 3D absorption and StO2 images of an in vivo human thyroid by DOT. The key factor is the use of a trachea–tissue boundary grid. This study has shown that DOT can be used to selectively reconstruct the thyroid, and a natural next step will be to estimate the value of the absorption coefficient by the simultaneous reconstruction of μa and μs’. This would make DOT available for use in thyroid cancer diagnosis. It can be expected that DOT will have the potential to visualize the tissue hypoxia of thyroid cancer.

Author Contributions

Conceptualization, Y.H.; methodology, Y.H., T.M., H.K., Y.T., S.O.; data analysis, T.M., S.O.; investigation, Y.H., T.M., H.K., Y.T.; writing—original draft preparation, T.M.; writing—review and editing, Y.H., T.M.; funding acquisition, Y.H., T.M. All authors have read and agreed to the published version of the manuscript.

Funding

This research was funded by Japan Agency for Medical Research and Development (AMED) (16im0402003h0006), Hamamatsu University School of Medicine (HUSM) Grant-in-Aid and the Uehara Memorial Foundation Grant-in Aid.

Institutional Review Board Statement

The study was conducted according to the guidelines of the Declaration of Helsinki and approved by the ethical committee of Hamamatsu University School of Medicine (No. 15-082).

Informed Consent Statement

Informed consent was obtained from all subjects involved in the study.

Data Availability Statement

All data are available in the public domain.

Conflicts of Interest

The authors declare no conflict of interest.

References

  1. Wartofsky, L. Increasing world incidence of thyroid cancer: Increased detection or higher radiation exposure? Hormones 2010, 9, 103–108. [Google Scholar] [CrossRef] [PubMed] [Green Version]
  2. Deng, Y.J.; Li, H.T.; Wang, M.; Li, N.; Tian, T.; Wu, Y.; Xu, P.; Yang, S.; Zhai, Z.; Zhou, L.H.; et al. Global burden of thyroid cancer from 1990 to 2017. JAMA Netw. Open 2020, 3, e208759. [Google Scholar] [CrossRef] [PubMed]
  3. Davies, L.; Welch, H.G. Increasing incidence of thyroid cancer in the United States, 1973-2002. JAMA 2006, 295, 2164–2167. [Google Scholar] [CrossRef] [Green Version]
  4. Shah, J.P. Thyroid carcinoma: Epidemiology, histology, and diagnosis. Clin. Adv. Hematol. Oncol. 2015, 13, 3–6. [Google Scholar] [PubMed]
  5. Baloch, Z.W.; LiVolsi, V.A. Follicular-patterned lesions of the thyroid: The bane of the pathologist. Am. J. Clin. Pathol. 2002, 117, 143–150. [Google Scholar] [CrossRef] [Green Version]
  6. Cipriani, N.A.; Nagar, S.; Kaplan, S.P.; White, M.G.; Antic, T.; Sadow, P.M.; Aschebrook-Kilfoy, B.; Angelos, P.; Kaplan, E.L.; Grogan, R.H. Follicular thyroid carcinoma: How have histologic diagnoses changed in the last half-century and what are the prognostic implications? Thyroid 2015, 25, 1209–1216. [Google Scholar] [CrossRef] [PubMed] [Green Version]
  7. King, A.D. Imaging for staging and management of thyroid cancer. Cancer Imaging 2008, 8, 57–69. [Google Scholar] [CrossRef] [Green Version]
  8. Marcus, C.; Whitworth, P.W.; Surasi, D.S.; Pai, S.I.; Subramaniam, R.M. PET/CT in the management of thyroid cancers. Am. J. Roentgenol. 2014, 202, 1316–1329. [Google Scholar] [CrossRef] [Green Version]
  9. Sprindzuk, M.V. Angiogenesis in malignant thyroid tumors. World J. Oncol. 2010, 1, 221–231. [Google Scholar] [CrossRef] [PubMed] [Green Version]
  10. Cho Mar, K.; Eimoto, T.; Tateyama, H.; Arai, Y.; Fujiyoshi, Y.; Hamaguchi, M. Expression of matrix metalloproteinases in benign and malignant follicular thyroid lesions. Histopathology 2006, 48, 286–294. [Google Scholar] [CrossRef]
  11. Burrows, N.; Resch, J.; Cowen, R.L.; Von Wasielewski, R.; Hoang-Vu, C.; West, C.M.; Williams, K.J.; Brabant, G. Expression of hypoxia-inducible factor 1α in thyroid carcinomas. Endocr. Relat. Cancer 2010, 17, 61–72. [Google Scholar] [CrossRef]
  12. Yang, M.; Zhao, L.; He, X.; Su, N.; Zhao, C.; Tang, H.; Hong, T.; Li, W.; Yang, F.; Lin, L.; et al. Photoacoustic/ultrasound dual imaging of human thyroid cancers: An initial clinical study. Biomed. Opt. Express 2017, 8, 3449–3457. [Google Scholar] [CrossRef] [Green Version]
  13. Levi, J.; Kothapalli, S.R.; Bohndiek, S.; Yoon, J.K.; Dragulescu-Andrasi, A.; Nielsen, C.; Tisma, A.; Bodapati, S.; Gowrishankar, G.; Yan, X.; et al. Molecular photoacoustic imaging of follicular thyroid carcinoma. Clin. Cancer Res. 2013, 19, 1494–1502. [Google Scholar] [CrossRef] [Green Version]
  14. Lindner, C.; Mora, M.; Farzam, P.; Squarcia, M.; Johansson, J.; Weigel, U.M.; Halperin, I.; Hanzu, F.A.; Durduran, T. Diffuse optical characterization of the healthy human thyroid tissue and two pathological case studies. PLoS ONE 2016, 11, e0147851. [Google Scholar] [CrossRef] [PubMed]
  15. Mahkamova, K.; Latar, N.; Aspinall, S.; Meeson, A. Hypoxia increases thyroid cancer stem cell-enriched side population. World J. Surg. 2018, 42, 350–357. [Google Scholar] [CrossRef] [Green Version]
  16. Arridge, S.R. Optical tomography in medical imaging. Inverse Probl. 1999, 15, R41–R93. [Google Scholar] [CrossRef] [Green Version]
  17. Hoshi, Y.; Hazeki, O.; Kakihana, Y.; Tamura, M. Redox behavior of cytochrome oxidase in the rat brain measured by near- infrared spectroscopy. J. Appl. Physiol. 1997, 83, 1842–1848. [Google Scholar] [CrossRef] [PubMed]
  18. Hoshi, Y.; Yamada, Y. Overview of diffuse optical tomography and its clinical applications. J. Biomed. Opt. 2016, 21, 091312. [Google Scholar] [CrossRef] [Green Version]
  19. Yoshizawa, N.; Ueda, Y.; Mimura, T.; Ohmae, E.; Yoshimoto, K.; Wada, H.; Ogura, H.; Sakahara, H. Factors affecting measurement of optic parameters by time-resolved near-infrared spectroscopy in breast cancer. J. Biomed. Opt. 2018, 23, 026010. [Google Scholar]
  20. Dehghani, H.; Arridge, S.R.; Schweiger, M.; Delpy, D.T. Optical tomography in the presence of void regions. J. Opt. Soc. Am. A Opt. Image Sci. Vis. 2000, 17, 1659–1670. [Google Scholar] [CrossRef] [PubMed] [Green Version]
  21. Riley, J.; Dehghani, H.; Schweiger, M.; Arridge, S.R.; Ripoll, J.; Nieto-Vesperinas, M. 3D optical tomography in the presence of void regions. Opt. Express 2000, 7, 462–467. [Google Scholar] [CrossRef]
  22. Fedorov, A.; Beichel, R.; Kalpathy-Cramer, J.; Finet, J.; Fillion-Robin, J.C.; Pujol, S.; Bauer, C.; Jennings, D.; Fennessy, F.; Sonka, M.; et al. 3D slicer as an image computing platform for the quantitative imaging network. Magn. Reson. Imaging 2012, 30, 1323–1341. [Google Scholar] [CrossRef] [Green Version]
  23. Fujii, H.; Yamada, Y.; Kobayashi, K.; Watanabe, M.; Hoshi, Y. Modeling of light propagation in the human neck for diagnoses of thyroid cancers by diffuse optical tomography. Int. J. Numer. Methods Biomed. Eng. 2017, 33, e2826. [Google Scholar] [CrossRef] [Green Version]
  24. Geuzaine, C.; Remacle, J.F. Gmsh: A 3-D finite element mesh generator with built-in pre- and post-processing facilities. Int. J. Numer. Methods Eng. 2009, 79, 1309–1331. [Google Scholar] [CrossRef]
  25. Arridge, S.R.; Schweiger, M. Direct calculation of the moments of the distribution of photon time of flight in tissue with a finite-element method. Appl. Opt. 1995, 34, 2683–2687. [Google Scholar] [CrossRef] [Green Version]
  26. Jorge, N.; Wright, S. Numerical Optimization, 2nd ed.; Springer: New York, NY, USA, 2006; pp. 121–124. [Google Scholar]
  27. Arridge, S.R.; Schweiger, M. A gradient-based optimisation scheme for optical tomography. Opt. Express 1998, 2, 213–226. [Google Scholar] [CrossRef] [PubMed]
  28. Schweiger, M.; Arridge, S.R. The Toast++ software suite for forward and inverse modeling in optical tomography. J. Biomed. Opt. 2014, 19, 040801. [Google Scholar] [CrossRef] [PubMed] [Green Version]
  29. Konugolu Venkata Sekar, S.; Farina, A.; Dalla Mora, A.; Lindner, C.; Pagliazzi, M.; Mora, M.; Aranda, G.; Dehghani, H.; Durduran, T.; Taroni, P.; et al. Broadband (550-1350 nm) diffuse optical characterization of thyroid chromophores. Sci. Rep. 2018, 8, 10015. [Google Scholar] [CrossRef] [Green Version]
  30. Matcher, S.J.; Elwell, C.E.; Cooper, C.E.; Cope, M.; Delpy, D.T. Performance comparison of several published tissue near-infrared spectroscopy algorithms. Anal. Biochem. 1995, 227, 54–68. [Google Scholar] [CrossRef]
  31. Kou, L.; Labrie, D.; Chylek, P. Refractive indices of water and ice in the 065- to 25-μm spectral range. Appl. Opt. 1993, 32, 3531–3540. [Google Scholar] [CrossRef] [PubMed] [Green Version]
  32. White, D.R.; Woodard, H.Q.; Hammond, S.M. Average soft-tissue and bone models for use in radiation dosimetry. Br. J. Radiol. 1987, 60, 907–913. [Google Scholar] [CrossRef]
  33. Pogue, B.W.; McBride, T.O.; Prewitt, J.; Österberg, U.L.; Paulsen, K.D. Spatially variant regularization improves diffuse optical tomography. Appl. Opt. 1999, 38, 2950–2961. [Google Scholar] [CrossRef] [PubMed]
  34. Culver, J.P.; Durduran, T.; Furuya, D.; Cheung, C.; Greenberg, J.H.; Yodh, A.G. Diffuse optical tomography of cerebral blood flow, oxygenation, and metabolism in rat during focal ischemia. J. Cereb. Blood Flow Metab. 2003, 23, 911–924. [Google Scholar] [CrossRef] [Green Version]
  35. Gao, F.; Poulet, P.; Yamada, Y. Simultaneous mapping of absorption and scattering coefficients from a three-dimensional model of time-resolved optical tomography. Appl. Opt. 2000, 39, 5898–5910. [Google Scholar] [CrossRef] [PubMed]
  36. Schweiger, M.; Arridge, S.R. Application of temporal filters to time resolved data in optical tomography. Phys. Med. Biol. 1999, 44, 1699–1717. [Google Scholar] [CrossRef]
  37. Poudel, P.; Hansen, C.; Sprung, J.; Friebe, M. 3D segmentation of thyroid ultrasound images using active contours. Curr. Dir. Biomed. Eng. 2016, 2, 467–470. [Google Scholar] [CrossRef]
  38. Poudel, P.; Illanes, A.; Sheet, D.; Friebe, M. Evaluation of commonly used algorithms for thyroid ultrasound images segmentation and improvement using machine learning approaches. J. Healthc. Eng. 2018, 2018, 1–13. [Google Scholar] [CrossRef]
  39. Bernhard, P.; Jana, D.; Lars, D.; Andreas, B. Clinical Impact of the Tumor Therapy Manager. In Proceedings of the VisWeek 2010, Salt Lake City, UT, USA, 24–29 October 2010; IEEE: New York, NY, USA, 2010. [Google Scholar]
  40. Thiering, B.; Nagarajah, J.; Lipinski, H.G. Spatial Reconstruction of Human Thyroid based on Ultrasound and CT Image Data Fusion. Biomed. Tech. 2013, 58, 4284. [Google Scholar] [CrossRef]
  41. Ciora, R.A.; Neamtu, B.; Şofariu, C.; Dospinescu, C.; Barbu, A.; Banciu, D. A Simple Method for 3D Thyroid Reconstruction from 2D Ultrasound Slices. In Proceedings of the 2019 E-Health and Bioengineering Conference (EHB), Iasi, Romania, 21–23 November 2019; IEEE: New York, NY, USA, 2019. [Google Scholar]
Figure 1. (a) Measurement setting; (b) optical fiber holder (front); (c) optical fiber holder (back); (d) schematic of the figure, which shows positions of the holder, fibers, and thyroid. Source fibers are marked in red, and detection fibers are shown in blue.
Applsci 11 01670 g001
Figure 2. Instrumental response function (IRF) and time-of-flight (TOF) distribution in the neck. (a) 8ch IRF module; (b) IRF and TOF distribution at 763 nm of S2D2; (c) IRF and TOF distribution at 801 nm of S2D2; (d) IRF and TOF distribution at 836 nm of S2D2.
Applsci 11 01670 g002
Figure 3. Front (top) and back views (bottom) of the segmented model and grids used for image reconstruction. (a) Segmented model from the MR image: the neck and body (gray), the trachea (green), the thyroid (red), and the approximate location of the grid (yellow). (b) Trachea–tissue boundary grid. The source positions (red) and detection positions (blue) are also shown. (c) Homogeneous grid. The source positions (red) and detection positions (blue) are also shown.
Applsci 11 01670 g003
Figure 4. Tomographic images of the absorption coefficient at 801 nm by the trachea–tissue boundary grid on horizontal sections at (a) 3 mm above the middle of the thyroid isthmus, (b) the middle of the thyroid isthmus, (c) 3 mm below the middle of the thyroid isthmus. The T2-weighted MR images are shown in the background. The shape of the thyroid is outlined by the white line. In Figure 4a, positions of the muscle (MU), internal jugular vein (IJV), common carotid artery (CCA), trachea (TR), thyroid (TH), and skin (SK) are shown. In Figure 4c, the grid region is denoted by the dashed white line.
Applsci 11 01670 g004
Figure 5. Tomographic images of StO2 by the trachea–tissue boundary grid of horizontal sections at (a) 3 mm above the middle of the thyroid isthmus, (b) the middle of the thyroid isthmus, and (c) 3 mm below the middle of the thyroid isthmus. The T2-weighted MR images are shown in the background. The shape of the thyroid is outlined by the white line.
Applsci 11 01670 g005
Figure 6. Same as Figure 4 but for the homogeneous grid.
Applsci 11 01670 g006
Publisher’s Note: MDPI stays neutral with regard to jurisdictional claims in published maps and institutional affiliations.

