Abstract
The potential application of alkali-activated material (AAM) as an alternative binder in concrete to reduce the environmental impact of cement production has now been established. However, as the production and availability of the primarily utilized waste materials, such as fly Ash and blast furnace slag, decrease, it is necessary to identify alternative materials. One such material is clay, which contains aluminosilicates and is abundantly available across the world. However, the reactivity of untreated low-grade clay can be low. Calcination can be used to activate clay, but this can consume significant energy. To address this issue, this paper reports the investigation of two calcination methodologies, utilizing low-temperature and high-temperature regimes of different durations, namely 24 h heating at 120 °C and 5 h at 750 °C and, and the results are compared with those of the mechanical performance of the AAM produced with untreated low-grade clay. The investigation used two alkali dosages, 10% and 15%, with an alkali modulus varying from 1.0 to 1.75. An increase in strength was observed with calcination of the clay at both 120 and 750 °C compared to untreated clay. Specimens with a dosage of 10% showed enhanced performance compared to those with 15%, with Alkali Modulus (AM) of 1.0 giving the optimal strength at 28 days for both dosages. The strengths achieved were in the range 10 to 20 MPa, suitable for use as concrete masonry brick. The conversion of Al (IV) is identified as the primary factor for the observed increase in strength.
1. Introduction
Alkali-activated materials (AAMs) have come in to use as substitute materials for ordinary Portland cement (OPC) in the construction industry in recent years. The use of AAM not only limits the emissions of contaminants but also consumes less energy and, thus, can play a major role in reducing the global warming problem [1,2,3,4,5]. Different types of raw materials, such as fly ash, kaolinite, palm oil fuel ash, rice husk ash, shale, natural zeolite, types of sludge, lignite bottom ash, natural fibers, red mud, and clay and clay minerals (including bentonite and montmorillonite), are currently being investigated as possible AAMs. Studies have shown that concrete made from different industrial waste material can display comparable or even better mechanical and durability properties than those associated with OPC concrete [6,7,8,9,10,11,12,13,14]. According to the reports of the Intergovernmental Panel on Climate Change [3,15], the growth of world cement production increased sevenfold by 2010 compared to that in 1970, and from 2000, this growth has been increasing sharply driven by demand from the construction industry. It has been also reported that the cement industry was responsible for more than 13% of global emissions (emissions from cement-forming reactions only) of CO2 in 2010. The IPCC has also suggested using geopolymer concrete in place of OPC concrete to reduce CO2 emissions.
Research conducted to date has primarily focused on fly ash as a primary source of binder material. A concern is that fly ash production will decrease in the future as power generation switches from coal to other renewable forms of electricity production. It has also been reported that not all fly ash is suitable for geopolymer concrete production. Low-grade clay, which is a naturally occurring material that is abundant throughout the world, could be a suitable alternate source material to fulfil this requirement. Heath et al. suggested that there was the potential for global warming to be reduced by up to 40% if alkali-activated clay was used in place of OPC [4]. Perná et al. also identified the necessity for alternate substitute source materials for the production of geopolymer concrete [16]. Marsh et al. assessed the performance of uncalcinated montmorillonite and illite clays and reported a large variation in the properties, with montmorillonite displaying the more promising behavior [13]. Karouzou et al. investigated the long-term durability of alkali activation of soil samples with 13% clay particles, and the alkali-activated material demonstrated improved mechanical performance [14]. However, research on the utilization of low-grade clay as an alternative material for geopolymerization system is still in its infancy.
Research into clay-based geopolymers has reported strengths in the range of 5–40 MPa [17,18,19,20,21,22,23]. Calcination has been widely adopted to increase the reactivity of clay, utilizing temperatures up to 1000 °C [24,25,26]. Mechanical activation has also been proposed to increase reactivity, but the research is not as extensive [27,28]. A number of researchers have reported that reactivity increases due to the pre-heat treatment. Xu and van Deventer noted that the crystalline phase is transformed into the reactive amorphous phase due to heat treatment [29]. However, if too high, the applied calcination temperature may result in the formation of new crystalline phases that are not reactive [30]. Guo et al. reported that the reactive amorphous phase becomes unreactive if the pre-treatment temperature is over 900 °C [31,32], while Kong et al. stated that applying a pre-treatment temperature of up to 850 °C does not have a significant effect on the properties of geopolymers [33]. Poowancum and Horpibulsuk stated that the reactivity of calcined clay to be used is dependent on the duration of calcination [34]. They applied heat up to 600 °C for 5, 2, and 1 h and found that a calcination time of 2 h and a NaOH-to-Na2SiO3 ratio of 0.5 provided the optimum strength, which was greater than that of OPC. However, the reactivity of the calcinated precursor was reduced by increased calcination time. It was reported by Ferone et al. that an increase in the dissolution rate of Si and Al from clay sediments in an alkaline solution with an increase in temperature resulted in an increase in the compressive strength of the calcinated clay when activated [17]. Zhang and Guo et al. observed that the compressive strength of alkali-activated halloysite was dependent on the calcination temperature [35]. Yamchelou et al. found that a calcination temperature of 550 °C for 1 h optimized the specific surface area when compared to higher calcination temperatures. Alkali activation of the calcinated clay achieved a compressive strength in excess of 40 MPa after 28 days [36]. Current research has demonstrated the feasibility of clay as an AAM; however, significant gaps in the literature remain regarding the activation of the low-grade clay in terms of both the calcination process and the suitability of the activators. A wide range of temperature have been utilized for the calcination of clay with different treatment periods. Given the environmental impact from the calcination process, understanding the impact of the calcination regime on performance and minimizing the required energy are imperative for the application of clay as an AAM. To investigate the effect of calcination temperature, two regimes were selected to represent a low-temperature–high-duration regime and a high-temperature–low-duration regime at 120 °C for 24 h and at 750 °C for 5 h, respectively, and the results were compared with those of clay subjected to no calcination.
2. Significance of Research
Given the environmental concerns due to the use of cement in the construction industry coupled with a potential reduction in the availability of supplementary waste materials such as fly ash, in the future, the identification of suitable alternative materials with lower environmental impact is imperative. One such alternative material that could be used as a binder for alkali-activated concrete is low-grade clay. This paper reports a study on the development of an alkali-activated clay mortar. To assess the effect of calcination on performance, high-temperature and low-temperature calcination regimes were adopted at 120 °C for 24 h and at 750 °C for 5 h, respectively, and the results were compared with those of untreated clay. The feasibility was investigated by varying the activator modulus from 1.0 to 1.75 Alkali Modulus (AM) and dosage of the activator (10% and 15%). The optimal mix design was identified, and analytical and chemistry techniques, including XRD, NMR and FT-IR, were employed to provide an understanding of the reaction mechanism involved in the activation and reactivity of the clay.
3. Experimental Procedure
3.1. Materials
The source binder material used in this experiment is low-grade clay from the Ballarat region of Victoria, Australia. The clay was made into powder using a Ball Mill Grinder Machine. The mill was composed of a total of 15 balls, and 5000 cycles were applied. Ground clay powder was sieved through a 100 µm sieve, and the clay passing was used for characterization, pre-treatment, and casting of the mortar specimen. The clay was investigated under three different conditions: natural clay without thermal pre-treatment, clay calcinated at 120 °C for 24 h, and clay calcinated at 750 °C for 5 h.
The chemical composition was determined using Bruker Axs S4 Pioneer X-ray fluorescence equipment, as shown in Table 1. The particle size distribution was determined using a Malvern Mastersizer analyzer and the crystalline composition with a Bruker Axs D8 ADVANCE Wide Angle X-ray diffraction (XRD) instrument. XRD analysis was performed at 40 kV, Cu Kα = 1.54178 Å wavelength, and a scanning range of 2 theta in 5°–95°. Sample holders were filled using the front-loading procedure. The data obtained from XRD were interpreted using Bruker‒DIFFRAC.EVA software and Rietveld analysis [37,38]. The surface area was determined using the Brunauer–Emmett–Teller method by N2 absorption. The crystalline and amorphous content, specific surface area, and particle size distribution are shown in Table 2.

Table 1.
Oxide composition of clay.
Table 2.
Amorphous and crystalline content and BET surface area of clay material.
3.2. Mix Design
The proportioning of ingredients was calculated based on the mix design of Adam [10,40]. The mass ratio of sand to binder was fixed at 2.75 [41]. The w/s (water/solid) ratio was maintained between 0.37 to 0.45 to maintain workability. The quantity of water in the mix is calculated as the sum of the water contained in the sodium silicate, sodium hydroxide, and the added water, while the solid is the sum of the mass of clay and the solid contained in the alkaline activator solution. A number of alkaline activators with a range of concentrations have been used to activate aluminosilicate precursor materials. A combination of sodium hydroxide and sodium silicate has been shown to provide a high capacity for the dissolution of these aluminosilicates and is adopted in this study [42]. Previous research has also identified the activator modulus (AM) and dosage key factors in determining performance [43]. In this study, four activator moduli (AMs) (1.0, 1.25, 1.5, and 1.75) for each of the two sodium oxide (Na2O) dosages of 10% and 15% were selected, corresponding to the optimal range in accordance with previous studies [36,44]. A curing temperature of 120 °C was employed, as this had been identified as optimum curing temperature in earlier studies [44]. The specific mix designs are given in Table 3.
Table 3.
Mix designs of alkali-activated clay mortar (kg/m3).
3.3. Specimen Preparation and Curing
The solids, clay, and sand were mixed for 4 min using 5-L Hobart mixer. The activator comprising a combination of 15 molar–NaOH solution and grade D liquid Na2SiO3 of 1.52 g/cc density with composition of 14.7% Na2O, 29.4% SiO2, and 55.90% water was premixed 15 min before the additional water was added to the activator solution. This activator solution was then added to the mixture of clay powder and sand. After manual mixing for 1 min, the entire mix was blended at 150 rev/min for 4 min and then 300 rev/min 2 min. The mix was then placed in 50 × 50 × 50 mm Teflon molds followed by 30 s vibration on a vibrating table. After 24 h at room temperature, the specimens were cured oven at 120 °C for a further 24 h. The specimens were then demolded and cured at room temperature until testing.
3.4. Testing
Compressive strength measurements of mortars were performed on a Technotest TCM testing machine in accordance with ASTMC109/C109M (2013), with a loading rate of 0.34 N/mm2/S [41]. Three cubes were tested for each data point and testing undertaken at 7, 14, 28, and 40 days. A Perkin–Elmer-Spectrum 100 FT-IR spectrometer, with an advanced atmospheric compensation algorithm to remove spectral interferences due to H2O and CO2, was utilized to record the FT-IR absorption spectra using a total of 64 scans. The recording ranged from 4000 to 450 cm−1 with a universal attenuated total reflectance (ATR) top plate and diamond crystal. The absorption spectra were logged at a resolution of 4 cm−1 and a scan speed of 0.2 cm/s. The sample preparation consisted of mixing 2 g of powdered material with 10 g of sodium tetrahydroborate. The initial background scan consisted of 100% sodium tetrahydroborate. Magic-angle spinning solid-state nuclear magnetic resonance (MAS SS NMR) spectra were recorded on an Agilent DD2 500 MHz NMR spectrometer equipped with a 4 mm MAS solid-state triple-resonance probe with a 10 kHz sample spin rate. 27Al spectra were acquired using the “onepul” method with 256 scans, a 3 s delay time, a 40 ms acquisition time, 30 gain, and a line broadening of 150. The crystalline and amorphous contents of the clays were determined using Diffrac Eva software. The powdered material was prepared by grinding the mortar samples to pass a 75-micron sieve.
4. Results and Discussion
The calcination of the clay had no significant effect on the chemical composition of the material (Table 1), with the SiO2 content being approx. 62%–65% and that of Al2O3 being approx. 20%. The amorphous content increased with calcination from 21.6% to 23.8% at a temperature of 120 °C. However, a small decrease in the amorphous content was observed when heated to 750 °C; this may be due to recrystallization of the amorphous phase at this temperature [22,36]. The calcination reduced the surface area from 12.45 m2/g in the raw clay to 6.03 m2/g in the clay treated at 750 °C, but the % passing at both 10 and 50 µm increased. The research conducted by Wang et al. (2004) supports this finding; their research suggests that adsorbed water is completely removed at these temperatures, causing shrinkage and disintegration of soil particles, and, hence, a slight reduction in particle size occurs [45]. The minimal increase in amorphous content at both 120 °C and 750 °C indicates that these calcination regimes did not increased the amorphous content significantly and that a calcination temperature between this range may be appropriate to optimize the amorphous content.
4.1. Effect of Activator
Initial trials on the effect of the activator dosage and modulus were undertaken on the clay pre-treatment at 120 °C. This was selected as the amorphous content and surface area, identified as key parameters in the performance of AAM, were both higher than the clay pre-treated at 750 °C. The compressive strengths of the 10% dosage and 15% dosage specimens are presented in, Figure 1 and Figure 2, respectively, with standard deviation.
Figure 1.
Compressive strength vs. time, 10% Na2O dosage specimens.
Figure 2.
Compressive strength vs. time, 15% Na2O dosage specimens.
The results show that the strength generally increased from 7 to 14 days for both the 10% and 15% Na2O dosages, excluding the 1.75 AM, specimens. A slight decrease in strength was observed in all mortars at 28 days. The results indicate an increase in strength comparable to those observed at 14 days for the 10% dosage specimens, while the 15% dosage specimens maintained the strengths observed at 28 days. Additional testing at 40 days was undertaken to determine whether a further reduction in strength was observed. The results indicate an increase in strength comparable to those observed at 14 days for the 10% dosage specimens, while the 15% dosage specimens maintained the strengths observed at 28 days. It is hypothesized that due to the low amorphous and aluminosilicate content in the clay, small variations within the pre-cursor material in the batch can have an impact on the strength. Similar behavior has been observed in class C brown coal fly ash with low amorphous and aluminosilicate content [46].
The Na2O dosage of 15% with 7-day compressive strength was highest (20.02 MPa) for AM 1.75, whereas AM 1.5 provided the highest strength (13.45 MPa) at day 14. The 15% dosage of 1.75 AM achieved maximum strength at day 7 but decreased significantly by day 14 (11.96 MPa). The compressive strength at day 28 was similar for all specimens, with AM 1.75 achieving the highest strength (12.04 MPa). For the Na2O dosage of 10%, AM 1.75 had the optimum strength at day 7 (14.92 MPa), whereas AM 1.0 showed optimum strength at days 14 (14.5 MPa) and 28 (10.42 MPa), but similar strengths were also achieved by the AM 1.25 specimens. The compressive strengths of all 10% Na2O dosage specimens were greater than the strengths of those of the corresponding 15% Na2O dosage, except for that of AM 1.75. A Na2O dosage of 10% provided consistent strength for all tested AMs; however, all of the specimens prepared with a Na2O dosage of 15% showed a reduction with time.
This behavior has been observed for the fly ash-rice husk bark ash (RHBA) geopolymer, where it was found that the compressive strength of specimens cured at a higher temperature (i.e., > 90 °C) started to decrease after a period of time [47]. It was reported that the higher temperature destroyed the granular structure of the geopolymer, which caused dehydration of the geopolymer matrix and excessive shrinkage due to contraction of the geopolymeric gel. Sukmak et al. observed the existence of micro-cracks at an elevated curing temperature (85 °C) with a short curing duration (24 h), and even at a lower curing temperature (75 °C) with a longer curing duration (75 h) for clay-fly ash geopolymer bricks [48]. Micro-cracking has also been observed in alkali-activated slag geopolymers following elevated curing [49]. Micro-cracking adversely affects the compressive strength due to the breaking of interparticle bonding. This is also supported by the research of Rovnaník, who reported that at lower curing temperatures, the geopolymer matrix developed slowly with lower porosity, while geopolymers formed at higher curing temperatures contained larger pores and a loosely packed structure [50].
The results indicate that the compressive strength was adversely affected by an increase in AM and dosage, which corresponds to a higher Na2O content. It is hypothesized that this may be due to the formation of Na2O-CaO-SiO2-H2O, as the solubility of Na+ ion is very low in alkali-activated binder materials [51]. To further understand the reaction mechanism underpinning the strength evolution, XRD, FT-IR and MAS-NMR analyses were undertaken on the best-performing compressive strength mixes of AM 1.0 for both the 10% and 15% dosages using clay subjected to the three treatment regimes.
4.2. XRD Analysis
The XRD spectra are illustrated in Figure 3, and the analysis is presented in Table 4. The principal crystalline components in the raw clay are illite, corresponding with the high K2O content, kaolinite, and quartz, with small quantities of rutile (TiO2) and chlorite (MgO) present, as well as traces of montmorillonite, albite and, goethite. The amorphous phase is composed primarily of silica, consistent with the relatively high SiO2 content, as shown in Table 1. After pre-treatment at 120 °C, the kaolinite significantly decreased, and following calcination at 750 °C, none of these remained, as they were completely decomposed to the amorphous phase [52,53,54]. Illite was also not observed after calcination, and it is surmised that it was converted to muscovite during the calcination process due to dihydroxylation [55]. Muscovite is not observed in the natural clay or when only heated to 120 °C, but the quantity of illite reduced at 120 °C, with a small increase in rutile and chlorite observed together with that in quartz.
Figure 3.
XRD spectra: (a) clay, (b) 10% mortar, and (c) 15% mortar.
Table 4.
Mineralogical composition of clay and alkali-activated mortar at 28 days (AM 1.0, dosages of 10% and 15%).
Following alkali activation, the primary crystalline phase in all of the mortars was quartz, with similar quantities in all of the 10% and 15% mortar specimens, which can be attributed to the presence of sand in the mortar specimens. The amorphous content was reduced following activation; in the 10% specimens, a significant reduction was observed for the raw clay mortar, with a small 1–2% reduction noted in the pre-treated specimens. In the 15% specimens, a similar trend was observed, but the reduction in the raw clay was slightly less than in the raw clay and slightly greater (approx. 8% lower) in the pre-treated clays.
In addition to the increase in the quartz present, the mortar specimens showed the presence of a number of sodium containing crystalline compounds. Sodalite was identified in all the 15% dosage mortars and in the pre-treated 10% specimens, while analcime was evident in the 10% and 16% untreated mortars and the 10% mortar pre-treated at 120 °C. An increase in the albite content was observed in the untreated clay mortar for both the 10% and 15% specimens, as well as in the 750 °C mortars but not in the 120 °C specimens at both dosages of 10% or 15%. Furthermore, illite was observed in the 750 °C mortars, possibly re-converted from the muscovite observed in the calcinated clay. Reduced quantities of illite were detected in the natural and 120 °C mortars.
All of the mortar specimens showed an increase in crystalline content, suggesting the presence of zeolites rather than an amorphous geopolymeric phase [56,57]. It is hypothesized that the growth of zeolite crystalline phases is supported by the high water content and the employed high curing temperature [58]. Zeolites generally have poor mechanical properties, which could account for the relatively low compressive strengths achieved and the reduction in strength observed in some mixes.
4.3. NMR Analysis
The 27Al MAS-NMR spectra of the clays and the mortars at 28 days are presented in Figure 4. The NMR spectra were deconvoluted in accordance with the singular value decomposition method [59]. The calculation of the relative areas of deconvolution lines for the samples is shown in Table 5.
Figure 4.
NMR spectra: (a) clay; (b) 10% mortar and (c) 15% mortar.
Table 5.
Relative area and coordination of Al (VI) and Al (IV) of clay and alkali-activated mortar at 28 days (AM 1.0, dosages of 10% and 15%).
The Al (IV)-fold coordination is assigned to the chemical shifts in the range between 60 and 80 ppm, while Al (VI) coordination is assigned to the chemical shifts observed between 3.5 and 5.0 ppm. For the 10% dosage specimens, the untreated clay/natural clay powder showed a distinct Al (VI) coordination peak at 4.8 ppm. This shifted to 3.5 ppm when clay was pre-treated at 120 °C. No change was noted in the Al (IV) peaks following treatment at 120 °C. In the clay treated at 750 °C, all of the aluminum was observed to be in the Al (IV) coordination state, being converted during the calcination process. The deconvoluted data show that the untreated natural clay contained 61.6% Al (VI) and 38.4% Al (IV). Following pre-treatment of clay at 120 °C, the Al (VI) coordination increased to 67.6%, with a corresponding decrease in the Al (IV) coordination, as shown in Table 5. Following activation, the Al (IV) peaks became sharper, indicating a higher Si content after activation [60]. The resultant natural clay mortar specimens for the 10% dosage contained 45.5% Al (VI) and 54.5% Al (IV), and the 120 °C treated mortars had 38.5% Al (VI) and 61.5% Al (IV) coordination i.e., the Al (IV) coordination increased by 16.1% and 29.1%, respectively. The 15% mortar specimens displayed increased conversion from Al (VI) to Al (IV), the natural clay had 43.8% Al (VI) and 56.2% Al (IV), and the mortar treated at 120 °C had 28% Al (VI) and 72% Al (IV) coordination, corresponding to an increase of 17.8% and 40.6%, respectively. It has been reported that the quantity of Al (VI) present in the precursor fly ash—and the conversion of this into Al (IV) units during reaction process—influences the achieved compressive strength. Hence, the additional conversion from Al (VI) to Al (IV) would account for the increase in strength observed in the mortar specimens treated at 120 °C compared to the natural clay mortar.
It is noted that the rate of change of Al coordination from (VI) to (IV) is low compared to that of fly-ash-based geopolymerization [61]. The authors found that the conversion of Al (VI) to Al (IV) coordination was 45% in the case of the Gladstone-Fly Ash-based geopolymer, whereas in this study, conversion is less than 30%, excluding that of the 120 °C 15% mortar, which is approx. 40%. This low conversion is identified as one of the reasons that clay-based AAM exhibits lower compressive strength than that of the class F fly-ash-based geopolymer. It is also noted that the Al (VI) coordination is at 3.5 ppm in the clay powder and shifts to 3.87 ppm in the resultant mortar. This is also a significantly smaller chemical shift that represents a lower rate of chemical reaction taking place in the reaction. This may also be a reason for the longer duration required for alkali-activated clay to achieve structural integrity.
Table 5 shows that natural clay contains 62% Al (VI) coordination and that the pre-treatment of clay at 750 °C converted all Al (VI) coordination to Al (IV) coordination. Buchwald et al. noted during thermal activation of clay minerals that the Al tetrahedral peak becomes larger and the octahedral peak becomes lower with increasing temperature. They also observed that in the range of 500–800 °C, the whole Al (VI)-fold coordination converts into Al (IV) coordination, and with further heating, the octahedral peak disappears [2]. Omegna et al. supported this observation, reporting that octahedrally coordinated aluminum decreases with increasing temperature [62]. They also stated that Al (VI) coordination converts into Al (IV) coordination at 673 °K. As stated by Sperinck et al. (2011), the loss of local hydroxyl groups increases with increasing temperature, and this loss of local hydroxyl groups causes structural disorder of the material, which leads to the migration of Al (VI) coordination into Al (IV) coordination [63]. In the clay pre-treated at 750 °C, there was no change in the Al coordination; the whole Al (VI) coordination was converted into Al (IV) coordination during clay pre-treatment.
The NMR data indicate that the conversion of aluminum from octahedral to tetrahedral coordination as well as the quantity of aluminum in the tetrahedral coordination influence the mechanical performance. The data indicate that the more aluminum ions in Al (IV) coordination in the reactive crystalline phases, the more significant the role that dissolution of aluminum plays in the ultimate strength achieved during activation.
4.4. FT-IR Analysis
The FTIR spectra of natural clay, clay pre-treated at 120 °C and 750 °C, and alkali-activated mortars for AM 1.0 at dosages of 10% and 15% are presented in Figure 5.
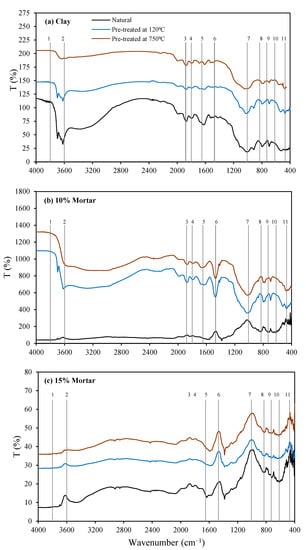
Figure 5.
FTIR spectra: (a) clay, (b) 10% mortar, and (c) 15% mortar.
The peaks in the region of 3800–3600 cm−1 present in the untreated clay and clay treated at 120 °C are attributed to O–H stretching and bending vibrations of the hydroxyl groups of kaolinite and illite [53,64,65]. These disappear in the spectra of the clay pre-treated at 750 °C, which is consistent with the conversion of kaolinite and illite as observed in the XRD data. The peaks observed between 1650 and 1600 cm−1 in the clays are associated with the H–O–H vibrations of absorbed water. These decrease in intensity in both the pre-treated clays compared to the untreated clay, as the water is lost during calcination, while the peaks at 1820 and 1480 cm−1 are identified to be asymmetric C–O stretching due to carbonation [54].
The peak at 1008 cm−1 is attributed to Si-O-T (asymmetrical vibration; T = Al, Fe, or Si), and 1080–1100 cm−1 is attributed to Si-O (symmetrical vibrations in SiO4) from the kaolinite and illite, as it is not evident in the 750 °C spectra [13]. The natural clay and clay pre-treated at 120 °C show a peak at around 850 cm−1, which, in the clay pre-treated at 750 °C, shifted to 880 cm−1, while the band at 908 cm−1 for natural clay and 926 cm−1 for clay pre-treated at 120 °C attributed to Al (IV)-OH [64,66] disappeared during clay pre-treatment at 750 °C. According to Davidovits (2008), this is due to the transformation of VI-fold coordination of Al into IV-fold coordination [67]. Furthermore, the VI-fold coordinated Al (VI)-OH (stretching vibration) of kaolinite is replaced by the IV-fold coordinated Al (1V)-O (stretching vibration) due to calcination at 750 °C. This is supported by the XRD, which shows the decomposition of the kaolinite and NMR data that show conversion of Al from VI to the IV-fold coordination. The doublet in the region of 795–770 cm−1 and the singlet at 695 cm−1 are attributed to Si-O symmetric stretching vibrations from the quartz. The peak at 470 cm−1 could be due to the Si-O in-place bending vibration or Fe-O-T stretching. The band at 540 cm−1 is due to the Si-O-Al (VI) bending vibrations from the kaolinite and illite [54,57,64].
According to Valcke et al. and Zhang et al., the wave range of 1300–800 cm−1 represents Al2SiO3, where the region between 1300 and 1000 cm−1 represents glassy Al2SiO3, 1000–900 cm−1 represents glassy (medium) Al2SiO3, and 900–800 cm−1 represents (high) Al2SiO3 [68,69] Zhang et al. added that the bonds in the 900–1000 cm−1 region represents the dominant active bond of Al2SiO3. This is reflected in the broad peak observed in the region between 1100 and 900 cm−1 in the raw clay, indicative of amorphous material [69]. This peak is observed to flatten out further following calcination at 750 °C, correlating with the increase in the amorphous content in the clay after calcination. The FT-IR spectra of all the mortar specimens showed significant peaks between 3800 and 3600 cm−1, clearly showing the presence of water in the mortars. However, there was no evidence of carbonation peaks in the mortar specimens. The 1080–1100 cm−1 peak broadened and shifted to just below 1000 cm−1 for all of the 10%- and 15%-dosage mortars, while the peaks in the 500–400 cm−1 region also broadened and increased in intensity. The doublet in the region of 795–770 cm−1 and the singlet at 695 cm−1 attributed to Si-O symmetric stretching from the quartz remain consistent with the quartz identified in the XRD analysis. The findings are in agreement with previous research, which reported that shifting of the peaks towards lower wave number is an indication of aluminum incorporation in the back bone of the silicates with the formation of the geopolymer matrix [70]. In addition, peaks are observed with increased intensity and movement to a slightly lower wavelength compared to the unreacted clay (at 1800 and1450 cm−1), which is indicative of carbonation of the mortar.
5. Summary and Conclusions
The following conclusions can be drawn from the analysis of the results:
- The amorphous content of the clay increased from 21.6% to 23.8% at 120 °C. However, a small decrease in the amorphous content was observed (23.1%) when heated to 750 °; this is attributed to recrystallization of the amorphous phase at this temperature.
- The surface area with calcination decreased from 12.45 m2/g in the natural clay to 8.66 m2/g at 120 °C and 6.03 m2/g at 750 °C, but the % passing at both 10 and 50 µm increased. This is attributed to the loss of adsorbed water resulting in shrinkage and disintegration of the soil particles and a reduction in particle size.
- An increase in strength was observed with calcination of the clay under both 120 °C for 24 h and 750 °C for 5 h.
- At 120 °C, the specimens with a dosage of 10% demonstrated improved performance compared to a dosage of 15%, with an AM of 1.0 providing the optimal strength at both dosages.
- The main components in the raw clay are illite, kaolinite, and quartz with small quantities of rutile and chlorite and traces of montmorillonite, albite, and goethite. Following calcination of the clay, there was a significant reduction in illite and kaolinite at 120 °C, while this was not observed following calcination at 750 °C. Montmorillonite, albite, and goethite all disappeared following calcination, while rutile and calcite content increased at 120 °C, but this was not evident after calcination at 750 °C. The quantity of quartz increased with calcination, while significant quantities of muscovite were observed when calcinated at 750 °C.
- Calcination at 120 °C increased the quantity of Al (VI) from 61% to 67%, while at 750 °C, all of the Al (VI) was converted to Al (IV). Following the reaction, an increase in Al (IV) was noted for all the mortars, with a higher rate of conversion in the 120 °C specimens compared to the raw clay. The conversion of Al (IV) is identified as the primary factor for the increased strength in the treated clay mortars.
- The mortar specimens showed a broadening of the peak in the region of 1080–1000 cm−1, which was noted together with a shift to lower wavenumbers for all of the 10% and 15% dosage mortars. The peaks in the 500–400 cm−1 region also broadened and increased in intensity. The shifting of the peaks towards the lower wave number is an indication of aluminum incorporation in the backbone of the silicates matrix, consistent with the increases in strength observed and the conversion of Al (VI) to Al (IV).
The results indicate that it is feasible to use low-grade clay as a precursor material for geopolymer synthesis. However, while the compressive strengths achieved are insufficient for application as structural concrete, they may be suitable for concrete masonry bricks where a minimum strength of 5 MPa is required. The low strength may be a function of the two calcination regimes, where a decrease in surface area was observed for both regimes, with minimal increases in the amorphous content. Hence, it is recommended that future research assess calcination regimes between 120 and 750 °C to minimize the energy use and to optimize performance. Furthermore, for the application as masonry bricks, research is required on the long-term performance and a lifecycle assessment of the environmental impacts of manufacturing clay-based geopolymers.
Author Contributions
Conceptualization, M.M.R., D.W.L. and I.P.; methodology, M.M.R. and M.T.Y.; validation, D.W.L. and C.G.; formal analysis, M.M.R., D.W.L. and C.G.; investigation, M.M.R. and M.T.Y.; resources, I.P.; data curation, D.W.L.; writing—original draft preparation, M.M.R.; writing—review and editing, D.W.L.; visualization, D.W.L.; supervision, I.P. and D.W.L.; project administration, I.P.; funding acquisition, I.P. All authors have read and agreed to the published version of the manuscript.
Funding
This research received no external funding.
Institutional Review Board Statement
Not applicable.
Informed Consent Statement
Not applicable.
Data Availability Statement
The data presented in this study are available on request from the corresponding author.
Acknowledgments
The X-ray facility, microscopy and microanalysis facility, and scientific and technical assistance provided by RMIT University are further acknowledged.
Conflicts of Interest
The authors declare that they have no known competing financial interests or personal relationships that could have appeared to influence the work reported in this paper.
References
- Hardjito, D.; Wallah, S.E.; Sumajouw, D.M.J.; Rangan, B.V. On the Development of Fly Ash-BasedGeopolymer Concrete. ACI Mater. J. 2004, 101, 467–472. [Google Scholar]
- Buchwald, A.; Hohmann, M.; Posern, K.; Brendler, E. The suitability of thermally activated illite/smectite clay as raw material for geopolymer binders. Appl. Clay Sci. 2009, 43, 300–304. [Google Scholar] [CrossRef]
- Impacts, A. Vulnerability, Part A: Global and Sectoral Aspects. In Contribution of Working Group II to the Fifth Assessment Report of the Intergovenmental Panel on Climate Change; Climate Change 2014; Cambridge University Press: Cambridge, UK; New York, NY, USA, 2014. [Google Scholar]
- Heath, A.; Paine, K.; McManus, M. Minimising the global warming potential of clay based geopolymers. J. Clean. Prod. 2014, 75, 75–78. [Google Scholar] [CrossRef]
- IEA. Global Status Report for Buildings and Construction; IEA: Paris, Franch, 2019. [Google Scholar]
- Pacheco-Torgal, F.; Castro-Gomes, J.; Jalali, S. Alkali-activated binders: A review. Part 2. About materials and binders manufacture. Constr. Build. Mater. 2008, 22, 1315–1322. [Google Scholar] [CrossRef]
- Bernal, S.A.; de Gutierrez, R.M.; Provis, J.L. Engineering and durability properties of concretes based on alkali-activated granulated blast furnace slag/metakaolin blends. Constr. Build. Mater. 2012, 33, 99–108. [Google Scholar] [CrossRef]
- Adak, D.; Mandal, S. Strength and Durability Performance of Fly Ash-Based Process-Modified Geopolymer Concrete. J. Mater. Civ. Eng. 2019, 31, 04019174. [Google Scholar] [CrossRef]
- Puertas, F.; Fernandez-Jimenez, A. Mineralogical and microstructural characterisation of alkali-activated fly ash/slag pastes. Cem. Concr. Compos. 2003, 25, 287–292. [Google Scholar] [CrossRef]
- Law, D.W.; Adam, A.A.; Molyneaux, T.K.; Patnaikuni, I.; Wardhono, A. Long term durability properties of class F fly ash geopolymer concrete. Mater. Struct. 2012, 48, 721–731. [Google Scholar] [CrossRef]
- Silva, G.; Kim, S.; Aguilar, R.; Nakamatsu, J. Natural fibers as reinforcement additives for geopolymers A review of potential eco-friendly applications to the construction industry. Sustain. Mater. Technol. 2020, 23, e00132. [Google Scholar] [CrossRef]
- Du, W.; Wang, X.; Chen, G.; Zhang, J.; Slany, M. Synthesis, Property and Mechanism Analysis of a Novel Polyhydroxy Organic Amine Shale Hydration Inhibitor. Minerals 2020, 10, 128. [Google Scholar] [CrossRef]
- Marsh, A.; Heath, A.; Patereaud, P.; Everenden, M.; Walker, P. Alkali activation behaviour of un-calcined montmorillonite and illite clay minerals. Appl. Clay Sci. 2018, 166, 250–261. [Google Scholar] [CrossRef]
- Karozou, A.; Konopisi, S.; Pavlidou, E.; Stefanidou, M. Long-Term Behavior and Durability of Alkali-Activated Clay Mortars. Materials 2020, 13, 3790. [Google Scholar] [CrossRef] [PubMed]
- IPCC. 2018: Global Warming of 1.5 °C. In An IPCC Special Report on the Impacts of Global Warming of 1.5 °C Above Pre-industrial Levels and Related Global Greenhouse Gas Emission Pathways, in the Context of Strengthening the Global Response to the Threat of Climate Change, Sustainable Development, and Efforts to Eradicate Poverty; Masson-Delmotte, V., Zhai, P., Pörtner, H.-O., Roberts, D., Skea, J., Shukla, P.R., Pirani, W.M.-O.A., Péan, C., Pidcock, R., Connors, S., et al., Eds.; IPCC: Geneva, Switzerland, 2019. [Google Scholar]
- Perna, I.; Hanzlicek, T.; Supova, M. The identification of geopolymer affinity in specific cases of clay materials. Appl. Clay Sci. 2014, 102, 213–219. [Google Scholar] [CrossRef]
- Ferone, C.; Ligouri, B.; Capasso, I.; Colangelo, F.; Cioffi, R.; Cappeletto, E.; Di Maggio, R. Thermally treated clay sediments as geopolymer source material. Appl. Clay Sci. 2015, 107, 195–204. [Google Scholar] [CrossRef]
- Diop, M.B.; Grutzeck, M.W.; Molez, L. Comparing the performances of bricks made with natural clay and clay activated by calcination and addition of sodium silicate. Appl. Clay Sci. 2011, 54, 172–178. [Google Scholar] [CrossRef]
- Cioffi, R.; Maffucci, L.; Santoro, L. Optimization of geopolymer synthesis by calcination and polycondensation of a kaolinitic residue. Resour. Conserv. Recycl. 2003, 40, 27–38. [Google Scholar] [CrossRef]
- Seiffarth, T.; Grone, J.; Slavova, N.; Seigmund, B.; Bhur, H.J.; Ritz, J.P. Effect of thermal pre-treatment conditions of common clays on the performance of clay-based geopolymeric binders. Appl. Clay Sci. 2013, 73, 35–41. [Google Scholar] [CrossRef]
- Selemani, S.; Sidiri, A.; Bouaziz, S.; Joussein, E.; Rossognol, S. Effects of metakaolin addition on geopolymer prepared from natural kaolinitic clay. Appl. Clay Sci. 2017, 146, 457–467. [Google Scholar] [CrossRef]
- Nikolov, A.; Nugteren, H.; Rostovsky, I. Optimization of geopolymers based on natural zeolite clinoptilolite by calcination and use of aluminate activators. Constr. Build. Mater. 2020, 243, 118257. [Google Scholar] [CrossRef]
- Jaya, N.A.; Yun-Ming, L.; Cheng-Yong, H.; Al Bakri, A.M.M.; Hussin, K. Correlation between pore structure, compressive strength and thermal conductivity of porous metakaolin geopolymer. Constr. Build. Mater. 2020, 247, 118257. [Google Scholar] [CrossRef]
- Alshaaer, M. Synthesis and characterization of self-healing geopolymer composite. Constr. Build. Mater. 2020, 245, 118432. [Google Scholar] [CrossRef]
- Koutník, P.; Soukup, A.; Bezucha, P.; Safar, J.; Kohout, J. Low viscosity metakaolinite based geopolymer binders. Constr. Build. Mater. 2020, 230, 116978. [Google Scholar] [CrossRef]
- Khalifaa, A.Z.; Cizera, O.; Pontikes, Y.; Heath, A.; Patereaud, P.; Bernal, S.A.; Marsh, A.T.M. Advances in alkali-activation of clay minerals. Cem. Concr. Res. 2020, 132, 106050. [Google Scholar] [CrossRef]
- Kumar, S.; K, R. Mechanical activation of fly ash: Effect on reaction, structure and properties of resulting geopolymer. Ceram. Int. 2011, 37, 533–541. [Google Scholar] [CrossRef]
- Tahmasebi Yamchelou, M.; Law, D.W.; Li, J.; Patnaikuni, I. Alkali activation of mechanically activated low grade clay. J. Sustain. Cem. Based Mater. 2020. [Google Scholar] [CrossRef]
- Xu, H.; van Deventer, J.S.J. Microstructural characterisation of geopolymers synthesised from kaolinite/stilbite mixtures using XRD, MAS-NMR, SEM/EDX, TEM/EDX, and HREM. Cem. Concr. Res. 2002, 32, 1705–1716. [Google Scholar] [CrossRef]
- Ramezanianpour, A.A. Metakaolin. In Cement Replacement Materials; Springer: Berlin/Heidelberg, Germany, 2014; pp. 225–255. [Google Scholar]
- Guo, W.; Wu., G.; Wang, J.; Wen, Z.; Sin, S. Preparation and performance of geopolymers. J. Wuhan Univ. Technol. Mater. Sci. Ed. 2008, 23, 326–330. [Google Scholar] [CrossRef]
- Guo, X.; Shi, H.; Chen, L.; Dick, W.A. Performance and mechanism of alkali-activated complex binders of high-Ca fly ash and other Ca-bearing materials. In Proceedings of the 3rd World of Coal Ash, WOCA Conference, Lexington, KY, USA, 4 May 2009–7 May 2009. [Google Scholar]
- Kong, D.L.Y.; Sanjayan, J.G.; Sagoe-Crentsil, K. Comparative performance of geopolymers made with metakaolin and fly ash after exposure to elevated temperatures. Cem. Concr. Res. 2007, 37, 1583–1589. [Google Scholar] [CrossRef]
- Poowancum, A.; Horpibulsuk, S. Development of Low Cost Geopolymer from Calcined Sedimentary Clay. Calc. Clays Sustain. Concr. 2015, 10, 359–364. [Google Scholar]
- Zhang, B.; Guo, H.; Yuan, P.; Lia, Y.; Wang, Q.; Deng, L.; Liu, D. Geopolymerization of halloysite via alkali-activation: Dependence of microstructures on precalcination. Appl. Clay Sci. 2020, 185, 105375. [Google Scholar] [CrossRef]
- Tahmasebi Yamchelou, M.; Law, D.W.; Brkjaca, R.; Gunasekara, C.; Li, J.; Patnaikuni, I. Geopolymer synthesis using low-grade clays. Constr. Build. Mater. 2020, 268, 121066. [Google Scholar] [CrossRef]
- Whitfield, P.S.; Mitchell, L.D. Quantitative Rietveld analysis of the amorphous content in cements and clinkers. J. Mater. Sci. 2003, 38, 4415–4421. [Google Scholar] [CrossRef]
- Font, O.; Moreno, N.; Querol, X.; Izquierdo, M.; Álvarez, E.; Diez, S.; Elvira, J.; Antenucci, D.; Nugteren, H.; Plana, F.; et al. X-ray powder diffraction-based method for the determination of the glass content and mineralogy of coal (co)-combustion fly ashes. Fuel 2010, 89, 2971–2976. [Google Scholar] [CrossRef]
- Standards Australia. AS411.5-2000 Methods for sampling and testing aggregates, Method 5: Particle density and water absorption of fine aggregate. In AS 1141.5-200 (Australian Standards); Standards Australia: Sydney, Australia, 2000; pp. 1–8. [Google Scholar]
- Adam, A.A. Strength and Durability Properties of Alkali Activated Slag and Fly Ash based geopolymer Concrete. Ph.D. Thesis, RMIT University, Melbourne, Australia, 2009. [Google Scholar]
- International ASTM. C109/C109M-16a. In Standard Test Method for Compressive Strength of Hydraulic Cement Mortars 2016; ASTM International: West Conshohocken, PA, USA, 2002. [Google Scholar]
- Soutsos, M.; Boyle, A.P.; Vinai, R.; Hadjierakleous, A.; Barnett, A.J. Factors influencing the compressive strength of fly ash based geopolymers. Constr. Build. Mater. 2016, 110, 355–368. [Google Scholar] [CrossRef]
- Gunasekara, C.; Law, D.W.; Setunge, S. Long term permeation properties of different fly ash geopolymer concretes. Constr. Build. Mater. 2016, 124, 352–362. [Google Scholar] [CrossRef]
- Rahman, M.M.; Law, D.W.; Patnaikuni, I. Factors affecting the performance of 100% clay based geopolymer concrete. In Proceedings of the 28th Biennial National Conference of the Concrete Institute of Australia, Adelaide, Australia, 22–25 October 2017; p. 39. [Google Scholar]
- Wang, K.; Shah, S.P.; Mishulovich, A. Effects of curing temeperature and NaOH addition on hydration and strength development of clinker free CKD-fly ash binders. Cem. Conc. Res. 2004, 34, 229–309. [Google Scholar] [CrossRef]
- Khodr, M.; Law, D.W.; Gunasekara, C.; Setunge, S.; Brkjaca, R. Compressive strength and microstructure evolution of low calcium brown coal fly ash-based geopolymer. J. Sustain. Cem. Based Mater. 2019, 9, 17–34. [Google Scholar] [CrossRef]
- Nazari, A.; Bagheri, A.; Riahi, S. Properties of geopolymer with seeded fly ash and rice husk bark ash. Mater. Sci. Eng. A Struct. Mater. Prop. Microstruct. Process. 2011, 528, 7395–7401. [Google Scholar] [CrossRef]
- Sukmak, P.; Horpibulsuk, S.; Shen, S.L.; Chindaprasirt, P.; Suksiripattanapong, C. Factors influencing strength development in clay-fly ash geopolymer. Constr. Build. Mater. 2013, 47, 1125–1136. [Google Scholar] [CrossRef]
- Collins, F.; Sanjayan, J.G. Microcracking and strength development of alkali activated slag concrete. Cem. Concr. Compos. 2001, 23, 345–352. [Google Scholar] [CrossRef]
- Rovnanik, P. Effect of curing temperature on the development of hard structure of metakaolin-based geopolymer. Constr. Build. Mater. 2010, 24, 1176–1183. [Google Scholar] [CrossRef]
- Garcia-Lodeiro, I.; Palomo, A.; Fernandez-Jimenez, A. Compatibility studies between N-A-S-H and C-A-S-H gels. Study in the ternary diagram Na2O-CaO-Al2O3-SiO2-H2O. Cem. Concr. Res. 2011, 41, 923–931. [Google Scholar] [CrossRef]
- Fernandez, R.; Martirena, F.; Scrivener, K.L. The origin of the pozzolanic activity of calcined clay minerals: A comparison between kaolinite, illite and montmorillonite. Cem. Concr. Res. 2011, 41, 113–122. [Google Scholar] [CrossRef]
- He, C.L.; Makovicky, E.; Osbaeck, B. Thermal treatment and pozzolanic activity of Na- and Ca-montmorillonite. Appl. Clay Sci. 1996, 10, 351–368. [Google Scholar] [CrossRef]
- Kaze, R.C.; Moungam, L.M.B.; Djouka, M.L.F.; Nana, A.; Kamseu, E.; Melo, U.F.C.; Leonelli, C. The corrosion of kaolinite by iron minerals and the effects on geopolymerization. Appl. Clay Sci. 2017, 138, 48–62. [Google Scholar] [CrossRef]
- Msinjili, N.S.; Gluth, G.J.G.; Sturm, P.; Vogler, N.; Khune, H.C. Comparison of calcined illitic clays (brick clays) and low-grade kaolinitic clays as supplementary cementitious materials. Mater. Struct. 2019, 52, 1–14. [Google Scholar] [CrossRef]
- Zibouche, F.; Kerdjoudj, H.; d’Espinosede Lacaillerie, J.-B.; Van Damme, H. Geopolymers from Algerian metakaolin. Influence of secondary minerals. Appl. Clay Sci. 2009, 43, 453–458. [Google Scholar] [CrossRef]
- Abdullah, M.M.A.B.; Mimg, L.Y.; Yong, H.C.; Tahir, M.F.M. Clay-Based Materials in Geopolymer Technology. In Cement Based Materials; Intechopen: London, UK, 2018; pp. 239–264. [Google Scholar]
- Provis, J.L.; Lukey, G.C.; van Deventer, J.S.J. Do geopolymers actually contain nanocrystalline zeolites? A reexamination of existing results. Chem. Mater. 2005, 17, 3075–3085. [Google Scholar] [CrossRef]
- Ulcina, K.; Strepankova, H.; Rimal, V.; Hanzlitec, T.; Perna, I. NMR Study of aluminium Coordination in Clays. In WDS’13 22nd Annual Conference of Doctoral Students; MATFYZPRESS: Prague, Czech Republic, 2013; pp. 104–109. [Google Scholar]
- Matsuda, A.; Naruyama, I.; Meawad, A.; Pareek, S.; Araki, Y. Reactions, Phases and Microstructure of Fly Ash based Alkali-Activated Materials. J. Adv. Concr. Technol. 2019, 17, 93–101. [Google Scholar] [CrossRef]
- Gunasekara, C.; Law, D.W.; Setunge, S.; Burgar, I.; Brkjaca, R. Effect of Element Distribution on Strength in Fly Ash Geopolymers. ACI Mater. J. 2017, 114, 795–808. [Google Scholar] [CrossRef]
- Omegna, A.; van Bokhoven, J.A.; Prins, R. Flexible Aluminum Coordination in Alumino-Silicates. structure of Zeolites H-USY and Amorphous Silica-Alumina. J. Phys. Chem. B 2003, 107, 8854–8860. [Google Scholar] [CrossRef]
- Sperinck, S.; Raiteri, P.; Marks, N.; Wright, K. Dehydroxylation of kaolinite to metakaolin-a molecular dynamics study. J. Mater. Chem. 2011, 21, 2118–2125. [Google Scholar] [CrossRef]
- Tchakoute, H.K.; Melele, S.J.K.; Djamen, A.T.; Kaze, C.R.; Kamseu, E.; Nanseu, C.N.P.; Leonelli, C.; Ruscher, C.H. Microstructural and mechanical properties of poly(sialate-siloxo) networks obtained using metakaolins from kaolin and halloysite as aluminosilicate sources: A comparative study. Appl. Clay Sci. 2020, 186, 105448. [Google Scholar] [CrossRef]
- Slaný, M.; L, J.; Madejová, J. Structural characterization of organo-montmorillonites prepared from a series of primary alkylamines salts: Mid-IR and near-IR study. Appl. Clay Sci. 2019, 176, 11–20. [Google Scholar] [CrossRef]
- van Jaarsveld, J.G.S.; van Deventer, J.S.J.; Lukey, G.C. The effect of composition and temperature on the properties of fly ash- and kaolinite-based geopolymers. Chem. Eng. J. 2002, 89, 63–73. [Google Scholar] [CrossRef]
- Davidovits, J. Geopolymer Chemistry and Applications; Geopolymer Institute: Saint Quinten, France, 2008. [Google Scholar]
- Valcke, S.L.; Pipilikaki, A.P.; Fischer, H.R.; Verkuijlen, M.H.W.; van Eck, E.R.H. FT-IR and 29Si-NMR for evaluating aluminium–silicate precursors for geopolymers. Mater. Struct. 2014, 48, 557–569. [Google Scholar] [CrossRef]
- Zhang, Z.; Wang, H.; Provis, J.L. Quantitative study of the reactivity of fly ash in geopolymerization by FTIR. J. Sustain. Cem. Based Mater. 2012, 1, 154–166. [Google Scholar] [CrossRef]
- Phair, J.W.; van Deventer, J.S.J. Effect of silicate activator pH on the leaching and material characteristics of waste-based inorganic polymers. Miner. Eng. 2001, 14, 289–304. [Google Scholar] [CrossRef]
Publisher’s Note: MDPI stays neutral with regard to jurisdictional claims in published maps and institutional affiliations. |
© 2021 by the authors. Licensee MDPI, Basel, Switzerland. This article is an open access article distributed under the terms and conditions of the Creative Commons Attribution (CC BY) license (http://creativecommons.org/licenses/by/4.0/).