Article

Facile Hydrothermal and Solvothermal Synthesis and Characterization of Nitrogen-Doped Carbon Dots from Palm Kernel Shell Precursor

by
Yakubu Newman Monday
1,2,
Jaafar Abdullah
1,3,*,
Nor Azah Yusof
1,3,
Suraya Abdul Rashid
3 and
Rafidah Hanim Shueb
4
1
Department of Chemistry, Faculty of Science, University Putra Malaysia (UPM), Serdang 43400, Selangor, Malaysia
2
Department of Chemistry, Faculty of Science, Federal University Lokoja, 260103 Kogi State, Nigeria
3
Institute of Advanced Technology, University Putra Malaysia, Serdang 43400, Selangor, Malaysia
4
Department of Medical Microbiology & Parasitology, School of Medical Sciences, Universiti Sains Malaysia, Kubang Kerian 16150, Kelantan, Malaysia
*
Author to whom correspondence should be addressed.
Appl. Sci. 2021, 11(4), 1630; https://doi.org/10.3390/app11041630
Submission received: 21 October 2020 / Revised: 6 November 2020 / Accepted: 4 December 2020 / Published: 11 February 2021
(This article belongs to the Section Materials Science and Engineering)

Abstract

:
Carbon dots (CDs), a nanomaterial synthesized from organic precursors rich in carbon content with excellent fluorescent property, are in high demand for many purposes, including sensing and biosensing applications. This research focused on preparing CDs from natural and abundant waste, palm kernel shells (PKS) obtained from palm oil biomass, aiming for sensing and biosensing applications. Ethylenediamine and L-phenylalanine doped CDs were produced via the hydrothermal and solvothermal methods using one-pot synthesis techniques in an autoclave batch reactor. The as-prepared N-CDs shows excellent photoluminescence (PL) property and a quantum yield (QY) of 13.7% for ethylenediamine (EDA) doped N-CDs (CDs-EDA) and 8.6% for L-phenylalanine (L-Ph) doped N-CDs (CDs-LPh) with an excitation/emission wavelength of 360 nm/450 nm. The transmission electron microscopy (TEM) images show the N-CDs have an average particle size of 2 nm for both CDs. UV-Visible spectrophotometric results showed C=C and C=O transition. FTIR results show and confirm the presence of functional groups, such as -OH, -C=O, -NH2 on the N-CDs, and the X-ray diffraction pattern showed that the N-CDs were crystalline, depicted with sharp peaks. This research work demonstrated that palm kernel shell biomass often thrown away as waste can produce CDs with excellent physicochemical properties.

1. Introduction

Carbon dots (CDs) are a nanomaterial synthesized from organic precursors discovered by the Xu research group in 2004 when they were purifying single-wall carbon nanotubes (SWNTs) [1,2,3]. CDs are in high demand and have caught researchers’ keen interest because of their peculiarly low toxicity, suitable photoluminescence property, excellent water-solubility, dispersibility, broad range emission spectrum, biocompatibility, and high resistance to photobleaching. These features are responsible for their photocatalysis, electrocatalysis, chemical/biosensing, and bioimaging applications [4,5]. Unlike semiconductor-based quantum dots (QDs) and some conventional organic dyes with similar properties, they are characterized by an inherent low water solubility and toxicity issues [6].
CDs are spherical or quasi-spherical crystalline and sometimes amorphous carbon-based nanostructures with quantum confinement properties [7,8]. Like other carbon families, such as carbon nanotubes (CNTs), fullerene, graphene nanosheets (GNS) carbon quantum dots (CQDs), and graphene quantum dots (GQDs), it is a material that shows both amorphous or crystalline zero-dimensional carbonaceous properties, or is based on the composition of precursors with sizes smaller than 10 nm. It exhibits properties between CQDs and GQDs. It consists of nanocrystalline cores with a sp2 conjugated carbon system embedded within an amorphous matrix of sp3 carbon structures with significant surface defects due to surface oxidation during synthesis [2,9,10,11,12].
Intense research is ongoing with respect to CDs, one of the most exciting nanomaterials characterized by its broad applicability in biotechnology and biomedical sciences, the field of engineering, and other advanced technologies due to its facile preparation procedures. CDs application offers enhanced accuracy in detection and diagnostic techniques when applied as biosensors and organ targeted drug delivery [7,13,14,15]. Hence, CDs have been used for diagnostic, bioimaging, and sensor design [6,16,17,18]. The excellent photoluminescence or optical property is responsible for its application in fluorescence imaging and fluorescence-based DNA biosensor for the detection of pathogens [19].
CDs are materials with pronounced optical and electronic properties, which are a function of its particle size and chemical composition [20]. The particle size is affected by the concentration of reactants precursors, temperature, reaction time, additives, surfactant, and synthetic route [6,21,22]. There are two approaches to CDs synthesis. The first approach is the top-down method involves laser ablation technique, electrochemical/electro-oxidation process, and shedding or exfoliation of carbon soot. The second approach is the bottom-up approach, such as thermal pyrolysis, microwave irradiation, and hydrothermal/solvothermal treatment [4,6,23,24,25,26].
The top-down approach fabricates CDs by way of cleavage of larger carbon structures, such as carbon fibre, carbohydrate, carbon soot, and activated carbon into nanosized carbon particles [27,28,29,30]. The process uses techniques such as ball milling, chemical oxidation [31], lithography/chemical ablation or chemical etching [32], electrochemical oxidation [33], and ultrasonic methods [34]. The bottom-up approach involves the decomposition of a large molecular precursor, and subsequent growth of a nanosized monodispersed colloidal materials from the decomposed molecules [35] as exemplified in polymerization reactions leading to giant molecules from smaller ones. The bottom-up approach leads to the creation of CDs piece by piece in nanoscale size [3,27,36,37,38,39].
The synthetic route for the fabrication of CDs reported in literature includes the carbonization of smaller organic molecules through condensation, polymerization, carbonization, and passivation or functionalization with functional groups of choice. The process involves forming chains of small compounds by amidation, aldol condensation, Schiff base condensation, and a radical reaction process. The process leads to the creation of clusters of molecules known as polymerized molecules held by covalent and non-covalent or other dipole–dipole interactions [7,40].
CDs are fabricated nowadays by green synthesis routes. The process involves using natural materials rich in carbon as the precursors, even though they lack the requisite purity to produce very homogenous CDs [1,41]. Precursors such as fruits of Platanus biomass [42], banana juice [43], willow back [44], soya milk [45], lemon juice [46], ginkgo fruits juice [47], lychee seed [48], sugar [49], waste papers [41], magnolia flower [50], peels of fresh fruits/vegetables [51], and hemicellulose [52] have been sources of CDs synthesis.
Hence, in this research, the synthesis of CDs from palm kernel shell (PKS) doped with ethylenediamine (EDA) and L-phenylalanine (L-Ph) has been explored with the photoluminescence quantum yield studied. Photoluminescence quantum yield is a figure of merit for the optical performance of CDs and fluorophore. It reveals the photon’s intensity or nanomaterials’ brightness and strength against photobleaching and photostability in its fluorescence application [46,53,54].
As shown in Figure 1, PKS consists mainly of cellulose, hemicellulose, and lignin [55,56]. The thermal reduction of PKS in an inert nitrogen environment converts the cellulose, hemicellulose, and lignin in PKS biomass to a black graphitic carbonaceous material, especially at a temperature above 400 °C for more than 2 h carbonization time [42,55,57]. In this work, CDs were synthesized from the carbonized palm kernel shell (CPKS) using a hydrothermal autoclave technique that offers simplicity and produces spherical CDs of approximately uniform sizes [57,58]. This study was a green synthesis of CDs based on the non-toxic precursor used to create CDs of high fluorescence and photoluminescence quantum yield for application in biosensor development.

2. Materials and Methods

2.1. Materials

The following materials, chemicals, and reagents used in this research work were all of the analytical grade. Ultra-pure water (Milli-Q), having a resistivity of 18.2 mΩ/cm from Thermo Scientific Barnstead smart2pure system (Fisher Scientific, Loughborough, UK). Ethylenediamine (EDA) (Acros Organics, Belgium, USA), L-phenylalanine (Fisher Scientific, Kanagawa, Japan), sodium hydroxide (NaOH) (R. & M. Chemicals, Essex, UK), absolute ethanol (EtOH) (Fisher Scientific, Loughborough, UK), hydrochloric acid (HCl), sulphuric acid (H2SO4), quinine sulfate (Fisher Scientific, Loughborough, UK), and Munktell filter paper 110 mm with 3–5 μm pore size (Ahlstrom, Falun, Sweden), syringe filter 25 mm with 0.22 μm pore size (CNW Technologies, Shanghai, China).

2.2. Characterization Instruments

Vecstar Muffle furnaces (Power: 3 KW, Max Tem.: 1600 °C, Max Cont.: 1500 °C) were used for the carbonization of the powdered palm Kernel Shell while, Protech Oven: Model FAC-50 Malaysia, was used for the heating of the Autoclave and Autoclave batch reactor for the synthesis of the CDs. Optical properties measurements were performed at room temperature using the Spark multimode microplate reader, Ultraviolet-visible spectrophotometer (UV-Visible Spectrophotometer: Infinites F500, TECAN, Ltd., Mannedorf, Switzerland) for photoluminescence (PL) emission spectra measurements at 360 nm and Perkin Elmer Lambda 35 UV-Visible Spectrophotometer, USA, was used to record the absorbance of the CDs, between 200 nm to 700 nm. A Fourier-transform infra-red spectrophotometer (FTIR) was run to determine the functional groups on the CDs, Transmission Electron Microscopy (TEM), X-ray Diffraction study and Dynamic light scattering (DLS) measurement with a Zetasizer Nano ZS instrument (Malvern Instruments, Malvern, UK) were carried out for the surface morphology and surface charge determination of the CDs [59,60,61,62,63].

2.3. Preparation of Palm Kernel Shell

The palm kernel shell (PKS) biomass used as precursors in this research work was bio-agricultural waste collected from Perusahaan Minyak Sawit Bintang (Johor, Malaysia). The KPS samples were washed thoroughly several times with distilled-deionized water and air-dried. It was then dried in an oven at 70 °C and crushed into powder [57,64].

2.4. Carbonization of Palm Kernel Shell

Three different PKS biomass material masses were weighed in an aluminum boat, namely 17.97 g, 20.14 g, and 18.58 g, as shown in Table 1, and placed in an inert atmosphere of nitrogen gas in a quartz tube, in the midpoint of the furnace heating chamber, as shown in Figure 2. The nitrogen gas was purged at a flow rate of 50 ccs/min through the quartz tube during the carbonization period at a temperature of 600 °C for 3 h at a 10 °C/min rise in temperature. Nitrogen gas was kept running for 3 h until the furnace chamber temperature was brought to 40 °C [42,57,65,66]. The percentage yield of the carbonized palm kernel shell (CPKS) materials was determined after the sample temperature reached room temperature by again weighing the carbonized materials using Equation (1) below:
Percentage   Yield   of   CPKS   =   MCPKS   ( E ) MPKS   ( C )   ×   100
where MCPKS is the mass of carbonized palm kernel shells, and MPKS is the mass of palm kernel shells, respectively [57,64,67].

2.5. Synthesis of Carbon Dots (CDs) Using Hydrothermal Method

N-doped CDs were synthesized via hydrothermal synthesis from CPKS. A 0.3 g of powdered CPKS was dissolved into the mixture of milli-Q water (15 mL), 1 M NaOH (3 mL), and ethylenediamine (EDA) (0.2 mL), then stirred for 30 min. The mixture transferred to an airtight Teflon-lined stainless-steel autoclave batch reactor for hydrothermal treatment at temperatures of 120–200 °C for 3 h and then brought to 40 °C after the reaction completed. The mixture was filtered using filter paper, and then it was again filtered using a filter syringe disc attached to a 20 mL syringe to obtain the N-CDs. Different ethylenediamine amounts (0.2–1.4 mL) and temperatures (120–200 °C) were investigated for the optimization study.
The CDs doped with L-phenylalanine (CDs-L-Ph) were prepared as the procedure above except that 15 mL ethanol replaced Milli-Q water as the solvent and a different amount of L-phenylalanine (60–140 mg) replaced EDA as the dopant. The as-synthesized CDs, CDs-EDA and CDs-L-Ph, were then adjusted to pH 7.5 and 7.8 using 2 M hydrochloric acid (HCl). The furnace set up for the CDs’ preparation illustrated in Figure 2 [15,68,69,70,71].

2.6. Measurement of Quantum Yields

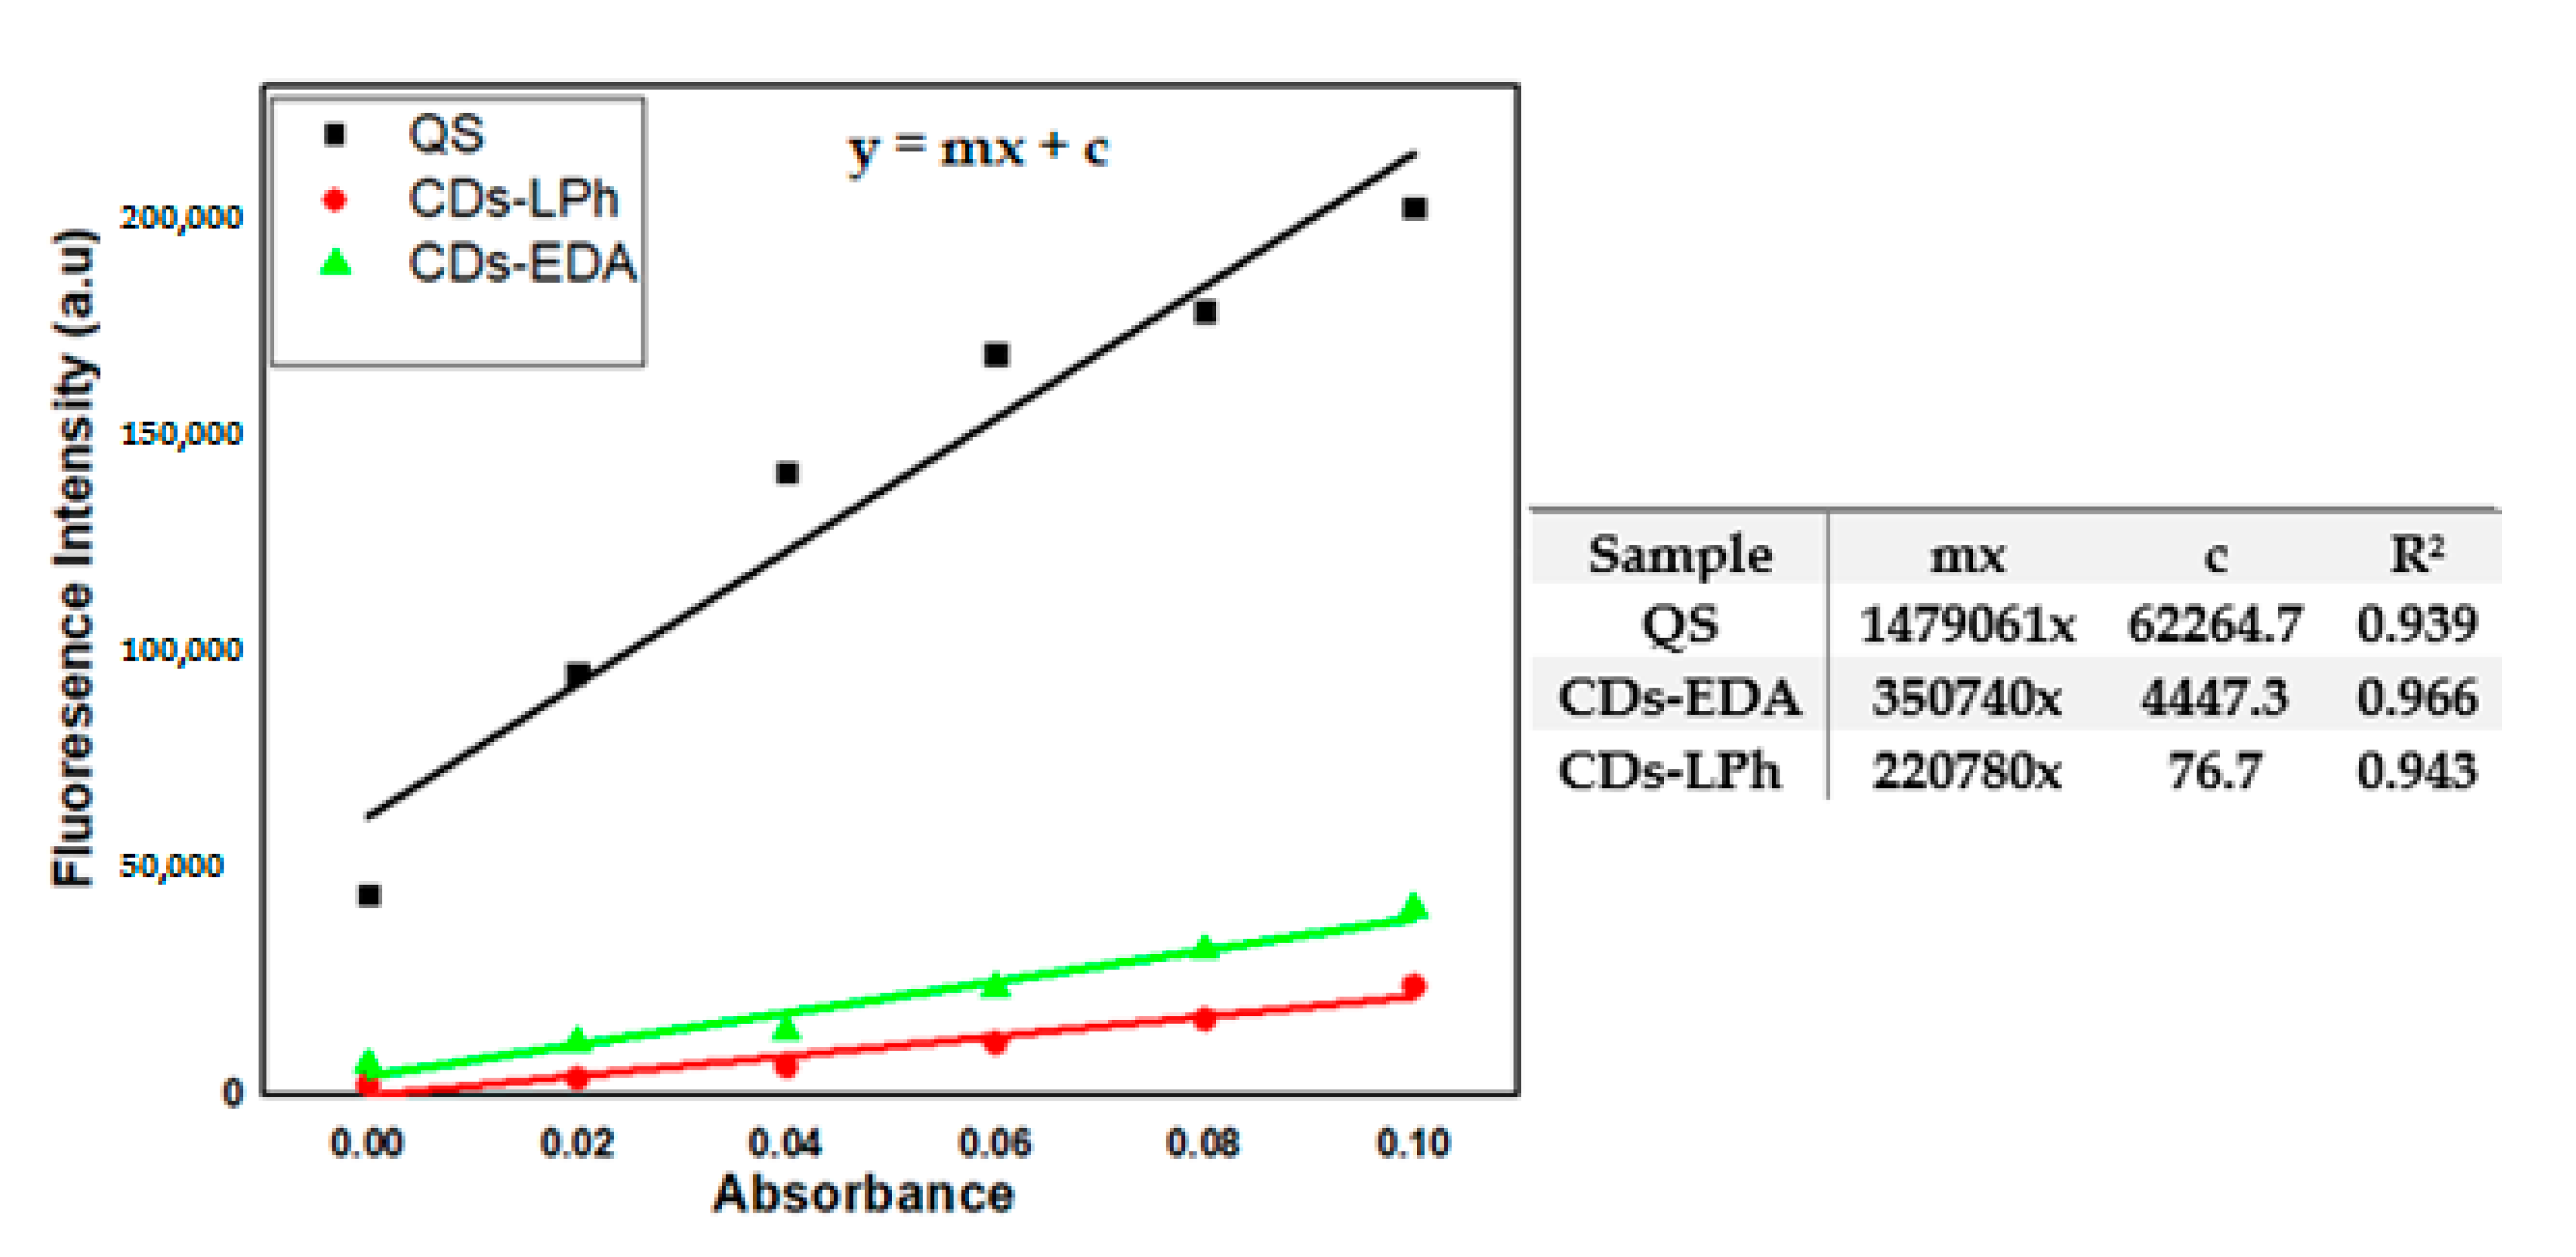
Quantum yield ( Փ Y ) of the synthesized CDs was estimated using a general refractive index of 1.384 from literature (1) by comparing the CDs with quinine sulfate as a reference compound (fluorophores). Quinine quantum yield reported as 0.53 when dissolved in 0.1 M H2SO4 has a refractive index η = 1.346. The quinine sulfate solution was prepared and diluted to have an optical density (OD) = 0.00, 0.02, 0.04, 0.06, 0.08, 0.1, and the synthesized CDs treated in the same manner. The Փ Y of CDs in water having refractive index η = 1.384 was estimated using Equation (3) obtained from Equation (2) because the absorbance values were components of the gradients:
Փ Y s = I . F . I s I . F . I S T × A s A S T × ( η s η S T ) 2 ×   Փ Y S T
Փ Y s = G r a d s G r a d S T ( η s η S T ) 2 ×   Փ Y S T
where Փ Y = the quantum yield, IFI is the integrated fluorescence intensity, Grad is the gradient from the plot of integrated fluorescence intensity versus absorbance, A = absorbance, η the refractive index, and the subscripts ST and S denote standard and test sample, respectively [1,26,46,72].

3. Results and Discussion

3.1. Carbonization of Palm Kernel Shell (PKS)

Figure 2 shows the instrumentals for the pyrolytic carbonization of palm kernel shell (PKS) in an inert tubular nitrogen gas chamber of a furnace, which produced a black carbonaceous char with an average yield of 30.96% as tabulated in Table 1. The result agrees with other research groups [42,56]. Their analysis shows that the obtained char was about 30%, the char results from the thermal decomposition of cellulose, lignin, and hemicellulose in the PKS precursor. The average of 30.96% of char obtained in this work produced from the PKS consists of 20.8–27.7% cellulose, 21.6–22.3% hemicelluloses, and 44.0–50.7% lignin [56,73]. Previous studies affirmed that cellulose, hemicellulose, and lignin are the most abundant components of crude biomass materials, including PKS [7,22,55,58]. The studies postulated that the composition of biomass influences the derived carbonaceous material properties, and hence show the possible transformation of cellulose, hemicelluloses, and lignin to graphitic materials by the dehydration condensation process. The dehydration condensation process is one way to form carbonaceous materials or CDs when biomass, precisely, cellulose, hemicellulose, and lignin subjected to pyrolysis. The authors showed that the individual percentage conversion of the constituents of biomass was as follows: cellulose (9%), hemicellulose (0%), and lignin (39%) at 900 °C and 21%, 4.6% and 52% at 400 °C calcination temperature, respectively [7,22,55,58]. Jiang et al. and Nasir et al. have characterized the graphitic material obtained from the char of carbonized PKS to graphene oxide and reduced graphene oxide. The study showed that the highest percentage conversion of PKS to carbonaceous material was 32% at 400 °C [57,58]. The type of graphitic material produced after the carbonization depends on the material source, heating rate, and temperature condition of pyrolysis [56]. This study showed that the average percentage conversion of PKS to carbonaceous material was approximately 30.96% at 600 °C.

3.2. Synthesis and Characterization of CDs

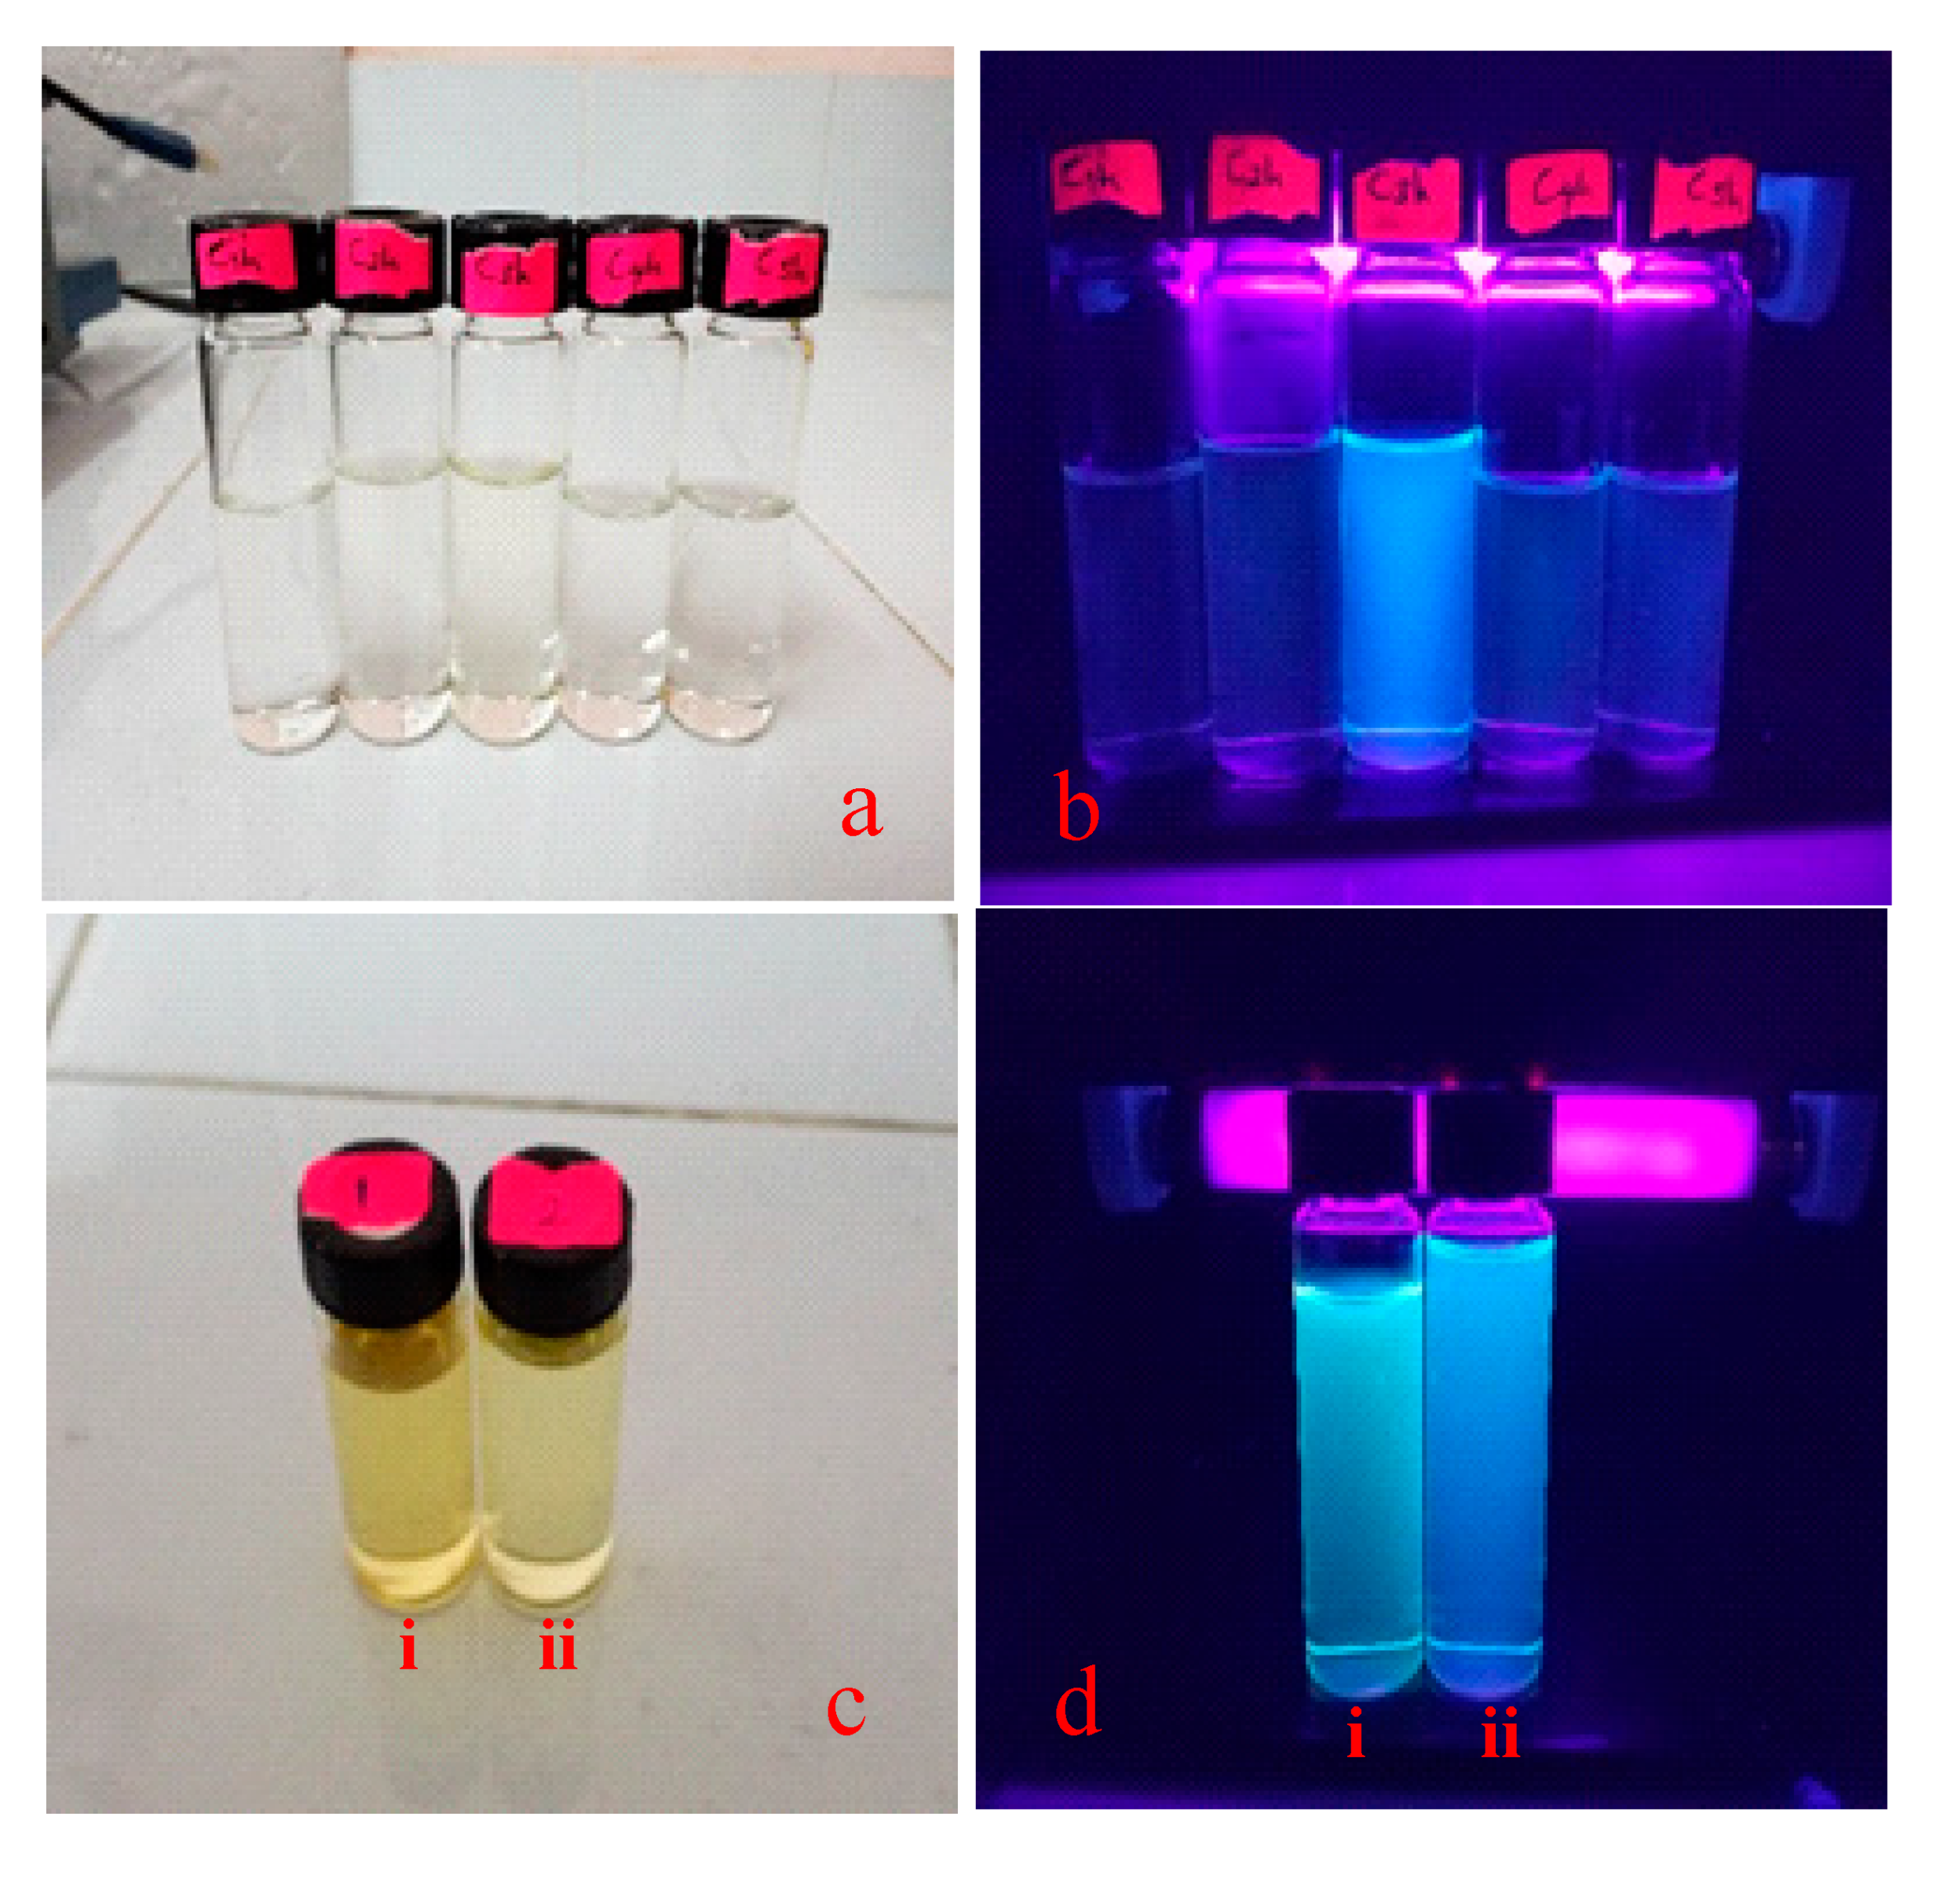
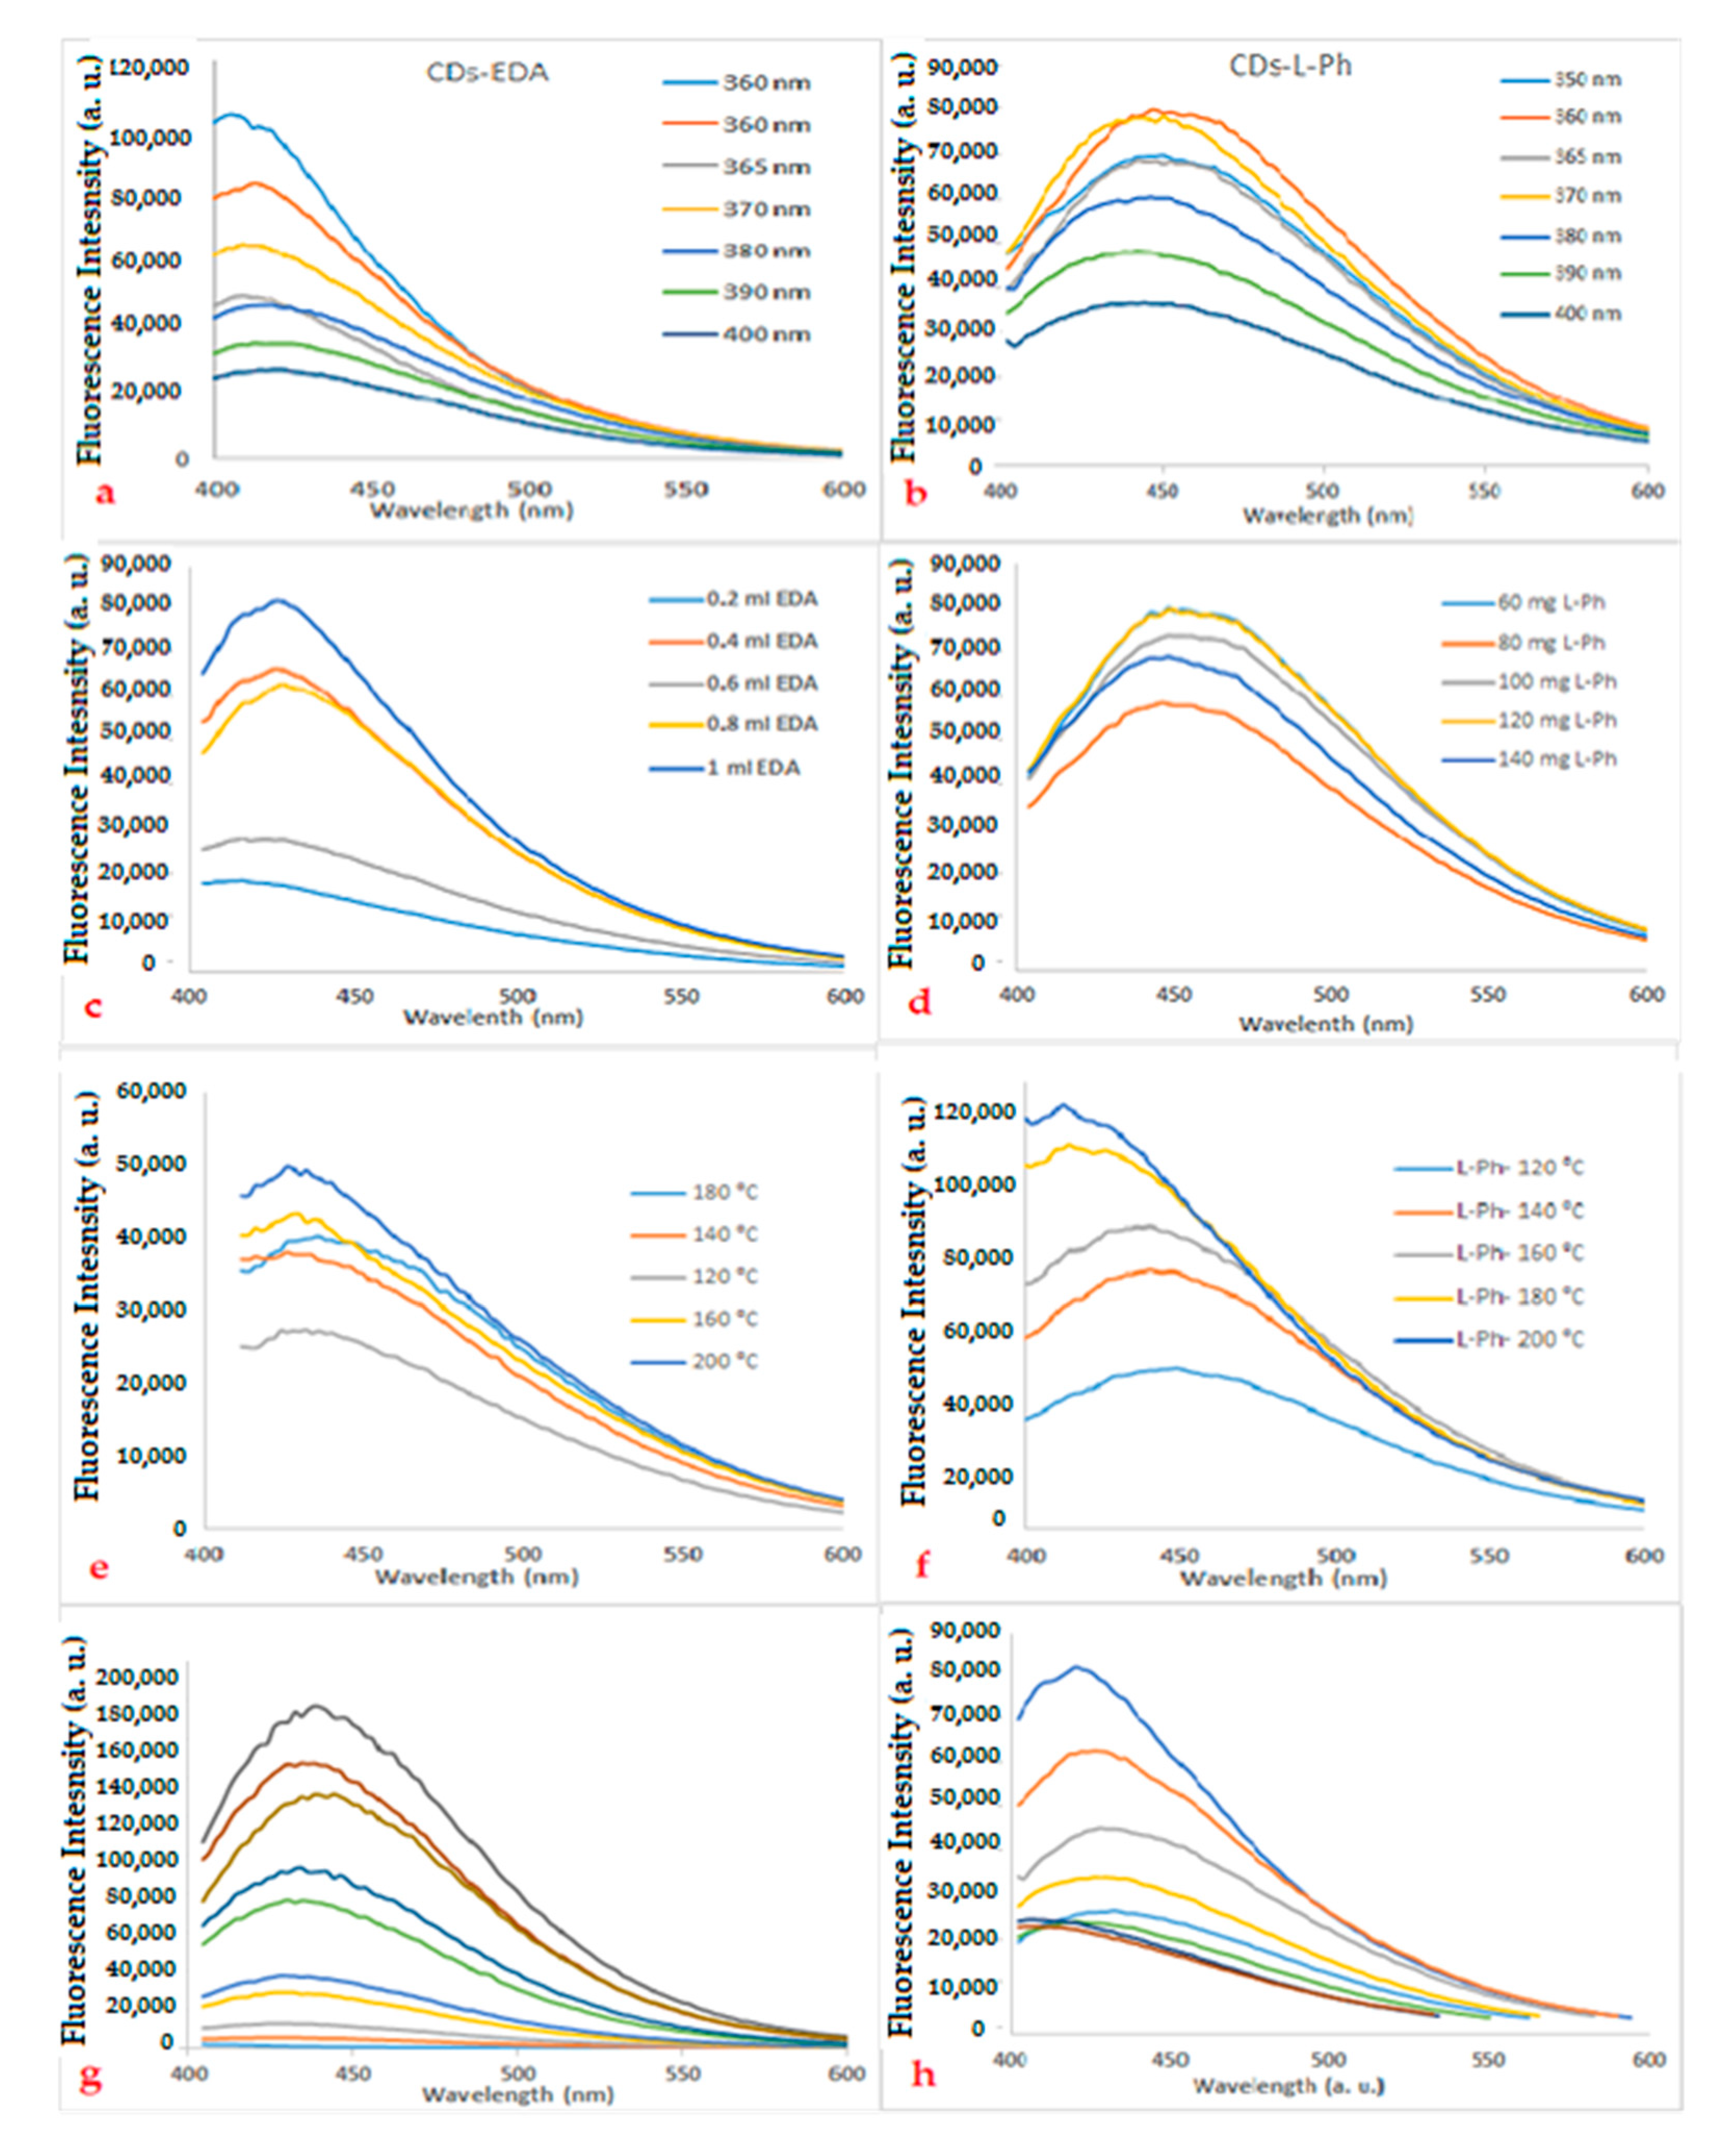
The hydrothermal/solvothermal synthesis of N-doped fluorescent CDs was prepared in a Teflon-lined autoclave batch reactor by a one-step synthesis procedure. Figure 3 displays the study of the effect of time on the synthesis of pristine CDs from the CPKS precursor without any dopant viewed (a) under normal light and (b) under UV-light. Figure 3c displayed (i) N-doped CDs with L-phenylalanine (CDs-L-Ph) and (ii) N-doped CDs using ethylenediamine (CDs-EDA) under normal light and Figure 3d(i) N-doped CDs with L-phenylalanine (CDs-L-Ph) and 3d(ii) N-doped CDs using ethylenediamine (CDs-EDA) viewed under UV-light showing fluorescence properties. The results show that subjecting CPKS to hydrothermal/solvothermal synthesis caused the material to undergo pyrolysis, nucleation, condensation, polymerization carbonization, and surface functionalization [1,22,46]. The aforementioned synthetic route or process is the approach for the fabrication of CDs, which changed the CPKS and resulted in photoluminescent crystalline CDs obtained in this research work [1,46,48]. The produced CDs emit a blue-violet colour at a wavelength between 430 and 450 nm when excited at a wavelength range of 350–400 nm in an alkaline medium, as shown in Figure 4a,b.

3.3. Optimization Parameter for the Synthesis of Carbon Dots (CDs)

The best reaction time for synthesis of the CDs determined at a fixed ratio of CPKS/H2O (20 mg/1 mL) treated hydrothermally from 1–5 h at 160 °C, without adding any dopants (Figure 3a). The results showed that the CDs synthesized for 3 h and 160 °C temperature fluoresced under UV light, as depicted in Figure 3b. Therefore, the best synthesis time of 3 h selected for this study and application study of CDs.
For surface passivation, ethylenediamine (EDA) and L-phenylalanine (L-Ph) were used as dopants to introduce N-atom possibly into the carbon nuclear lattice of the graphitic carbon of the CPKS materials and as well as to introduce amino (-NH2) functional group on the surface of the CDs [74] (Figure 3c). The synthesized CDs-EDA and CDs-L-Ph have shown fluorescence property when viewed under UV light indicating the CDs passivation process with the dopants still retain the fluorescence property of the CDs (Figure 3d).

3.3.1. Effect of Amount of Dopant

The impact of EDA’s volume on the as-prepared CDs-EDA’s fluorescence properties was studied by varying the amount of EDA from 0.2–1.0 mL, and the amount of CPKS, NaOH, and H2O was fixed at 0.3 mg, 3 mL (1 M) and 15 mL, respectively. As shown in Figure 4c, the fluorescence of CDs-EDA increases with an increase in EDA volume. A volume of 1 mL of EDA produced the highest fluorescence intensity with slight narrower peaks. The peaks become unimportantly small for optical consideration when the amount of EDA is above 1 mL. This observation in agreement with the work reported by [75]. The fluorescence peaks showed a slight redshift with an increase in the volume of EDA. Figure 4d shows L-Ph’s effect as a doping agent on the fluorescence properties of CD-LPh. The produced CDs-LPh show varied fluorescence intensities with different amounts of L-Ph used. The increasing quantity of L-Ph from 80–120 mg increases the fluorescence peaks, and maximum intensity observed at 120 mg of L-Ph. Above 1 mL of EDA for CDs-EDA and 120 mg of L-Ph for CDs-LPh, the fluorescence intensity decreases because the concentration of the functional groups functionalizing the CDs at the surface of the CDs increased to a point and overcrowded the surface of the CDs [3,75].

3.3.2. Effect of Temperature of Synthesis on CDs

The effect of different temperatures on the synthesized N-doped CDs and the fluorescence properties shows that the produced CDs’ intensity increases with increasing temperature of the synthesis [75]. Figure 4e shows the fluorescence intensity profile of the effect of temperature on the synthesized CDs-EDA. The fluorescence intensities showed incremental gradation with an increase in temperature from 120–200 °C with the highest synthesis temperature of 200 °C, delivering the highest fluorescence intensity. In Figure 4f, the effect of temperature on CDs-L-Ph’s fluorescence intensity was displayed. By varying temperature from 120–200 °C, the CDs showed increasing fluorescence intensity with a peak centred in the range of 420–450 nm. The maximum fluorescence peak obtained at 200 °C using an excitation wavelength of 360 nm. However, the fluorescence peak produced at 160 °C and 360 nm excitation wavelength appeared more stable for the two CDs. The fluorescence peaks become unstable above 160 °C, which may be due more to the high degree of carbonization than the degree of surface functionalization. The process leads to an irregular and narrow fluorescence peak [75]. Thus, the temperature of 160 °C was chosen for the CDs synthesis for stable and appreciably better fluorescence peaks produced at that temperature.

3.4. Determination of Photoluminescence Quantum Yield

The quantum yields of the prepared CDs were determined by comparing the photoluminescence properties of the CDs with that of quinine sulfate using a UV-Visible spectrophotometer for absorbance measurement and a Tecan Multimode reader for the fluorescence measurement [1,26,76]. The quantum yield obtained for the CDs-EDA was 13.5% with a concentration of 50.1 mg/mL, and CDs-LPh was 8.6% with a concentration of 10.0 mg/mL. The gradient of the plot of integrated fluorescence intensities of quinine sulfate, CDs-EDA, and CDs-LPh against their absorbances is shown in Figure 5. The quantum yield (QY) of CDs-EDA and CDs-L-Ph obtained in this study was also compared with other synthesized CDs. The QY of CDs got from other natural sources are Ginko fruit (3.33%) [47], mangosteen pulp (1.09%) [77], prawn shell (9%) [78], Pyrus pyrifolia or apple juice (4.27%) [79]. glucose (2.4%) [80], sugar cane bagasse (12.4%) [81], banana juice (8.95%) [43], microcrystalline cellulose (51%) [74], and Acacia concinna seed (10.2%) [82]. The obtained QY of 8.5% and 13.7% for the CDs shows that PKS biomass is a source for producing good quality and high QY CDs for optical imaging and other applications.

3.5. Transmission Electron Microscopy (TEM) and X-ray Diffraction Spectroscopy (XRD)

Figure 6 shows the results of transmission electron microscopy (TEM) for the morphological characterization of the as-synthesized CDs-EDA and CDs-LPh. The average particle size of CDs-EDA and CDs-LPh was estimated to be 2.10 ± 0.06 nm for CDs-EDA and 2.00 ± 0.06 nm for CDs-LPh, respectively. The shapes are all approximately spherical and are monodispersed with both CDs having visible lattice fringes with a lattice space of 0.23 nm according to the TEM results, which indicates crystallinity in the CDs [83]. The similar physical properties observed for the two types of CDs may be due to the precursors’ subjection to the same time and temperature of carbonization. The nanomaterials synthesized here in this research have similar shapes, particle size, and excitation/emission wavelengths at 360 nm/430 nm despite utilizing different dopants, and the different dopants may be responsible for the different levels of crystallinity and peak intensities of the CDs [1,65,75,83,84].
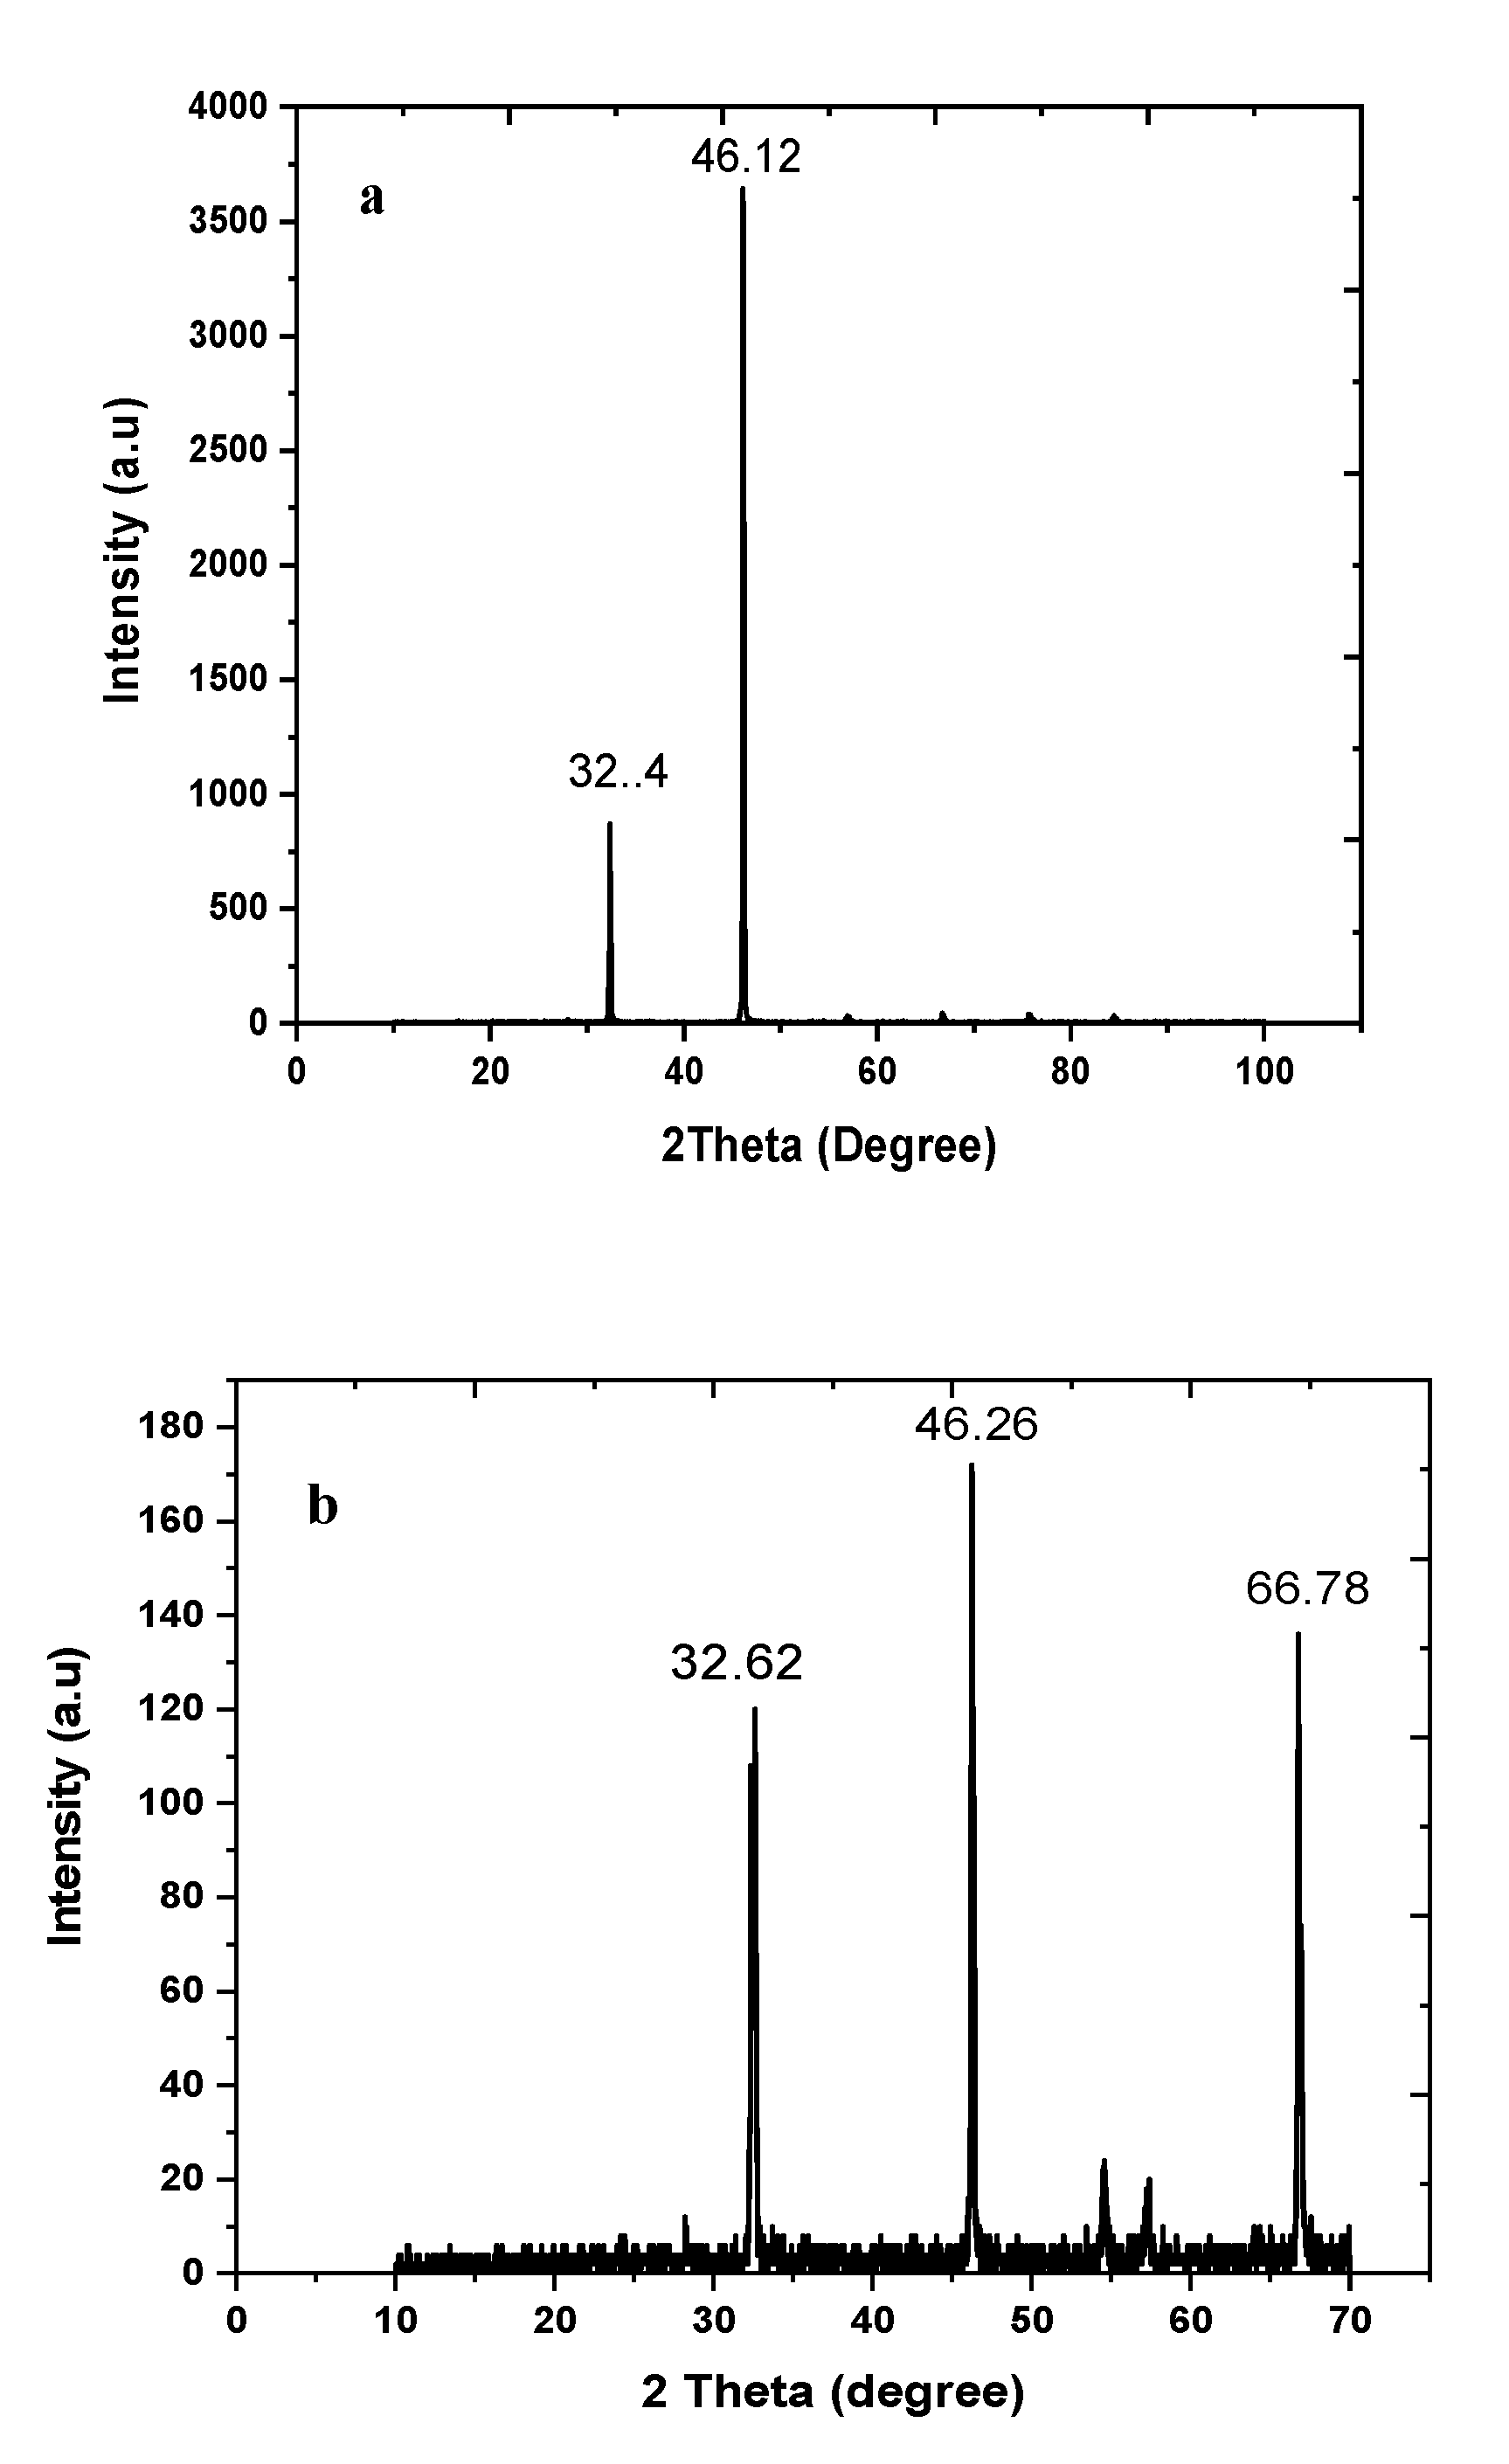
X-ray diffraction (XRD) technique is a fundamental analytical process that helps in studying, determining, and identifying powdered heteroatoms dopped CDs structure, purity, and crystallinity [85,86]. The XRD was based on diffraction angles of 0°–100° at a scan rate of 2.00 (°/min) at room temperature. The XRD data in Figure 7a,b were obtained to ascertain the CDs’ crystallinity, nature, and purity. CDs-EDA shows very sharp absorption peaks at 32.4° and 46.12°. In comparison, CDs-L-Ph peaks ere at 32.62°, 46.26°, and 66.78° at two theta angle measurements for diffraction angles between 32° and 47° for CDs-EDA and 30° to 70° for CDs-L-Ph, which is an indication of high crystallinity of the CDs samples [86]. Though the two CDs have similar optical properties and size, this difference may be due to the different dopants used in their fabrication.

3.6. UV-Visible Spectroscopy

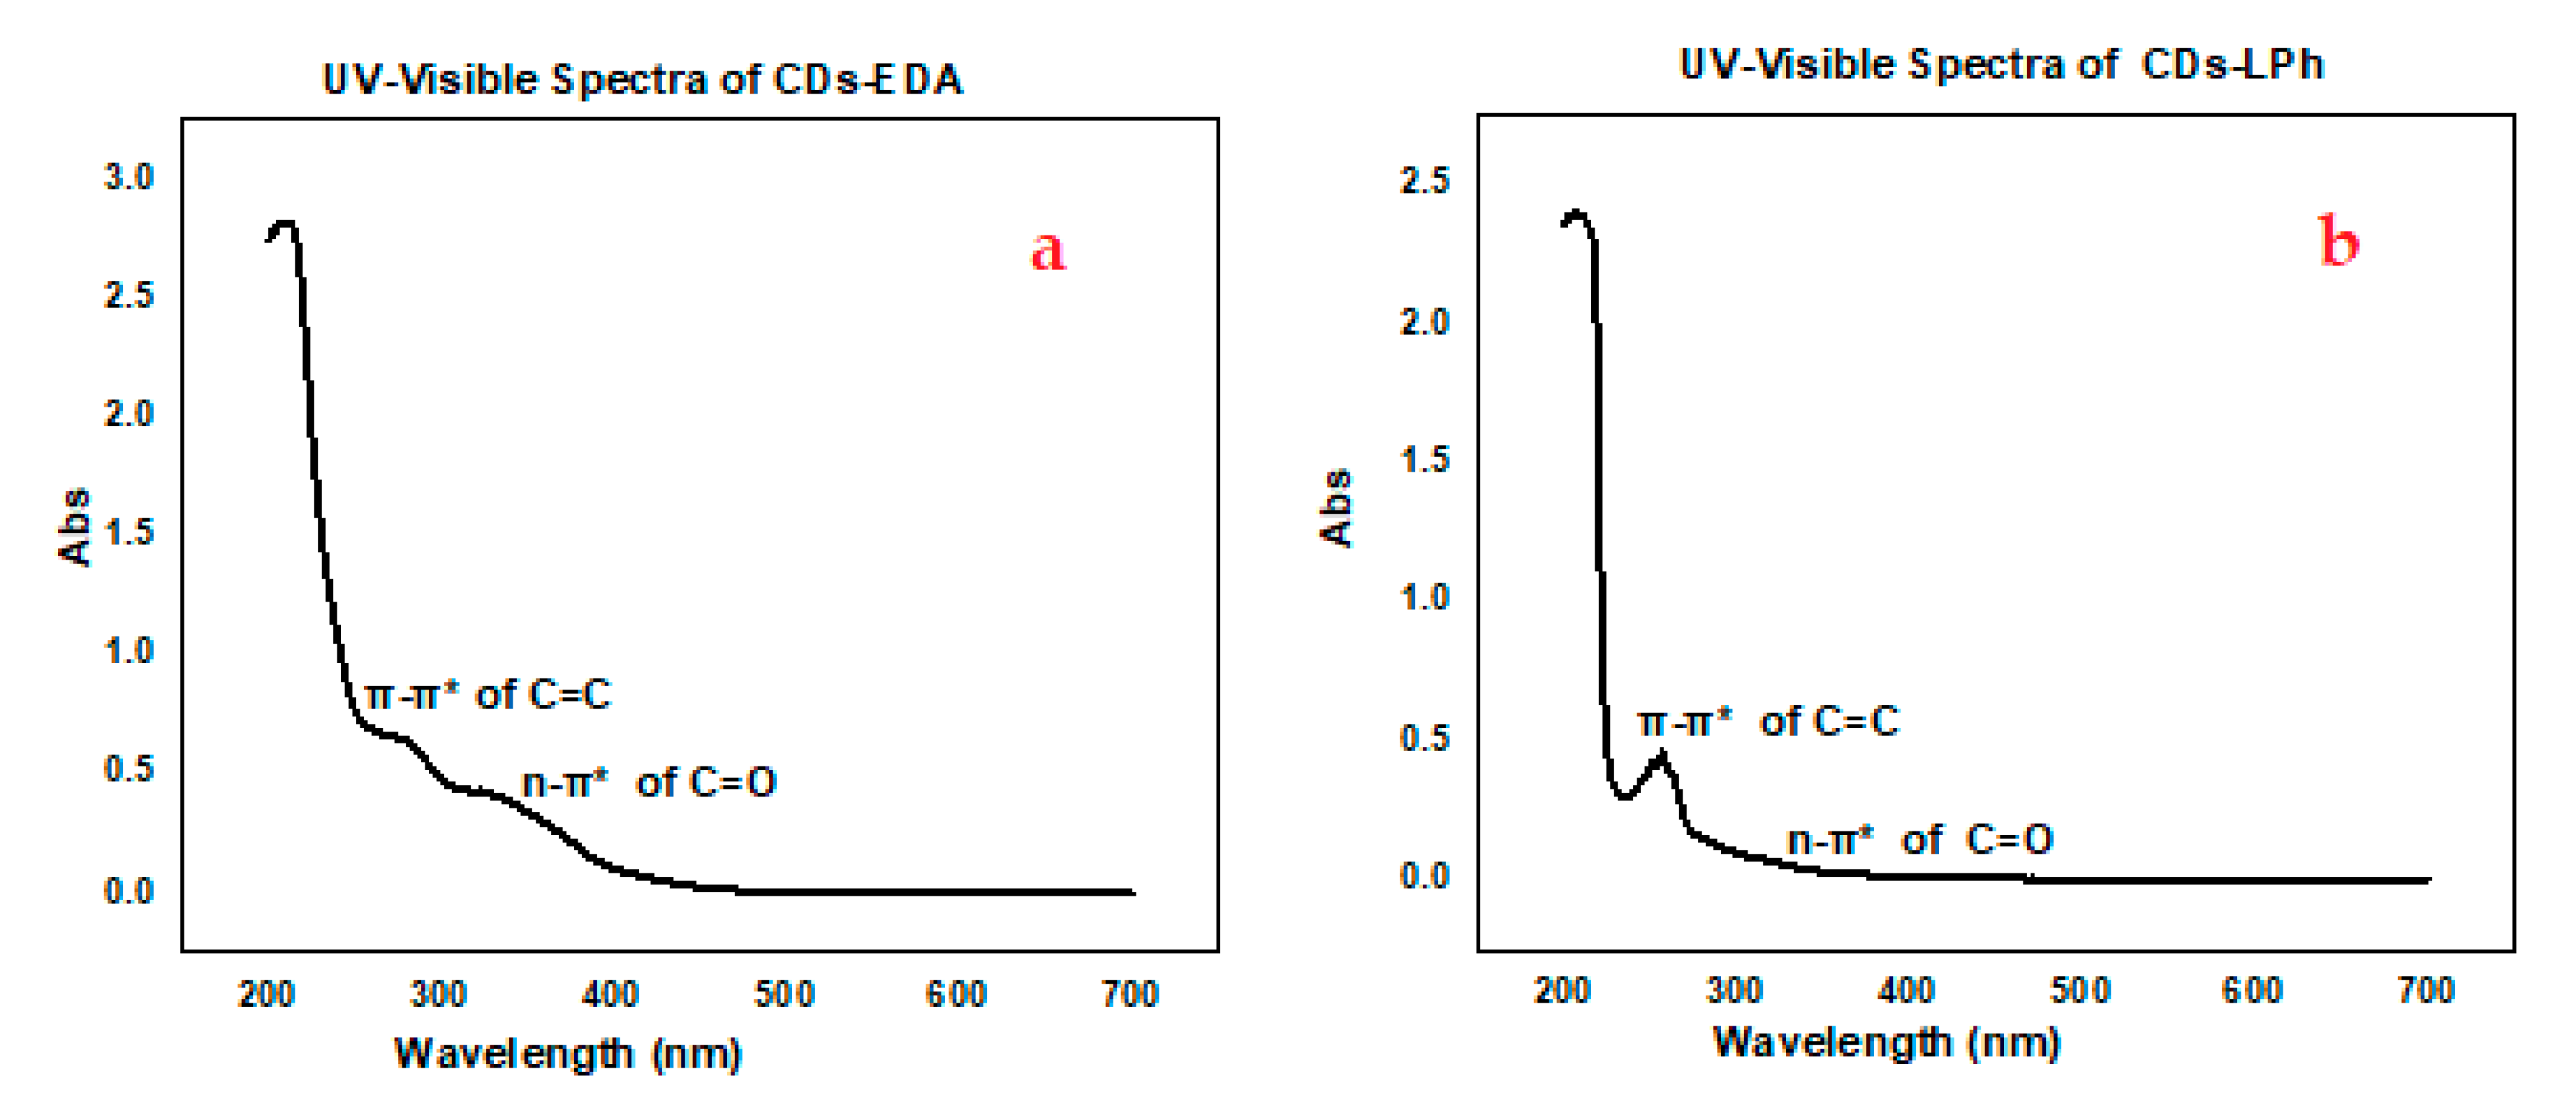
The UV-visible spectroscopic study measures the absorptivity of CDs, and it is a fundamental property of materials and nanomaterials. The CDs showed colour between indigo to blue under UV-light and emission wavelength between 430–450 nm. The specific emission wavelength is related to the colour absorbed by the substance producing the emission. Therefore, the measure of the absorptivity of CDs using a UV-Visible spectrophotometer, among other parameters, can be a quantitative and qualitative characterization technique for the CDs [1]. The UV-Visible spectroscopic measurement of the samples was obtained by scanning the wavelength between 200–700 nm (Figure 8). It shows prominent absorption peaks at 260–280 nm and 320–340 nm. The peak at 260–280 nm corresponds to π-π* transition of aromatic C=C bonds from the core sp2 hybridized carbon fragments and the conjugated π nanodomain within the carbon dots structure. The peak at 320–340 nm, were attributed to the n-π* transition of non-bonding electrons in C=C and C=O, an attribute from the molecular state of the carbon dots [1,87,88].

3.7. Fourier-Transform Infra-Red (FTIR) Spectroscopy

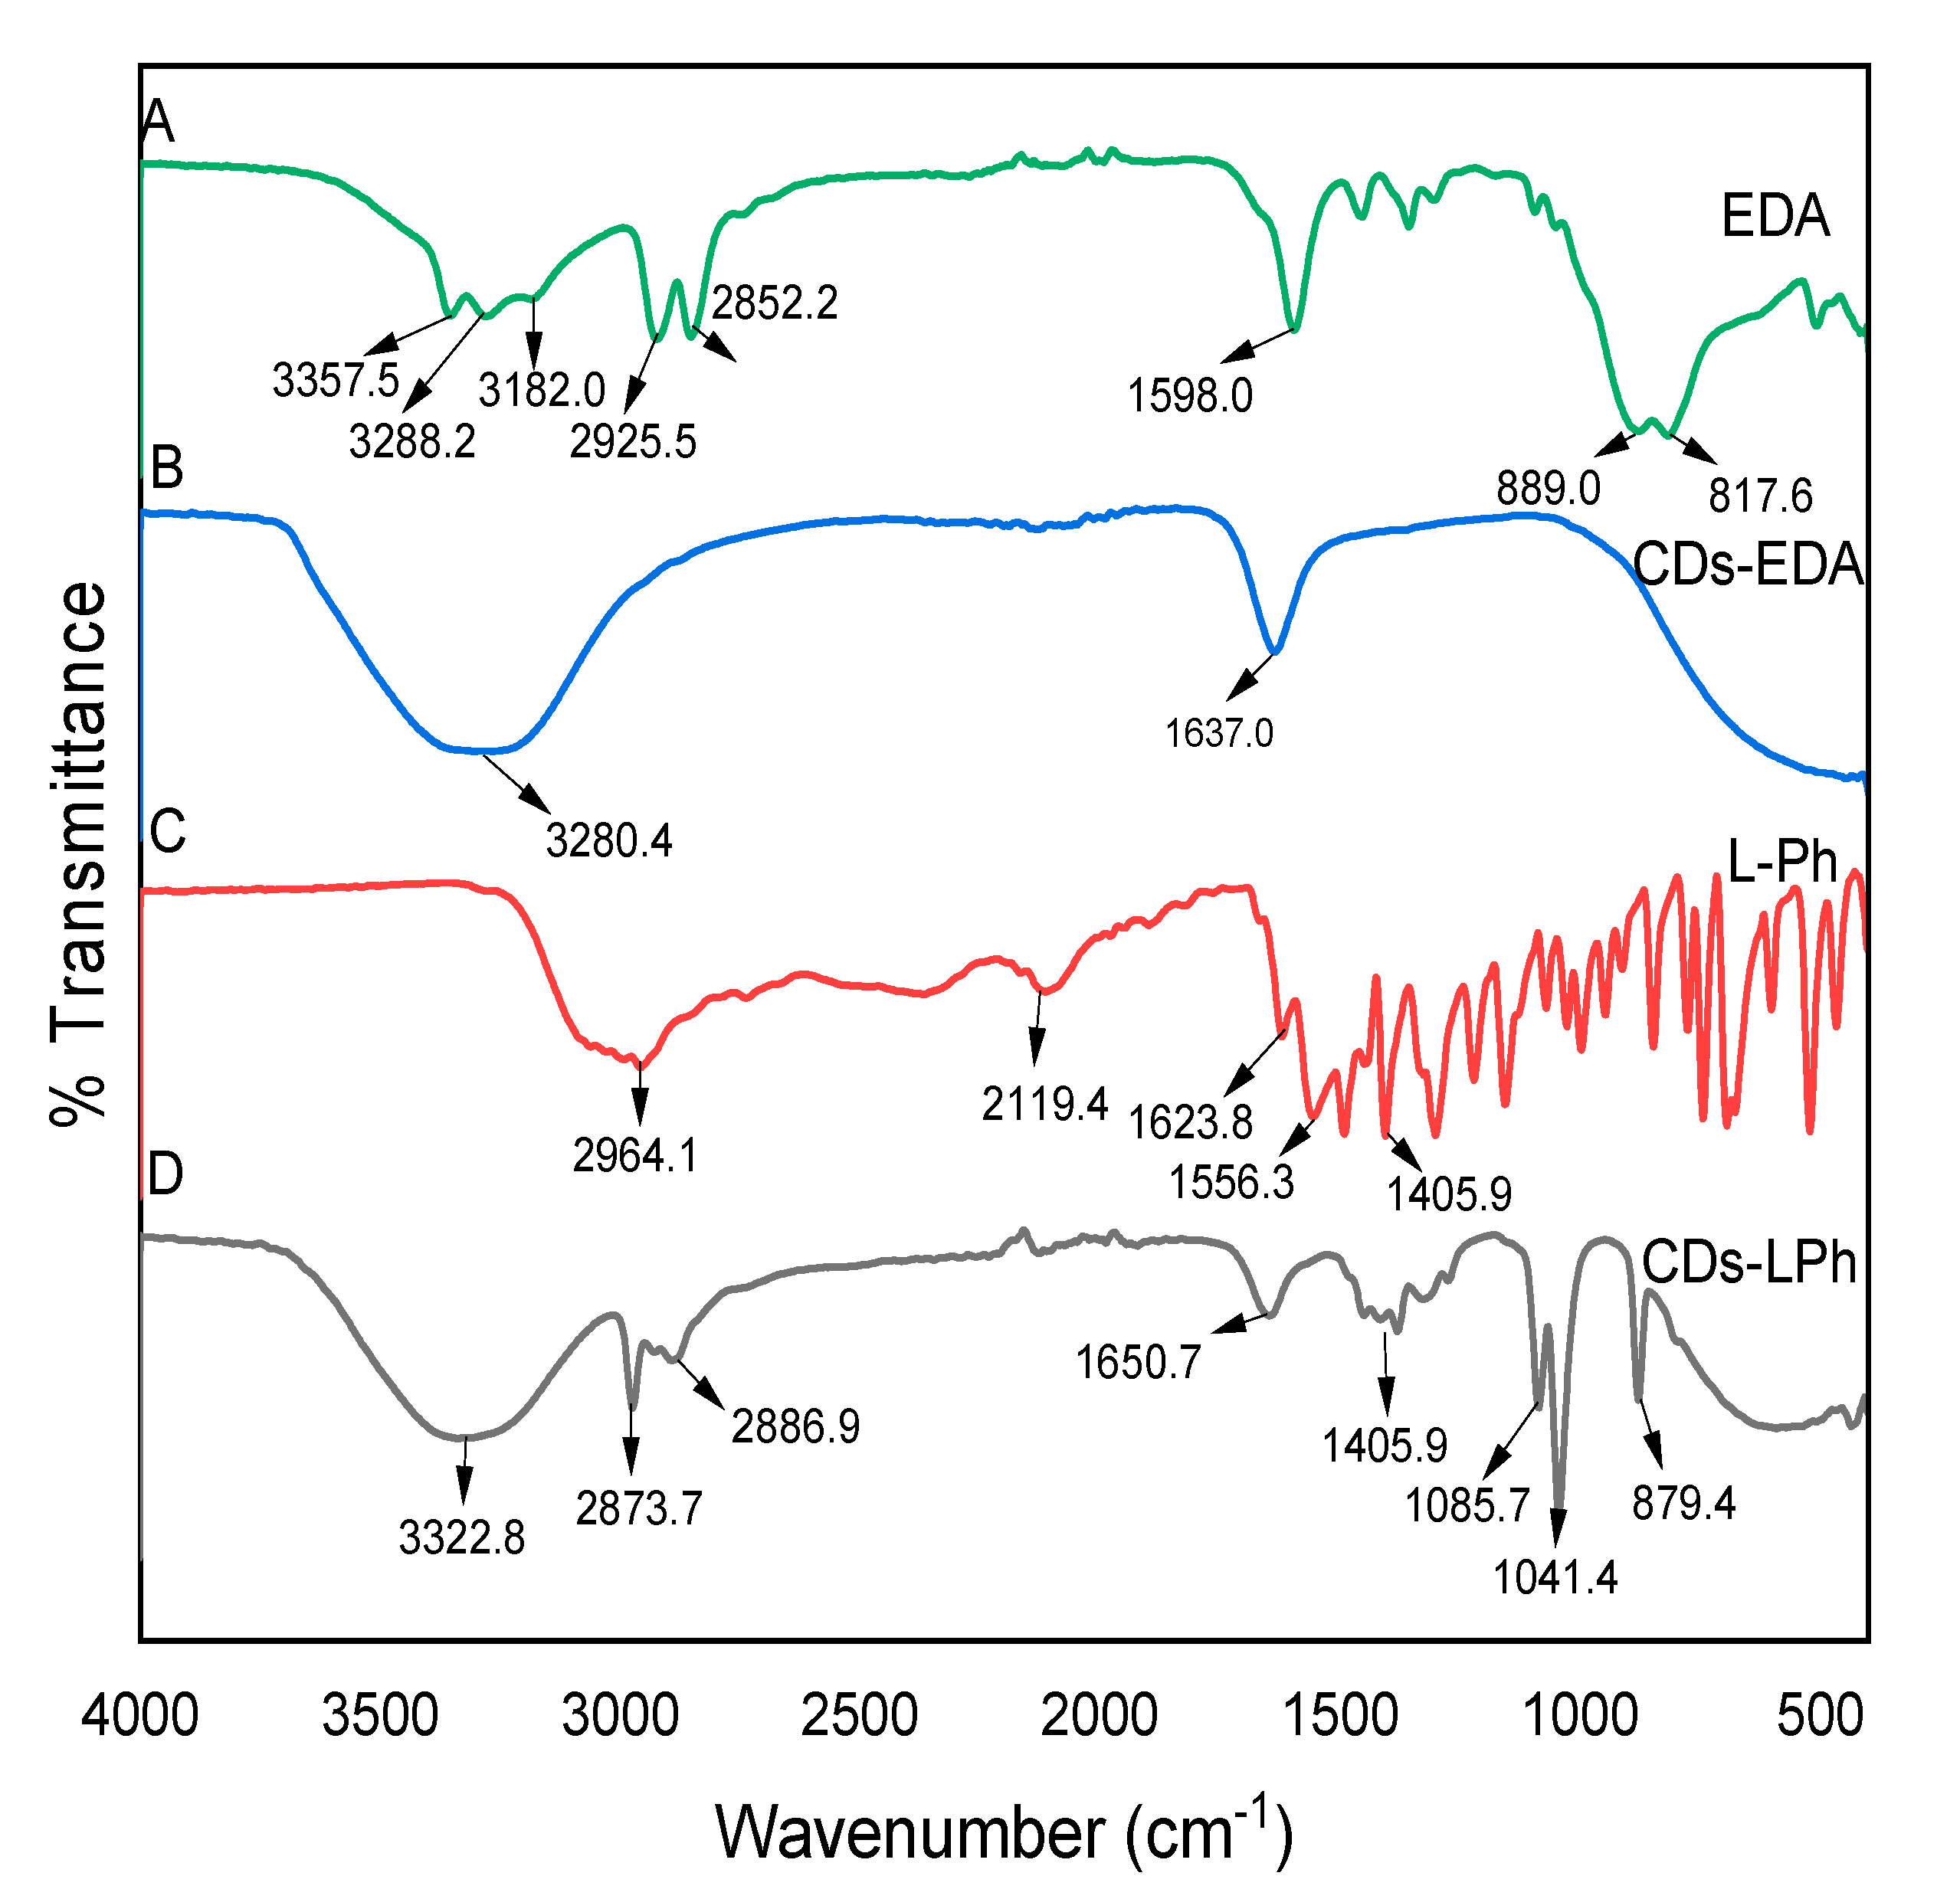
Figure 9A–D shows the FTIR spectra of EDA, CDs-EDA, L-Ph, and CDs-LPh obtained to ascertain the functional group present on the CDs. The model is showing the absorption bands of EDA (A) and CD-EDA (B) with the EDA spectra showing peaks at 3357.4 and 3288 cm−1, which correspond to -N-H stretching of primary aliphatic amines [39,89,90]. FTIR with medium or small and broad absorption bands around 3500–3200 cm−1 could correspond to N-H aliphatic amine [91] but, the peaks were absent in L-Ph maybe because there was only one molecule of -NH2 in L-Ph, making NH2 less abundant to be detected, the broad and medium absorption band at 2964.1 cm−1 in L-Ph is due to -OH of carboxylic acid stretching. A functional group appeared around 1650–1590 cm−1 for all the bands, which corresponds to the -NH2 scissoring vibration of a primary amine. The amino-functional group appeared in all the four bands, signifying the presence of amine in the EDA, CDs-EDA, L-Ph, and CDs-LPh. By extension, this confirmed the functionalization of amine on the surface of the carbon dots (CDs-EDA and CDs-Lph), respectively. The CDs show similar broad and intense peaks at 3280.4 cm−1 (CDs-EDA) and 3322.8 cm−1 (CDs-LPh), corresponding to normal polymeric hydroxyl (O-H) stretching vibration, an indication that the CDs has -OH functional group. The other peaks at the fingerprint region at 1360.0 cm−1 (CDs-LPh), 1405.9 cm−1, 1085.7 cm−1, 1041.4 cm−1, and 879.4 cm−1 could be due to sp2 and sp3 stretching vibrations and out-of-plane bending modes of C-H groups [1,92].

4. Conclusions

This research successfully produced hydrothermal/solvothermal CPKS derived N-doped CDs. The fabricated CDs characterization showed that the manufactured CDs possessed high-intensity fluorescence with good quantum yield value. The as-prepared CDs have shown excellent water solubility, dispersibility, with a stable excitation/emission wavelength of 360 nm/430 nm at neutral pH, which could have a suitable application in biosensing. Two CDs with two different doping agents (EDA and L-Ph) having unique fluorescence properties that increase with an increasing volume of the dopants fabricated. This research work demonstrated that palm kernel shell biomass often thrown away as a waste can be used to produce CDs with sterling physicochemical properties.

Author Contributions

Y.N.M.: methodology, investigation, formal analysis, writing—original daft; J.A.: supervision, conceptualization, funding acquisition, writing—review & editing; N.A.Y.: supervision, comment & suggestion; S.A.R.: supervision, comment & suggestion; R.H.S.: supervision, comment & suggestion. All authors have read and agreed to the published version of the manuscript.

Funding

This study was funded by University Putra Malaysia under Putra Grant (GP-IPB/2016/9515403).

Acknowledgments

The authors acknowledge Perusahaan Minyak Sawit Bintang, Lot 1998, Mukim Chaah, Off Jalan Yong Peng-Paloh, Batu Pahat, Johor, Malaysia for supplied the palm oil biomass waste.

Conflicts of Interest

The authors declare no conflict of interest.

References

  1. Pudza, M.Y.; Abidin, Z.Z.; Abdul-Rashid, S.; Yassin, F.M.; Noor, A.S.M.; Abdullah, M. Synthesis and Characterization of Fluorescent Carbon Dots from Tapioca. ChemistrySelect 2019, 4, 4140–4146. [Google Scholar] [CrossRef]
  2. Xu, X.; Ray, R.; Gu, Y.; Ploehn, H.J.; Gearheart, L.; Raker, K.; Scrivens, W.A. Electrophoretic Analysis and Purification of Fluorescent Single-Walled Carbon Nanotube Fragments. J. Am. Chem. Soc. 2004, 126, 12736–12737. [Google Scholar] [CrossRef] [PubMed]
  3. Zhou, Y.; Desserre, A.; Sharma, S.K.; Li, S.; Marksberry, M.H.; Chusuei, C.C.; Blackwelder, P.L.; Zhou, Y. Gel-like Carbon Dots: Characterization and their Potential Applications. ChemPhysChem 2017, 18, 890–897. [Google Scholar] [CrossRef] [PubMed]
  4. Shi, H.; Wei, J.; Qiang, L.; Chen, X.; Meng, X. Fluorescent Carbon Dots for Bioimaging and Biosensing Applications. J. Biomed. Nanotechnol. 2014, 10, 2677–2699. [Google Scholar] [CrossRef] [PubMed]
  5. Martins, N.C.; Ângelo, J.; Girão, A.V.; Trindade, T.; Andrade, L.; Mendes, A. N-doped carbon quantum dots/TiO2 composite with improved photocatalytic activity. Appl. Catal. B Environ. 2016, 193, 67–74. [Google Scholar] [CrossRef]
  6. Pal, T.; Mohiyuddin, S.; Packirisamy, G. Facile and Green Synthesis of Multicolor Fluorescence Carbon Dots from Curcumin: In Vitro and in Vivo Bioimaging and Other Applications. ACS Omega 2018, 3, 831–843. [Google Scholar] [CrossRef] [Green Version]
  7. Liu, M.L.; Bin Chen, B.; Li, C.M.; Huang, C.Z. Carbon dots: Synthesis, formation mechanism, fluorescence origin and sensing applications. Green Chem. 2019, 21, 449–471. [Google Scholar] [CrossRef]
  8. Cayuela, A.; Soriano, M.; Carrillocarrion, C.; Valcárcel, M. Semiconductor and carbon-based fluorescent nanodots: The need for consistency. Chem. Commun. 2016, 52, 1311–1326. [Google Scholar] [CrossRef]
  9. Li, L.; Dong, T. Photoluminescence tuning in carbon dots: Surface passivation or/and functionalization, heteroatom doping. J. Mater. Chem. C 2018, 6, 7944–7970. [Google Scholar] [CrossRef]
  10. Nekoueian, K.; Amiri, M.; Sillanpää, M.; Marken, F.; Boukherroub, R.; Szunerits, S. Carbon-based quantum particles: An electroanalytical and biomedical perspective. Chem. Soc. Rev. 2019, 48, 4281–4316. [Google Scholar] [CrossRef]
  11. Deng, J.; Lu, Q.; Mi, N.; Li, H.; Liu, M.; Xu, M.; Tan, L.; Xie, Q.; Zhang, Y.; Yao, S. Electrochemical Synthesis of Carbon Nanodots Directly from Alcohols. Chem. A Eur. J. 2014, 20, 4993–4999. [Google Scholar] [CrossRef]
  12. Arcudi, F.; Ðorđević, L.; Prato, M. Design, Synthesis, and Functionalization Strategies of Tailored Carbon Nanodots. Acc. Chem. Res. 2019, 52, 2070–2079. [Google Scholar] [CrossRef]
  13. Azmi, N.E.; Ramli, N.I.; Abdullah, J.; Hamid, M.A.A.; Sidek, H.; Rahman, S.A.; Ariffin, N.; Yusof, N.A. A simple and sensitive fluorescence based biosensor for the determination of uric acid using H2O2-sensitive quantum dots/dual enzymes. Biosens. Bioelectron. 2015, 67, 129–133. [Google Scholar] [CrossRef]
  14. Mousavi, S.M.; Hashemi, S.A.; Zarei, M.; Amani, A.M.; Babapoor, A. Nanosensors for Chemical and Biological and Medical Applications. Med. Chem. 2018, 8, 205–217. [Google Scholar] [CrossRef]
  15. Patra, J.K.; Das, G.; Fraceto, L.F.; Campos, E.V.R.; del Rodriguez-Torres, M.P.; Acosta-Torres, L.S.; Diaz-Torres, L.A.; Grillo, R.; Swamy, M.K.; Sharma, S.; et al. Nano based drug delivery systems: Recent developments and future prospects 10 Technology 1007 Nanotechnology 03 Chemical Sciences 0306 Physical Chemistry (incl. Structural) 03 Chemical Sciences 0303 Macromolecular and Materials Chemistry 11 Medical and He. J. Nanobiotechnol. 2018, 16, 1–33. [Google Scholar] [CrossRef] [Green Version]
  16. Pengju, L.G.; Sahu, S.; Yang, S.T.; Sonkar, S.K.; Wang, J.; Wang, H. Carbon “quantum” dots for optical bioimaging. J. Mater. Chem. B 2013, 1, 2116–2127. [Google Scholar]
  17. Yang, S.; Sun, X.; Wang, Z.; Wang, X.; Guo, G.; Pu, Q. Anomalous enhancement of fluorescence of carbon dots through lanthanum doping and potential application in intracellular imaging of ferric ion. Nano Res. 2018, 11, 1369–1378. [Google Scholar] [CrossRef]
  18. Chu, K.-W.; Lee, S.L.; Chang, C.-J.; Liu, L. Recent Progress of Carbon Dot Precursors and Photocatalysis Applications. Polymer 2019, 11, 689. [Google Scholar] [CrossRef] [PubMed] [Green Version]
  19. Raquin, V.; Wannagat, M.; Zouache, K.; Legras-Lachuer, C.; Moro, C.V.; Mavingui, P. Detection of dengue group viruses by fluorescence in situ hybridization. Parasites Vectors 2012, 5, 243. [Google Scholar] [CrossRef] [PubMed] [Green Version]
  20. Wang, F.; Pang, S.; Wang, L.; Li, Q.; Kreiter, M.; Liu, C. One-Step Synthesis of Highly Luminescent Carbon Dots in Noncoordinating Solvents. Chem. Mater. 2010, 22, 4528–4530. [Google Scholar] [CrossRef]
  21. Atabaev, T.S. Doped Carbon Dots for Sensing and Bioimaging Applications: A Minireview. Nanomaterial 2018, 8, 342. [Google Scholar] [CrossRef] [PubMed] [Green Version]
  22. Sharma, V.; Tiwari, P.; Mobin, S.M. Sustainable carbon-dots: Recent advances in green carbon dots for sensing and bioimaging. J. Mater. Chem. B 2017, 5, 8904–8924. [Google Scholar] [CrossRef] [PubMed]
  23. Wang, Y.; Hu, A. Carbon quantum dots: Synthesis, properties and applications. J. Mater. Chem. C 2014, 2, 6921–6939. [Google Scholar] [CrossRef] [Green Version]
  24. Sharma, A.; Das, J. Small molecules derived carbon dots: Synthesis and applications in sensing, catalysis, imaging, and biomedicine. J. Nanobiotechnol. 2019, 17, 1–24. [Google Scholar] [CrossRef] [PubMed] [Green Version]
  25. Grumezescu, A.M. Fullerens, Graphenes and Nanotubes: A Pharmaceutical Approach Pharmaceutical Nanotechnology; Grumezescu, A.M., Ed.; Elsevier Science: Amsterdam, The Netherlands, 2018; Volume 2018, pp. 1–724. [Google Scholar]
  26. Jhonsi, M.A. Carbon Quantum Dots for Bioimaging; NPG Asia Materials; Intech Open.: London, UK, 2018; p. 64. [Google Scholar] [CrossRef] [Green Version]
  27. Dager, A.; Uchida, T.; Maekawa, T.; Tachibana, M. Synthesis and characterization of Mono-disperse Carbon Quantum Dots from Fennel Seeds: Photoluminescence analysis using Machine Learning. Sci. Rep. 2019, 9, 1–12. [Google Scholar] [CrossRef] [PubMed]
  28. Han, M.Y.; Oezyilmaz, B.; Zhang, Y.; Kim, P. Energy Band-Gap Engineering of Graphene Nanoribbons. Phys. Rev. Lett. 2007, 98, 206805. [Google Scholar] [CrossRef] [Green Version]
  29. Peng, H.; Travas-Sejdic, J. Simple Aqueous Solution Route to Luminescent Carbogenic Dots from Carbohydrates. Chem. Mater. 2009, 21, 5563–5565. [Google Scholar] [CrossRef]
  30. Qiao, Z.-A.; Wang, Y.; Gao, Y.; Li, H.; Dai, T.; Liu, Y.; Huo, Q. Commercially activated carbon as the source for producing multicolor photoluminescent carbon dots by chemical oxidation. Chem. Commun. Suppl. Inf. 2010, 46, 8812–8814. [Google Scholar] [CrossRef]
  31. Wang, J.; Sahu, S.; Sonkar, S.K.; Ii, K.N.T.; Sun, K.W.; Liu, Y.; Maimaiti, H.; Anilkumar, P.; Sun, Y.-P. Versatility with carbon dots—From overcooked BBQ to brightly fluorescent agents and photocatalysts. RSC Adv. 2013, 3, 15604–15607. [Google Scholar] [CrossRef]
  32. Li, X.; Wang, H.; Shimizu, Y.; Pyatenko, A.; Kawaguchi, K.; Koshizaki, N. Preparation of carbon quantum dots with tunable photoluminescence by rapid laser passivation in ordinary organic solvents. Chem. Commun. 2011, 47, 932–934. [Google Scholar] [CrossRef]
  33. Zhou, J.; Booker, C.; Li, R.; Zhou, X.; Sham, T.-K.; Sun, X.; Ding, Z. An Electrochemical Avenue to Blue Luminescent Nanocrystals from Multiwalled Carbon Nanotubes (MWCNTs). J. Am. Chem. Soc. 2007, 129, 744–745. [Google Scholar] [CrossRef]
  34. Zhuo, S.; Shao, M.; Lee, S.-T. Upconversion and downconversion fluorescent graphene quantum dots: Ultrasonic preparation and photocatalysis. ACS Nano 2012, 6, 6530–6531. [Google Scholar] [CrossRef]
  35. Wang, Y.; Xia, Y. Bottom-Up and Top-Down Approaches to the Synthesis of Monodispersed Spherical Colloids of Low Melting-Point Metals. Nano Lett. 2004, 4, 2047–2050. [Google Scholar] [CrossRef]
  36. Basolo, F. Inorganic Chemistry. J. Am. Chem. Soc. 2005, 86, 311. [Google Scholar] [CrossRef]
  37. Zuo, J.; Jiang, T.; Zhao, X.; Xiong, X.; Xiao, S.; Zhu, Z. Preparation and Application of Fluorescent Carbon Dots. J. Nanomater. 2015, 2015, 1–13. [Google Scholar] [CrossRef] [Green Version]
  38. Soni, M.; Mehta, P.; Soni, A.; Goswami, G.K. Green Nanoparticles: Synthesis and Applications. IOSR J. Biotechnol. Biochem. 2018, 4, 78–83. [Google Scholar]
  39. Wang, J.; Zhang, P.; Huang, C.; Liu, G.; Leung, K.C.-F.; Wáng, Y.X.J. High Performance Photoluminescent Carbon Dots for In Vitro and In Vivo Bioimaging: Effect of Nitrogen Doping Ratios. Langmuir 2015, 31, 8063–8073. [Google Scholar] [CrossRef]
  40. Mehta, V.N.; Jha, S.; Basu, H.; Singhal, R.K.; Kailasa, S.K. One-step hydrothermal approach to fabricate carbon dots from apple juice for imaging of mycobacterium and fungal cells. Sensors Actuators B Chem. 2015, 213, 434–443. [Google Scholar] [CrossRef]
  41. Jeong, Y.; Moon, K.; Jeong, S.; Koh, W.-G.; Lee, K. Converting Waste Papers to Fluorescent Carbon Dots in the Recycling Process without Loss of Ionic Liquids and Bioimaging Applications. ACS Sustain. Chem. Eng. 2018, 6, 4510–4515. [Google Scholar] [CrossRef]
  42. Ren, X.; Zhang, F.; Guo, B.; Gao, N.; Zhang, X. Synthesis of N-Doped Micropore Carbon Quantum Dots with High Quantum Yield and Dual-Wavelength Photoluminescence Emission from Biomass for Cellular Imaging. Nanomaterial 2019, 9, 495. [Google Scholar] [CrossRef] [Green Version]
  43. De, B.; Karak, N. A green and facile approach for the synthesis of water soluble fluorescent carbon dots from banana juice. RSC Adv. 2013, 3, 8286–8290. [Google Scholar] [CrossRef]
  44. Qin, X.; Lu, W.; Asiri, A.M.; Al-Youbi, A.O.; Sun, X. Green, low-cost synthesis of photoluminescent carbon dots by hydrothermal treatment of willow bark and their application as an effective photocatalyst for fabricating Au nanoparticles–reduced graphene oxide nanocomposites for glucose detection. Catal. Sci. Technol. 2013, 3, 1027. [Google Scholar] [CrossRef]
  45. Zhu, C.; Zhai, J.; Dong, S. Bifunctional fluorescent carbon nanodots: Green synthesis via soy milk and application as metal-free electrocatalysts for oxygen reduction. Chem. Commun. 2012, 48, 9367–9369. [Google Scholar] [CrossRef]
  46. Hoan, B.T.; Tam, P.D.; Pham, V.-H. Green Synthesis of Highly Luminescent Carbon Quantum Dots from Lemon Juice. J. Nanotechnol. 2019, 2019, 1–9. [Google Scholar] [CrossRef] [Green Version]
  47. Li, L.; Li, L.; Chen, C.-P.; Cui, F. Green synthesis of nitrogen-doped carbon dots from ginkgo fruits and the application in cell imaging. Inorg. Chem. Commun. 2017, 86, 227–231. [Google Scholar] [CrossRef]
  48. Xue, M.; Zou, M.; Zhao, J.; Zhan, Z.; Zhao, S. Green preparation of fluorescent carbon dots from lychee seeds and their application for the selective detection of methylene blue and imaging in living cells. J. Mater. Chem. B 2015, 3, 6783–6789. [Google Scholar] [CrossRef]
  49. Bhattacharyya, D.; Sarswat, P.K.; Free, M.L. Quantum dots and carbon dots based fl uorescent sensors for TB biomarkers detection. Vacuum 2017, 146, 606–613. [Google Scholar] [CrossRef]
  50. Wang, C.; Shi, H.; Yang, M.; Yan, Y.; Liu, E.; Ji, Z.; Fan, J. Facile synthesis of novel carbon quantum dots from biomass waste for highly sensitive detection of iron ions. Mater. Res. Bull. 2020, 124, 110730. [Google Scholar] [CrossRef]
  51. Himaja, A.L.; Karthik, P.S.; Sreedhar, B.; Singh, S.P. Synthesis of Carbon Dots from Kitchen Waste: Conversion of Waste to Value Added Product. J. Fluoresc. 2014, 24, 1767–1773. [Google Scholar] [CrossRef]
  52. Liang, Z.; Zeng, L.; Cao, X.; Wang, Q.; Wang, X.; Sun, R. Sustainable carbon quantum dots from forestry and agricultural biomass with amplified photoluminescence by simple NH4OH passivation. J. Mater. Chem. C 2014, 2, 9760–9766. [Google Scholar] [CrossRef]
  53. Wang, J.; Qiu, J. A review of carbon dots in biological applications. J. Mater. Sci. 2016, 51, 4728–4738. [Google Scholar] [CrossRef]
  54. Laverdant, J.; De Marcillac, W.D.; Barthou, C.; Chinh, V.D.; Schwob, C.; Coolen, L.; Bénalloul, P.; Nga, P.T.; Maître, A. Experimental Determination of the Fluorescence Quantum Yield of Semiconductor Nanocrystals. Material 2011, 4, 1182–1193. [Google Scholar] [CrossRef]
  55. Pam, A.A. Innovative Activated Carbon Based on Deep Eutectic Solvents (DES) and H3PO4. C J. Carbon Res. 2019, 5, 43. [Google Scholar] [CrossRef] [Green Version]
  56. Waluyo, J.; Makertihartha, I.G.B.N.; Susanto, H. Pyrolysis with intermediate heating rate of palm kernel shells: Effect temperature and catalyst on product distribution. AIP Conf. Proc. 2018, 1977, 020026. [Google Scholar] [CrossRef]
  57. Nasir, S.; Hussein, M.Z.; Yusof, N.A.; Zainal, Z. Oil Palm Waste-Based Precursors as a Renewable and Economical Carbon Sources for the Preparation of Reduced Graphene Oxide from Graphene Oxide. Nanomaterial 2017, 7, 182. [Google Scholar] [CrossRef] [Green Version]
  58. Deng, J.; Xiong, T.; Wang, H.; Zheng, A.; Wang, Y. Effects of Cellulose, Hemicellulose, and Lignin on the Structure and Morphology of Porous Carbons. ACS Sustain. Chem. Eng. 2016, 4, 3750–3756. [Google Scholar] [CrossRef]
  59. Jiang, K.; Sun, S.; Zhang, L.; Lu, Y.; Wu, A.; Cai, C.; Lin, H. Red, Green, and Blue Luminescence by Carbon Dots: Full-Color Emission Tuning and Multicolor Cellular Imaging. Angew. Chem. Int. Ed. 2015, 54, 5360–5363. [Google Scholar] [CrossRef]
  60. Sarkar, N.; Sahoo, G.; Das, R.; Prusty, G.; Swain, S.K. Carbon quantum dot tailored calcium alginate hydrogel for pH-responsive controlled delivery of vancomycin. Eur. J. Pharm. Sci. 2017, 109, 359–371. [Google Scholar] [CrossRef] [PubMed]
  61. Adegoke, O.; Park, E.Y. Bright luminescent optically engineered core/alloyed shell quantum dots: An ultrasensitive signal transducer for dengue virus RNA via localized surface plasmon resonance-induced hairpin hybridization. J. Mater. Chem. B 2017, 5, 3047–3058. [Google Scholar] [CrossRef]
  62. Shao, M.; Yao, M.; De Saeger, S.; Yan, L.; Song, S. Carbon Quantum Dots Encapsulated Molecularly Imprinted Fluorescence Quenching Particles for Sensitive Detection of Zearalenone in Corn Sample. Toxins 2018, 10, 438. [Google Scholar] [CrossRef] [PubMed] [Green Version]
  63. Saheeda, P.; Sabira, K.; Joseph, J.; Jayaleksmi, S. On the intriguing emission characteristics of size tunable carbon dots derived from functionalized multi-walled carbon nanotubes. Mater. Chem. Phys. 2019, 225, 8–15. [Google Scholar] [CrossRef]
  64. Nizamuddin, S.; Kumar, N.S.J.; Sahu, J.; Ganesan, P.; Bhutto, A.W.; Mubarak, N.M. Hydrothermal carbonization of oil palm shell. Korean J. Chem. Eng. 2015, 32, 1789–1797. [Google Scholar] [CrossRef]
  65. Yang, C.; Zhu, S.; Li, Z.; Li, Z.; Chenhui, Y.; Sun, L.; Tang, W.; Liu, R.; Sun, Y.; Yu, M. Nitrogen-doped carbon dots with excitation-independent long-wavelength emission produced by a room-temperature reaction. Chem. Commun. 2016, 52, 11912–11914. [Google Scholar] [CrossRef] [PubMed]
  66. Liu, X.; Pang, J.; Xu, F.; Zhang, X. Simple Approach to Synthesize Amino-Functionalized Carbon Dots by Carbonization of Chitosan. Sci. Rep. 2016, 6, 31100. [Google Scholar] [CrossRef] [PubMed] [Green Version]
  67. Anisuzzaman, S.M.; Collin, J.; Daud, W.M.A.W.; Duduku, K.; Yee, H.S. Preparation and characterization of activated carbon from Typha orientalis leaves. Int. J. Ind. Chem. 2014, 6, 9–21. [Google Scholar] [CrossRef] [Green Version]
  68. Bhattacharya, D.; Mishra, M.K.; De, G. Carbon Dots from a Single Source Exhibiting Tunable Luminescent Colors through the Modification of Surface Functional Groups in ORMOSIL Films. J. Phys. Chem. C 2017, 121, 28106–28116. [Google Scholar] [CrossRef] [Green Version]
  69. Kandasamy, G. Recent Advancements in Doped/Co-Doped Carbon Quantum Dots for Multi-Potential Applications. C J. Carbon Res. 2019, 5, 24. [Google Scholar] [CrossRef] [Green Version]
  70. Mehrotra, P. Biosensors and their applications—A review. J. Oral Biol. Craniofacial Res. 2016, 6, 153–159. [Google Scholar] [CrossRef] [Green Version]
  71. Zheng, M.; Li, Y.; Zhang, Y.; Xie, Z. Solvatochromic fluorescent carbon dots as optic noses for sensing volatile organic compounds. RSC Adv. 2016, 6, 83501–83504. [Google Scholar] [CrossRef]
  72. Quraishi, S.; Plappert, S.F.; Ungerer, B.; Taupe, P.; Gindl-Altmutter, W.; Liebner, F. Preparation and Characterization of Bacterial Cellulose-Carbon Dot Hybrid Nanopaper for Potential Sensing Applications. Appl. Sci. 2018, 9, 107. [Google Scholar] [CrossRef] [Green Version]
  73. Edmund, C.O.; Christopher, M.S.; Pascal, D.K. Characterization of palm kernel shell for materials reinforcement and water treatment. J. Chem. Eng. Mater. Sci. 2014, 5, 1–6. [Google Scholar] [CrossRef]
  74. Wu, P.; Li, W.; Wu, Q.; Liu, Y.; Liu, S.-X. Hydrothermal synthesis of nitrogen-doped carbon quantum dots from microcrystalline cellulose for the detection of Fe3+ ions in an acidic environment. RSC Adv. 2017, 7, 44144–44153. [Google Scholar] [CrossRef] [Green Version]
  75. Li, J.; Ma, S.; Xiao, X.; Zhao, D. The One-Step Preparation of Green-Emissioned Carbon Dots through Hydrothermal Route and Its Application. J. Nanomater. 2019, 2019, 1–10. [Google Scholar] [CrossRef] [Green Version]
  76. Ortiz, S.N.C.; Ospino, E.M.; Cabanzo, R. Spectroscopy characterization and quantum yield determination of quantum dots. J. Physics: Conf. Ser. 2016, 687, 012097. [Google Scholar] [CrossRef] [Green Version]
  77. Yang, R.; Guo, X.; Jia, L.; Zhang, Y.; Zhao, Z.; Lonshakov, F. Green preparation of carbon dots with mangosteen pulp for the selective detection of Fe3+ ions and cell imaging. Appl. Surf. Sci. 2017, 423, 426–432. [Google Scholar] [CrossRef]
  78. Gedda, G.; Lee, C.-Y.; Lin, Y.-C.; Wu, H.-F. Green synthesis of carbon dots from prawn shells for highly selective and sensitive detection of copper ions. Sensors Actuators B Chem. 2016, 224, 396–403. [Google Scholar] [CrossRef]
  79. Bhamore, J.R.; Jha, S.; Singhal, R.K.; Park, T.J.; Kailasa, S.K. Facile green synthesis of carbon dots from Pyrus pyrifolia fruit for assaying of Al3+ ion via chelation enhanced fluorescence mechanism. J. Mol. Liq. 2018, 264, 9–16. [Google Scholar] [CrossRef]
  80. Yang, Z.-C.; Wang, M.; Yong, A.M.; Wong, S.Y.; Zhang, X.-H.; Tan, H.; Chang, A.Y.; Li, X.; Wang, J. Intrinsically fluorescent carbon dots with tunable emission derived from hydrothermal treatment of glucose in the presence of monopotassium phosphate. Chem. Commun. 2011, 47, 11615–11617. [Google Scholar] [CrossRef]
  81. Du, F.; Zhang, M.; Li, X.; Li, J.; Jiang, X.; Li, Z.; Hua, Y.; Shao, G.; Jin, J.; Shao, Q.; et al. Economical and green synthesis of bagasse-derived fluorescent carbon dots for biomedical applications. Nanotechnoloy 2014, 25, 315702. [Google Scholar] [CrossRef]
  82. Bhamore, J.R.; Jha, S.; Park, T.J.; Kailasa, S.K. Fluorescence sensing of Cu2+ ion and imaging of fungal cell by ultra-small fluorescent carbon dots derived from Acacia concinna seeds. Sens. Actuators B Chem. 2018, 277, 47–54. [Google Scholar] [CrossRef]
  83. Xu, D.; Lei, F.; Chen, H.; Yin, L.; Shi, Y.; Xie, J. One-step hydrothermal synthesis and optical properties of self-quenching-resistant carbon dots towards fluorescent ink and as nanosensors for Fe3+ detection. RSC Adv. 2019, 9, 8290–8299. [Google Scholar] [CrossRef] [Green Version]
  84. Das, T.; Saikia, B.K.; Dekaboruah, H.; Bordoloi, M.; Neog, D.; Bora, J.J.; Lahkar, J.; Narzary, B.; Roy, S.; Ramaiah, D. Blue-fluorescent and biocompatible carbon dots derived from abundant low-quality coals. J. Photochem. Photobiol. B Biol. 2019, 195, 1–11. [Google Scholar] [CrossRef] [PubMed]
  85. Zhou, J.; Zhou, H.; Tang, J.; Deng, S.; Yan, F.; Li, W.; Qu, M. Carbon dots doped with heteroatoms for fluorescent bioimaging: A review. Microchim. Acta 2017, 184, 343–368. [Google Scholar] [CrossRef]
  86. Mailafiya, M.M.; Abubakar, K.; Danmaigoro, A.; Chiroma, S.M.; Rahim, E.B.A.; Moklas, M.A.M.; Zakaria, Z.A.B. Evaluation of in vitro release kinetics and mechanisms of curcumin-loaded cockle shell-derived calcium carbonate nanoparticles. Biomed. Res. Ther. 2019, 6, 3518–3540. [Google Scholar] [CrossRef]
  87. Bajpai, S.K.; D’Souza, A.; Suhail, B. Blue light-emitting carbon dots (CDs) from a milk protein and their interaction with Spinacia oleracea leaf cells. Int. Nano Lett. 2019, 9, 203–212. [Google Scholar] [CrossRef] [Green Version]
  88. Stefanakis, D.; Philippidis, A.; Sygellou, L.; Filippidis, G.; Ghanotakis, D.F.; Anglos, D. Synthesis of fluorescent carbon dots by a microwave heating process: Structural characterization and cell imaging applications. J. Nanoparticle Res. 2014, 16, 1–10. [Google Scholar] [CrossRef]
  89. Coates, J. Interpretation of Infrared Spectra, a Practical Approach. In Encyclopedia of Analytical Chemistry; John Wiley & Sons Ltd.: Chichester, UK, 2000; pp. 10815–10837. [Google Scholar]
  90. Segal, L.; Eggerton, F.V. Infrared Spectra of Ethylenediamine and the Dimethylethylenediamines. Appl. Spectrosc. 1961, 15, 116–117. [Google Scholar] [CrossRef]
  91. Dong, W.; Li, H.; Dong, Y.; Wang, J.; Ge, X.; Sui, L. The preparation of ethylenediamine-modified fluorescent carbon dots and their use in imaging of cells. Luminescence 2015, 30, 867–871. [Google Scholar] [CrossRef]
  92. Yin, B.; Deng, J.; Peng, X.; Long, Q.; Zhao, J.; Lu, Q.; Chen, Q.; Li, H.; Tang, H.; Zhang, Y.; et al. Green synthesis of carbon dots with down- and up-conversion fluorescent properties for sensitive detection of hypochlorite with a dual-readout assay. Analyst 2013, 138, 6551–6557. [Google Scholar] [CrossRef]
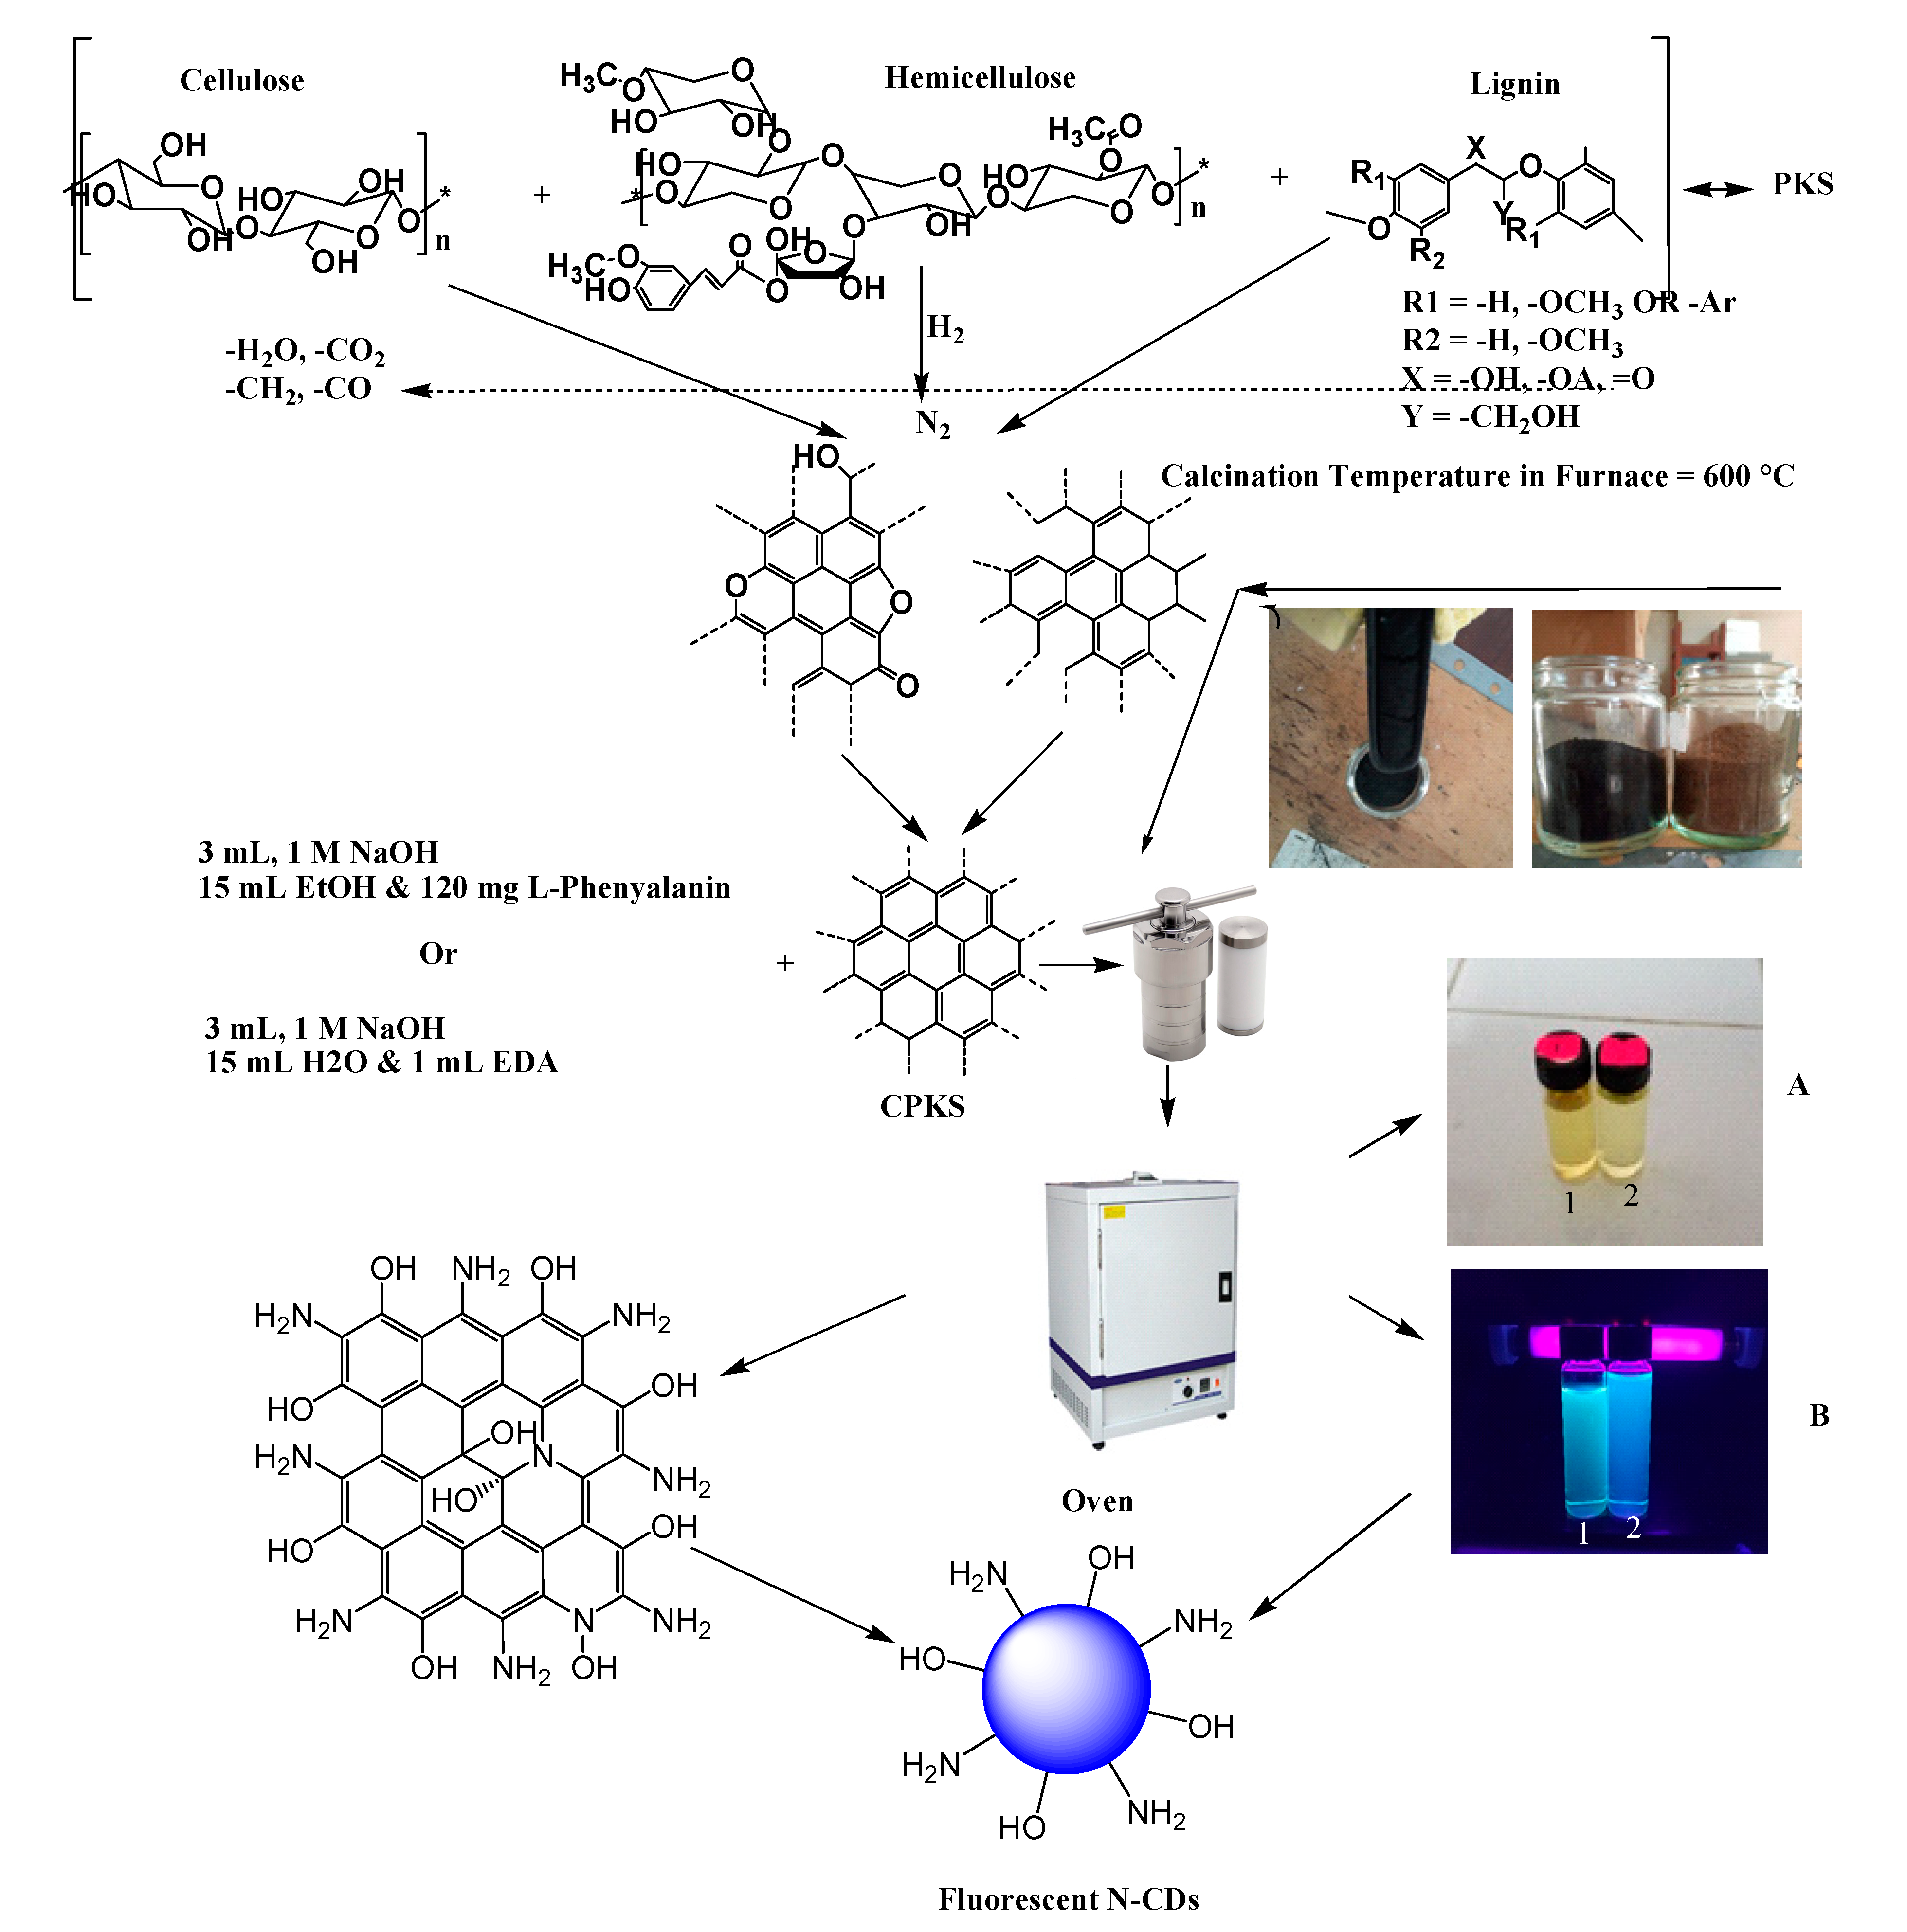
Figure 1. Illustration of the process of one-pot hydrothermal synthesis of N-doped synthesized CDs.
Applsci 11 01630 g001
Figure 2. Furnace for the process of carbonization of PKS to CPKS [57].
Applsci 11 01630 g002
Figure 3. Effect of time of synthesis on pristine CDs under (a) normal light and (b) UV light; (c) (i) CDs-L-Ph (ii) CDs-EDA under normal light; (d) (i) CDs-L-Ph (ii) CDs-EDA under UV light.
Applsci 11 01630 g003
Figure 4. PL emission spectra of (a) CDs-EDA (b) CDs-L-Ph, at an excitation wavelength range of 350–400 nm; (c) effect of Volume of EDA on Emission spectra of CDs-EDA (d) effect of Mass of L-Ph on Emission spectra of CDs-L-Ph; (e) effect of temperature on the emission spectra of (e) CDs-EDA (f) CDs-L-Ph. Effect of dilution on the emission spectra of (g) CDs-EDA (h) CDs-L-Ph.
Applsci 11 01630 g004
Figure 5. Fluorescence intensity plot of quinine sulfate (QS), CDs-EDA, and CDs-LPh against absorbance. Inset is the value of parameters of equation for the straight-line plot.
Applsci 11 01630 g005
Figure 6. TEM images for (a) CDs-EDA and (b) CDs-L-Ph. Histogram showing particle size distribution for (c) CDs- and (d) CDs-L-Ph.
Applsci 11 01630 g006
Figure 7. X-ray diffraction spectroscopy (XRD) for (a) CDs-EDA (b) CDs-L-Ph.
Applsci 11 01630 g007
Figure 8. UV-Visible spectra of (a) CDs-EDA and (b) CDs-LPh.
Applsci 11 01630 g008
Figure 9. FTIR spectra of (A) EDA (B) CDs-EDA (C) L-Ph (D) CDs-LPh.
Applsci 11 01630 g009
Table 1. Results of percentage yield of the carbonized palm kernel shell (CPKS).
S/NoMass of Boat +
PKS Sample (g) (A)
Mass of Boat (g) (B)Mass of PKS (g) (C)Mass of Boat + CPKS Sample (g) (D)Mass Yield of CPKS (g) (D − B)
(E)
Percentage Yield of CPKS (%) (F)
E C ×   100
1.104.6086.6317.9792.195.5630.90
2.106.6286.6220.1492.926.3031.26
3.105.2286.6418.5892.305.6830.71
Average Percentage Yield of CPKS (%)30.96
Publisher’s Note: MDPI stays neutral with regard to jurisdictional claims in published maps and institutional affiliations.