Article

A Study of Multilayer Perceptron Networks Applied to Classification of Ceramic Insulators Using Ultrasound

by
Nemesio Fava Sopelsa Neto
1,
Stéfano Frizzo Stefenon
2,3,*,
Luiz Henrique Meyer
1,
Rafael Bruns
1,
Ademir Nied
2,
Laio Oriel Seman
4,
Gabriel Villarrubia Gonzalez
5,
Valderi Reis Quietinho Leithardt
6 and
Kin-Choong Yow
3
1
Electrical Engineering Graduate Program, Regional University of Blumenau (FURB), R. Sao Paulo 3250 (Itoupava Seca), Blumenau 89030-000, Brazil
2
Electrical Engineering Graduate Program, Santa Catarina State University (UDESC), R. Paulo Malschitzki 200 (North Industrial Zone), Joinville 89219-710, Brazil
3
Faculty of Engineering and Applied Science, University of Regina, Wascana Parkway 3737, Regina, SK S4S 0A2, Canada
4
Graduate Program in Applied Computer Science, University of Vale do Itajaí (UNIVALI), R. Uruguai 458 (Centro), Itajaí 88302-202, Brazil
5
Expert Systems and Applications Lab, Faculty of Science, University of Salamanca, Plaza de los Caídos s/n, 37008 Salamanca, Spain
6
VALORIZA, Research Center for Endogenous Resources Valorization, Instituto Politécnico de Portalegre, 7300-555 Portalegre, Portugal
*
Author to whom correspondence should be addressed.
Appl. Sci. 2021, 11(4), 1592; https://doi.org/10.3390/app11041592
Submission received: 22 January 2021 / Revised: 5 February 2021 / Accepted: 7 February 2021 / Published: 10 February 2021
(This article belongs to the Special Issue Applied Artificial Intelligence (AI))

Abstract

:
Interruptions in the supply of electricity cause numerous losses to consumers, whether residential or industrial and may result in fines being imposed on the regulatory agency’s concessionaire. In Brazil, the electrical transmission and distribution systems cover a large territorial area, and because they are usually outdoors, they are exposed to environmental variations. In this context, periodic inspections are carried out on the electrical networks, and ultrasound equipment is widely used, due to non-destructive analysis characteristics. Ultrasonic inspection allows the identification of defective insulators based on the signal interpreted by an operator. This task fundamentally depends on the operator’s experience in this interpretation. In this way, it is intended to test machine learning applications to interpret ultrasound signals obtained from electrical grid insulators, distribution, class 25 kV. Currently, research in the area uses several models of artificial intelligence for various types of evaluation. This paper studies Multilayer Perceptron networks’ application to the classification of the different conditions of ceramic insulators based on a restricted database of ultrasonic signals recorded in the laboratory.

1. Introduction

Electric power systems enable the sale of commodities (energy) and services (distribution) under standards controlled by the National Electric Energy Agency (ANEEL), through indicators related to the quality of service, service and its product [1]. In Brazil, service indicators are used to assess the delivery of energy to consumers. Among these indicators, the equivalent interruption duration per consumer unit (IDC) and the equivalent interruption frequency per consumer unit (IFC) stand out, measuring the system’s availability and reliability. Failure to comply with these indicators causes losses both on the consumer side, with production stoppage, and losses for the distributor, bearing the fine associated with the problem and the loss of revenue for not supplying energy. Based on the IDC and IFC indicators, the electricity utilities are penalized and for this reason, there is a high interest in keeping the systems working fully to ensure that these indicators will be achieved [2].
In this scenario, one reason for the interruptions is equipment failure that can reach small to large regions depending on the system protection’s selectivity. One of the pieces of equipment responsible for the insulation of the system is the insulators [3]. The insulators are present both in the distribution lines of regional scope, as well as in applications of transmission lines of national scope. Therefore, its failure may be linked to the most diverse interruption scenarios [4]. Artificial intelligence techniques can be used promisingly for assessing contaminated insulators; comparative analysis is necessary, as hybrid techniques may be superior to well-established models depending on the problem being assessed [5].
Ceramic insulators are usually robust and durable and are widely used in the electrical power grid [6]. However, as they are usually in an external environment, they are exposed to variations in the environment, so they can suffer the simultaneous action of the applied electrical voltage, the mechanical traction of cables to which they are subjected, and the contaminants of the environment. The main contamination agents are pollution, salinity, and biological agents [7]. These agents’ combined action can gradually compromise the insulator in terms of dielectric support, making it more susceptible to failure.
The ultrasound equipment is efficient for identifying faults in the electrical power system, as it is a directional device and for this reason, it can be used in the exact identification of the source of the fault. Based on this characteristic, the use of artificial intelligence techniques with the data extracted from ultrasound equipment can improve the identification and prediction of a defect in insulators [8]. Extracting features can improve the interpretation of the ultrasonic signal to identify defects. The ultrasonic signal may have interference noise in the vicinity of the grid that can hide the defect. The application of techniques such as the wavelet transform to filter the ultrasonic signal can improve signal prediction and fault identification [9].
In this context, several studies attempt to reproduce the effects of one or more of these agents on the component in a laboratory environment [10], as well as technical analyzes of the concessionaires on the equipment present in the field [11]. These works aim to produce robust databases used in the development and/or implementation of techniques that make it possible to identify the most susceptible insulators to failure.
Deb et al. [12] worked with the detection of contaminants in aerial network insulators by studying the leakage current waveform. Instead of neural networks, the work uses another mathematical tool called short time modified Hilbert transform. In this work, the results were compared with those obtained using other tools or methods. The work method reached 95% while, for example, the use of an Artificial Neural Networks (ANN) reached 85%.
Ibrahim et al. [13] developed an analysis using electromagnetic waves of the visible spectrum (image), processing the image in an ANN and convolutional neural network (CNN) to classify the images in three levels of erosion (mechanical defect). The work achieves results of up to 80% using ANN and 89.5% using CNN. An alternative to system evaluation through measurable signs is the ultrasound signal [14]. The analysis of ultrasound signals is a non-invasive preventive option that is already applied in the market and used by energy utility [15]. This technique uses microphones that capture the ultrasonic signal from the insulators and convert that signal into audible frequencies through electronic processing [16].
From the audible information, the operator then evaluates the condition of the component [17]. If the dependence and complications of demanding an operator with experience operating equipment are considered, it is justified to search for techniques that analyze the signal emitted through mathematical tools [18]. Studies are currently using artificial intelligence to interpret inspection equipment signals for electrical power system instead of the human factor.
The artificial intelligence models have more space in the research related to the electricity sector [19,20,21,22], whereas they are promising for applications of the analysis of disturbances of an electrical nature [23]. Considering that they can predict patterns fromtheirtorical data, such as the forecast of loads in the power system [24]. However, many surveys use varied models with the need for a large volume of data [25]. This combination of factors makes the application and development of equipment for automatic fault identification more difficult [26].
Qiu et al. [27] tested the effectiveness of a non-invasive technique for detecting different types of pollution through multiband analysis (hyperspectral technique) where using an extreme learning machine neural network (ELM) to interpret the results. Despite not identifying the type of pollution, the network obtained an accuracy ranging from 87.5% to 97.5% in the laboratory, depending on the composition of the pollution.
Polisetty, El-Hag, Jayram worked with ultrasound techniques [28], but in the detection of five different types of leakage current (secondary effects) and three different types of faults caused by contamination and mechanical defects, also using a non-recurring neural network to interpret the results. The acoustic signals of 60, 120 and 180 Hz provided an accuracy of 90% for detecting leakage currents and 85% for classification between corona, crack and surface discharge.
Some researchers conducted promising work to evaluate insulators of the electricity distribution system [29]. The problem of fault identification can be seen in two ways, through the classification of the fault or the failure’s prediction. Considering a classification problem in [17], the ultrasound signal is evaluated from the comparison of the Fourier transform in relation to different insulators’ conditions. Bruns [30] using the same database of this paper, obtained 98.8% accuracy in differentiating a dry and non-perforated insulator from a perforated and wet one. The current work would arrive at an accuracy of 97.5% if we consider the same parameters, that is, do not consider the cases with contaminants.
Using an optimized algorithm, the classification problem is evaluated and presents promising results, when the particle swarm optimization and the Wavelet transform are combined with an ensemble learning algorithm [31]. Using the backpropagation algorithm, several ways of developing the method are compared in [32]; however, the classification problem is not developed.
In [33], using a different database, obtained results of 89% in a practical application, which cannot be faithfully compared to the results presented here, but if the sampling conditions are respected, the current work would obtain 80.2% accuracy in detecting equivalent problems. To assess the failure forecast of distribution insulators, [15] uses wavelet neuro-fuzzy system. The work presented by [4] applies the group method of data handling together with the Wavelet transform, and the results are superior to well-consolidated models such as long short-term memory and adaptive neuro-fuzzy inference system.
Research is increasingly performed based on insulators of more modern materials, such as polymeric ones, and specific evaluations of their performance under adverse conditions are necessary. In [34], a performance evaluation of polymer insulators, class 230 kV, is performed, these components are used in the coastal area of Saudi Arabia. Two insulators that have been in use for more than 20 years are removed from the system for an evaluation in a high voltage laboratory. The analysis is performed for equivalent salt deposit density (ESDD) and non-soluble deposit density (NSDD) over the surface of the components to measure the severity of contamination that was accumulated on the surface of insulating. The results show that there was erosion and surface deterioration of the insulators.
Using the assessment techniques ESDD and NSDD [35] performed a study related to the leakage current’s harmonics. In this research, different operating conditions of 33 kV class glass insulators were evaluated. The results showed that there is a great variation of flashover related to the insulator profile and in this way it is possible to predict which components will be more vulnerable in the system due to their constructive characteristics.
Based on studies related to power quality in transmission and distribution systems, exploring artificial intelligence techniques to help identify insulators’ faults can be a promising alternative to improve the electrical power system’s reliability. In this paper, a multilayer Perceptron (MLP) architecture network will be presented, based on the audio analysis of ultrasound equipment recorded in a high voltage laboratory for network training. The importance of this work is to present and compare the results of using artificial intelligence techniques in order to stimulate the development of an automatic tool for inspection of the electrical power system.
The paper is organized into four sections, Section 2 presents each stage of development from data capture to possible field deployment, Section 3 presents the results achieved and the comparison with other works, in Section 4 the conclusions obtained are presented, followed by the references used during the development of this study.

2. Material and Methods

In this section, the materials and methods used in this work will be presented. The recording of data is the part where the scope of an artificial neural network is defined. From the data set, training will be carried out, a necessary step for the neural network to classify the cases presented below properly.

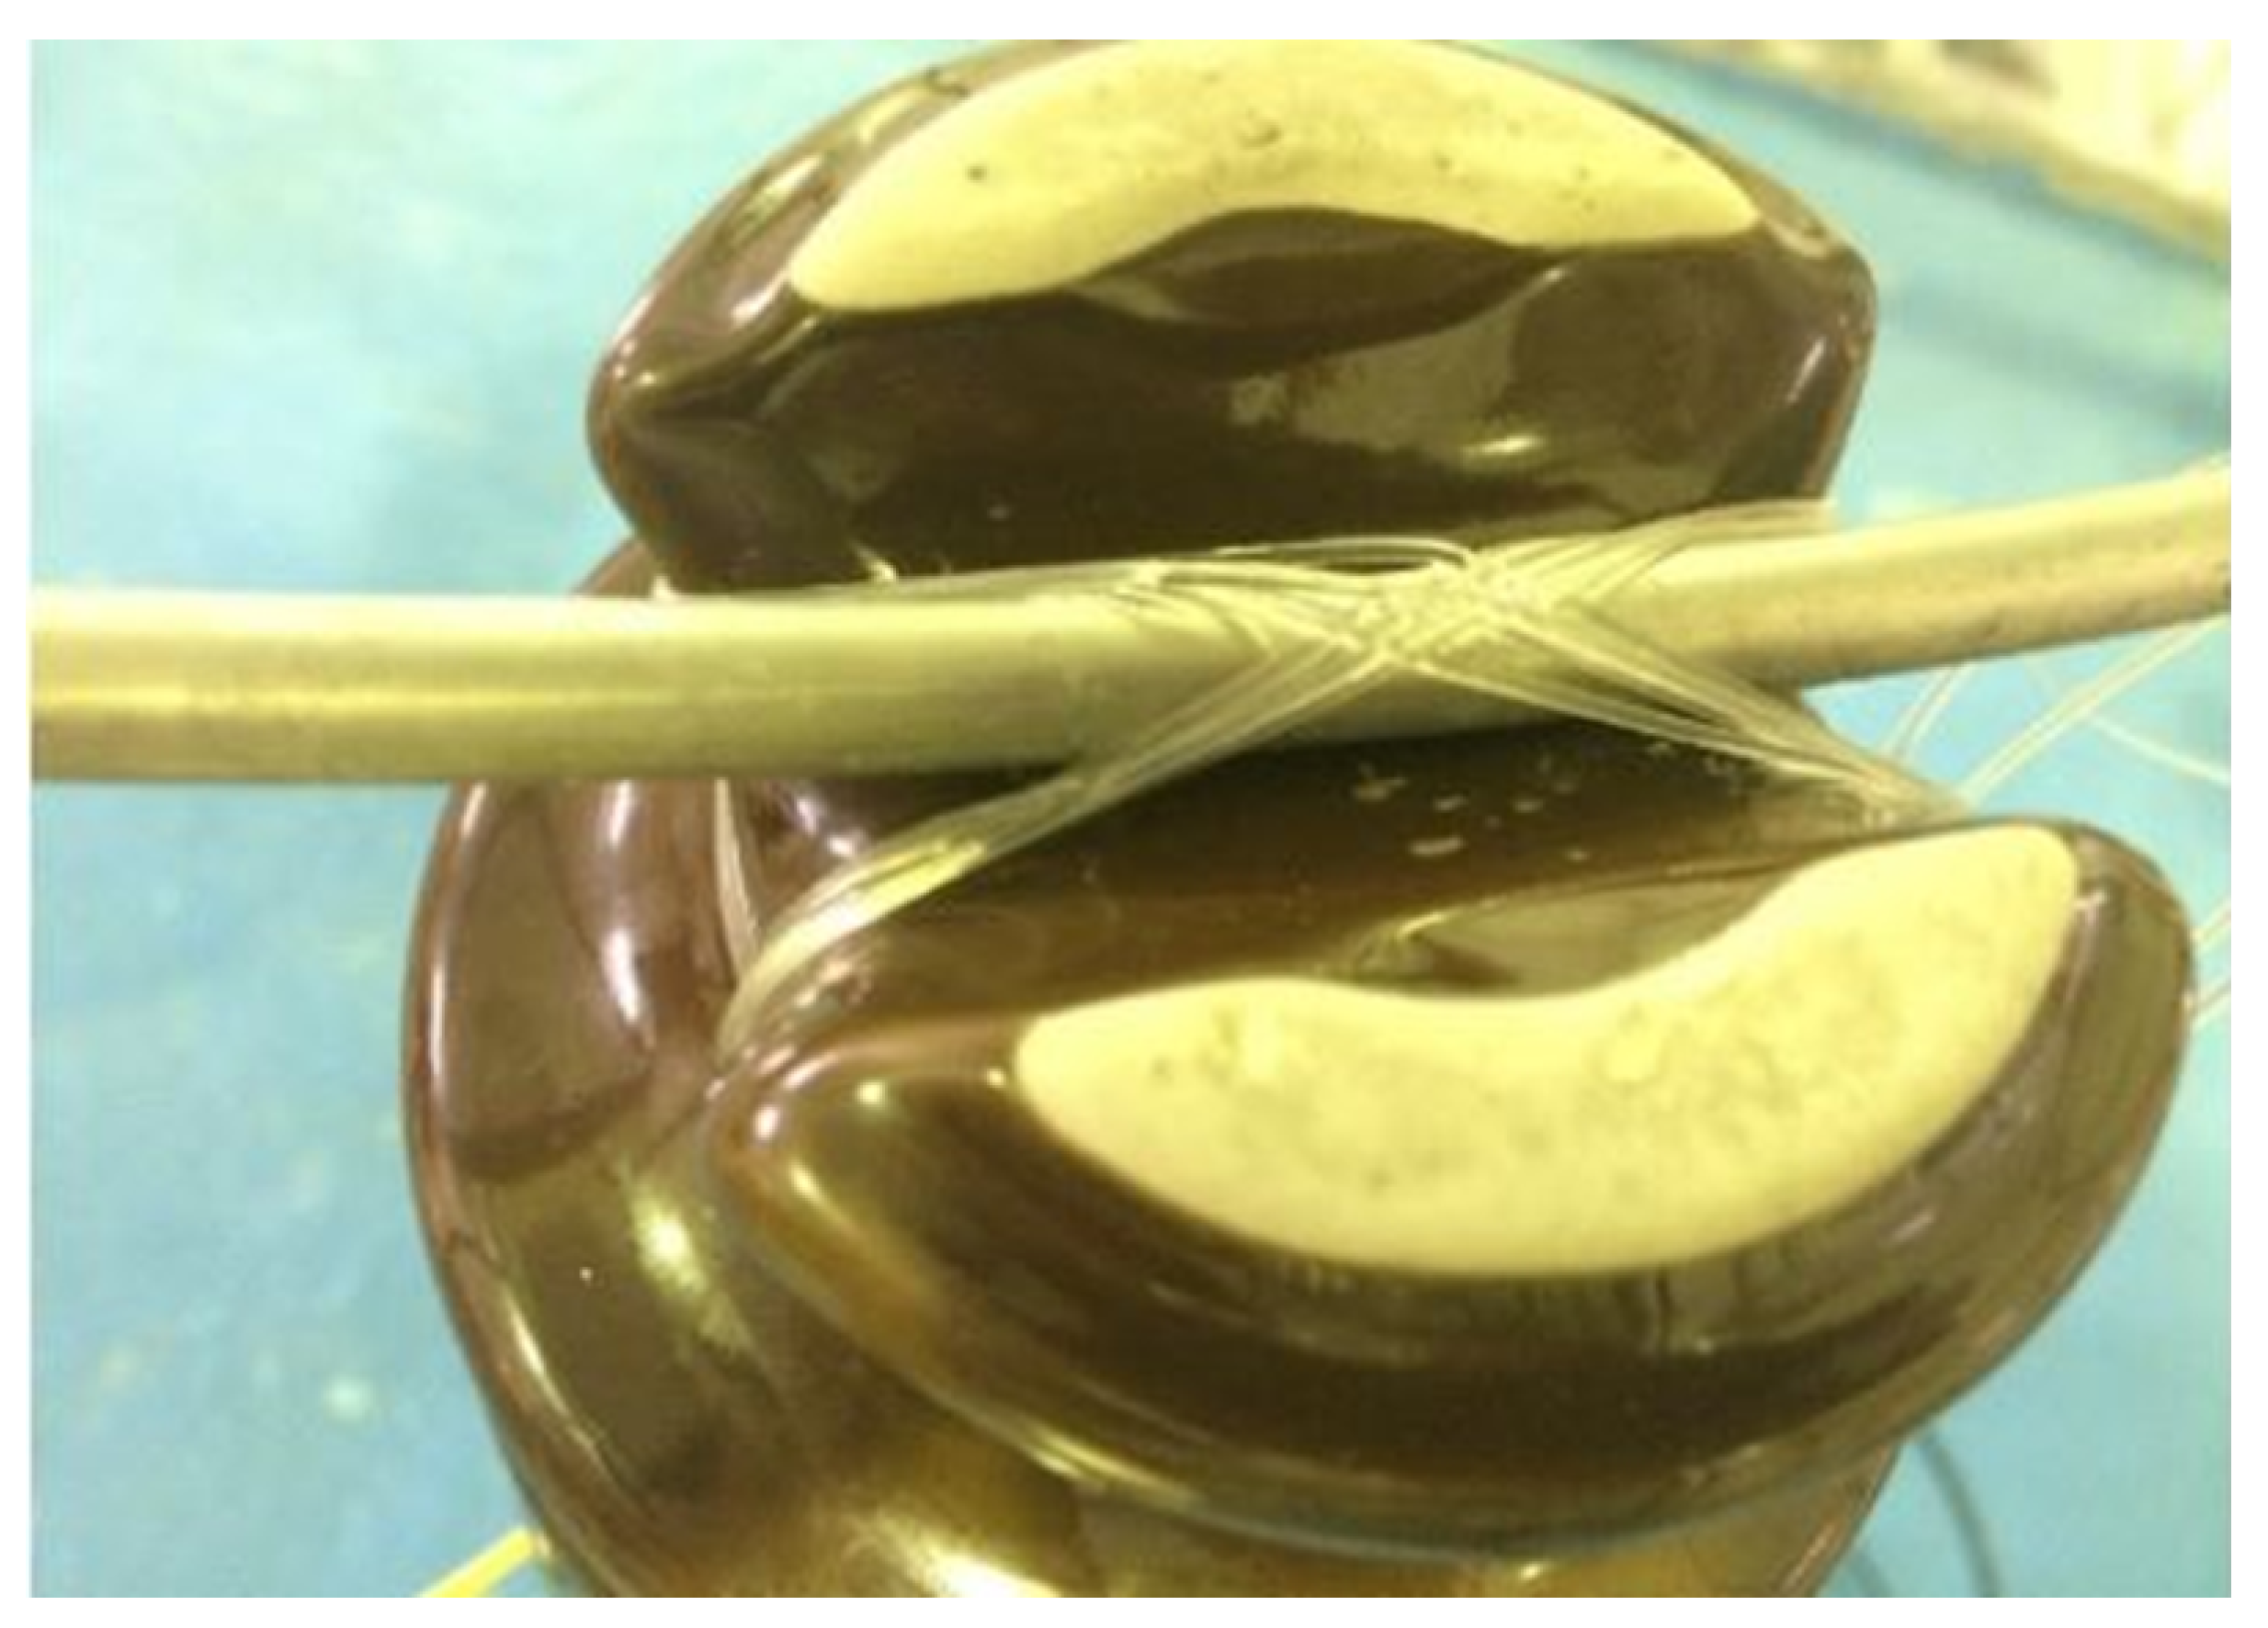
2.1. Case Definition

Considering the problem presented here, insulators’ measurements using ultrasound signals were performed inside a salt spray chamber in the Regional University of Blumenau’s high voltage laboratory. The objective was to simulate different operating conditions of the insulators, based on parameters such as contamination, humidity and the presence of mechanical defects: (1) insulator without perforation and without contaminants; (2) insulator without perforation and with contaminants; (3) insulator without perforation and with contaminants (with added salt); (4) perforated insulator without contaminants; (5) perforated wet insulator; (6) perforated contaminated insulator.
Contamination is a common problem found in insulators installed outdoors [12]. Insulators that are installed in agricultural regions, where there are unpaved streets, can have organic contaminants and dust [36]. Insulators close to coastal regions generally have higher surface conductivity due to the accumulation of saline on their surface [37]. Insulators installed near large urban centers can have artificial contaminants, from industrial and pollution caused by car traffic [38].
As the surface becomes more contaminated, there is a greater chance of developing a failure. Failures can be intermittent, during different climatic conditions, in which it is necessary to replace the damaged components in a corrective way [39]. Over time, surface contamination can generate discharges that can cause tracking and generate perforations that make it necessary to replace the component [40]. Various types of contamination can increase the conductivity in the vicinity of the insulator, making it more vulnerable to discharges [41,42,43].

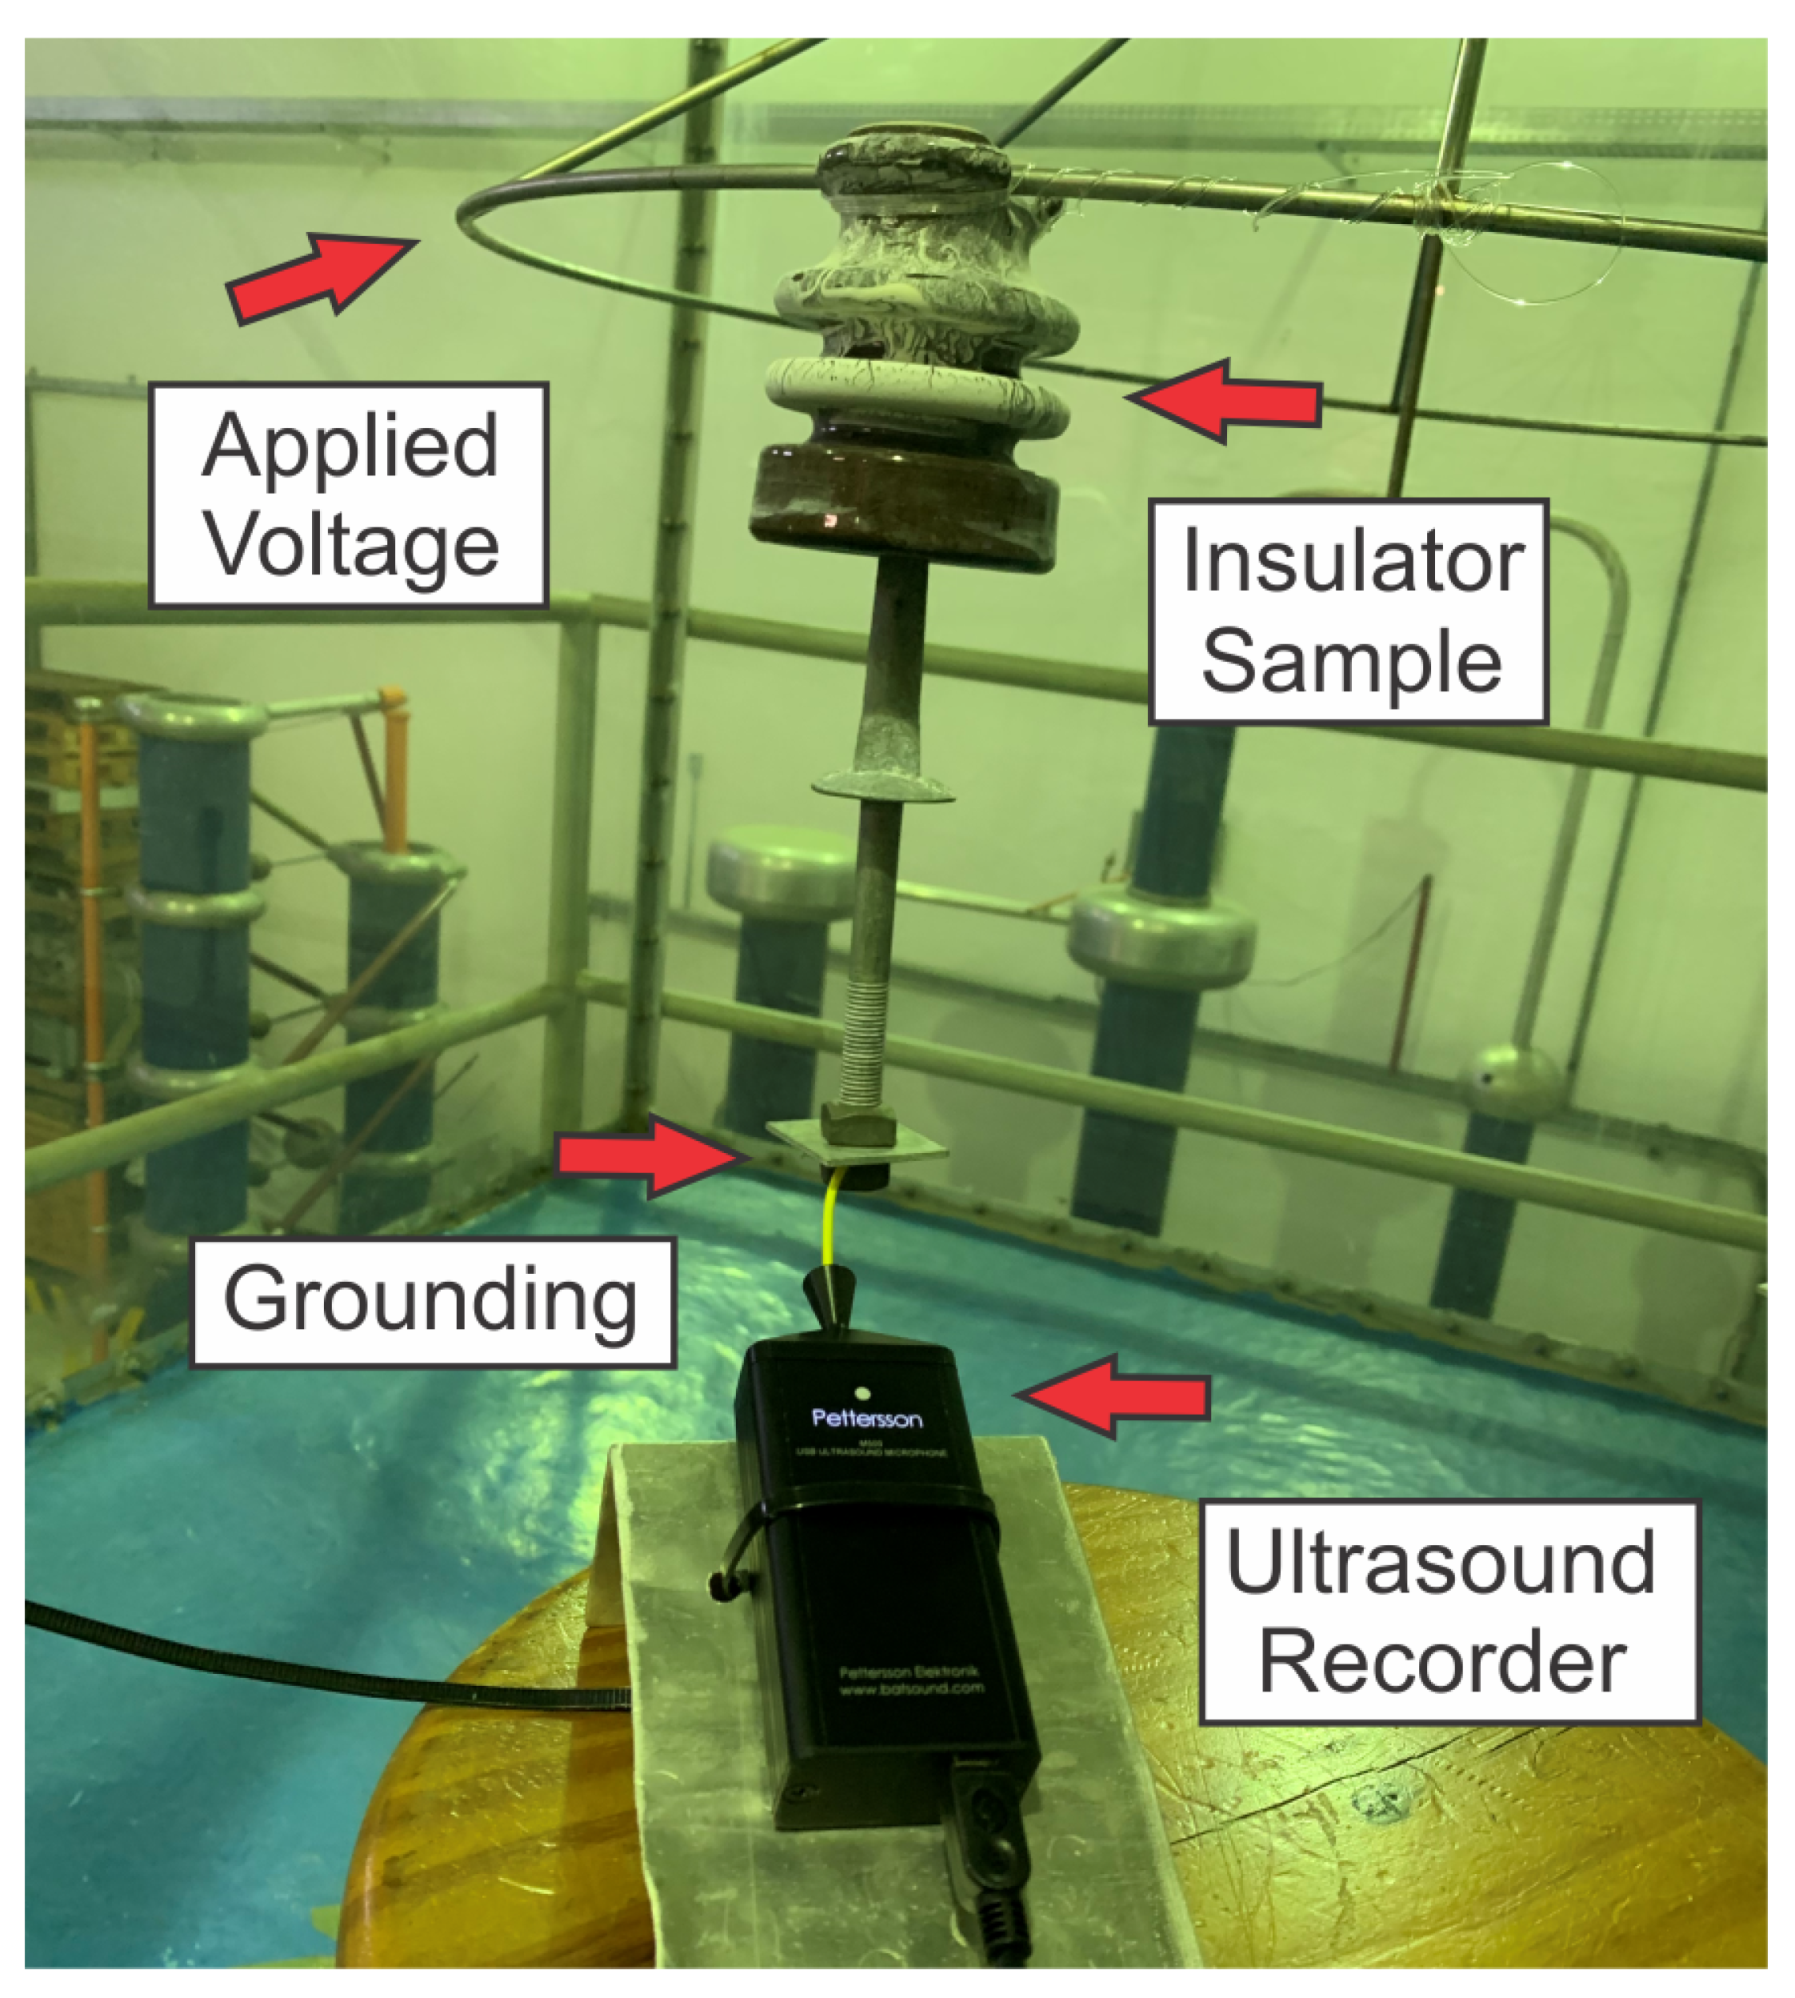
2.2. Equipment and Measurements

Measurements were performed using two Pin type insulators, class 15 kV from the manufacturer Germer Insulators as shown in Figure 1. Both insulators are shown in Figure 1A side by side, and the insulator on the left, used in cases 1, 2 and 3 does not have any type of physical defect, as shown in detail in Figure 1B, while the insulator on the right, used in cases 4, 5 and 6 it presents a perforation, as shown in the detail of Figure 1C. The perforated insulator represents, for example, a component that has been in harsh conditions for a long time until an electrical perforation has developed.
The physically damaged insulator was drilled in the laboratory using a bench drill. A drill bit of 3 mm in diameter was used, which passed through the insulator completely, as shown in Figure 1D. The perforated insulator may not have apparent flaws in nominal conditions, however, it will be prone to failure when certain conditions are present, such as humidity and contamination.
To simulate an insulator under contamination conditions, the solid layer method present in NBR 10621/2017 [44] was followed, using Kaolin’s surface in cases 2, 3 and 6. The 3rd case differs from cases 2 and 6 with adding salt (NaCl) to Kaolin, following the same standard instructions. The NBR 10621/2017 [44] is national standard (Brazil) applied to high-voltage insulators to be used on alternating current (AC) systems under artificial pollution tests. The standard is applied to determine the tolerable characteristics of porcelain insulators or glass for external use, exposed to polluted atmospheres in AC systems. This standard is developed by the Brazilian electricity committee and is based on IEC/507 [45] (Artificial Pollution Tests on High-Voltage Insulators to be used on AC Systems).
The ESDD was neither measured nor controlled during the experiment, as salty water was sprayed prior to sample high voltage application. However, given that the duration of ultrasound data acquisition was taken in a time window of about 20 min, the ESDD is not supposed to change. The water’s conductivity used to spray the samples is 56 kg/m 3 , corresponding to a middle-high contamination level (IEC-507).
The analysis was performed in a chamber of acrylic to reduce interference in the recording of the ultrasonic signal. With sound insulation of the experiment, it is possible to carry out an adequate assessment, assuming that electrical equipment that may be close to the experiment can generate interference in the analysis. The recording of the experiment inside of the acrylic chamber is shown in Figure 2. To avoid capturing unwanted internal ultrasonic noise, it was decided to use insulating material to fix the insulator, as shown in Figure 3.
The chamber is built in acrylic, and only one insulator is connected to high voltage and measured at a time. Supported on a stool, is the ultrasonic microphone connected to a computer to capture the ultrasonic signal. The experiment’s voltage was supplied by a single-phase transformer class 15 kV to generate a 7.95 kV voltage phase-to-ground in the insulators, simulating the voltage of 13.8 kV phase-to-phase in which this type of insulator is normally exposed. The connection for grounding is made from the nut to the washer that are fixed on the screw.
An ultrasonic microphone with a sampling frequency of up to 500 kHz was used to capture the data, being 0.4 m away from the insulators at the test time. The ultrasonic pickup recorded the insulators’ ultrasonic noise separately, during 50 s, for each case. In this way, each condition was set up, and the signal was recorded without the influence of another component during the measurement of the insulator in question.
The ultrasound equipment was positioned with the captor directed with the focus towards the insulator, considering the ultrasound equipment is directional [21]. Equivalent fault detection applications based on acoustic detection are presented in [28,46].
The microphone used to record the ultrasonic signal is the M500 model from Petterson. The equipment’s microphone is based on an advanced high-speed electret. The frequency range evaluated in this experiment is 10 to 210 kHz, which corresponds to PD’s frequency range. In order not to lose signal, the connection is made digitally through a universal serial bus (USB) 2.0 interface, using a USB on-the-go (OTG) cable to connect the device. The complete equipment specifications are shown in Table 1.
This capture of the ultrasound signal was later subdivided into 10 files of 5 s each. Whereas measurement of partial discharge (PD) can assist in fault identification the ultrasound shows promising equipment [25]. The use of ultra high frequency for PD detection can be used for insulation defect classification [47] Radio frequencies are widely used to identify patterns and solve problems in different fields of engineering [48,49,50].
Partial discharges occur in the insulator’s vicinity, so the direction in which the ultrasound detector is positioned can be decisive for fault location. As the sound signal propagates in several directions, there may be a misinterpretation of which component is defective when several components are nearby. The exact determination of which component is defective depends on the operator’s experience.
Specific applications for detecting faults in insulators using ultrasound are promising. According to Anjum [49] using an ANN to classify different types of defects based on the characteristic extracted from the signal, it can result in an accuracy greater than 95%. Polisetty, El-Hag and Jayram [28] obtained an accuracy of 85% for classification of common discharges in insulators that are installed outdoors using an ANN-based algorithm. The methodology used in this paper is quantitative [51], by comparing the accuracy obtained for the selected cases, which are described in Section 2.1.

2.3. Signal Adjustment

For the treatment of input data, training and ANN accuracy testing, programming codes were developed using the P y t h o n language, using the N u m p y and P a n d a s libraries. As the proposed network architecture is not recurrent, it is interesting to characterize the data, in order to represent the signal behavior better [13]. The characteristics and quantity are arbitrary, and the choice directly influences the performance of the network [52].
From the Waveform Audio File (WAV) signal, six characteristics were extracted from the captured data following the methodology presented in [30], which are: average value ( y ¯ i ) (1); effective value ( y rms ) (2); maximum value; minimum value; variance ( V i ) (3); standard deviation ( S t d i ) (4). For each 50 ms of audio, the aforementioned characteristics were calculated; thus, each sample of the signal covers approximately three cycles of the electrical network at the industrial frequency (60 Hz), obtaining a total of 6000 samples, with one thousand samples per considered case.
y ¯ i = 1 n m = 1 n y ^ i , m ,
y rms = 1 n m = 1 n y ^ i , m 2 ( d n ) ,
V i = 1 n 1 m = 1 n ( y ^ i , m y ¯ i ) 2 ,
S t d i = 1 n 1 m = 1 n ( y ^ i , m y ¯ i ) 2 ,
in this case, n is the number of samples, y i is the original signal, y ^ i is the signal estimated by the MLP, and y ¯ i the mean of the original signal. Thus, y ^ i , m is the value of the output variable i in object m.
The characteristics described through the equations presented in this section were used for training the network. From this, the analysis was performed for the classification of the insulators.

Database Adjustments

For each of the six characteristics of the signal to have the same relevance in the optimization algorithm, it is necessary to normalize it in a standard interval, and in this paper we chose the interval [0, 1]. The max-min normalization is given by:
x norm = x min ( x ) max ( x ) min ( x )
Finally, it is necessary to scramble the samples that will be used for training the neural network since the optimization algorithm must be able to recognize all cases simultaneously.
If all one thousand samples of a single case are processed in sequence; the algorithm will optimize only for that specific case, becoming unconfigured when processing subsequent samples of another type of insulator. The database is already prepared to be used both for training the network and for performance tests. After extracting the database recorded in the laboratory for Python, the numpy.random.shuffle function was used to scramble the samples.

2.4. Neural Network Structure

ANNs are also defined by their architecture and may present direct or recurring topologies. Direct networks do not have cycles, making the network commonly represented in layers, wherein the input layer the neurons receive the excitation signals and in the output layer the results of processing are sent to the network [53]. In recurring networks, connectivity presents feedback of at least one cycle. The number of layers of neurons is also a definite characteristic of networks, which can be single or multiple layers [54].
As important as the definition of the topology used is also the learning model chosen to train the network, in this article, the topology is supervised in which the classification result is known. In supervised learning for each input pattern, the network is fed with the desired response corresponding to its class. In this paper, the algorithm was applied by the authors without using specialized neural network libraries. Only the P a n d a s and S c i p y libraries were used to extract data from sources such as . x l s x and . w a v and the N u m p y library to support computational mathematical tools.

2.4.1. Model, Activation and Training Function

As for the ANN structure, the challenge proposed by this paper is to demonstrate the potential of a simple neural network, the representation of the structure used in this paper is shown in Figure 4. Therefore, we opted for a perceptron network, where the response is instantaneous and non-recurring [55,56,57]. For the activation function, the interval sigmoid function ( σ ) [0, 1] was chosen (Equation (6)) and, for training, the backpropagation technique [58].
The neural network configuration parameters, such as the number of layers and activation function, were defined based on the study presented in [17]. In which several parameters are evaluated for an equivalent signal, and the best configuration for the specific application is presented. However, noticed that only one intermediate layers was considered, in order to demonstrate the potential of a simple neural network to classify insulators.
σ x = 1 1 + e x
The MLP model for backpropagation approach is shown in Figure 4.
A neural network training consists of optimizing the multipliers’ value, also known as “weights”, between neurons of different layers [59]. These weights will define the relevance of each interaction between the neurons in order to reduce errors in the output layer.
The optimization of the weights in this work will occur offline; that is, there will be no change in the weights after the training stage is finished. In the algorithm presented in this paper, convergence is calculated from the error wording, given by the equation:
error = y i y ^ i ,
where y i is the original signal and y ^ i the signal estimated by the MLP.
After the convergence of the network, the classification is evaluated based on the coefficient of determination R 2 , which generates a result in relation to the accuracy of the algorithm:
R 2 = 1 i = 1 n y i y ^ i 2 i = 1 n y i y ¯ i 2 .

2.4.2. ANN Objectives

The objective of the network will be to identify whether the tested insulator is equivalent to the perforated insulator and presents contamination (Kaolin), therefore, there are four possibilities for the network’s response: (1) Insulator in good conditions of use, which is not perforated and has no contamination, which coincides with the 1st case; (2) Contaminated insulator, which coincides with the 2nd and 3rd case; (3) Perforated insulator, which coincides with the 4th and 5th cases; (4) Perforated and contaminated, which coincides with the 6th case.
Preliminary tests indicated that greater accuracy could be achieved if the classifications were carried out through two separate networks. Thus, for the remaining of this paper, two networks will be considered. The first will determine whether the insulator is perforated and, in parallel, the second will determine whether the insulator is contaminated. The sum of these two results will consequently coincide with one of the four possible responses.
Each network should have a structure of six inputs, following the number of signal features. The number of intermediate neurons is arbitrary and the performance of the network may vary. On the other hand, the last layer must have two outputs, where one indicates whether or not the insulator had the tested characteristic. The network already has its structure and objectives well-defined, it is only necessary to conduct its training, being possible to proceed with the training.

2.4.3. Physical Application

Once the algorithm achieves the expected results, it is possible to develop a physical application [28] using the same microphone that captured the samples, always considering the pre-established conditions in the data capture.

2.4.4. Double Check Technique

The Double Check Technique is also common in practical applications, as in the analysis of disturbances in the electrical network [60], the need to confirm the result several times to obtain an answer—a process known as double check. In a signal analyzed with samples every 50 ms, the result will only be informed to the operator when it remains constant, for example, for 0.2 s (four samples), which increases the system’s reliability.
The Double Check Technique is especially useful in practice presented in this paper, as the microphone will easily be analyzing the same insulator for longer periods. The use of this technique helps to reduce false positives, since an insulator being captured must maintain a constant result in the analysis results [61]. The procedure used for the method presented in this paper is shown in Figure 5, wherein the Double Check Technique is highlighted in the red rectangle.

3. Results

To discuss the results obtained, we initially present the signals recorded in the laboratory and the characteristics used to carry out the network training.

3.1. Data Acquisition and Feature Extraction

The resulting signals for the simulated conditions discussed in this paper are shown in Figure 6. As can be seen, there is a greater signal amplitude when the insulators are perforated and contaminated, this is because there is a shorter distance between the electrical potential and the ground, causing more partial discharges that generate ultrasonic noise. The distance is shorter because there is a shorter path from the conductor, where the electrical potential is applied, to the fixing pin that can be grounded and is inside the insulator. This can facilitate the development of partial discharges because with a shorter distance the electric field will be larger. A disruptive discharge does not need to circumvent the insulator’s external surface until it reaches the pin, making the place more vulnerable.
It is noticeable in Figure 6 that there is little visual difference between insulators with and without contamination, this makes it difficult to identify which component has greater contamination, and thus a greater chance of having a failure.
As mentioned earlier, more significant contamination makes the surface more conductive and can leave the component more vulnerable to irreversible failure. Perforation is a failure in which the component needs to be replaced because it has lost its insulation properties, while contaminated insulators can be washed, returning their characteristics necessary for their correct functioning. For this reason, identifying perforated insulators is extremely important for electric utility operators, thus ensuring network reliability.
After obtaining the signals, the features were extracted following the methodology of Section 2.3. The extracted features for 1st case are illustrated in Figure 7.

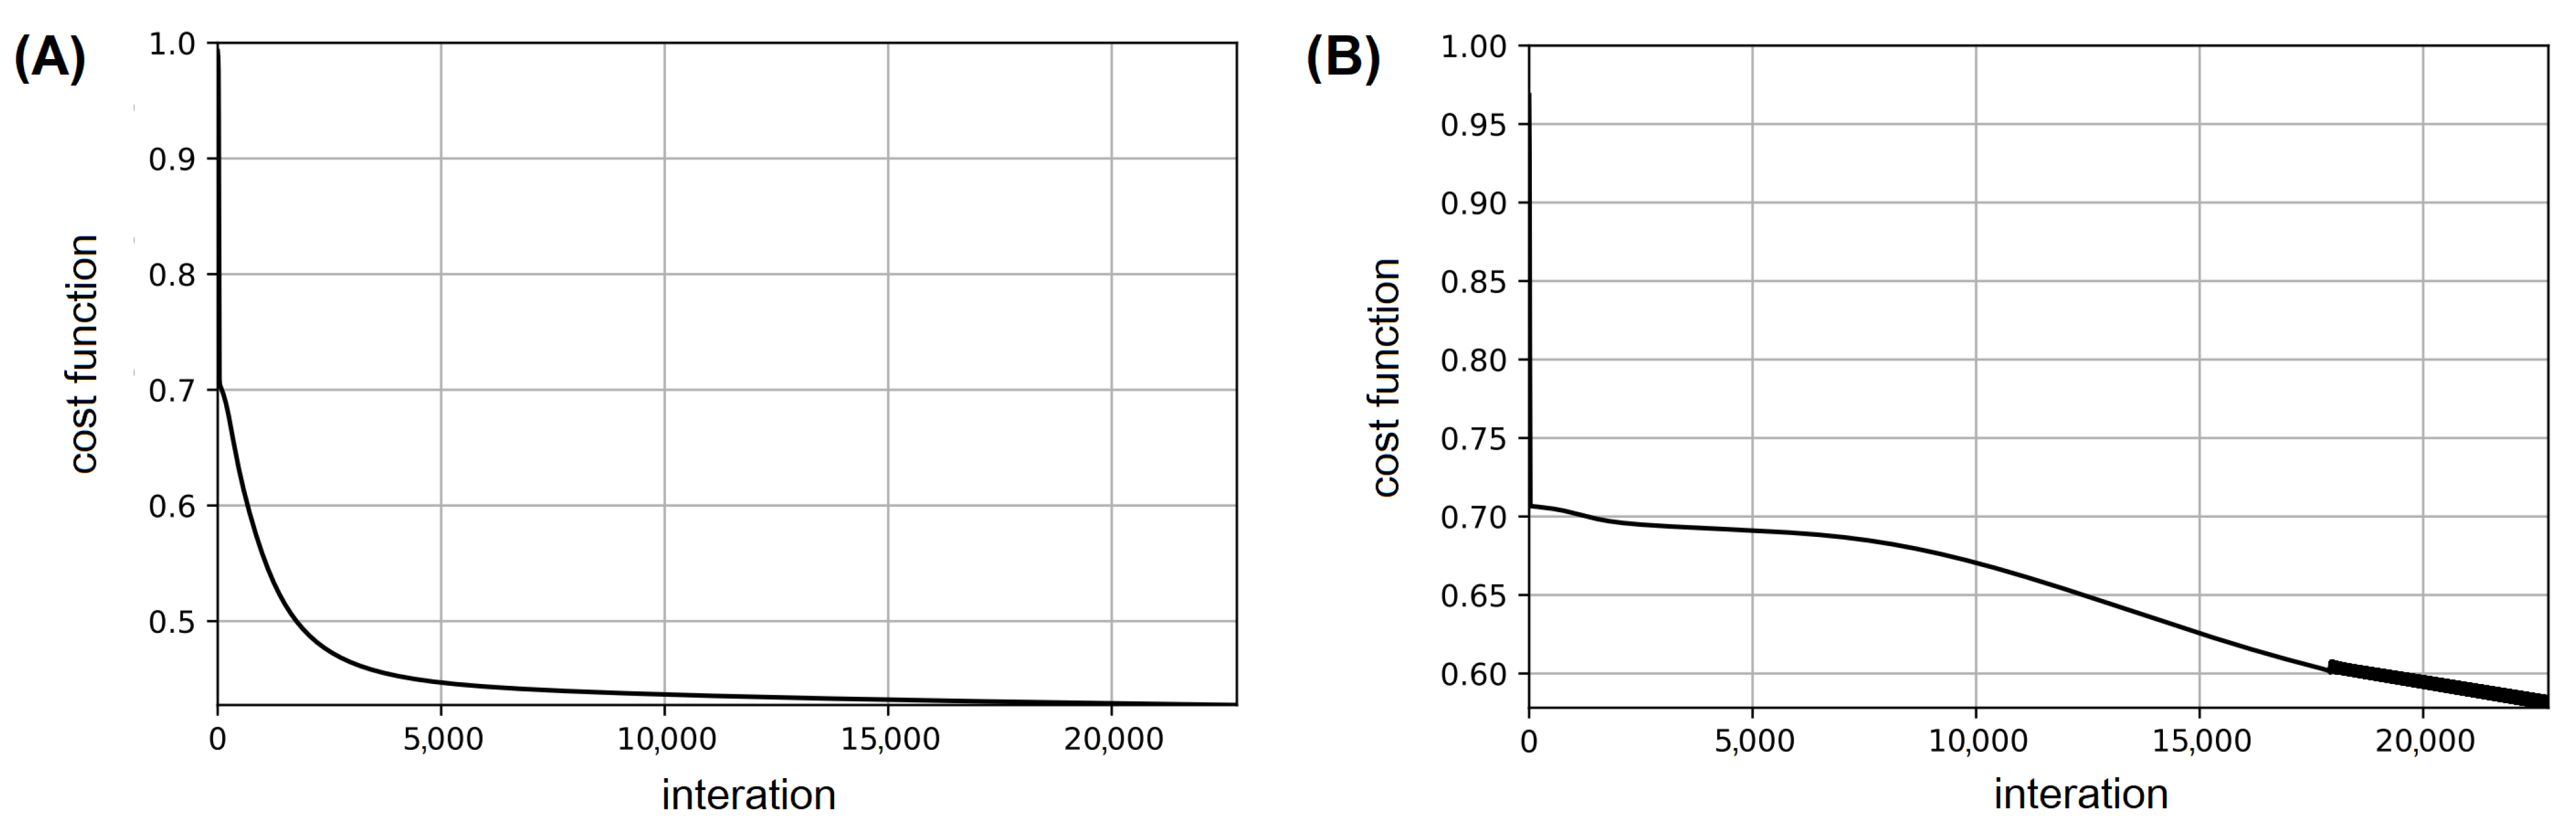
3.2. Network Training

To obtain the best weights for ANN, several training were performed with different combinations of variables, which are:
  • Training/Test Ratio: Proportion of the available samples from the database to be used for training and testing, in this case, the samples that will be used for training will not be used for testing.
  • Intermediate Neurons: Number of intermediate neurons in the neural network.
  • Base Multiplier: Number of times that samples from the database will be trained, the repetition of training can lead to better results, at the expense of a longer processing time.
Table 2 shows the best network accuracy achieved. The proportions of the database that were used for tests are presented in the columns, varying between [0.5, 0.95], for each neural network (i.e., the network that detects perforation and the network that detects contamination). The number of neurons present in the intermediate layer is highlighted in the lines, followed by the base multiplier, these numbers being separated by a bar.
First, we cannotice that changing the number of intermediate neurons does not consistently improve accuracy. On the other hand, it is clear that there is a tendency to increase accuracy as more samples are made available, either through the proportion of samples used for training, or by reusing the same samples with the base multiplier.
The convergence process of the algorithm for the network training is shown in Figure 8. It can be seen that in Figure 8B for the contaminated insulator, there was an oscillation before the convergence. As can be seen in the cost function relative to the error (see Equation (7)), the error reduction occurs more quickly in the perforated insulator, this possibly occurs because there is a greater difference in this signal in relation to the others and thus a faster convergence occurs.
In order to seek even better results, accuracy was separated by type of case. The results presented in Table 3 use the weights obtained in training with ninety-five percent of the training database, sixteen intermediate neurons and a four-fold base multiplier. In this assessment, each case is compared to the classification of perforation and contamination separately to assess the accuracy of the algorithm in identifying this condition.
The discrepancy of results for Case 4 (Perforated and Uncontaminated Insulator) with the others is evident by isolating the accuracy by type of case. However, it is now possible to observe that, except for case 4 (which will be discussed later), the ANN that identifies perforated insulators presents an excellent performance, whereas the ANN that identifies contaminated insulators still presents unsatisfactory results.

Double Check

To improve the accuracy of the ANN that identifies contaminated insulators, the double check process commented in Section 2.4.4 was implemented. With this implementation, a considerable increase in accuracy was obtained, as can be seen in Table 4.
From the use of the Double Check Technique, described in Section 2.4.4, there was an increase in the accuracy of the model to classify the conditions evaluated. This improvement can be seen in the comparison of Table 3 with Table 4.

3.3. Discussion

3.3.1. Condition Out of Scope

During the development process, where a classification for contamination and mechanical defects was determined, the humidity was not considered a characteristic present in case 5. This adverse characteristic did not greatly influence the detection of perforation, but it significantly increased the occurrence of false positives in the ANN that identifies polluted insulators.

3.3.2. Case Study 4

Finally, looking for an explanation of why the ANN that identifies perforated insulators classified case 4 as not perforated, a parallel network was developed to differentiate only the perforation without contamination. In the tests, the new network was successful in differentiating the two cases; however, when used to classify the presence or absence of perforation in cases with contamination, the new network did not present satisfactory results, making the results inconclusive.
The only evidence found in this new test that can help understand what happened is linked to the magnitude of the samples. When considering only the cases without any type of contamination, the signal characteristics (average, effective, maximum) have a range of values 60× smaller when compared to the range obtained when considering all cases. This may indicate that the difference between the cases without contamination is small when compared to the differences present in the other cases, this can lead the algorithm to “confuse” the perforated insulator without contamination as a non-perforated insulator.

4. Conclusions

This paper employed a neural network to classify the conditions of ceramic insulators ultrasonic signals. In this sense, two different classifications were performed, the first regarding perforated and non-perforated insulators, and the second regarding contaminated and non-contaminated insulators. The results obtained show that it is possible to detect the failures in the insulators in a non-invasive way, using mechanical waves.
The presented results were better at detecting perforated insulators, with less success in detecting contamination. When considering the whole dataset, an accuracy of up to 82% was obtained by classifying insulators with respect to perforation, while for contamination a result of up to 68.25% was reached.
During the tests, it was noticed that the case study #4 was the most difficult to classify. When this specific insulator is disregarded, the neural network achieves an accuracy of 98.9% in detecting physical defects, just as it would achieve an accuracy of 88.1% in detecting contaminants.
By individually analyzing the insulators, the results can reach even higher accuracy, both for perforated and contaminated detection. Furthermore, the double check technique can improve the results, reaching individual accuracy up to 95.2%.
Overall, the applied technique can provide useful insights for the analysis of physical equipment, enabling improvement in the electrical system’s evaluation and maintenance processes.
The analysis presented in this paper can be applied to different insulator profiles, under different conditions of use. Based on a signal from an insulator in good condition, it is possible to apply the model to classify adverse conditions and thus improve the identification of faults in the electrical grid. As the ultrasound equipment can capture noise from partial discharges, it can even be used to evaluate other equipment in the electrical power system.
The algorithm used in this paper can be developed in an embedded system, to become a product to be used by energy utilities. From an on-board equipment, the electrical system inspection teams may find it easier to identify faults and may take preventive action to improve the reliability of the electrical power system. For future work, we intend to create an embedded system to be tested on transmission lines, in order to analyze the economic impact of the solution.

Author Contributions

N.F.S.N.: Formal Analysis, Validation, Writing—Original Draft; S.F.S.: Conceptualization, Writing—Original Draft; L.H.M.: Review & Editing; R.B.: Data Acquisition; A.N.: Review & Editing; L.O.S.: Conceptualization, Writing—Original Draft; G.V.G.: Review & Editing; V.R.Q.L.: Review & Editing. K.-C.Y.: Review & Supervision. All authors have read and agreed to the published version of the manuscript.

Funding

This work was supported by This work was supported by the Junta De Castilla y León—Consejería De Economía Y Empleo: System for simulation and training in advanced techniques for the occupational risk prevention through the design of hybrid-reality environments with ref. J118.

Acknowledgments

We would like to thank to the Coordination of Superior Level Staff Improvement, awarding a doctoral scholarship to one of the authors. We would like to thank the Canadian Bureau for International Education through the Emerging Leaders in the Americas Program, Government of Canada, who provided a scholarship for Visiting Graduate Research Student in the University of Regina, Canada. We would like to thank to Seed Funding ILIND—Instituto Lusófono de Investigação e Desenvolvimento, COPELABS. Al Proyeto: Uso de algoritmos y protocolos de comunicación en dispositivos con énfasis en la privacidad de los datos.

Conflicts of Interest

The authors declare no conflict of interest.

Abbreviations

The following abbreviations are used in this manuscript:
ANEELNational Electric Energy Agency
ANNArtifical neural network
CNNConvolutional neural network
ELMMachine neural network
ESDDEquivalent salt deposit density
IDC Interruption duration per consumer
IFC Interruption frequency per consumer
MLPMultilayer perceptron
NSDDNon-soluble deposity density
PDPartial discharge

References

  1. de Andrade, G.N.; Alves, L.A.; da Silva, C.E.R.F.; de Mello, J.C.C.S. Evaluating Electricity Distributors Efficiency Using Self-Organizing Map and Data Envelopment Analysis. IEEE Lat. Am. Trans. 2014, 12, 1464–1472. [Google Scholar] [CrossRef]
  2. Galli, F.P.; Stefenon, S.F.; Américo, J.P. Analysis of Transient Short Circuits in Transmission Lines Using UDW Software. Espacios (Caracas) 2017, 38, 34. [Google Scholar]
  3. Tao, X.; Zhang, D.; Wang, Z.; Liu, X.; Zhang, H.; Xu, D. Detection of Power Line Insulator Defects Using Aerial Images Analyzed With Convolutional Neural Networks. IEEE Trans. Syst. Man. Cybern. Syst. 2020, 50, 1486–1498. [Google Scholar] [CrossRef]
  4. Dong, B.; Zhang, Z.; Xiang, N.; Yang, H.; Xu, S.; Cheng, T. AC Flashover Voltage Model for Polluted Suspension Insulators and an Experimental Investigation in Salt Fog. IEEE Access 2020, 8, 187411–187418. [Google Scholar] [CrossRef]
  5. Stefenon, S.F.; Ribeiro, M.H.D.M.; Nied, A.; Mariani, V.C.; dos Santos Coelho, L.; da Rocha, D.F.M.; Grebogi, R.B.; de Barros Ruano, A.E. Wavelet group method of data handling for fault prediction in electrical power insulators. Int. J. Electr. Power Energy Syst. 2020, 123, 106269. [Google Scholar] [CrossRef]
  6. Wang, B.; Dong, M.; Ren, M.; Wu, Z.; Guo, C.; Zhuang, T.; Pischler, O.; Xie, J. Automatic Fault Diagnosis of Infrared Insulator Images Based on Image Instance Segmentation and Temperature Analysis. IEEE Trans. Instrum. Meas. 2020, 69, 5345–5355. [Google Scholar] [CrossRef]
  7. Stefenon, S.F.; Americo, J.P.; Meyer, L.; Grebogi, R.; Nied, A. Analysis of the Electric Field in Porcelain Pin-Type Insulators via Finite Elements Software. IEEE Lat. Am. Trans. 2018, 16, 2505–2512. [Google Scholar] [CrossRef]
  8. de Barros Bezerra, J.M.; Lima, A.M.N.; Deep, G.S.; da Costa, E.G. An Evaluation of Alternative Techniques for Monitoring Insulator Pollution. IEEE Trans. Power Deliv. 2009, 24, 1773–1780. [Google Scholar] [CrossRef]
  9. Vazquez, L.; Blanco, J.M.; Ramis, R.; Peña, F.; Diaz, D. Robust methodology for steady state measurements estimation based framework for a reliable long term thermal power plant operation performance monitoring. Energy 2015, 93, 923–944. [Google Scholar] [CrossRef]
  10. Meyer, L.H.; Pintarelli, R. Inclined Plane Test for Erosion of Polymeric Insulators under AC and DC Voltages. IEEE Lat. Am. Trans. 2020, 18, 1455–1461. [Google Scholar] [CrossRef]
  11. Pereira Braz, C.; Piantini, A. Analysis of the dielectric behavior of distribution insulators under non-standard lightning impulse voltages. IEEE Lat. Am. Trans. 2011, 9, 732–739. [Google Scholar] [CrossRef]
  12. Deb, S.; Ray Choudhury, N.; Ghosh, R.; Chatterjee, B.; Dalai, S. Short Time Modified Hilbert Transform-Aided Sparse Representation for Sensing of Overhead Line Insulator Contamination. IEEE Sens. J. 2018, 18, 8125–8132. [Google Scholar] [CrossRef]
  13. Ibrahim, A.; Dalbah, A.; Abualsaud, A.; Tariq, U.; El-Hag, A. Application of Machine Learning to Evaluate Insulator Surface Erosion. IEEE Trans. Instrum. Meas. 2020, 69, 314–316. [Google Scholar] [CrossRef]
  14. Stefenon, S.F.; Silva, M.C.; Bertol, D.W.; Meyer, L.H.; Nied, A. Fault diagnosis of insulators from ultrasound detection using neural networks. J. Intell. Fuzzy Syst. 2019, 37, 6655–6664. [Google Scholar] [CrossRef]
  15. Stefenon, S.F.; Freire, R.Z.; Coelho, L.S.; Meyer, L.H.; Grebogi, R.B.; Buratto, W.G.; Nied, A. Electrical Insulator Fault Forecasting Based on a Wavelet Neuro-Fuzzy System. Energies 2020, 13, 484. [Google Scholar] [CrossRef] [Green Version]
  16. Shnaiderman, R.; Wissmeyer, G.; Ülgen, O.; Mustafa, Q.; Chmyrov, A.; Ntziachristos, V. A submicrometre silicon-on-insulator resonator for ultrasound detection. Nature 2020, 585, 372–378. [Google Scholar] [CrossRef]
  17. Stefenon, S.F.; Branco, N.W.; Nied, A.; Bertol, D.W.; Finardi, E.C.; Sartori, A.; Meyer, L.H.; Grebogi, R.B. Analysis of training techniques of ANN for classification of insulators in electrical power systems. IET Gener. Transm. Distrib. 2020, 14, 1591–1597. [Google Scholar] [CrossRef]
  18. Jin, X.B.; Wang, H.X.; Wang, X.Y.; Bai, Y.T.; Su, T.L.; Kong, J.L. Deep-Learning Prediction Model with Serial Two-Level Decomposition Based on Bayesian Optimization. Complexity 2020, 2020, 1–14. [Google Scholar] [CrossRef]
  19. Kasburg, C.; Stefenon, S.F. Deep Learning for Photovoltaic Generation Forecast in Active Solar Trackers. IEEE Lat. Am. Trans. 2019, 17, 2013–2019. [Google Scholar] [CrossRef]
  20. Stefenon, S.F.; Seman, L.O.; Schutel Furtado Neto, C.; Nied, A.; Seganfredo, D.M.; da Garcia, L.F.; Sabino, P.H.; Torreblanca González, J.; Quietinho Leithardt, V.R. Electric Field Evaluation Using the Finite Element Method and Proxy Models for the Design of Stator Slots in a Permanent Magnet Synchronous Motor. Electronics 2020, 9, 1975. [Google Scholar] [CrossRef]
  21. Dong, M.; Wang, B.; Ren, M.; Zhang, C.; Zhao, W.; Albarracín, R. Joint Visualization Diagnosis of Outdoor Insulation Status with Optical and Acoustical Detections. IEEE Trans. Power Deliv. 2019, 34, 1221–1229. [Google Scholar] [CrossRef]
  22. Stefenon, S.F.; Kasburg, C.; Nied, A.; Klaar, A.C.R.; Ferreira, F.C.S.; Branco, N.W. Hybrid deep learning for power generation forecasting in active solar trackers. IET Gener. Transm. Distrib. 2020, 14, 5667–5674. [Google Scholar] [CrossRef]
  23. Corso, M.P.; Stefenon, S.F.; Couto, V.F.; Cabral, S.H.L.; Nied, A. Evaluation of Methods for Electric Field Calculation in Transmission Lines. IEEE Lat. Am. Trans. 2018, 16, 2970–2976. [Google Scholar] [CrossRef]
  24. Ribeiro, M.H.D.M.; Stefenon, S.F.; de Lima, J.D.; Nied, A.; Marini, V.C.; Coelho, L.d.S. Electricity Price Forecasting Based on Self-Adaptive Decomposition and Heterogeneous Ensemble Learning. Energies 2020, 13, 5190. [Google Scholar] [CrossRef]
  25. Robles, G.; Fresno, J.M.; Martínez-Tarifa, J.M.; Ardila-Rey, J.; Parrado-Hernandez, E. Partial Discharge Spectral Characterization in HF, VHF and UHF Bands Using Particle Swarm Optimization. Sensors 2018, 18, 746. [Google Scholar] [CrossRef] [Green Version]
  26. Sampedro, C.; Rodriguez-Vazquez, J.; Rodriguez-Ramos, A.; Carrio, A.; Campoy, P. Deep Learning-Based System for Automatic Recognition and Diagnosis of Electrical Insulator Strings. IEEE Access 2019, 7, 101283–101308. [Google Scholar] [CrossRef]
  27. Qiu, Y.; Wu, G.; Xiao, Z.; Guo, Y.; Zhang, X.; Liu, K. An Extreme-Learning-Machine-Based Hyperspectral Detection Method of Insulator Pollution Degree. IEEE Access 2019, 7, 121156–121164. [Google Scholar] [CrossRef]
  28. Polisetty, S.; El-Hag, A.; Jayram, S. Classification of common discharges in outdoor insulation using acoustic signals and artificial neural network. High Volt. 2019, 4, 333–338. [Google Scholar] [CrossRef]
  29. De La Calle, M.G.; Martinez-Tarifa, J.M.; Gómez Solanilla, A.M.; Robles, G. Uncertainty Sources in the Estimation of the Partial Discharge Inception Voltage in Turn-to-Turn Insulation Systems. IEEE Access 2020, 8, 157510–157519. [Google Scholar] [CrossRef]
  30. Bruns, R. Evaluation of Electrical Insulators Using Ultrasound and Machine Learning. In Computer Furthermore, Computer Seminar; SEMINCO: Blumenau, Brazil, 2019; pp. 1–8. [Google Scholar]
  31. Stefenon, S.F.; Grebogi, R.B.; Freire, R.Z.; Nied, A.; Meyer, L.H. Optimized Ensemble Extreme Learning Machine for Classification of Electrical Insulators Conditions. IEEE Trans. Ind. Electron. 2020, 67, 5170–5178. [Google Scholar] [CrossRef]
  32. Stefenon, S.F.; Oliveira, J.R.; Coelho, A.S.; Meyer, L.H. Diagnostic of Insulators of Conventional Grid Through LabVIEW Analysis of FFT Signal Generated from Ultrasound Detector. IEEE Lat. Am. Trans. 2017, 15, 884–889. [Google Scholar] [CrossRef]
  33. da Silva Júnior, E.T.; de Aquino, F.J.A.; Silva, D.A.; Rocha Neto, A.R.; Gurgel, K.J.A.; de Oliveira, A.E.R.M.; de Araújo, A.L.C. Corona Effect Detection in Energized Polymeric Insulators Using Machine Learning and Ultrasonic Emissions. IEEE Lat. Am. Trans. 2018, 16, 1587–1594. [Google Scholar] [CrossRef]
  34. Maraaba, L.S.; Soufi, K.Y.A.; Alhems, L.M.; Hassan, M.A. Performance Evaluation of 230 kV Polymer Insulators in the Coastal Area of Saudi Arabia. IEEE Access 2020, 8, 164292–164303. [Google Scholar] [CrossRef]
  35. Salem, A.A.; Abd-Rahman, R.; Al-Gailani, S.A.; Salam, Z.; Kamarudin, M.S.; Zainuddin, H.; Yousof, M.F.M. Risk Assessment of Polluted Glass Insulator Using Leakage Current Index Under Different Operating Conditions. IEEE Access 2020, 8, 175827–175839. [Google Scholar] [CrossRef]
  36. Verma, A.R.; Subba, R.B. Understanding surface degradation on polymeric insulators using rotating wheel and dip test under DC stress. IEEE Trans. Dielectr. Electr. Insul. 2018, 25, 2029–2037. [Google Scholar] [CrossRef]
  37. Salem, A.A.; Abd-Rahman, R.; Al-Gailani, S.A.; Kamarudin, M.S.; Ahmad, H.; Salam, Z. The Leakage Current Components as a Diagnostic Tool to Estimate Contamination Level on High Voltage Insulators. IEEE Access 2020, 8, 92514–92528. [Google Scholar] [CrossRef]
  38. Lan, L.; Mu, L.; Yuan, X.; Yan, J.; Wang, Y.; Wang, W.; Shen, Y.; Hao, L. Studies on metallurgical contamination accumulation characteristics on ceramic insulator of 500 kV AC transmission line. IET Sci. Meas. Technol. 2019, 13, 722–728. [Google Scholar] [CrossRef]
  39. Cao, B.; Wang, L.; Yin, F. Measurement of Saturated Water Absorption of the Contamination Layer Deposited on Insulator Surface. IEEE Sens. J. 2019, 19, 10804–10811. [Google Scholar] [CrossRef]
  40. Verma, A.R.; Reddy, B.S. Tracking and erosion resistance of LSR and HTV silicon rubber samples under acid rain conditions. IEEE Trans. Dielectr. Electr. Insul. 2018, 25, 46–52. [Google Scholar] [CrossRef]
  41. Yang, L.; Bi, J.; Zhang, F.; Hao, Y.; Li, L.; Liao, Y.; Zhang, F. Effects of structure and material of polluted insulators on the wetting characteristics. IET Sci. Meas. Technol. 2019, 13, 131–138. [Google Scholar] [CrossRef]
  42. Bi, J.; Hao, Y.; Yang, L.; Zheng, Y.; Li, L. Impact of Hydrophobicity on Wetting Characteristics of Composite Insulators. IEEE Access 2020, 8, 159316–159323. [Google Scholar] [CrossRef]
  43. Yamashita, T.; Ishimoto, R.; Furusato, T. Influence of series resistance on dry-band discharge characteristics on wet polluted insulators. IEEE Trans. Dielectr. Electr. Insul. 2018, 25, 154–161. [Google Scholar] [CrossRef]
  44. NBR 10621, ABNT High-voltage insulators to be used on A.C. systems—Artificial pollution tests. Braz. Assoc. Tech. Stand. 2017, 3, 1–34.
  45. IEC 507, CEI Artificial pollution tests on high-voltage insulators to be used on A.C. systems. Int. Stand. 1991, 2, 1–7.
  46. Hussein, R.; BashirShaban, K.; El-Hag, A. Denoising of acoustic partial discharge signals corrupted with random noise. IEEE Trans. Dielectr. Electr. Insul. 2016, 23, 1453–1459. [Google Scholar] [CrossRef]
  47. Boya, C.; Robles, G. Detection of Partial Discharge Sources Using UHF Sensors and Blind Signal Separation. Sensors 2017, 17, 2625. [Google Scholar] [CrossRef] [PubMed] [Green Version]
  48. Robles, G.; Fresno, J.M.; Martínez-Tarifa, J.M. Radio-Frequency Localization of Multiple Partial Discharges Sources with Two Receivers. Sensors 2018, 18, 1410. [Google Scholar] [CrossRef] [Green Version]
  49. Anjum, S.; Jayaram, S.; El-Hag, A.; Jahromi, A. Detection and classification of defects in ceramic insulators using RF antenna. IEEE Trans. Dielectr. Electr. Insul. 2017, 24, 183–190. [Google Scholar] [CrossRef]
  50. Soltani, A.; El-Hag, A. Denoising of Radio Frequency Partial Discharge Signals Using Artificial Neural Network. Energies 2019, 12, 3485. [Google Scholar] [CrossRef] [Green Version]
  51. Stefenon, S.F.; Steinheuser, D.F.; da Silva, M.P.; Ferreira, F.C.S.; Klaar, A.C.R.; de Souza, K.E.; Júnior, A.G.; Venção, A.T.; Branco, R.; Yamaguchi, C.K. Application of Active Methodologies in Engineering Education Through the Integrative Evaluation at the Universidade do Planalto Catarinense, Brazil. Interciencia 2019, 44, 408–413. [Google Scholar]
  52. Asimakopoulou, G.E.; Kontargyri, V.T.; Tsekouras, G.J.; Asimakopoulou, F.E.; Gonos, I.F.; Stathopulos, I.A. Artificial neural network optimisation methodology for the estimation of the critical flashover voltage on insulators. IET Sci. Meas. Technol. 2009, 3, 90–104. [Google Scholar] [CrossRef] [Green Version]
  53. Baczyński, D.; Parol, M. Influence of artificial neural network structure on quality of short-term electric energy consumption forecast. IEE Proc. Gener. Transm. Distrib. 2004, 151, 241–245. [Google Scholar] [CrossRef]
  54. Leung, F.H.F.; Lam, H.K.; Ling, S.H.; Tam, P.K.S. Tuning of the structure and parameters of a neural network using an improved genetic algorithm. IEEE Trans. Neural Netw. 2003, 14, 79–88. [Google Scholar] [CrossRef] [PubMed] [Green Version]
  55. Mejía-Lavalle, M.; Rodríguez-Ortiz, G. Flashover forecasting on high-voltage insulators with a backpropagation neural net. Can. J. Electr. Comput. Eng. 1996, 21, 29–32. [Google Scholar] [CrossRef]
  56. Haghighi, A.; Shadloo, M.S.; Maleki, A.; Abdollahzadeh Jamalabadi, M.Y. Using Committee Neural Network for Prediction of Pressure Drop in Two-Phase Microchannels. Appl. Sci. 2020, 10, 5384. [Google Scholar] [CrossRef]
  57. Chen, P.C.; Chien, K.Y. Machine-Learning Based Optimal Seismic Control of Structure with Active Mass Damper. Appl. Sci. 2020, 10, 5342. [Google Scholar] [CrossRef]
  58. Jahromi, A.N.; El-Hag, A.H.; Jayaram, S.H.; Cherney, E.A.; Sanaye-Pasand, M.; Mohseni, H. A neural network based method for leakage current prediction of polymeric insulators. IEEE Trans. Power Deliv. 2006, 21, 506–507. [Google Scholar] [CrossRef]
  59. Liu, Y.; Pei, S.; Fu, W.; Zhang, K.; Ji, X.; Yin, Z. The discrimination method as applied to a deteriorated porcelain insulator used in transmission lines on the basis of a convolution neural network. IEEE Trans. Dielectr. Electr. Insul. 2017, 24, 3559–3566. [Google Scholar] [CrossRef]
  60. Shafiq, M.; Kauhaniemi, K.; Robles, G.; Hussain, G.A.; Kumpulainen, L. Partial discharge signal propagation in medium voltage branched cable feeder. IEEE Electr. Insul. Mag. 2018, 34, 18–29. [Google Scholar] [CrossRef]
  61. Xin, X.; Li, J.; Zhao, D.; Li, S.; Xie, Q.; Li, Z.; Fan, F.; Bi, C.; Zhang, X. Double-check base editing for efficient A to G conversions. ACS Synth. Biol. 2019, 8, 2629–2634. [Google Scholar] [CrossRef]
Figure 1. Insulators used in the experiment: (A) the two insulators presented side by side; (B) bottom of the good insulator; (C) top view of the perforated insulator; (D) bottom view of the perforated insulator.
Applsci 11 01592 g001
Figure 2. Ultrasound recording from the electric voltage application.
Applsci 11 01592 g002
Figure 3. Insulator fixing using insulating material.
Applsci 11 01592 g003
Figure 4. Multilayer perceptron model.
Applsci 11 01592 g004
Figure 5. Flowchart of the used procedure presented in this paper. From the ultrasound data the features are extracted from .wav files. These features are then used to train the neural networks of interest, classifying the insulators using the double check technique.
Applsci 11 01592 g005
Figure 6. Raw ultrasound recorded signals: (A) insulator without perforation and without contaminants; (B) insulator without perforation and with contaminants; (C) insulator without perforation and with contaminants (with added salt); (D) perforated insulator without contaminants; (E) perforated wet insulator; (F) perforated contaminated insulator.
Applsci 11 01592 g006
Figure 7. Extracted features for ANN training: (A) maximum value; (B) minimum value; (C) mean value; (D) variance; (E) root mean square.
Applsci 11 01592 g007
Figure 8. Algorithm convergence process: (A) perforated; (B) contaminated.
Applsci 11 01592 g008
Table 1. M500 model Pettersson specifications.
SpecificationValue
Weight60 g
Dimensions 43 × 114 × 13 mm
MicrophoneAdvanced electret
Sampling frequency384 kHz
Resolution16 bits
Frequency range10–160 kHz
InterfaceUSB 2.0, full speed, OTG/host
Anti-aliasing filter8th order, 160 kHz
PowerUSB bus powered
Table 2. ANN results.
Accuracy
Neurons/
Multiplier
Training/
Test (%)
Perforated/
Non-Perforated
Contaminated/
Non-Contaminated
6/150/5080.85%50.03%
80/2081.92%51.92%
90/1080.83%51.50%
95/0582.00%50.00%
8/150/5080.87%50.27%
80/2081.92%52.00%
90/1080.67%51.00%
95/0582.00%49.67%
12/150/5080.93%50.37%
80/2081.92%51.75%
90/1080.83%51.33%
95/0582.00%49.67%
16/150/5079.67%50.23%
80/2081.92%53.25%
90/1080.83%50.50%
95/0582.00%53.33%
16/250/5081.20%54.17%
80/2082.17%68.25%
90/1080.83%66.50%
95/0582.00%64.00%
16/450/5081.26%67.77%
80/2082.00%63.58%
90/1080.83%66.33%
95/0582.00%64.66%
Table 3. ANN results by case.
Accuracy
Case NumberCondition DescriptionPerforated/ Non-PerforatedContaminated/ Non-Contaminated
Case #1Insulator in Good Condition99.6%77.8%
Case #2Insulator with Kaolin100.0%79.3%
Case #3Insulator with Kaolin and Salt100.0%79.1%
Case #4Perforated Insulator0.1%37.8%
Case #5Perforated Wet Insulator94.7%58.1%
Case #6Perforated Contaminated Insulator95.1%78.9%
Table 4. ANN results by case regarding contaminated/non-contaminated classification—double check.
Case NumberCondition DescriptionAccuracy
Case #1Insulator in Good Condition93.7%
Case #2Insulator with Kaolin94.9%
Case #3Insulator with Kaolin and Salt92.8%
Case #4Perforated Insulator27.0%
Case #5Perforated Wet Insulator63.7%
Case #6Perforated Contaminated Insulator95.2%
Publisher’s Note: MDPI stays neutral with regard to jurisdictional claims in published maps and institutional affiliations.

