Article

Historically Based Room Acoustic Analysis and Auralization of a Church in the 1470s

by
Hanna Autio
1,*,
Mathias Barbagallo
1,2,*,
Carolina Ask
3,
Delphine Bard Hagberg
1,
Eva Lindqvist Sandgren
4 and
Karin Strinnholm Lagergren
5,6
1
Division of Engineering Acoustics, Lund University, Box 118, 221 00 Lund, Sweden
2
Brekke & Strand Akustik AB, Box 122, 201 21 Malmö, Sweden
3
Freelance Consultant, 222 20 Lund, Sweden
4
Department of Art History, Uppsala University, Box 630, 751 26 Uppsala, Sweden
5
Department of Music and Art, Linnæus University, 351 95 Växjö, Sweden
6
Alamire Foundation, Leuven University, B-3001 Leuven, Belgium
*
Authors to whom correspondence should be addressed.
Appl. Sci. 2021, 11(4), 1586; https://doi.org/10.3390/app11041586
Submission received: 28 December 2020 / Revised: 3 February 2021 / Accepted: 5 February 2021 / Published: 10 February 2021
(This article belongs to the Special Issue Advances in Architectural Acoustics)

Abstract

:
Worship space acoustics have been established as an important part of a nation’s cultural heritage and area of acoustic research, but more research is needed regarding the region of northern Europe. This paper describes the historical acoustics of an important abbey church in Sweden in the 1470s. A digital historical reconstruction is developed. Liturgical material specific to this location is recorded and auralized within the digital reconstruction, and a room acoustic analysis is performed. The analysis is guided by liturgical practices in the church and the monastic order connected to it. It is found that the historical sound field in the church is characterized by the existence of two distinct acoustical subspaces within it, each corresponding to a location dedicated to the daily services of the monastical congregations. The subspaces show significantly better acoustic conditions for liturgical activities compared to the nave, which is very reverberant under the conditions of daily services. Acoustic transmission from the two subspaces is limited, indicating that the monastic congregations were visually and acoustically separated from the visitors in the nave and each other.

1. Introduction

The acoustics of worship spaces are a significant element of a nation’s cultural heritage. The concept of cultural heritage is described by UNESCO as
“those sites, objects and intangible things that have cultural, historical, aesthetic, archaeological, scientific, ethnological or anthropological value to groups and individuals” [1].
Since UNESCO’s adoption of the Convention for the Safeguarding of the Intangible Cultural Heritage [2] in 2003, the acoustics and acoustical experiences of churches have been established as an important area of research. The interaction between ritualistic and cultural expressions in churches and their acoustics have been the topic of several research projects [3,4,5,6,7,8,9,10]. The comprehensive review article on church acoustics by Girón et al. [11] discusses the efforts of several research teams who have acoustically characterized a large number of churches across the world and, specifically, Europe.
Most of this research has focused on churches located in countries around the Mediterranean sea, resulting in less scientific literature regarding churches in northern Europe. While Polish researchers have made interesting analyses on some churches around the Baltic Sea [12,13] and there is research on some Russian churches [14], there is very little, if any, acoustic research on religious buildings in Scandinavia and, specifically, Sweden. The research presented in this paper sheds new light on intangible cultural heritage in this part of the world by presenting a room acoustic analysis on a digital reconstruction of Vadstena abbey church in Sweden. This work is part of a larger research project [15].
Such archaeoacoustical [16] projects, where acoustic simulations in digital reconstructions of historical spaces are performed, have already been undertaken [17,18,19,20,21]. The results of these projects may be combined with visual models to produce Virtual Reality experiences, which has been done by several teams [22,23,24] and is the goal of this project. Efforts such as these require a tight collaboration between acousticians, 3D artists, historians, and musicologists to tackle the intrinsic multidisciplinary nature of the research. The large amount of heritage objects not yet investigated with such techniques, the relative novelty of the underlying technologies, and the challenges posed by such collaborations motivates further research projects such as the one reported on in this paper.
The combination of archaeoacoustic modeling and visual models often requires some form of auralization. Auralization can be defined as “... the process of rendering audible, by physical or mathematical modeling, the soundfield of a source in a space, in such a way as to simulate the binaural listening experience at a given position in the modeled space” [25]. Application and implementation of auralization is in itself a large research area [26,27,28]. Although auralized audio samples are presented in this paper, the main focus is placed on the development of the 3D model, and on the room acoustic analysis. A foundational course in auralization can be found in [29].
Liturgical practices are characterized by significant auditory elements, such as prayers, chants, or preaching. Understanding of these practices and how they function within a church benefits from room acoustic analyses of churches. Such analyses are based on room acoustic parameters typically computed from impulse responses, which can be estimated using acoustic simulation software. For example, the perception of chant is strongly related to early reverberation [4], and the intelligibility of song and speech can be related to clarity parameters. As within any volume, room acoustic parameters in a church may have a weaker or stronger spatial dependence.
Spatial variations of room acoustic parameters within churches depend partly on varying materials and partly on varying geometry. Churches are often large, complex buildings with vaulted ceilings and spaces such as choirs, transepts, chapels, or apses. This may lead to the formation of acoustic subspaces [30] that are characterized by room acoustic parameters significantly deviating from the rest of the space. For instance, such subspaces may result in varying perceived reverberation as indicated by EDT within the apse, or degradation of clarity far from the chancel.
In some cases, the structural separation of such subspaces serves a liturgical purpose. For example, smaller chapels may be dedicated for funeral procedures, or the choir for the hourly services of a monastic congregation. Distinct liturgical purposes may coincide with distinct liturgical activities, such as the monastical service being characterized by the chanting of the congregation. As the liturgical activities benefit from proper acoustics, the acoustics in a given subspace must be evaluated with respect to the activities at that location. Pedrero et al. [7] presents such research regarding the cathedral in Toledo, which indicates that the acoustical properties in the subspaces supported the activities performed there. Similar results regarding the choir have been seen in several research projects [31,32,33].
The interaction between religious rites and acoustics is not yet fully understood, especially when spatial variations within churches are considered. It has been established that the acoustic requirements of worship spaces differ from conventional acoustic guidelines [7,34], but there is not yet a strong consensus on what these requirements are. As of yet, the international standard on measurements of room acoustic parameters, ISO 3382, does not contain guidelines for acoustic measurements of worship spaces. Although there exist established methods for such measurements [35], the lack of an official standard may lead to variations in the measurement methods which in turn cause issues when comparing the results of such measurements. In addition, the lack of guidelines regarding acoustic requirements may cause issues when acousticians are tasked with constructing new worship spaces, or improve existing spaces. The analysis in this paper, where room acoustic parameters within the abbey are combined with a discussion of the religious purposes of various subspaces, may help shed light on these questions.
The goal of this paper is twofold: First, describing the process of constructing a historically accurate archeo-acoustical digital model of an abbey church in Sweden. Second, presenting the analysis of its room acoustic properties. To start, some background information on the abbey is briefly presented. Then, certain aspects of the historically based digital reconstruction are discussed. This description shows that the conclusions of the acoustical analysis rely on sound historical research, and act as inspiration for future, similar projects. Subsequently, recordings of material for auralization are briefly presented. The process of acoustic simulation is described, and the simulated acoustic field is analyzed in detail both globally and locally within acoustic subspaces.

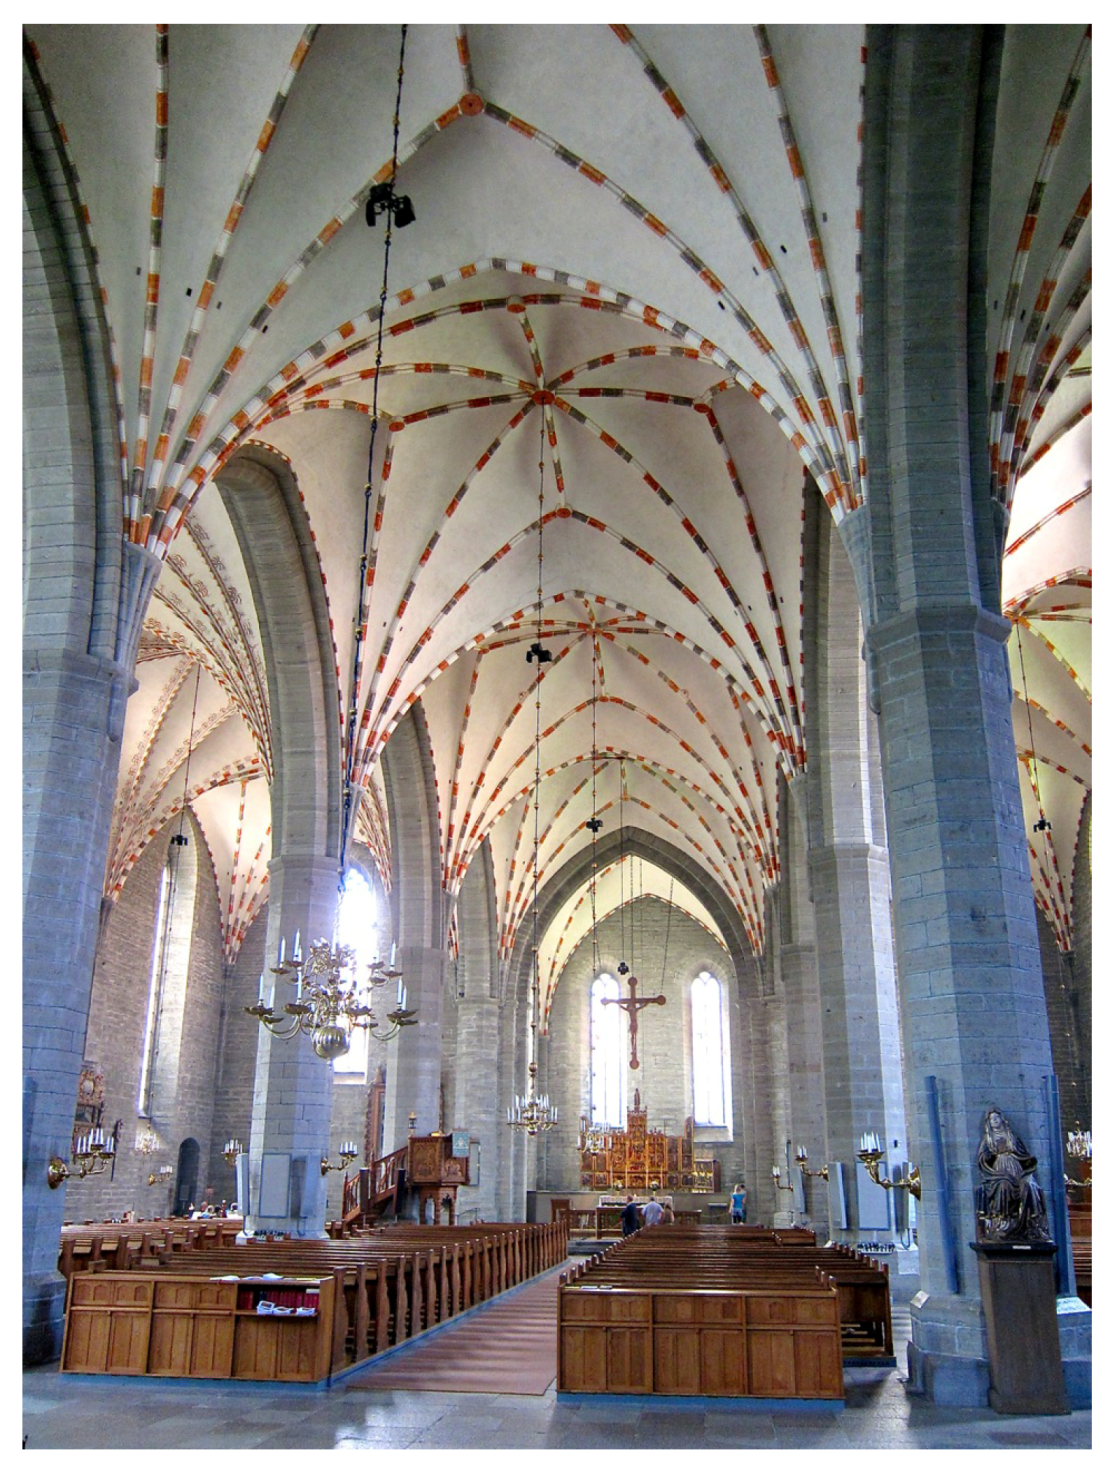
2. Background on the Church

The church targeted for reconstruction in this paper is a Gothic abbey church located in the south of Sweden, built in the 14th and 15th century. It played an important religious and cultural role in the Nordic countries in the middle ages. After the Swedish reformation (1527), the monastery was eventually dissolved and the abbey church fell into disrepair and neglect for almost two centuries. Although some artifacts remain and most of the abbeys extensive library has been preserved, the interior space of the church has been significantly altered due to several renovations [36].
The church itself is oriented west–east, with the chancel in the west. Its nave is divided into three aisles of five bays each, every bay measuring about 11 × 11 m2. In the west, the central aisle is extended by an apse of approximately the same size as the bays. The church walls and pillars are built of limestone, and the ceiling vaults are of plastered brick. In the present day, the interior walls are of naked stone, but their rough surface indicate that they were originally plastered. It is also known that plaster was removed during a renovation in the 19th century [36]. A photograph of the modern day church can be seen in Figure 1, and a 3D model of the interior walls and vaulted ceiling is shown in Figure 2.
The church and its abbey was the mother abbey of a religious order of both monks and nuns. The monks and nuns lived in separate enclosures, but shared the same church. Both congregations had a specific location within the church where their services were celebrated. The order was characterized by the premiership of women, and is the source of the only known monastical office exclusive for women [37].
The information about the order guides the acoustic analysis to focus on the dedicated spaces for the monastic congregations, especially the nuns’. These two areas are digitally reconstructed, as described in Section 3.1. The monks’ choir and the gallery may both be interpreted as choirs. As the choir often has an important role in the acoustics of a church [32,33], a deep acoustic analysis is motivated both by religious and acoustic considerations. However, only traces of the structures remain in the church today, and a historically based digital reconstruction is the only practical option to evaluate the historical sound field of the space.
Below, the processes of digital reconstruction, recording of liturgical elements, and acoustic simulations of the church are presented. The foundations of the historical model are described thoroughly, as one of the goals of the paper is to inspire future researchers in similar projects, and to validate the acoustic results based on historical information.

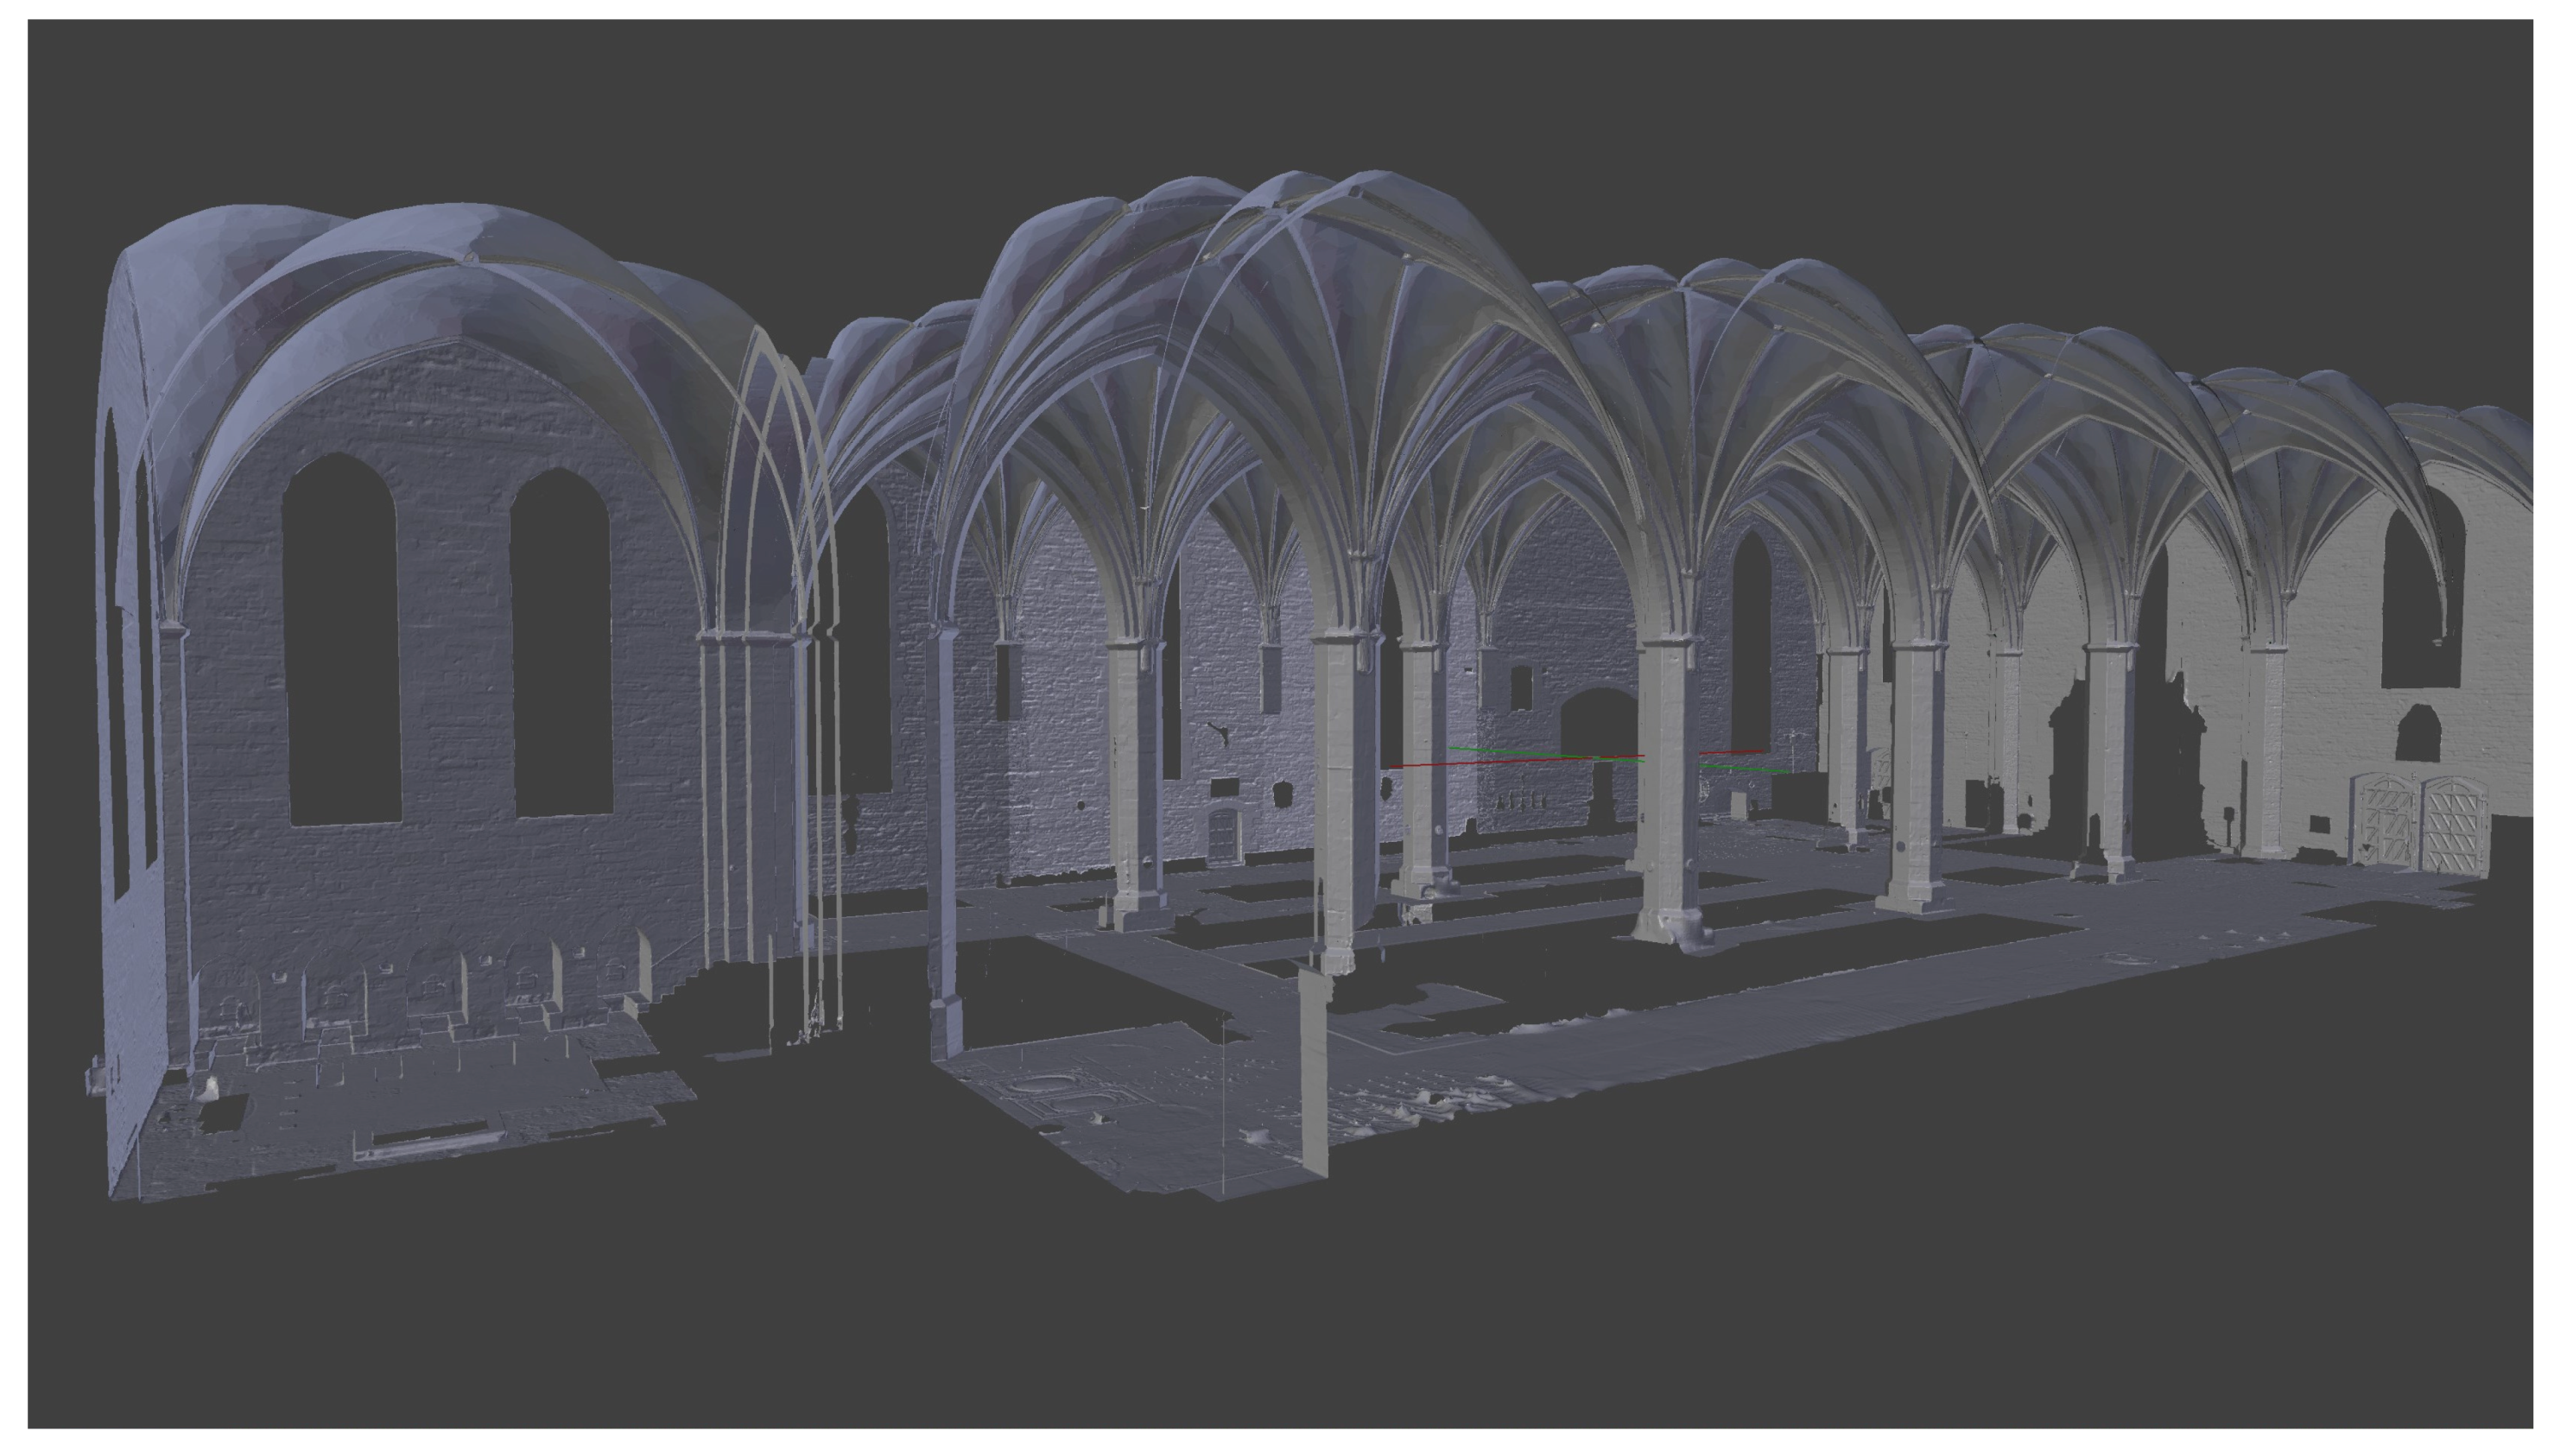
3. Digital and Historical Reconstruction
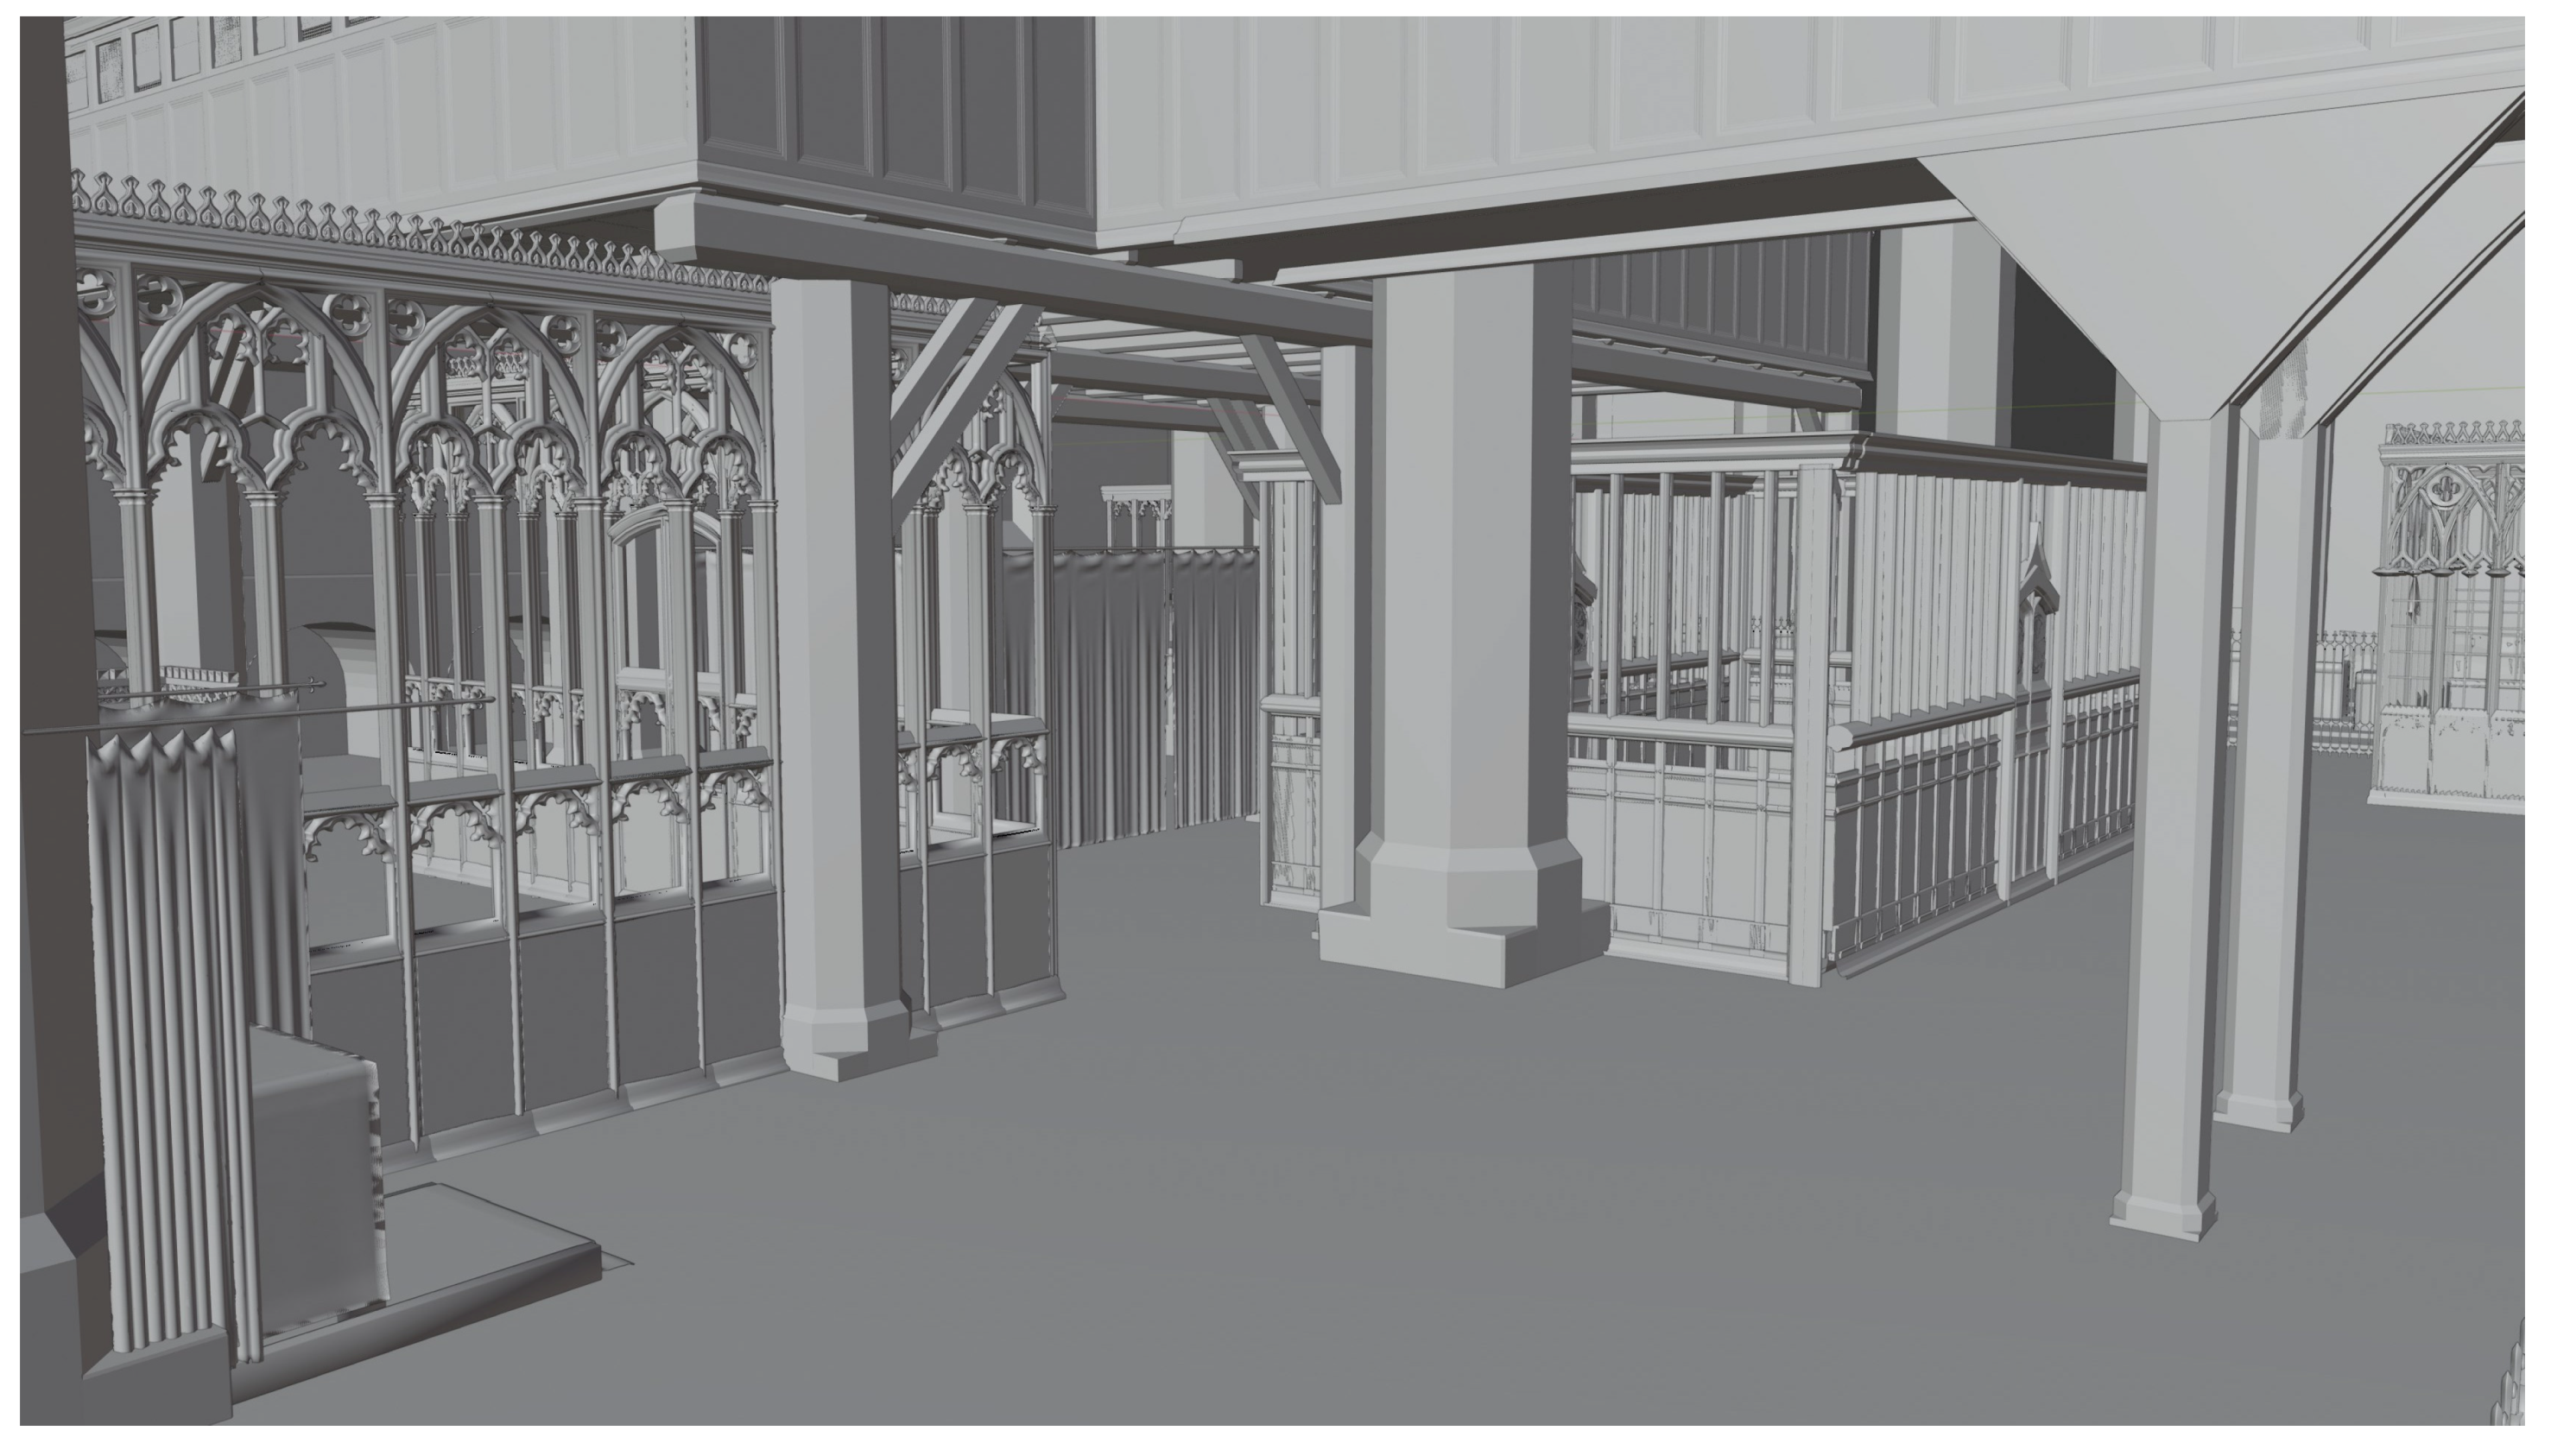
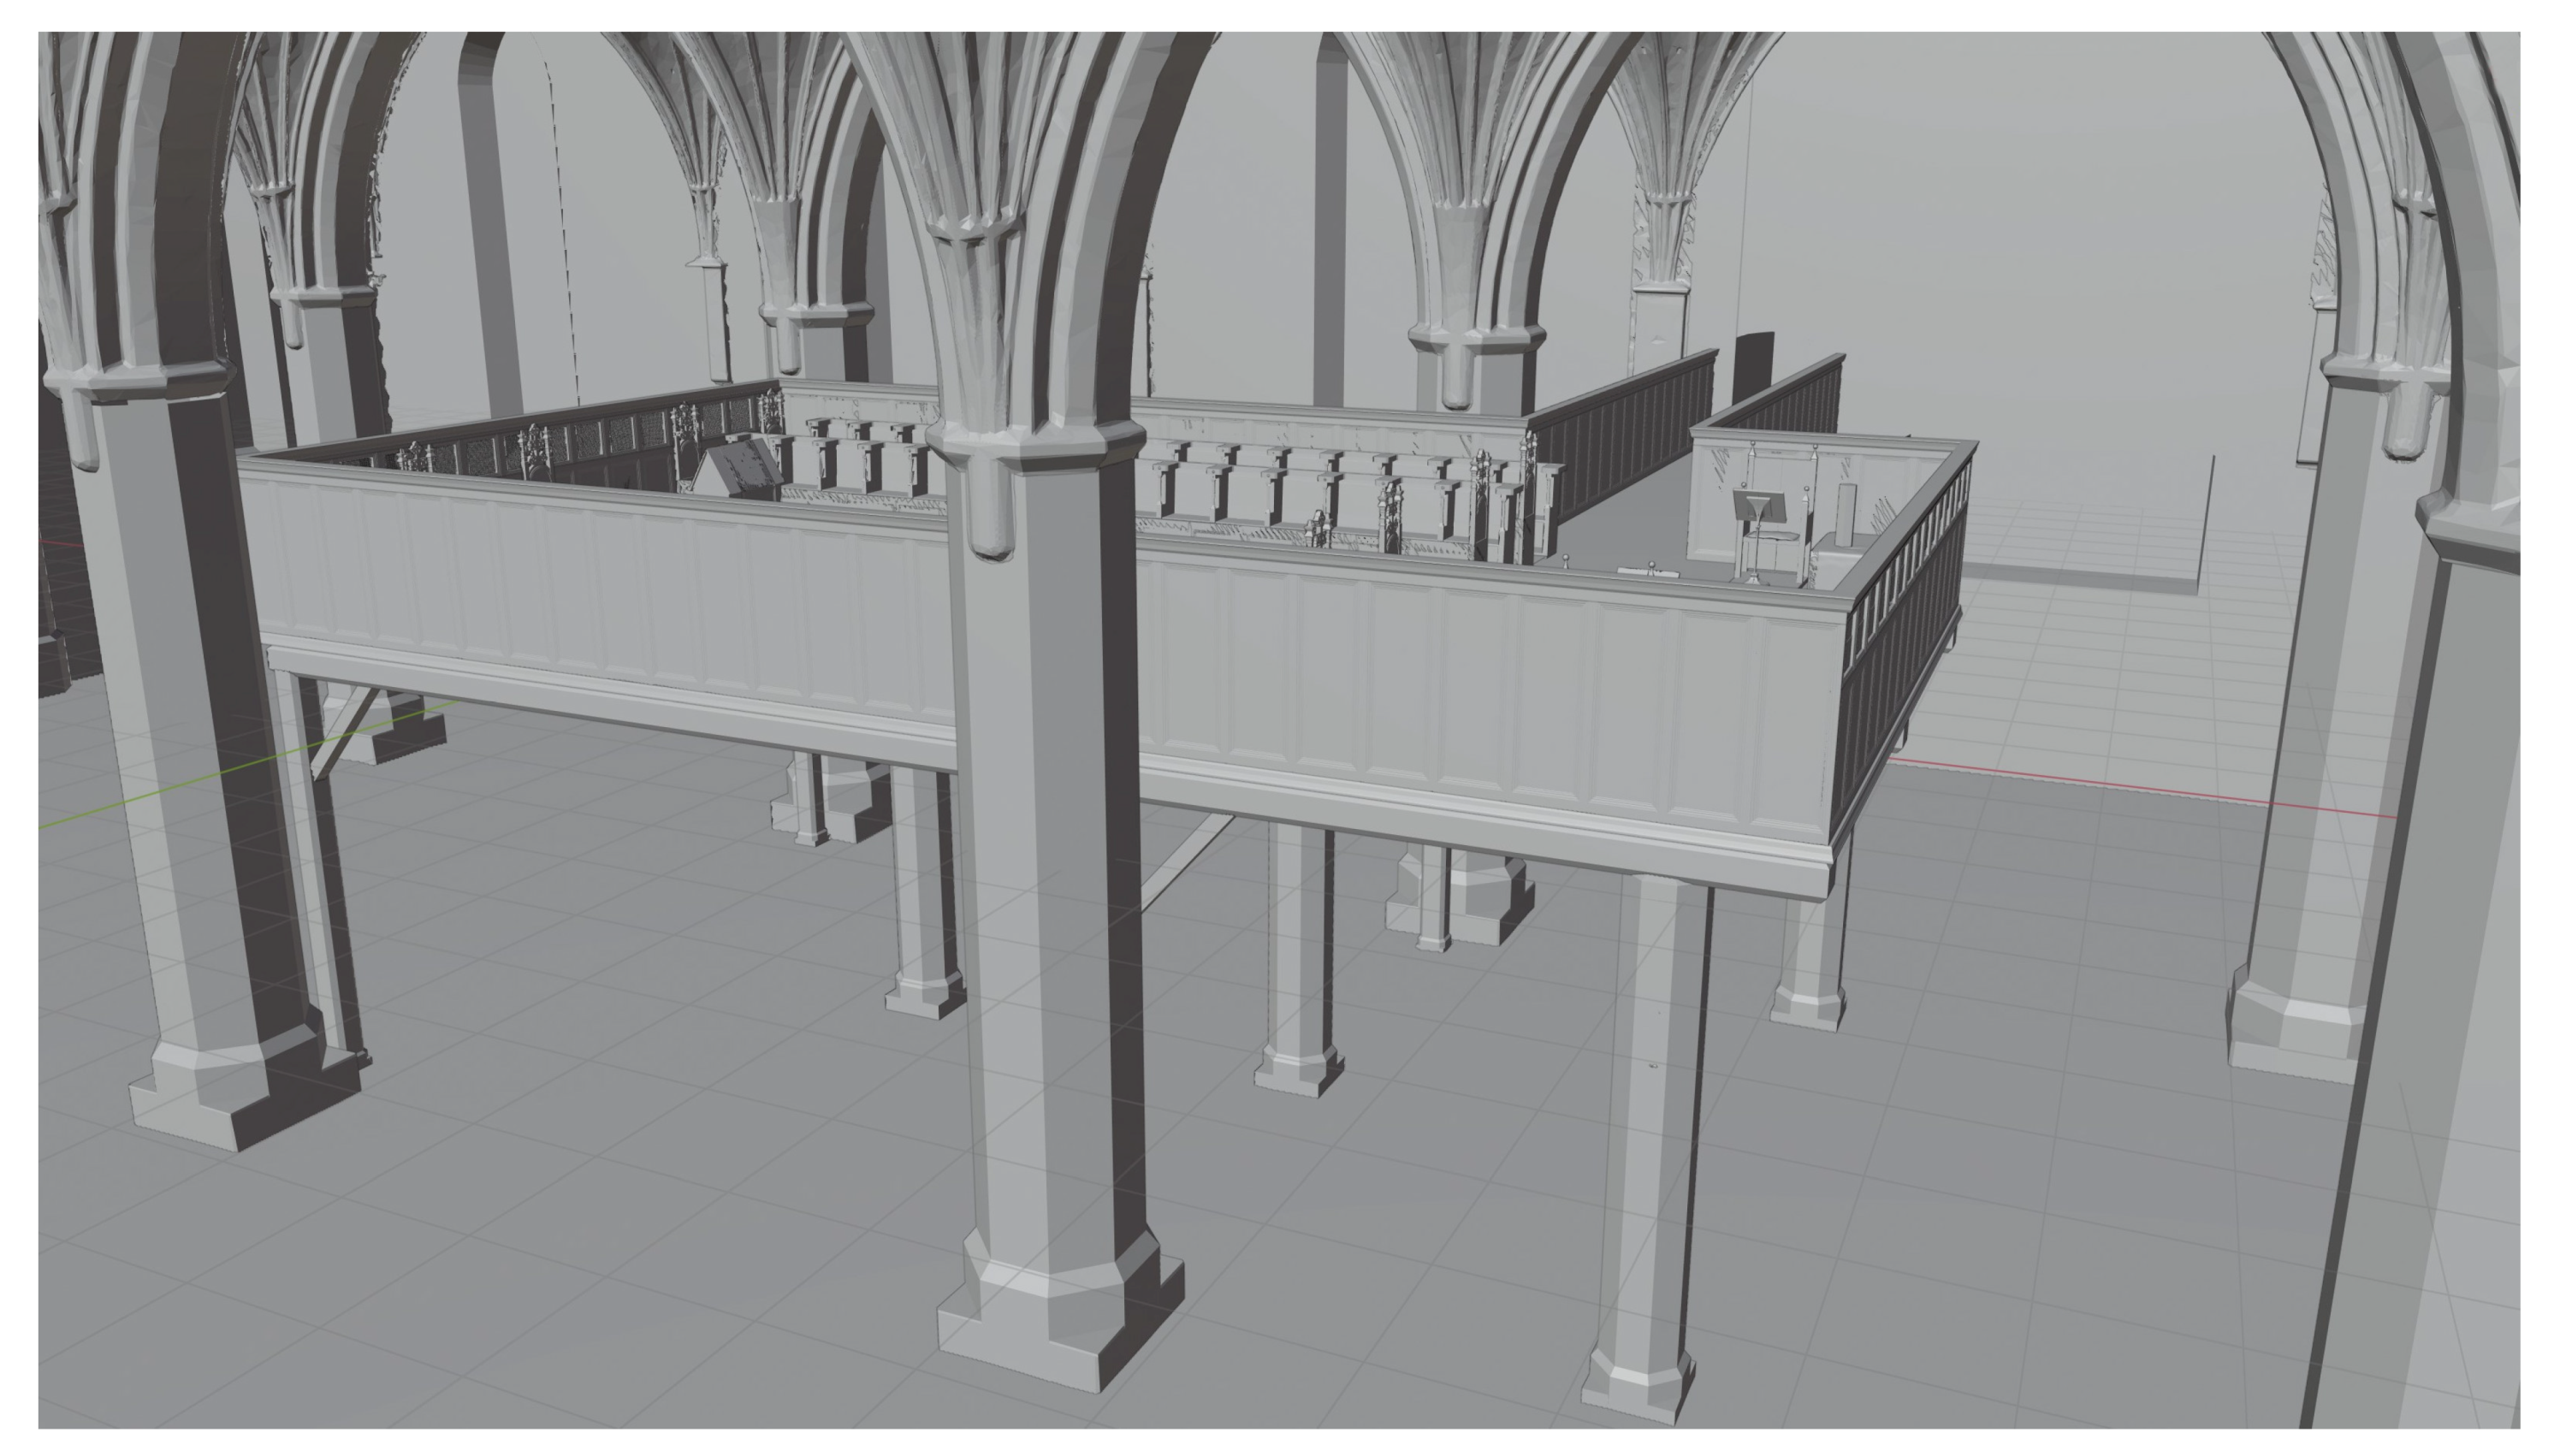
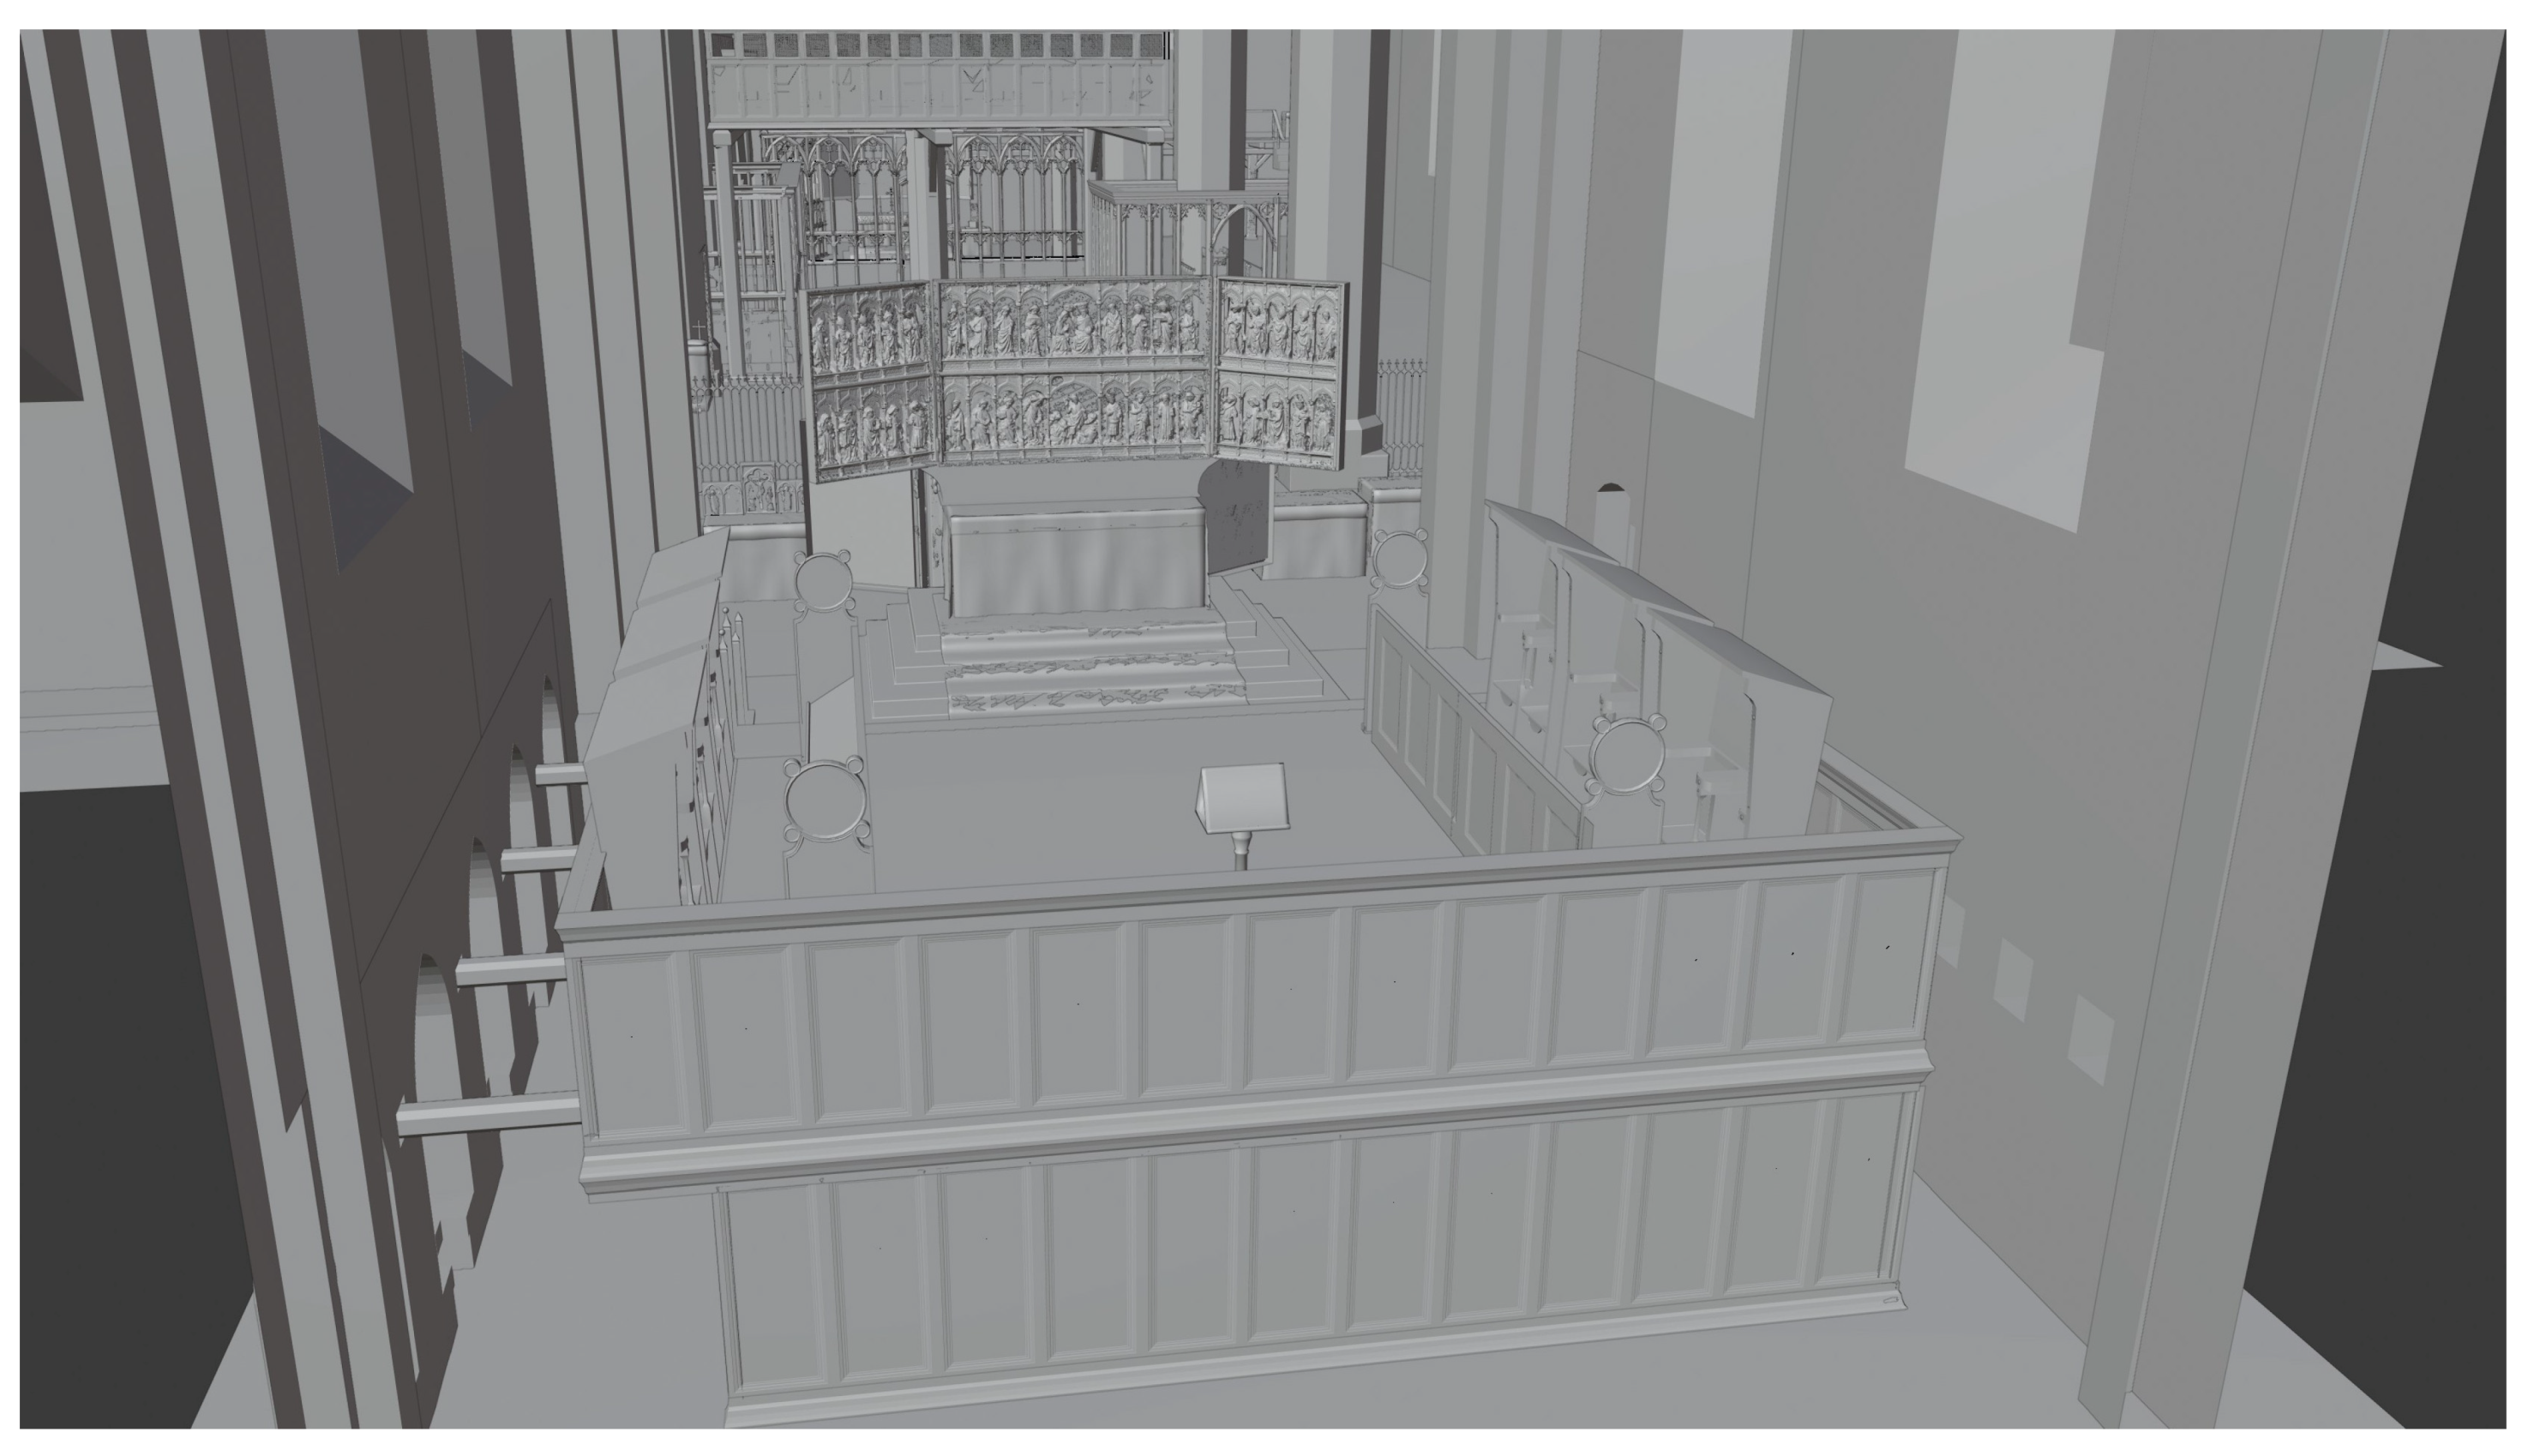
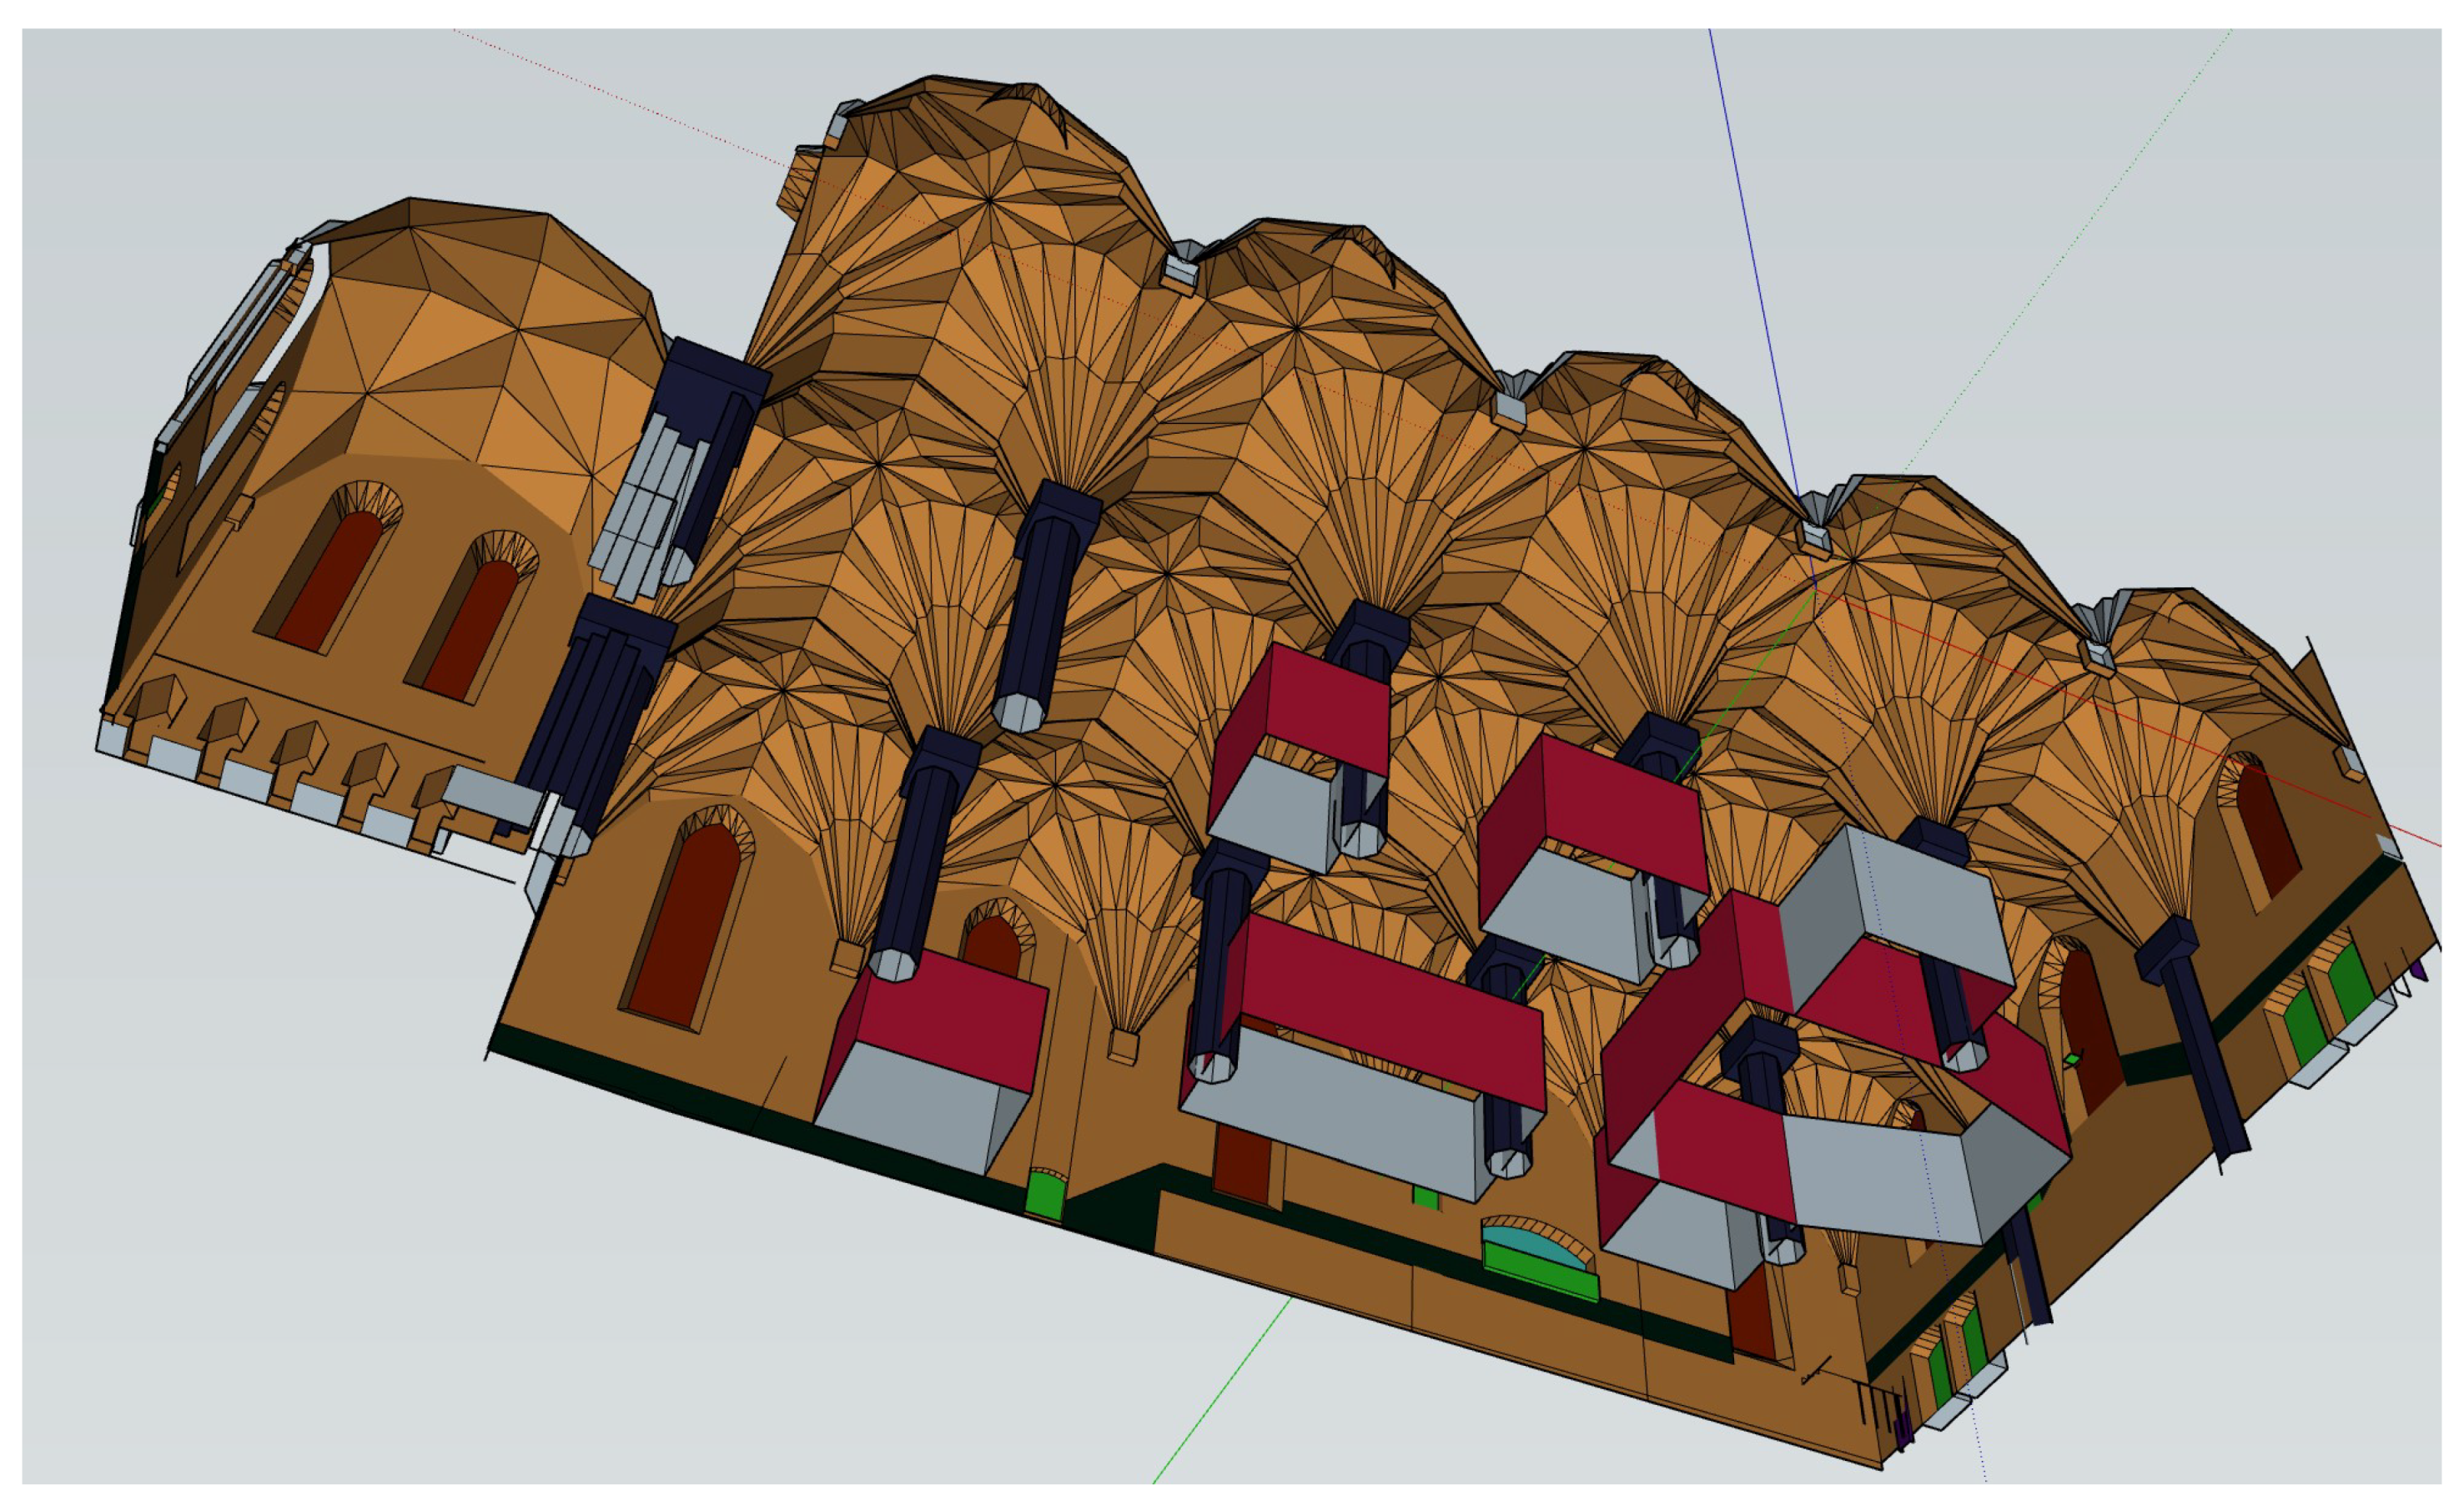
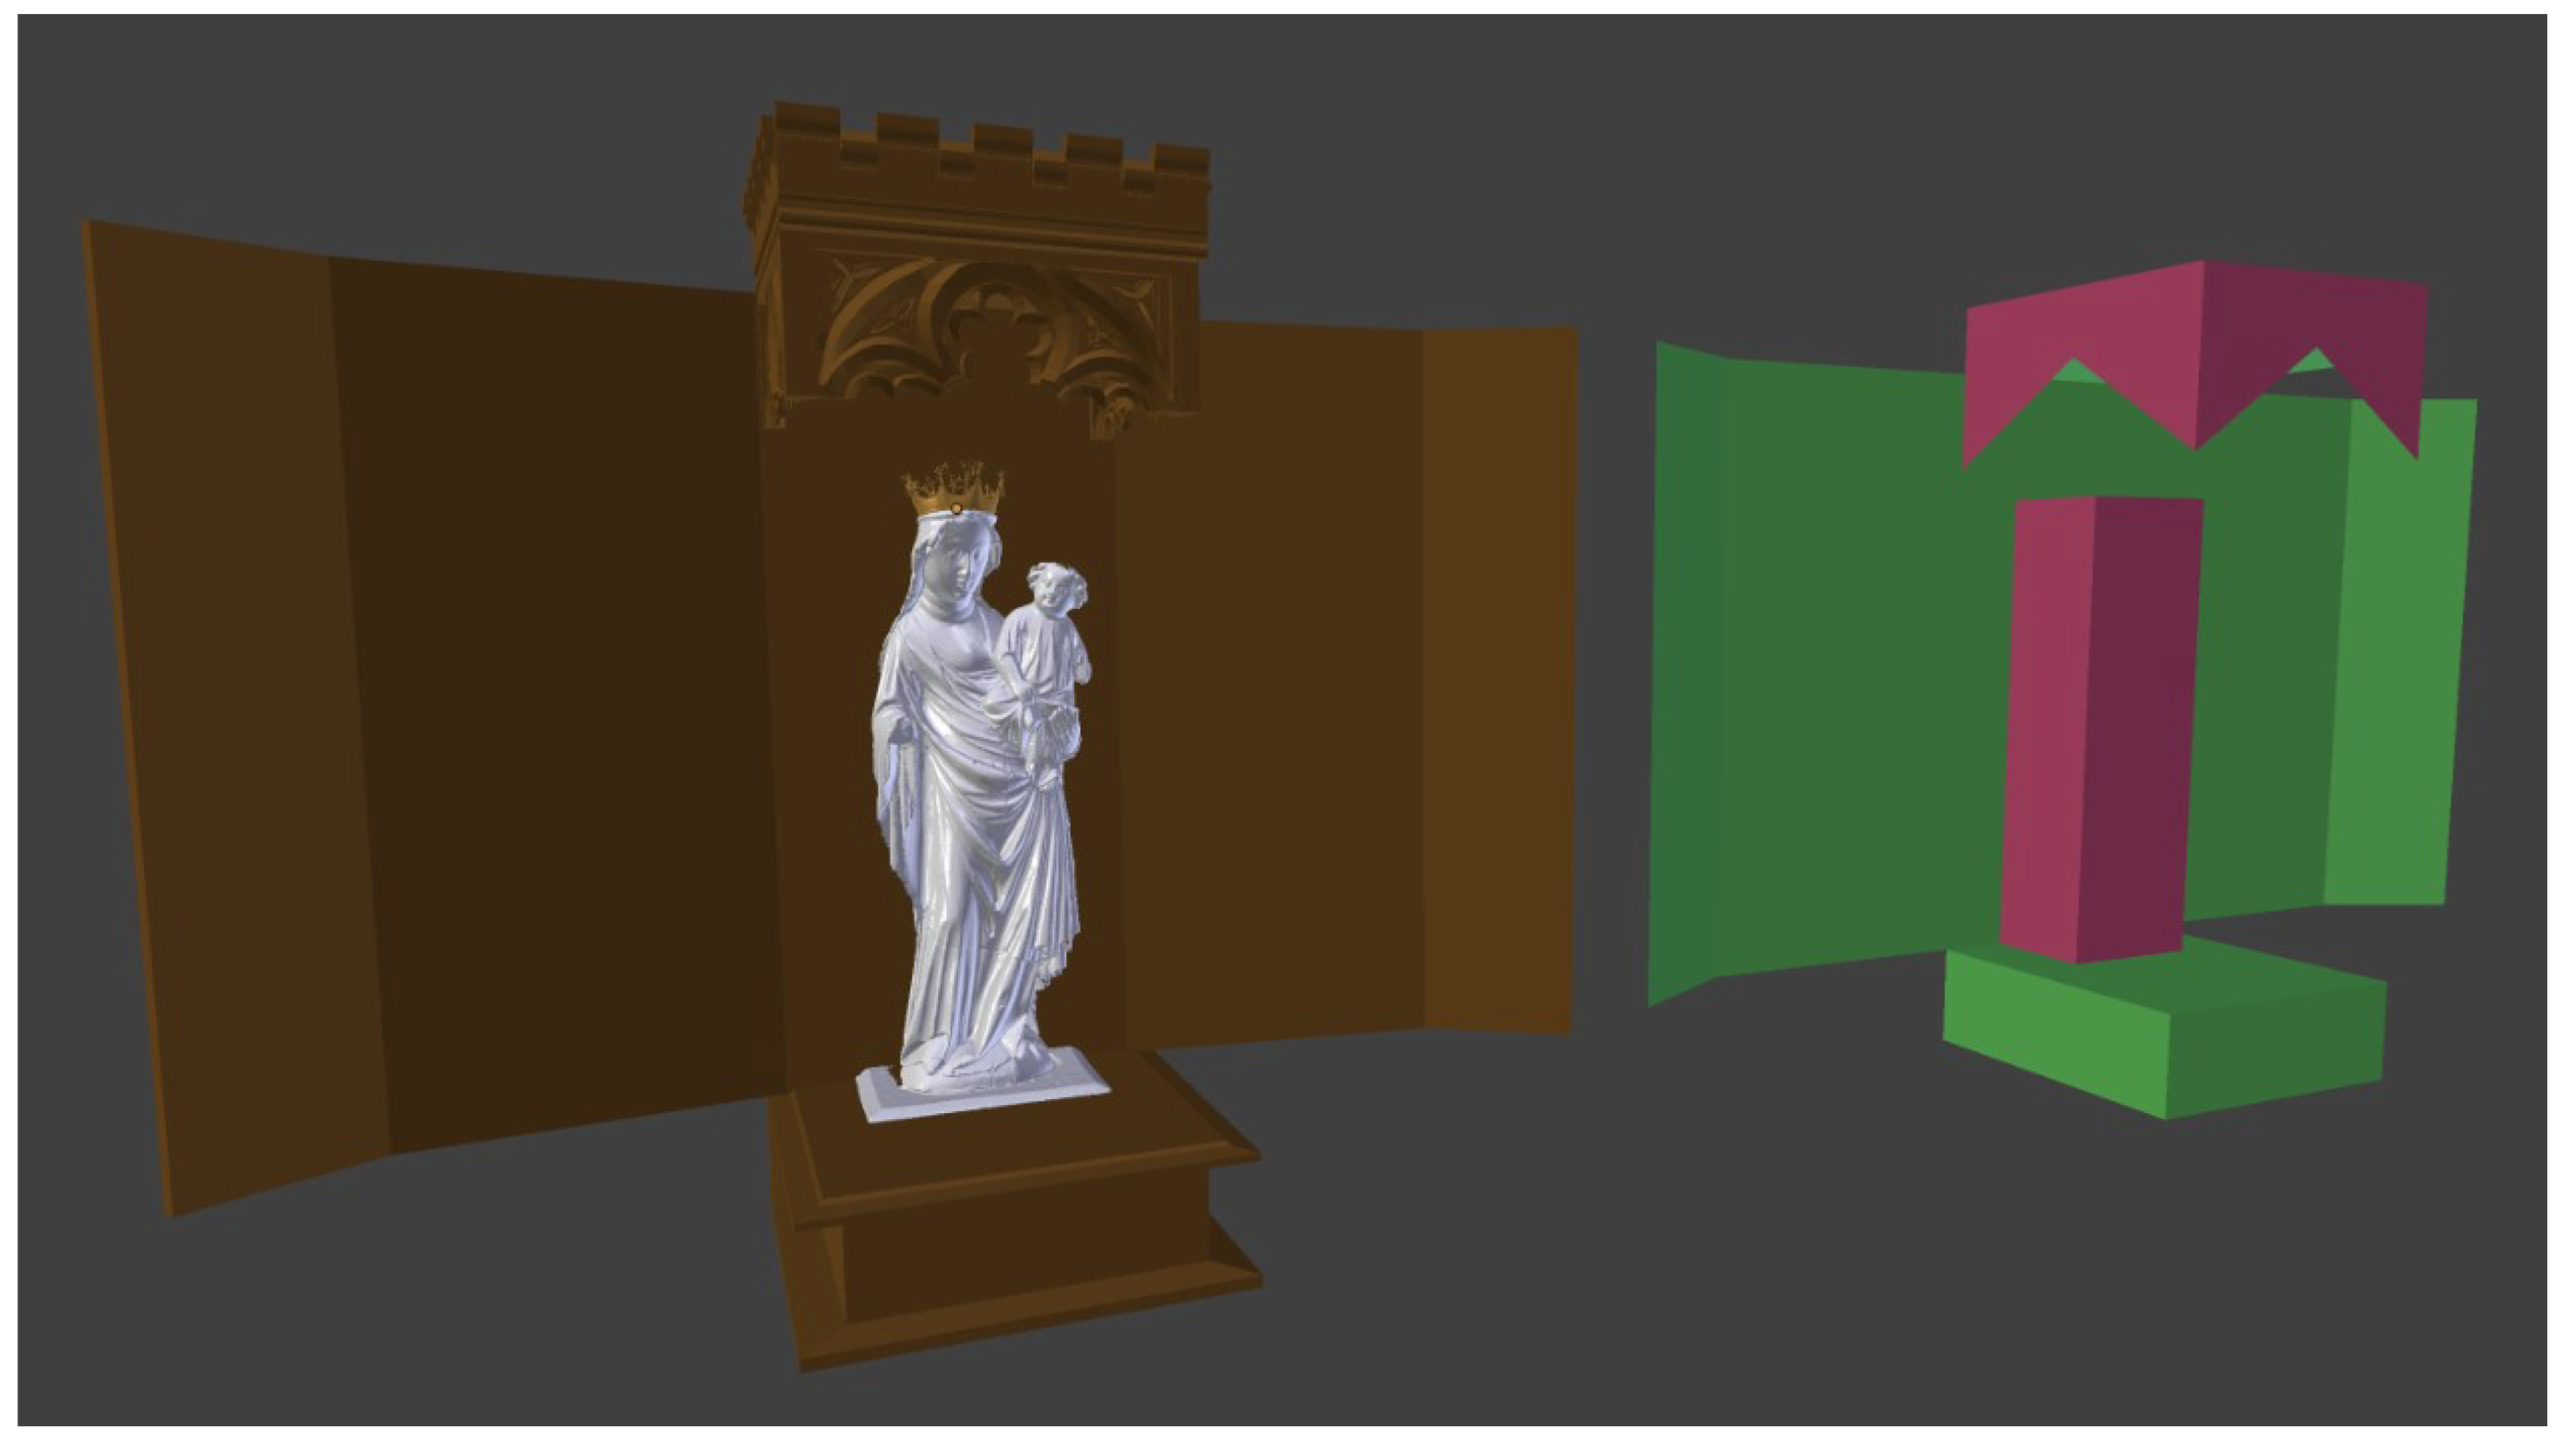
The digital reconstruction aims at a time period around year 1470, as this coincides with a period in the abbey’s history for which the historical source material is rich. The acoustics of daily religious practices are examined by recording and auralizing material from an ordinary Friday sext. This condition was also the target of room acoustic analysis, characterizing the acoustic properties of the space under normal conditions.
In the following sections, the process of creating the elements for auralization and room acoustic simulation are described. First, the construction of the digital model is discussed. The reconstructions of the spaces for monks and nuns in particular are presented. The recording of material for the auralization is discussed, and finally a few comments are made regarding the adaptation of the high-detail visual model for acoustic simulation software.

3.1. Model Creation

A wide range of historical sources were used in the construction of the digital model. Due to the importance of the church in question, there are many sources directly related to it. This includes drawings, documents, plans, maps, traces in the church room, and historical objects such as sculptures and textiles. In addition, there is a range of earlier research [36,38,39,40,41,42]. This material could be complemented by more general historical information regarding practices for the given time period and geographical location. The collected information was translated into concrete 3D suggestions of what lost and altered parts of the church interior may have looked like.
One of the first steps in the creation of a digital model was the laser-scanning of the complete interior space of the church, aimed at obtaining a high-resolution 3D model to be used as reference. This model was then further processed and refined using the graphical modeling software Blender. First, elements of the scan dating later than the 15th century, as based on historical information, were removed from the digital model. The resulting model of the 15th century shell (Figure 2) was a starting point for the digital reconstruction.
The 15th century shell was extended by 3D suggestions of lost and altered parts of the interior, based on information in historical sources. Different suggestions were then evaluated to find which were more plausible. This process was iterative, and involved primarily the art historian and 3D modeler within the project. Experts on medieval construction, theology, and archaeology were consulted when appropriate.
The evaluation and appraisal of the different 3D suggestions benefited from working in a spatial environment. Formulating the constructions in a 3D space made it clear that some suggestions were incompatible with the church room itself, historical accounts, or other constructions. For example, in some cases several constructions would need to occupy the same space, or they might lack necessary physical support structures. Further refinement could be achieved when liturgical practices were considered. Line of sight to certain spots important for the liturgy, processional walkways, and easy access to key locations was necessary for the religious functionality of the space, and could thus be used to dismiss less appropriate solutions.
The next sections will focus on key areas of the church. First, the furnishings in the nave are discussed briefly. Second, the reconstruction of the gallery and the choir are described and motivated.

3.1.1. The Nave Area

The historical nave of the church was filled with over 60 altars [39] and a multitude of richly decorated grave chapels, giving it a very different impression compared to today (Figure 1). Examples of high-detail reconstructions of chapels and altars are shown in Figure 3. These types of structures are expected to have had a significant impact on the acoustics of the medieval nave. The large number of decorated and complex surfaces lead to increased scattering of the acoustic field, which may have contributed to increased diffusivity. On the other hand, the presence of these structures may have lead to the formation of acoustical subspaces which would imply an increased acoustic heterogeneity.
An additional aspect affecting the acoustic field in the nave was the prevalence of textiles. Textiles played an important part of the furnishing in a late medieval church, and were used as curtains creating small enclosures around most altars (see Figure 3), covers for altars not in use, decorations on altars and walls, and carpets.
The historical reconstruction is expected to reduce reverberation in the nave compared to today, both due to textiles and wood structures such as chapels. The large empty stone volume of the nave today offers very little absorption area, and the reverberation time is long [43]. Wooden grave chapels are expected to increase the amount of absorption across all frequencies, most significantly for the mid-high range. In addition, the large amount of textiles will increase absorption for high frequencies. Together, these effects will lead to a decrease in reverberation across the full frequency range. Such results have been found in other projects [5,44].

3.1.2. The Nuns’ Gallery

The construction of an elevated platform for the nuns in the middle of the church is prescribed in the building instructions of the abbey [45]. The only visible remnant of this platform today is a niche near the ceiling vaults that was once its entrance (Figure 4). Research has several suggestions on the specific form and placement of the nuns’ gallery [36,38], but there is so far no consensus on its specific location, size, or configuration.
The suggested configuration of the gallery in this project is based on historical documents and physical traces in the church room, and shown in Figure 4. It is surrounded by high panels, and its size was estimated to 10 × 18 m2. This is large enough to accommodate the congregation of nuns and the furnishings required for religious purposes [45,46]. In addition, this size allows for the display of a series of paintings along the interior western side of the gallery, which are recorded in [47]. The high panels surrounding the gallery ensure that the nuns could not be seen by anyone else in the church, although see-through lattices allow them visual access to key altars, as required by religious documents [48].
The location of the gallery was determined by using information from a geophysical investigation of the church floor. This investigation revealed anomalies which were interpreted as foundations of support pillars for the gallery. The final model of the gallery, shown in Figure 4, satisfies requirements regarding function and size, is structurally sound and matches the physical traces well.
This interpretation of the gallery is located close to the vaulted ceiling and is separated from the rest of the nave by its floor and panel walls. As such, it likely acts as an acoustical subspace for the congregation of nuns, as is often found in the choir [7,31,32]. As the congregation of nuns gathered there, it is also plausible that the space was characterized by increased absorption by the presence of nuns and their clothing, leading to decreased reverberation and increased clarity. In addition, the gallery’s central position close to the vaulted ceiling may have had a significant effect on the transmission of sounds from the gallery.

3.1.3. The Monks’ Choir

The monks were located in the choir behind the chancel, in the apse in the west of the church. (left side, Figure 2). As the ground level in this area is about 1 m below the nave, a wooden platform has been suggested to bring the monks to an elevation more liturgically favorable [36]. Possible beam holes and records of the removal of wooden elements from this location support this theory, and it is adopted in this reconstruction.
The shape and size of the wooden platform were determined based on physical traces in the church. Beam holes, book niches, confessionals, and a door opening prescribed the solution shown in Figure 5. Choir stalls were based on duplicates of two choir stalls which remain today.
Similar to the nuns’ gallery, this space served the purpose of housing a monastical congregation. Some differences with the nuns’ gallery are noted. First, the distance between monks and the vaulted ceiling was significantly larger than that between nuns and the ceiling. Second, the monks’ choir was in a recessed position nestled in the apse behind the chancel. It is thus enclosed by close, hard walls on three of four sides, which may affect the sound field within the choir to the point where it differed significantly from that in the gallery and the nave. The acoustic characteristics of this space, especially as compared to the gallery, are further investigated in Section 4.1.

3.2. Recording Liturgy

This section describes the overall process of acquiring anechoic recordings of appropriate liturgical material for the auralization task. The full process of selecting material, recording material, and choosing performers will not be fully described here. Only the final choice in material will be presented, and the recordings themselves will be briefly discussed.
The liturgical practices of the order located in this abbey are quite well documented. The daily services consisted of monophonic Gregorian chant, from the respective divine offices of the monks and nuns. The nuns followed their unique liturgical office, as mentioned in Section 2, while the monks observed the liturgy of the diocese where the abbey was located [37]. This information made it possible to recreate a plausible Friday sext, from which elements were chosen for recording. The selected material was chosen to include the important liturgical elements of the service: short responsories, antiphons, prayers, and psalms.
The number of participants in the Friday sext was estimated to about 10 for each congregation. There were to be 60 nuns and 25 monks in the monastery, and only 13 of the monks were ordained and participated in all services. All members of the congregations had responsibilities which may excuse them from services and in particular they might be absent from the small hours (prime, terce, sext, and none). It was concluded that eight male voices and twelve female voices would suffice for the recordings.

Recordings

The recordings were made in the anechoic chamber at Engineering acoustics, LTH, Lund University. Four male and three female singers, familiar with the style of music and the material, were recruited for the recordings. They were recorded using four close mics model Milab VM-44, hanging from the walls.
In order to reach a plausible number of voices in the recordings, the singers were recorded multiple times. During each recording, all participants belonging to the same group were performing together in the anechoic chamber. One of them was wearing headphones, playing back any earlier recordings and fed with generic live 6 s reverb effect; this time length was chosen as the singers deemed it more helpful to achieve good results as compared to no, or 3 s, reverb. The others followed this individual. The variations caused by this method are thought to be consistent with the assumption that these individuals were performing a daily task, albeit as part of a service. Recording and mixing were done in Cubase 11.0.
Singing in a anechoic chamber may pose challenges for singers both due to lack of support and response from the room, and due to the physical influence such environment may have on humans. Such circumstances have an impact on the performance itself, and may result in a presentation that is quite different from how the same material would be presented in a more traditional space, such as a church. The addition of artificial reverb, the choice of singers, and great care during the recording process were used to combat these effects, but it is not possible to guarantee that the presentation is not affected by the discrepancy between the recording conditions and the church. Such problems have been encountered in other research projects, and have not yet been solved [22,49].
A musicologist familiar with the material was present for the full duration of the recordings, ensuring that the performance was as accurate as possible. As the act of performing in an anechoic chamber can be very challenging, the singers took frequent breaks. During these breaks, the performers, the producer, and the musicologist listened together to the recording, both dry and with added reverb, and determined whether it was of an appropriate tempo and quality.
In addition to elements of the sext, some additional sounds were recorded. These were background sounds including prayers, said by female and male voices, the sound of historically representative clothing, sounds from a rosary, sounds from walking with leather shoes against a stone surface, and coughing.

3.3. Room Acoustic Simulations

The digital model constructed in Section 3.1 was exported from Blender to Google Sketch-up and therein adapted for simulations in ODEON 16.0 [50]. Simulations were performed both to characterize the historical sound field in the reconstructed abbey and with the goal of producing auralizations of the sext itself. This section describes the process of adapting the digital model for simulation, as well as the choices made for simulation and auralization.
During the simulation, air absorption was tuned to conditions of 18C and 50% relative humidity.

3.3.1. Adaptation of the Digital Model

The high-detail model used for visual presentation was transformed into a digital model for acoustic simulation, primarily by simplification of various surfaces. The structure of the ceiling vaults was simplified significantly, and detailed models of sculptures and altar decorations were replaced by simple geometric forms. This improves the performance of the acoustic simulations with regards to accuracy and to calculation speed. Examples of simplifications are shown in Figure 6 and Figure 7. The simplified model is exported from Google Sketch-up using ODEON’s exporting tool and imported to ODEON. The exported model counts 5600 surfaces and takes around 1.5 s to export to ODEON format.

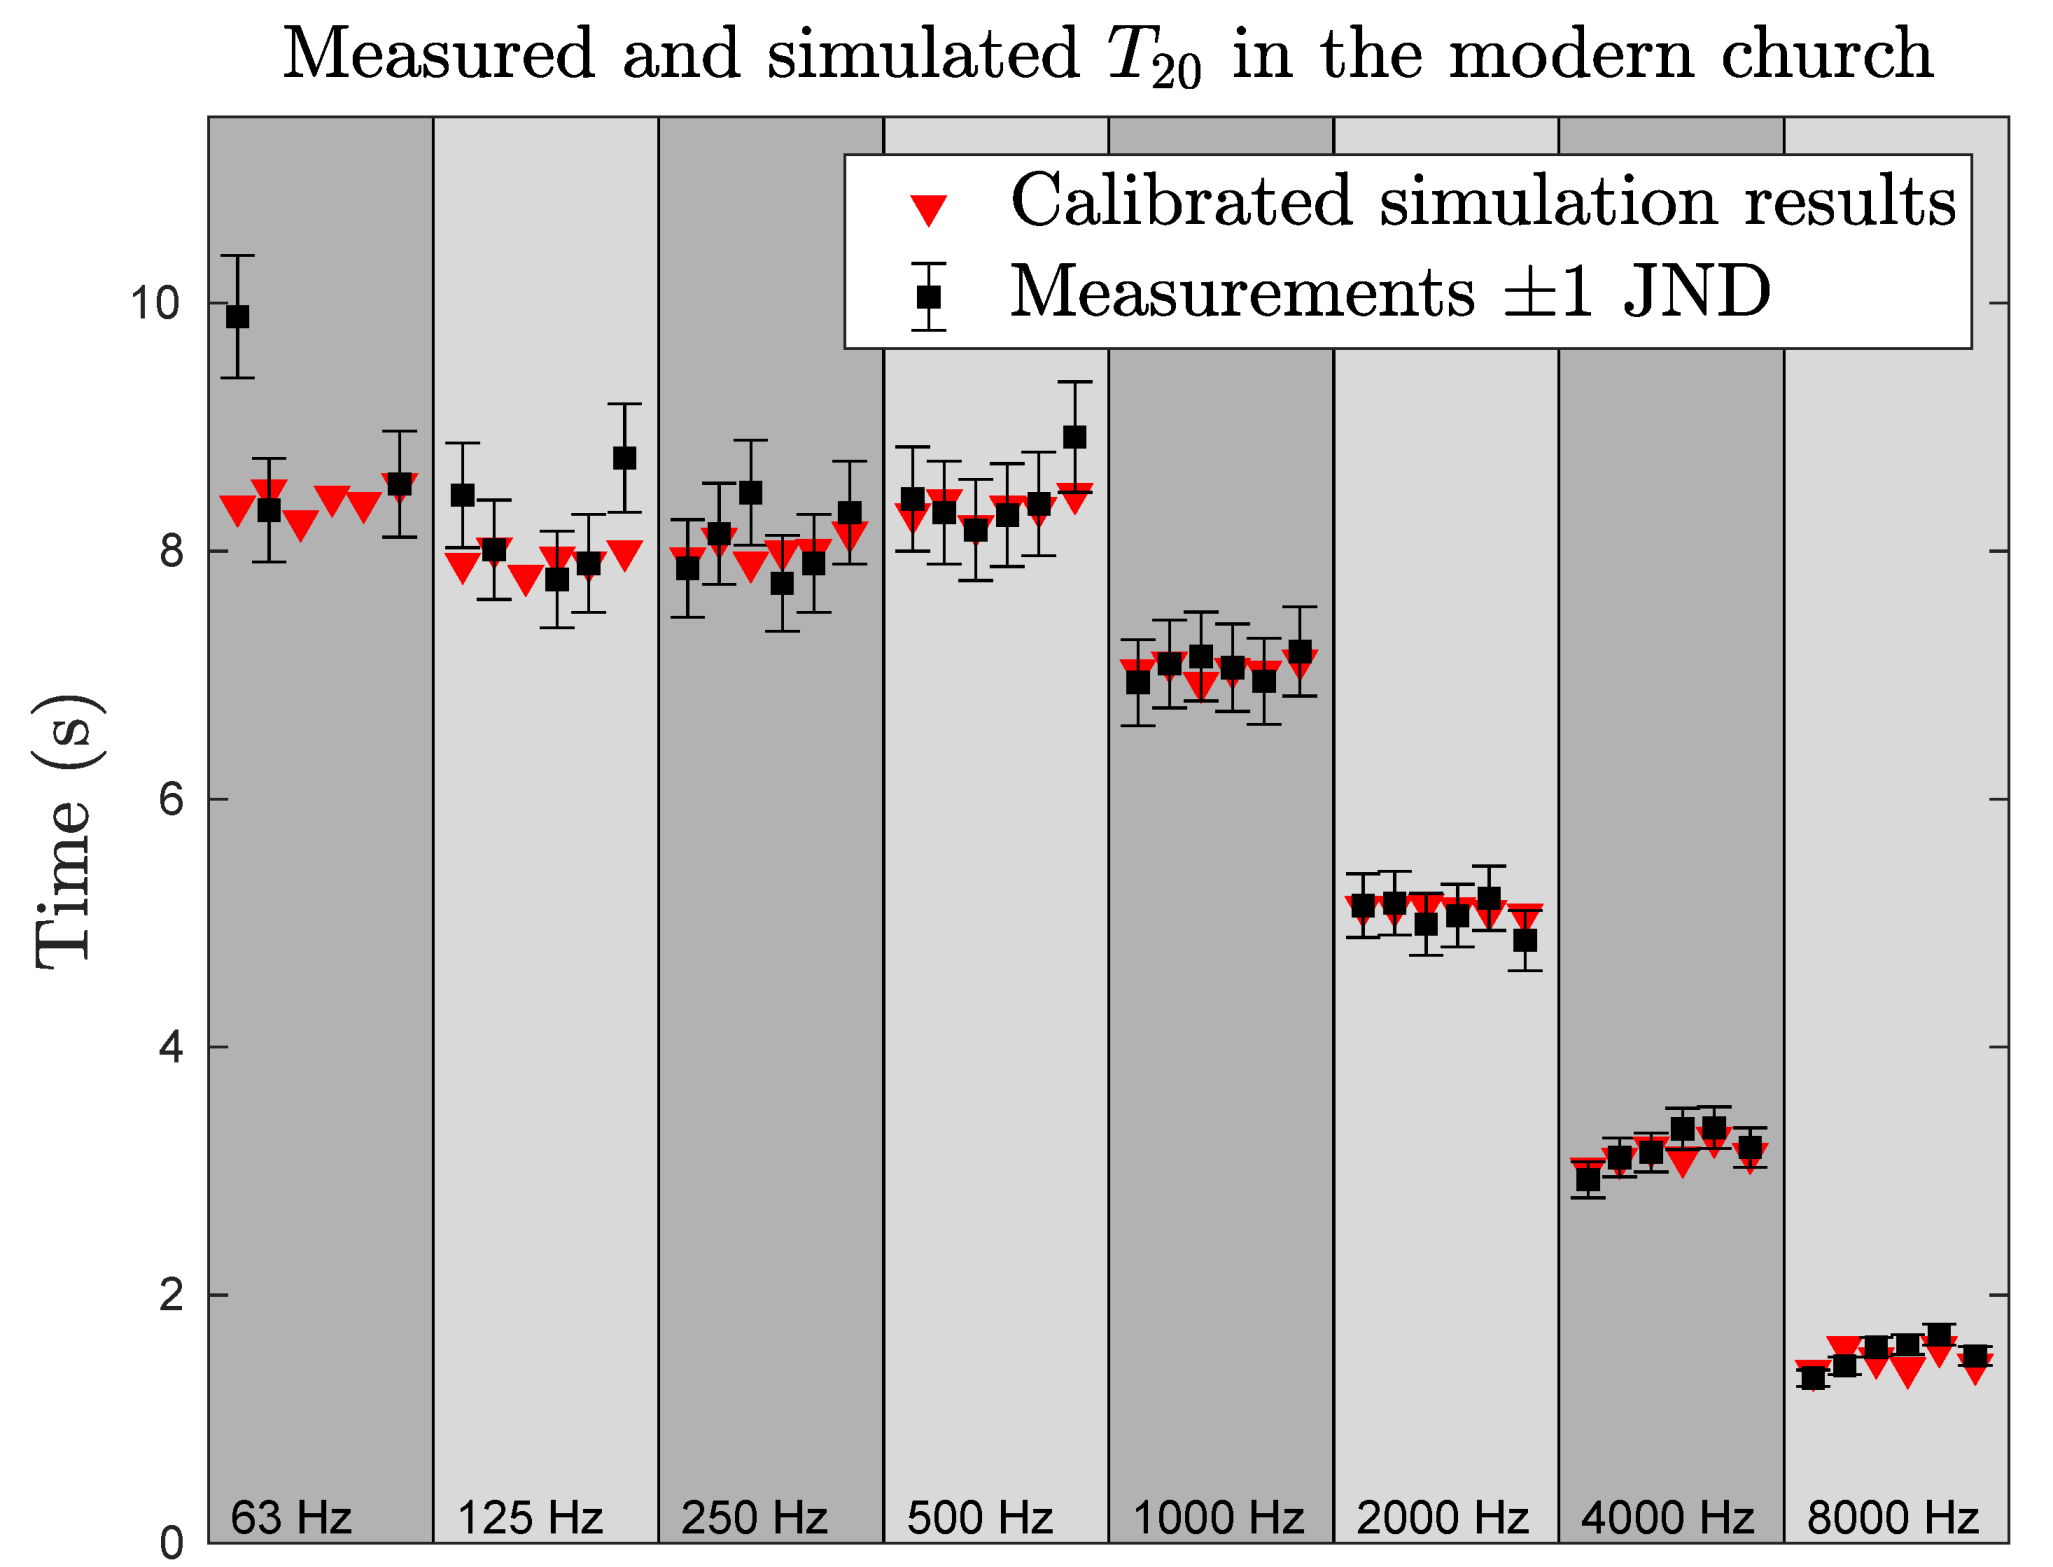
3.3.2. Acoustic Properties of Materials in the Church and Calibration of the Model

The acoustic properties of the various materials in the church needed to be estimated. As an initial step, table values for absorption and scattering from several different sources were used. The full table of material parameters is given in Appendix A.
Whereas there are many table values for absorption coefficients, scattering coefficients are more difficult to measure and may vary depending on the software used. In ODEON, scattering coefficients for 707 Hz are provided by the user, which are then extrapolated to the full frequency range using a built-in algorithm. For the simulations in this project, table values were primarily used. When these were unavailable, mid-frequency scattering was estimated from the characteristic depth of the structure in question, as discussed in [51].
To improve the quality of the absorption coefficient estimates, calibration by comparison to modern reverberation time measurements (measured by the integrated impulse response method [52] and a B&K type 2270 analyzer) was performed. As the modern interior of the church differs so significantly from the historical configuration (see, e.g., Figure 1 and Figure 3, Figure 4 and Figure 5), only a few materials can be calibrated: the vaulted ceilings, the glass windows, and the stone floor. These are assumed to have the same material properties as during the 1470s, whereas the walls which were historically covered by plaster are now bare and can not be calibrated.
The calibration is performed using ODEON’s built-in genetic algorithm optimization tool, in a digital model corresponding to the modern church. This model comprises the exterior shell, modern wooden pews, and the main altar. This corresponds to the conditions under which the modern measurements were performed. The average error of the simulated reverberation time in the calibration model compared to measurements is within ± 1.4 JND (see in Figure 8 for detailed comparison for each octave band and position). The calibrated material parameters were then used in the historical digital model.

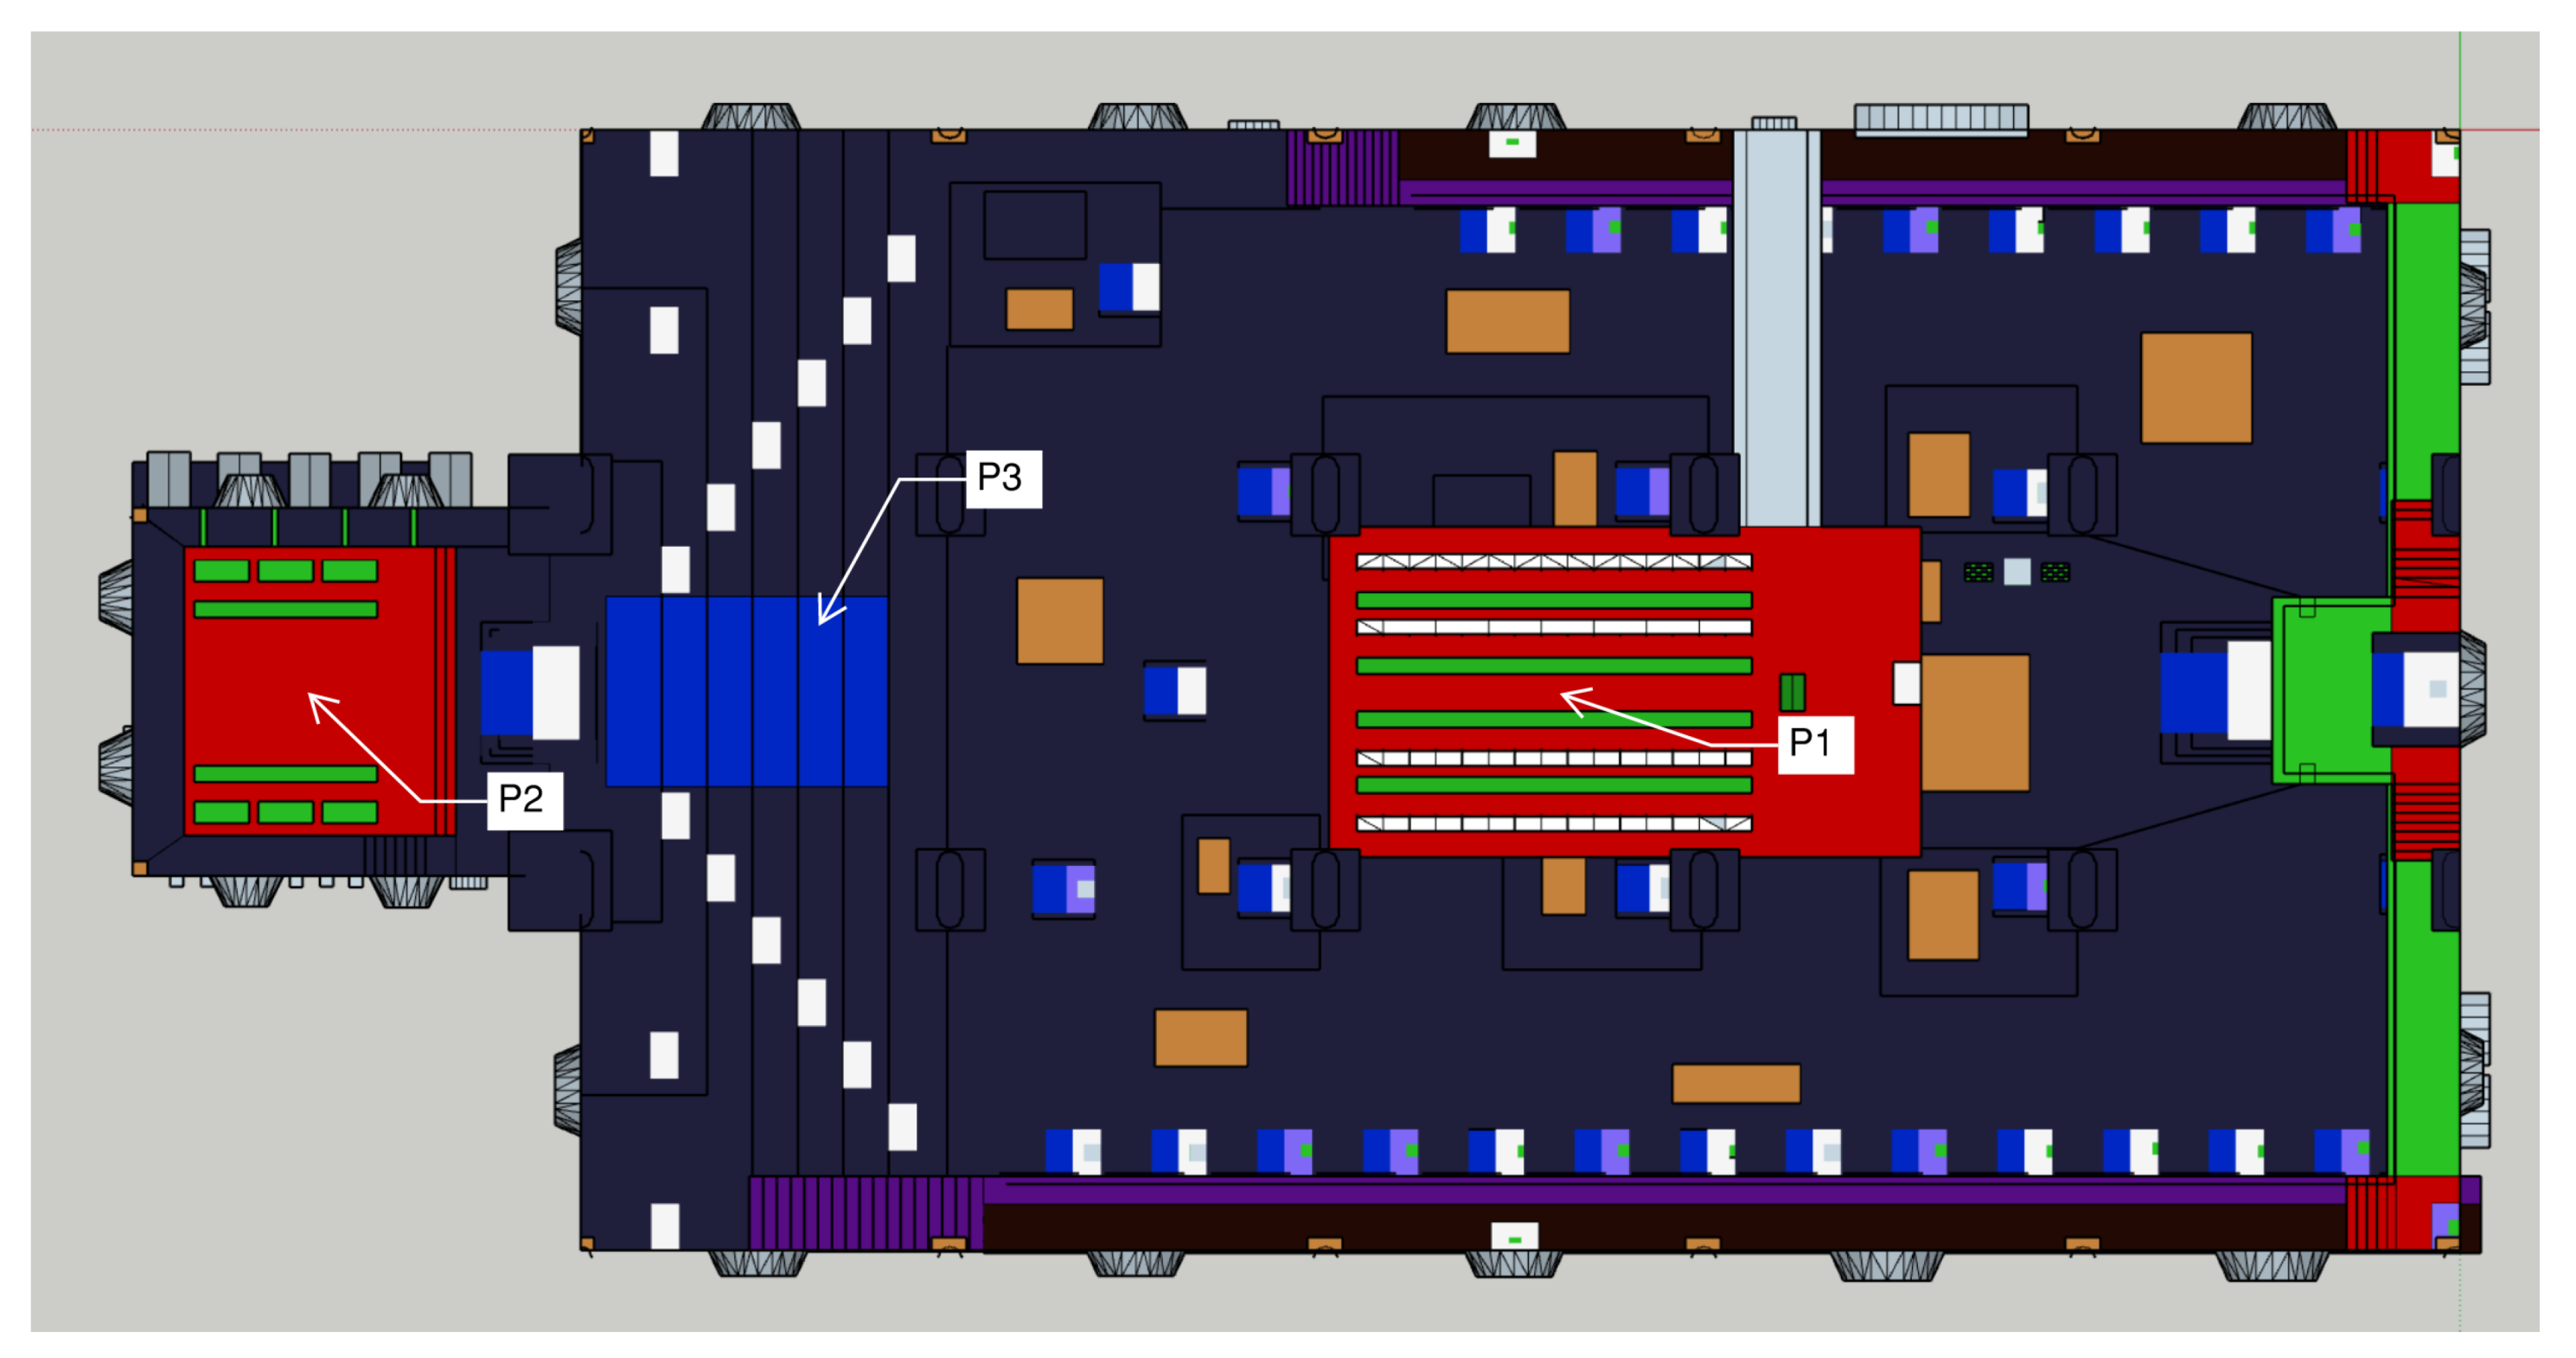
3.3.3. Listener and Source Positions

Sound source and sound receiver positions were chosen according to the goals of the simulations. The source positions for room acoustic simulations are shown in Figure 9. The nuns’ gallery was identified as a location of interest, and source P1 and a receiver are located there. Similarly, both a source (P2) and a receiver are in the monks’ choir. In addition, one sound source was located close to the high altar (point P3). Additional receiver positions are distributed on the floor of the nave. In the auralization, twelve nuns and eight monks modeled as point sources are placed in their respective choir stalls in the gallery and choir.

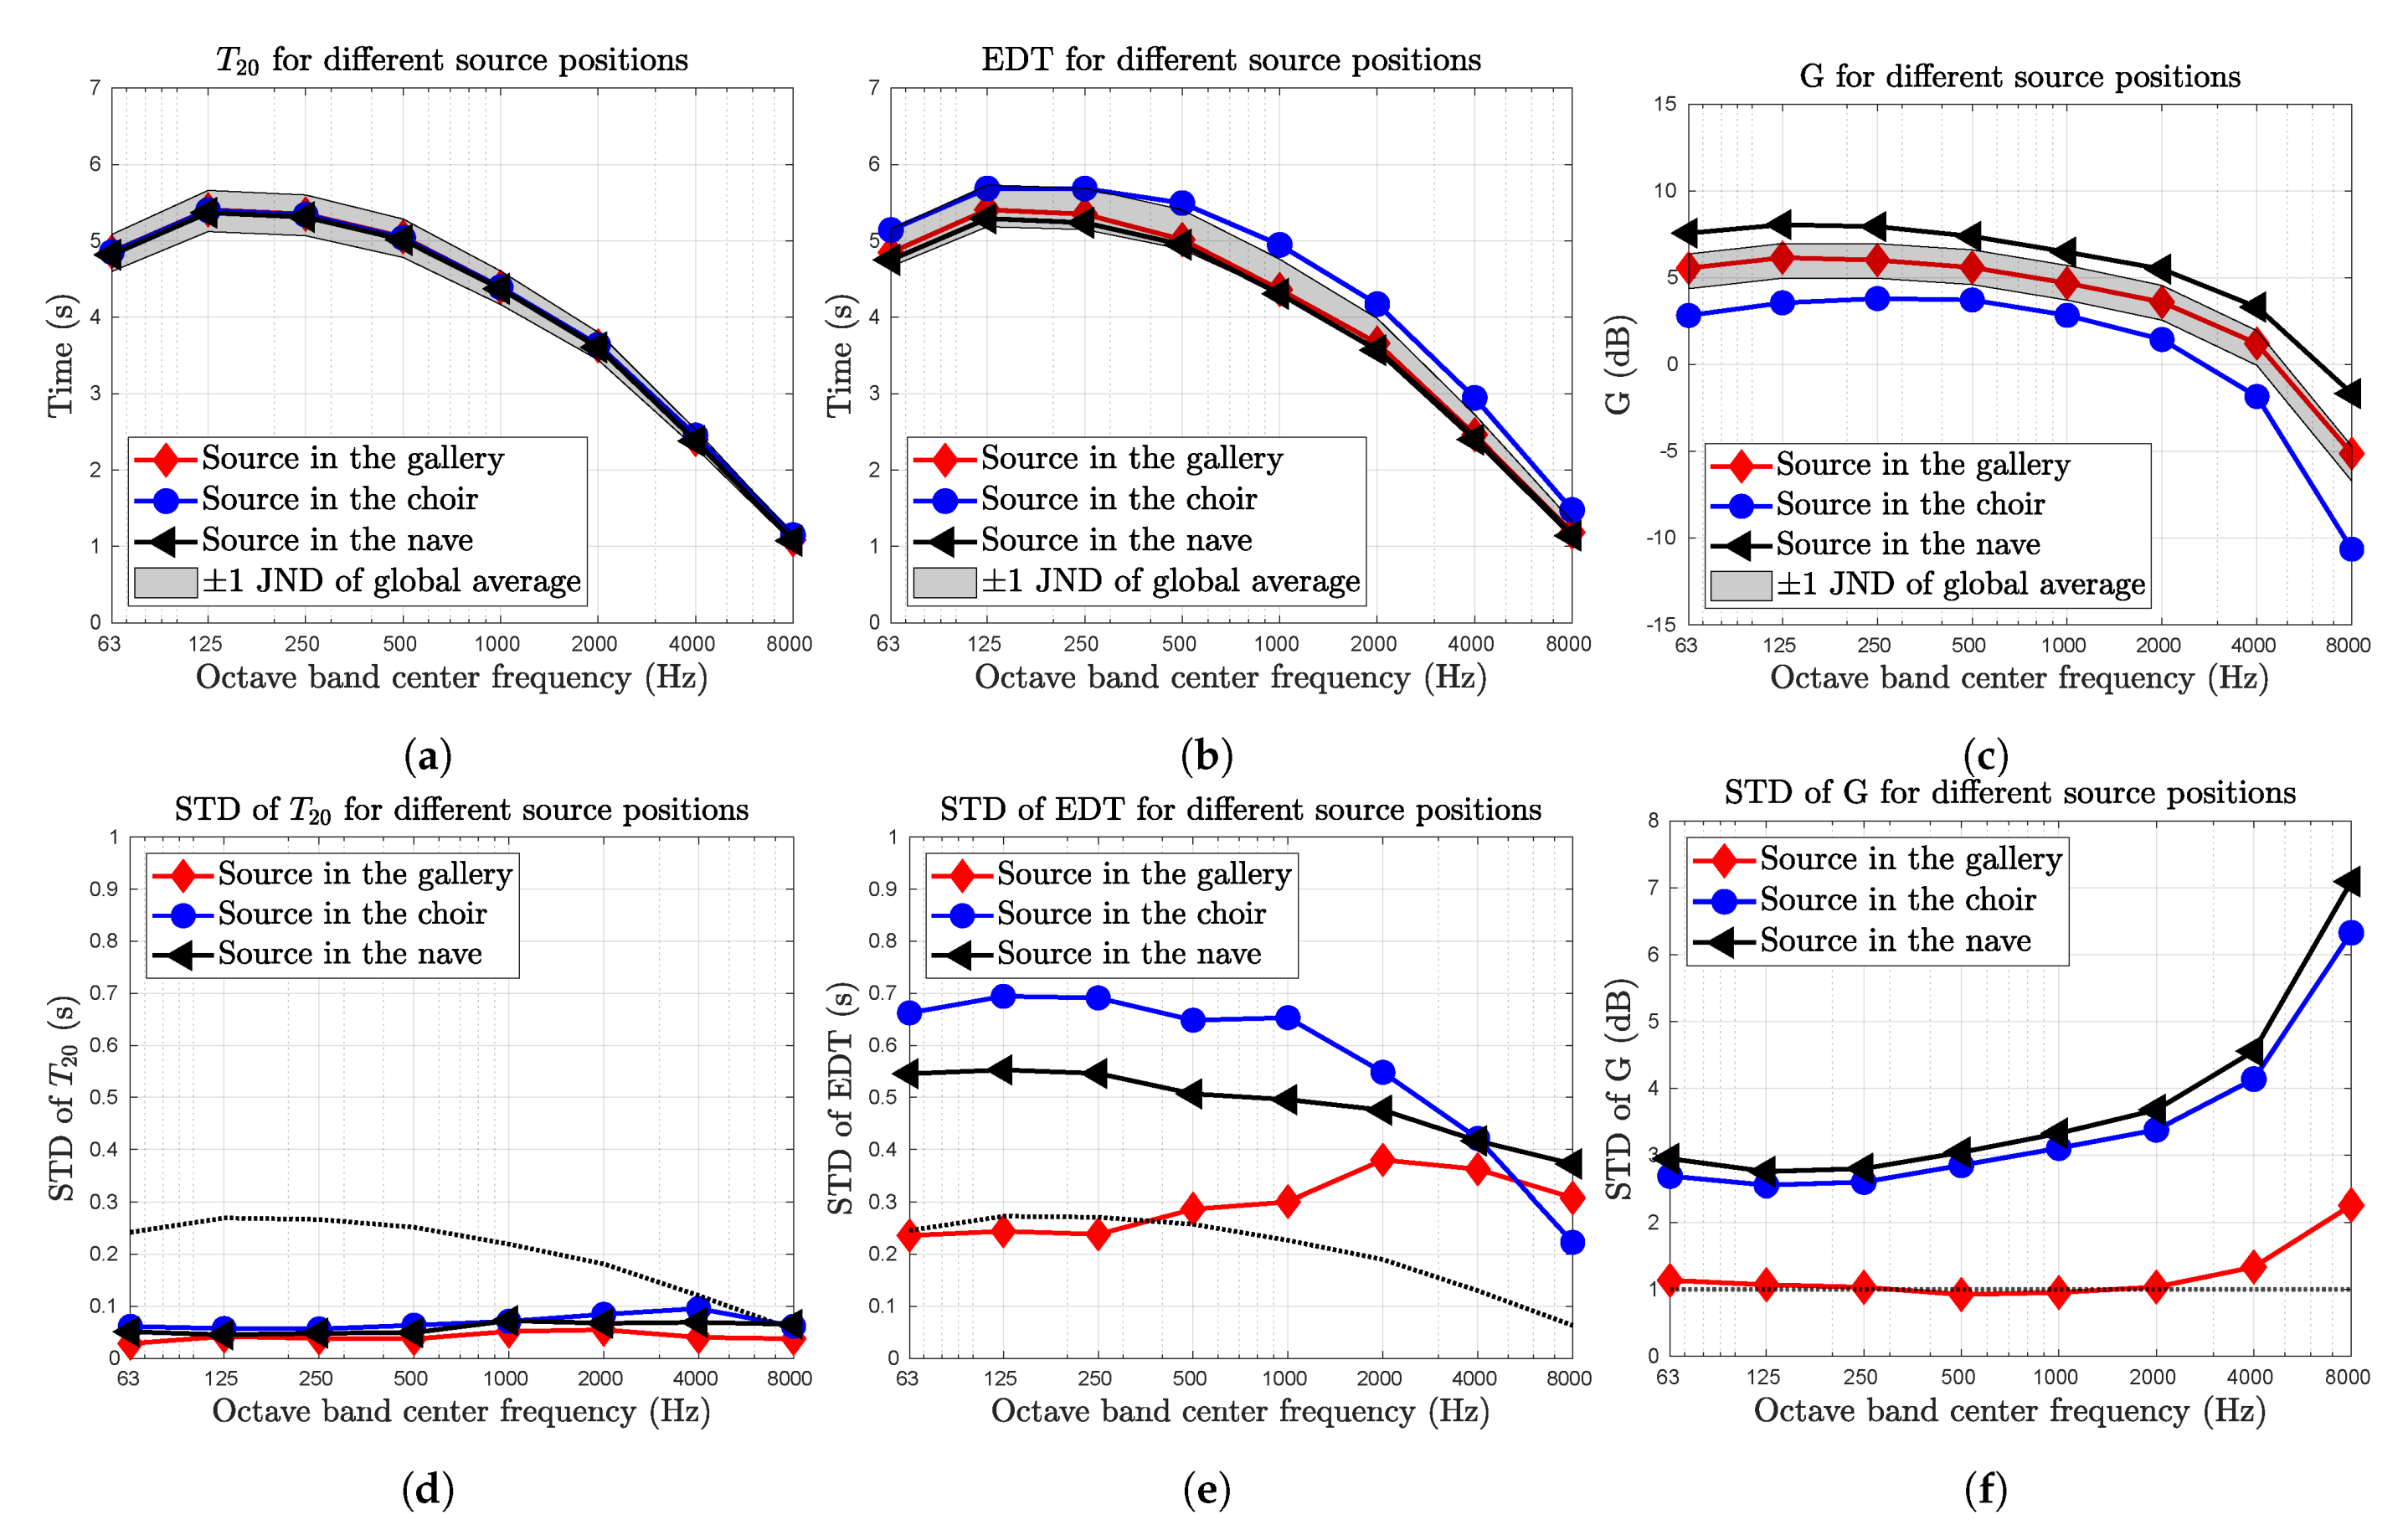
4. Room Acoustic Analysis

The sound field in the reconstructed church was evaluated from room acoustic simulations. Three questions were specifically examined. First, three different visitor conditions were evaluated. The three conditions corresponded to an empty church, an ordinary sext (about 30 individuals), and a more festive event (about 140 individuals). The sext condition corresponds to the situation targeted in the auralization, with twelve nuns in the gallery, eight monks in the choir, and about ten other visitors in the central-eastern part of the nave. In the festive condition, denoted “full”, there were 70 nuns in the gallery, 13 monks in the choir, and about 70 visitors in the nave.
Second, the sound fields within the choir and gallery are examined. These locations are important for the religious practices of the order, and acoustic analysis of these spaces may provide new insights. Third, the sound field in the nave is examined.
The auralizations are provided as supplementary material, and are not further analyzed in this text.
Four room acoustical parameters are presented, as defined in ISO 3382-1:2009 [52]. The reverberation time T 20 is presented, due to its traditional importance in acoustics. It is primarily useful as a tool for comparison to other spaces, as the reverberation time is a commonly measured acoustic characteristic. The early decay time (EDT) is also presented. It describes the rate of sound energy decay in the first parts of the impulse response, and is closely related to perceived reverberation and the presentation quality of Gregorian chant. According to guidelines proposed by Martellotta et al. [4], EDT values in the range 2.1 s to 4.2 s are appropriate for churches. In addition, C 80 is presented as an indicator of the clarity and intelligibility of chant. As the liturgical practices of this region and time do not contain significant spoken elements, C 50 (speech clarity) is not presented separately. For concert halls, C 80 values of above 0 dB are usually considered “good”, but no such guidelines have been defined for worship spaces. Finally, the sound strength (G) is presented. This value shows the total sound pressure level (SPL) at the receiver, as compared to what would be perceived from the sound source in free field at a distance of 10 m. G is positive in enclosed spaces.
A summary of the results is shown in Table 1. This table gives values for T 20 , C 80 , EDT, and G, averaged according to ISO 3382-1:2009 [52]. In addition, the results are divided into categories based on the location of sources and receivers. If the source and the receiver are both within the gallery (point P1 in Figure 9), the data is denoted “Gallery”. If both source and receiver are in the choir (point P2 in Figure 9), the data is denoted “Choir”. Finally, if the sound has travelled through the nave, the data is categorized as “Nave”. This includes when either the source or the receiver is located in the nave, but also the conditions where one is in the choir and one is in the gallery.
One result seen in Table 1 is that the number of visitors and the visitor condition have an impact on all room acoustic parameters presented. There are no or almost no differences between the empty and the sext condition, but the full condition leads to significant decreases of EDT and T 20 . This is an expected result of the increased amount of absorption when the number of visitors increase. Increased absorption should also lead to an increased C 80 and a decrease in G. These patterns can be seen, but are weak. The only differences larger than 1 JND are seen for C 80 in the gallery and G in the nave.
The results in Table 1 show a clear difference between the sound field within the gallery and within the choir, compared to the other configurations. All of the room acoustic parameters presented above are significantly different for these two subspaces as compared to the rest of the church. The subspaces are analyzed separately in Section 4.1. The results for the rest of the church is presented in Section 4.2.

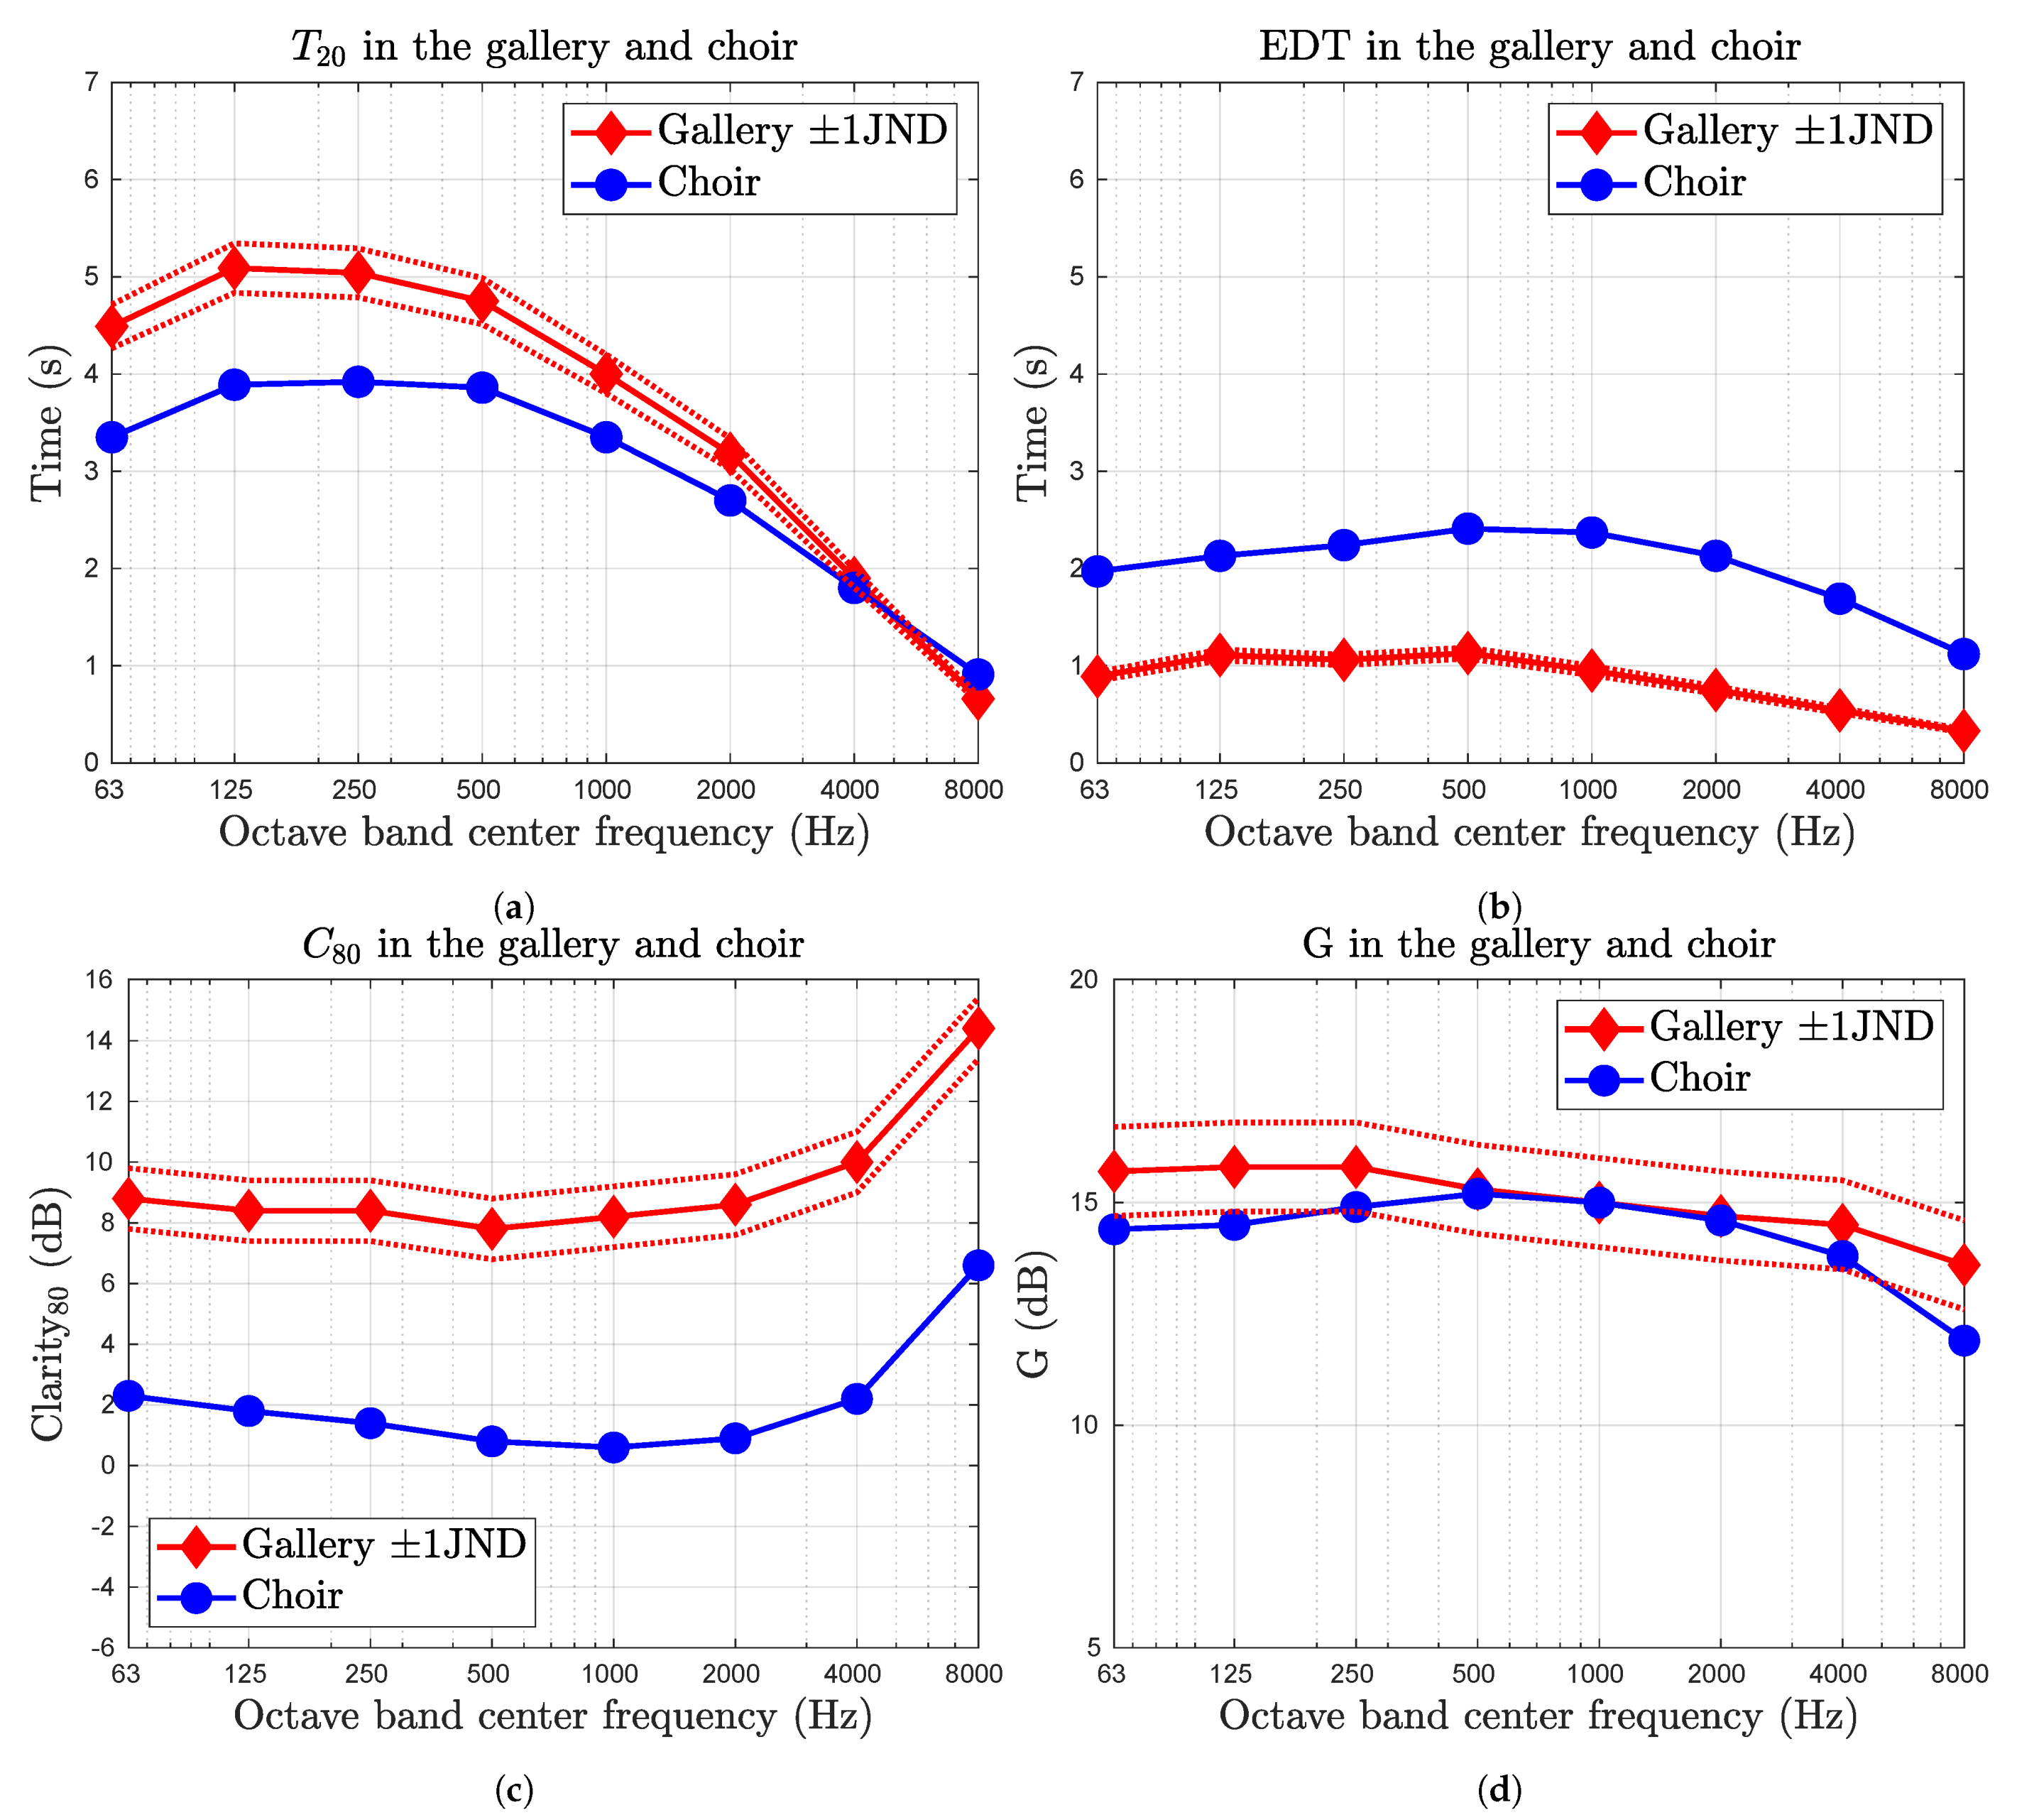
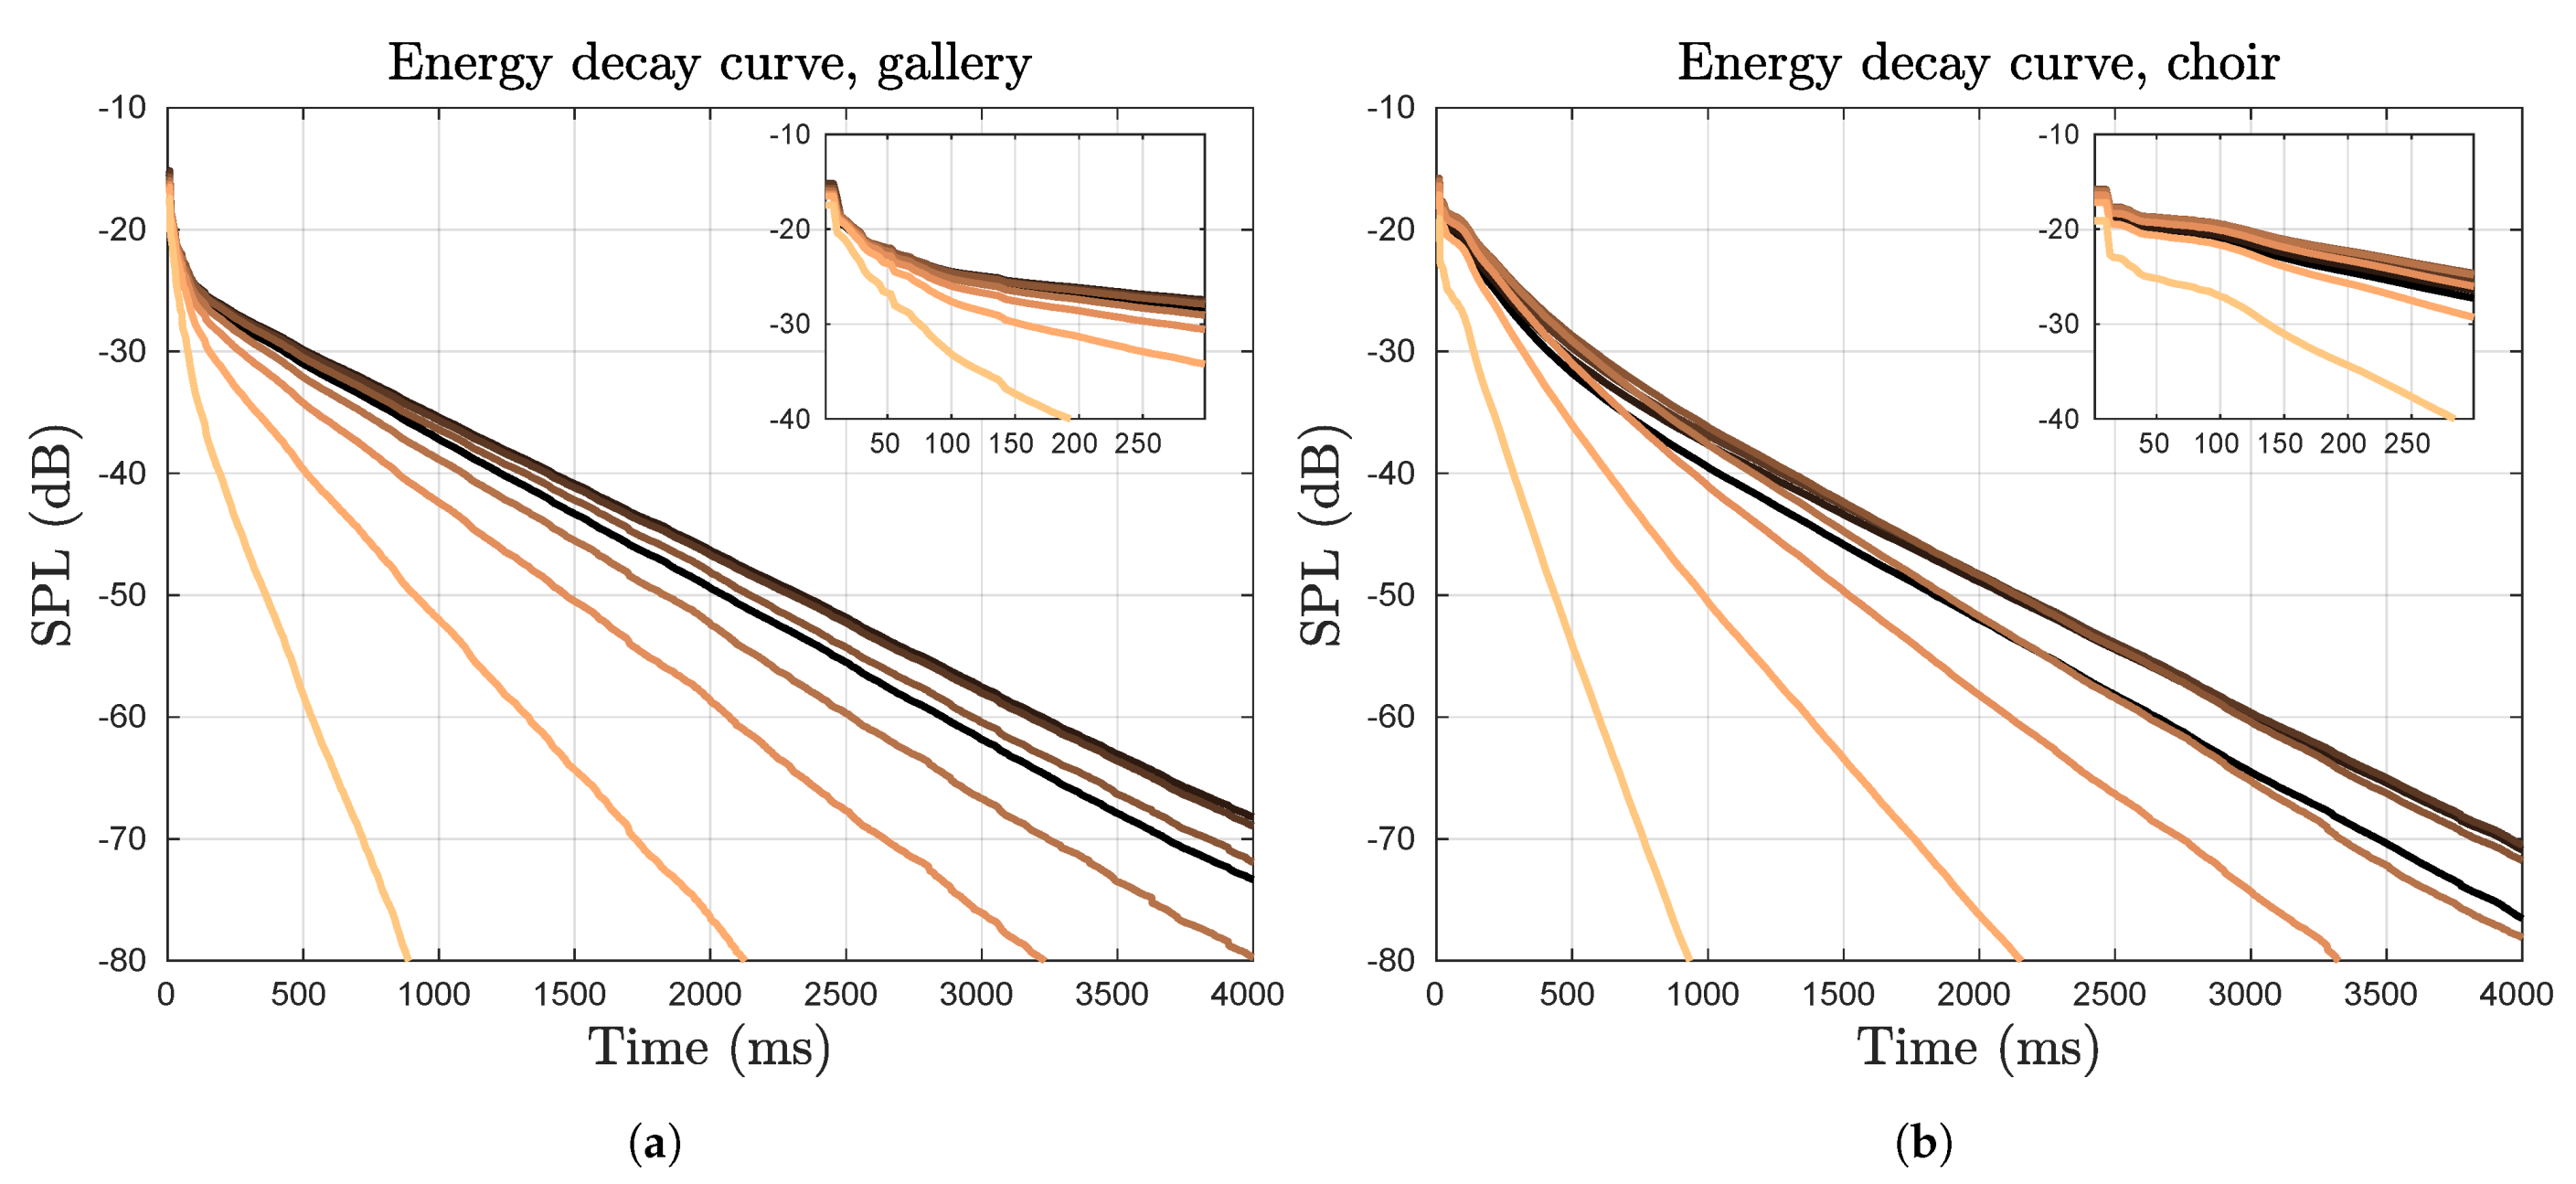
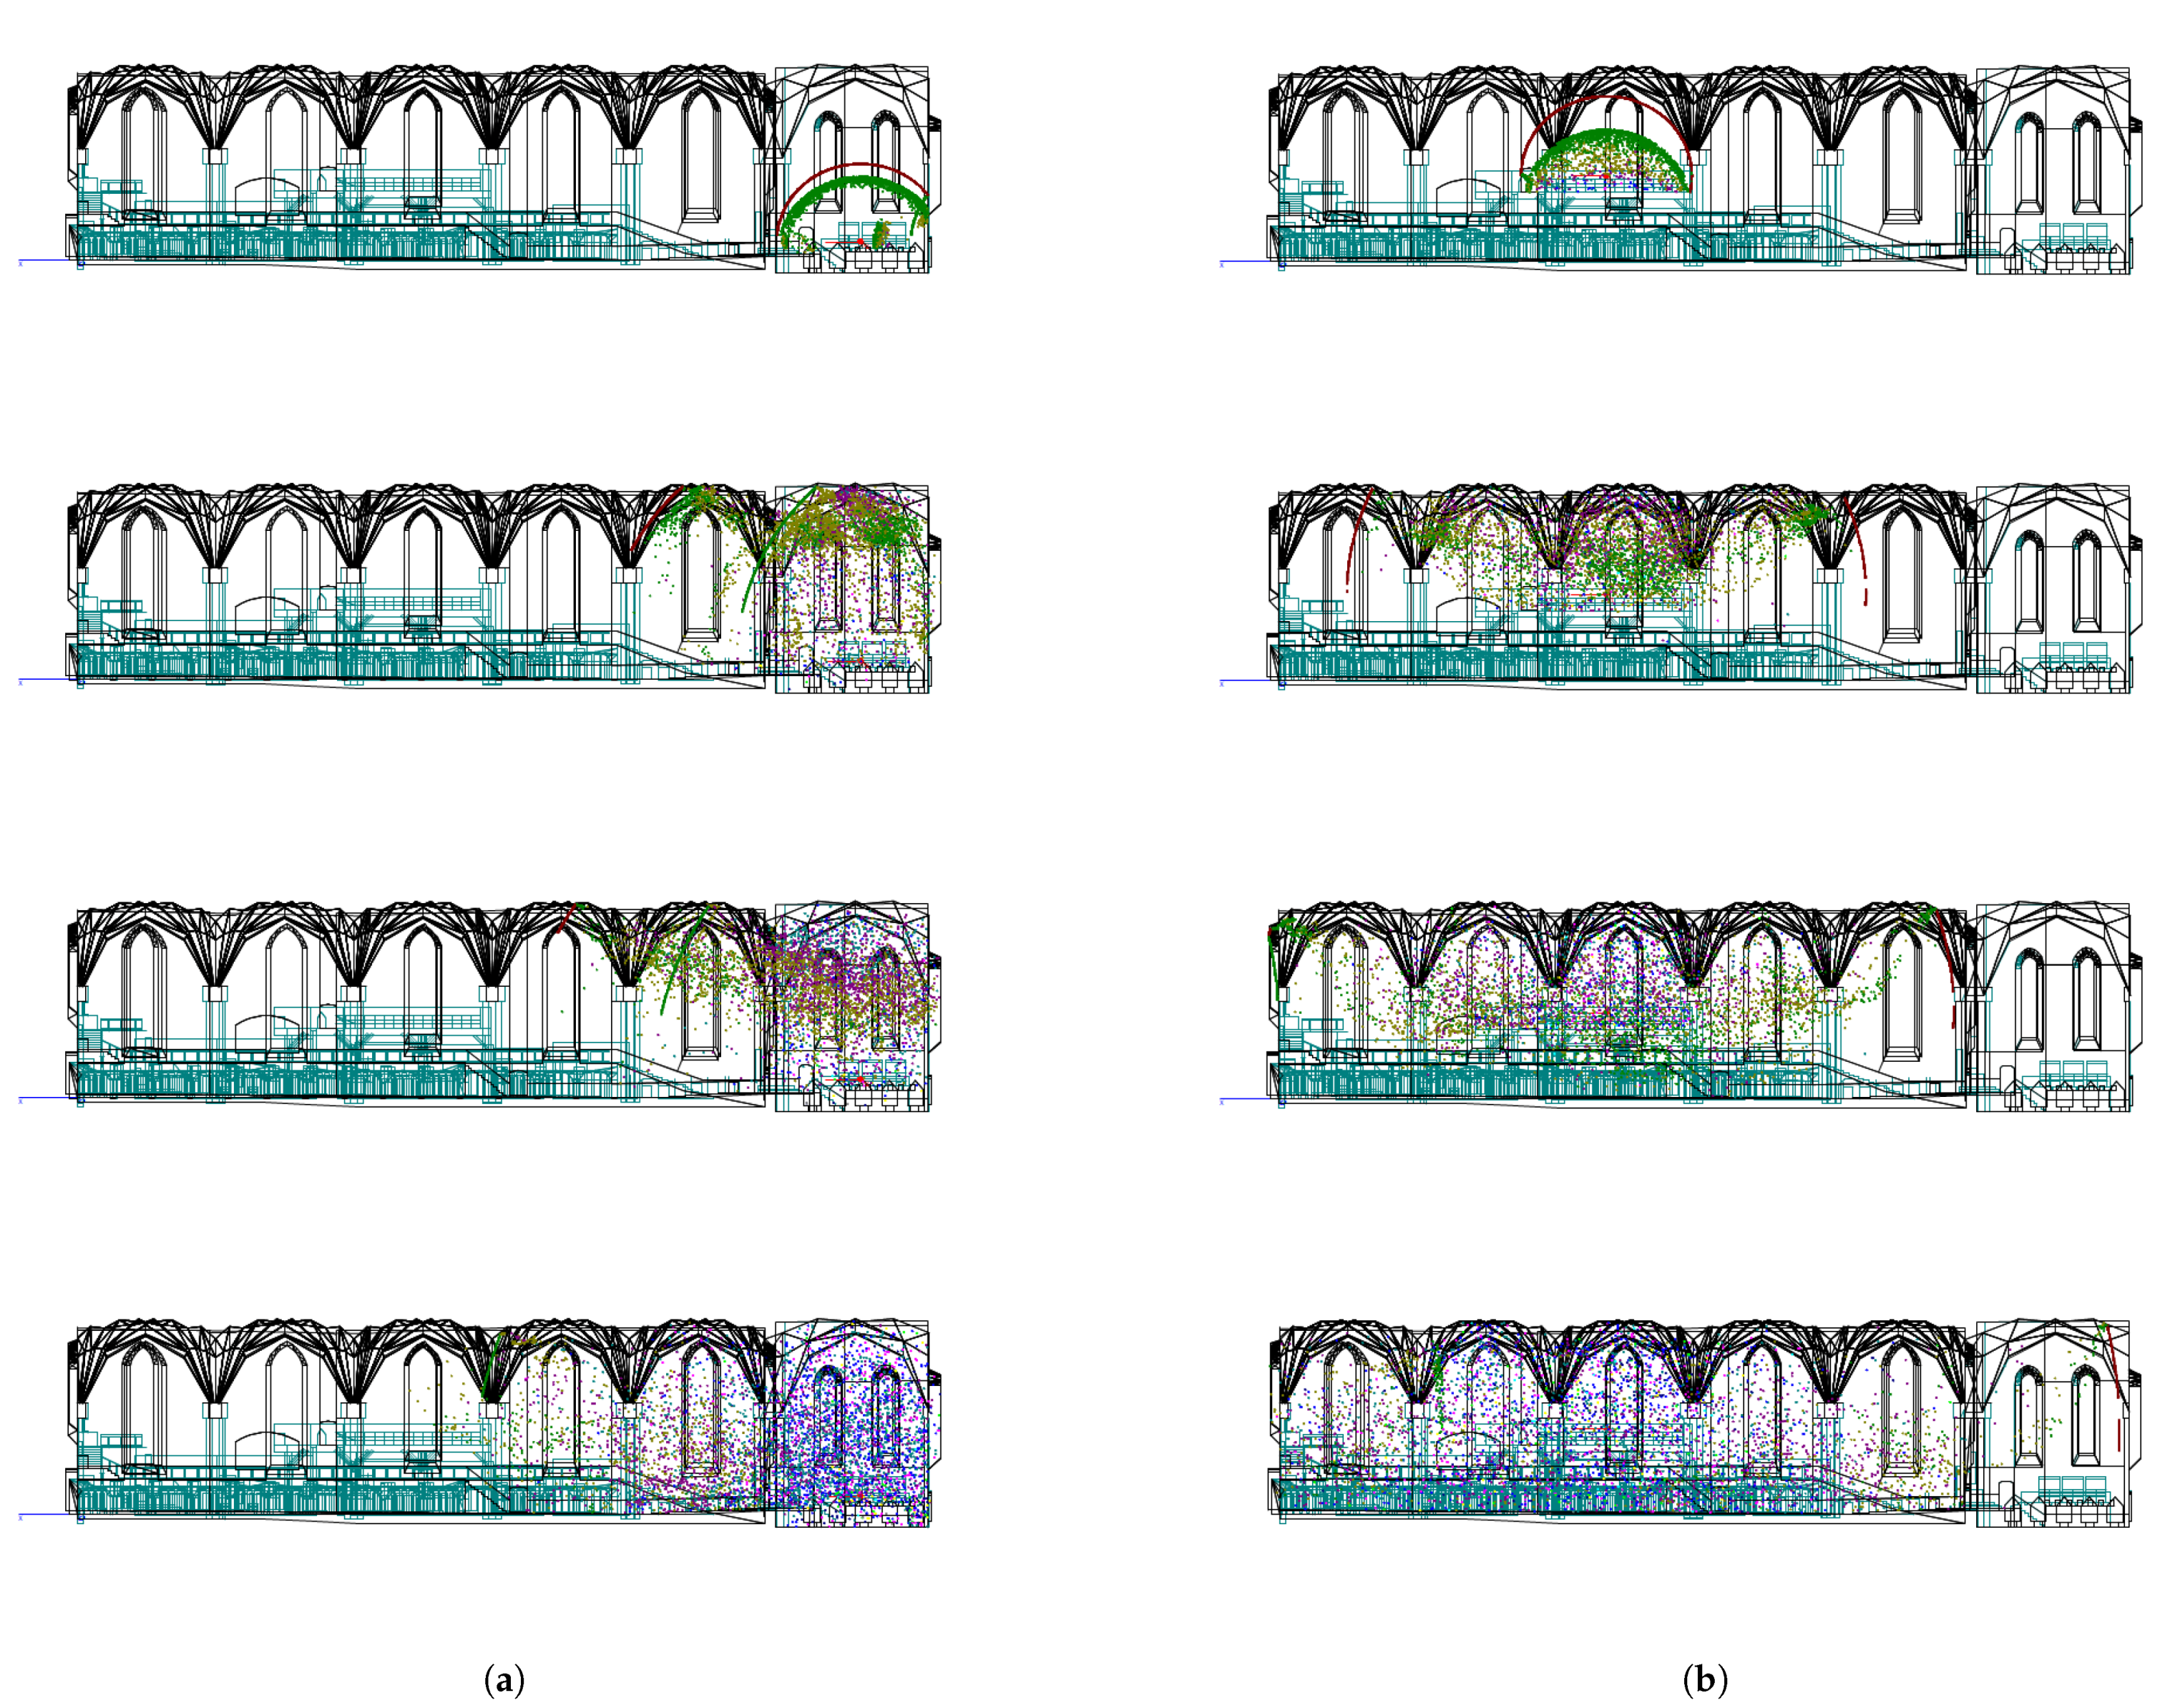
4.1. Acoustics within the Choir and Gallery

The acoustic simulation results within the gallery (source and receiver both near point P1 in Figure 9, reflecting the experiences of the nuns), and within the choir (source and receiver near point P2, reflecting the experience of the monks) are presented in Figure 10. In these graphs, room acoustical parameters T 20 , EDT, C 80 , and G are shown in octave band resolution. The gallery data are shown together with lines denoting ± 1 JND, such that when the choir data falls within these lines there is no perceivable difference between the two locations.
The reverberation time is significantly lower in the choir compared to the gallery. A review of the full results in Table 1 shows that the results in the gallery and the results in the rest of the church only differ by ±1-2 JND, whereas the discrepancy with the choir is larger.
The second reverberation parameter, EDT, shows a different pattern. The EDT is much smaller than T 20 for both positions, and the EDT in the gallery is significantly lower than that in the choir. The large discrepancy between the EDT and the T 20 may indicate that the decay curves in these spaces follow a multi-slope decay pattern, which would be consistent with these spaces acting as acoustically distinct subspaces. The energy decay curves are more closely investigated in Figure 11.
Reviewing the energy decay curves in Figure 11 shows a distinctly curved decay pattern in both gallery and choir. As expected from the results in Figure 10, the acoustic energy in the gallery decreases rapidly in the early parts of the decay, and then flattens out to a much slower decay rate. This is consistent with the formation of an acoustic subspace within the gallery, coupled to the larger, more reverberant space in the nave. As the acoustic energy within the subspace decreases, the reverberance of the nave becomes more dominant. The transition seems to occur after about 100 ms. The energy decay curve in the choir seems more complex, and is likely influenced by the three close, hard walls on three of four sides as well as the more distant vaulted ceiling. It is possible that these decay curves are formed by more than two distinct decay patterns. It can, however, be seen that the decay process after about 750 ms is more smooth. This transition time is later than in the gallery.
Returning to the results in Figure 10, it is seen that C 80 is also significantly different between the gallery and the choir across all octave bands. Clarity is much better in the gallery compared to the choir, which is in turn much better than what is found in the rest of the church (Table 1). The reason for these differences can be explained by the physical configuration and particularly the effects of the ceiling vaults. A time series illustrating a raytracing model of the energy distribution over time is shown in Figure 12.
On the left hand side in Figure 12, the energy distribution over time for a sound source located in the choir is shown. The energy emitted from the source travels upward as time progresses, to be reflected from the ceiling vaults. By 80 ms, the third figure from the top, the reflected wavefront can be seen in the space above the choir. Consequently, it has not reached the receiver by 80 ms, and thus has a detrimental effect on C 80 .
On the right hand side in Figure 12, the corresponding time series for a source and receiver in the gallery is shown. As the gallery is closer to the ceiling, the strong reflected wavefront from the ceiling has already reached the receiver in the gallery by 80 ms, thus improving C 80 .
The G within the gallery and choir can be seen in Figure 10d. As shown in the graph, there are no or very small differences between the gallery and the choir. The results in both spaces are, however, significantly better than outside these spaces. This can be explained by strong reflections, from the ceiling in the gallery and by the walls in the choir. The positions of these surfaces ensure that a significant amount of sound energy is reflected back to the space, thus increasing the total G.
Finally, some brief comments are made regarding sound transmission between the gallery and choir, corresponding to the acoustic perception of monks from the nuns’ position and vice versa. It is found that acoustic transmission between the two locations is very similar to the transmission between choir and nave. As those results are presented in Section 4.2, no further comments are made here.

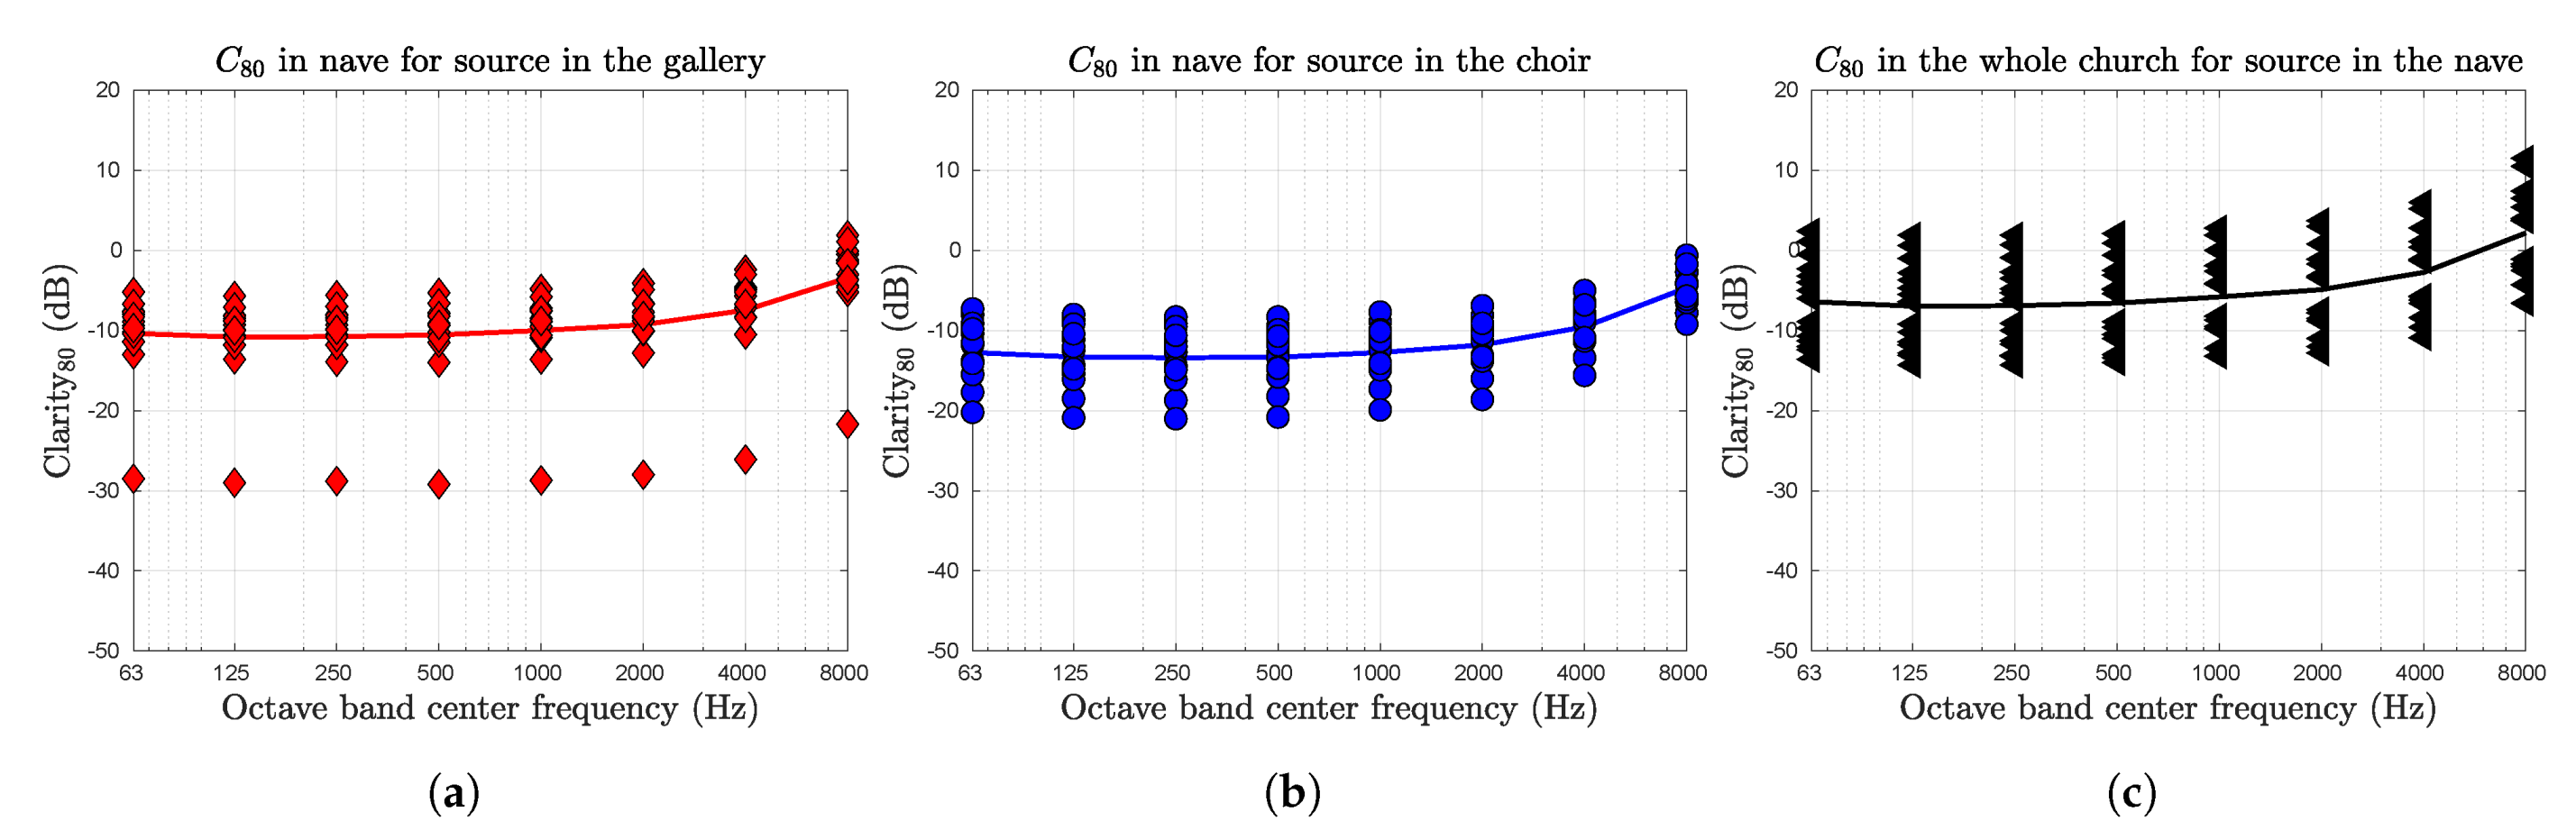
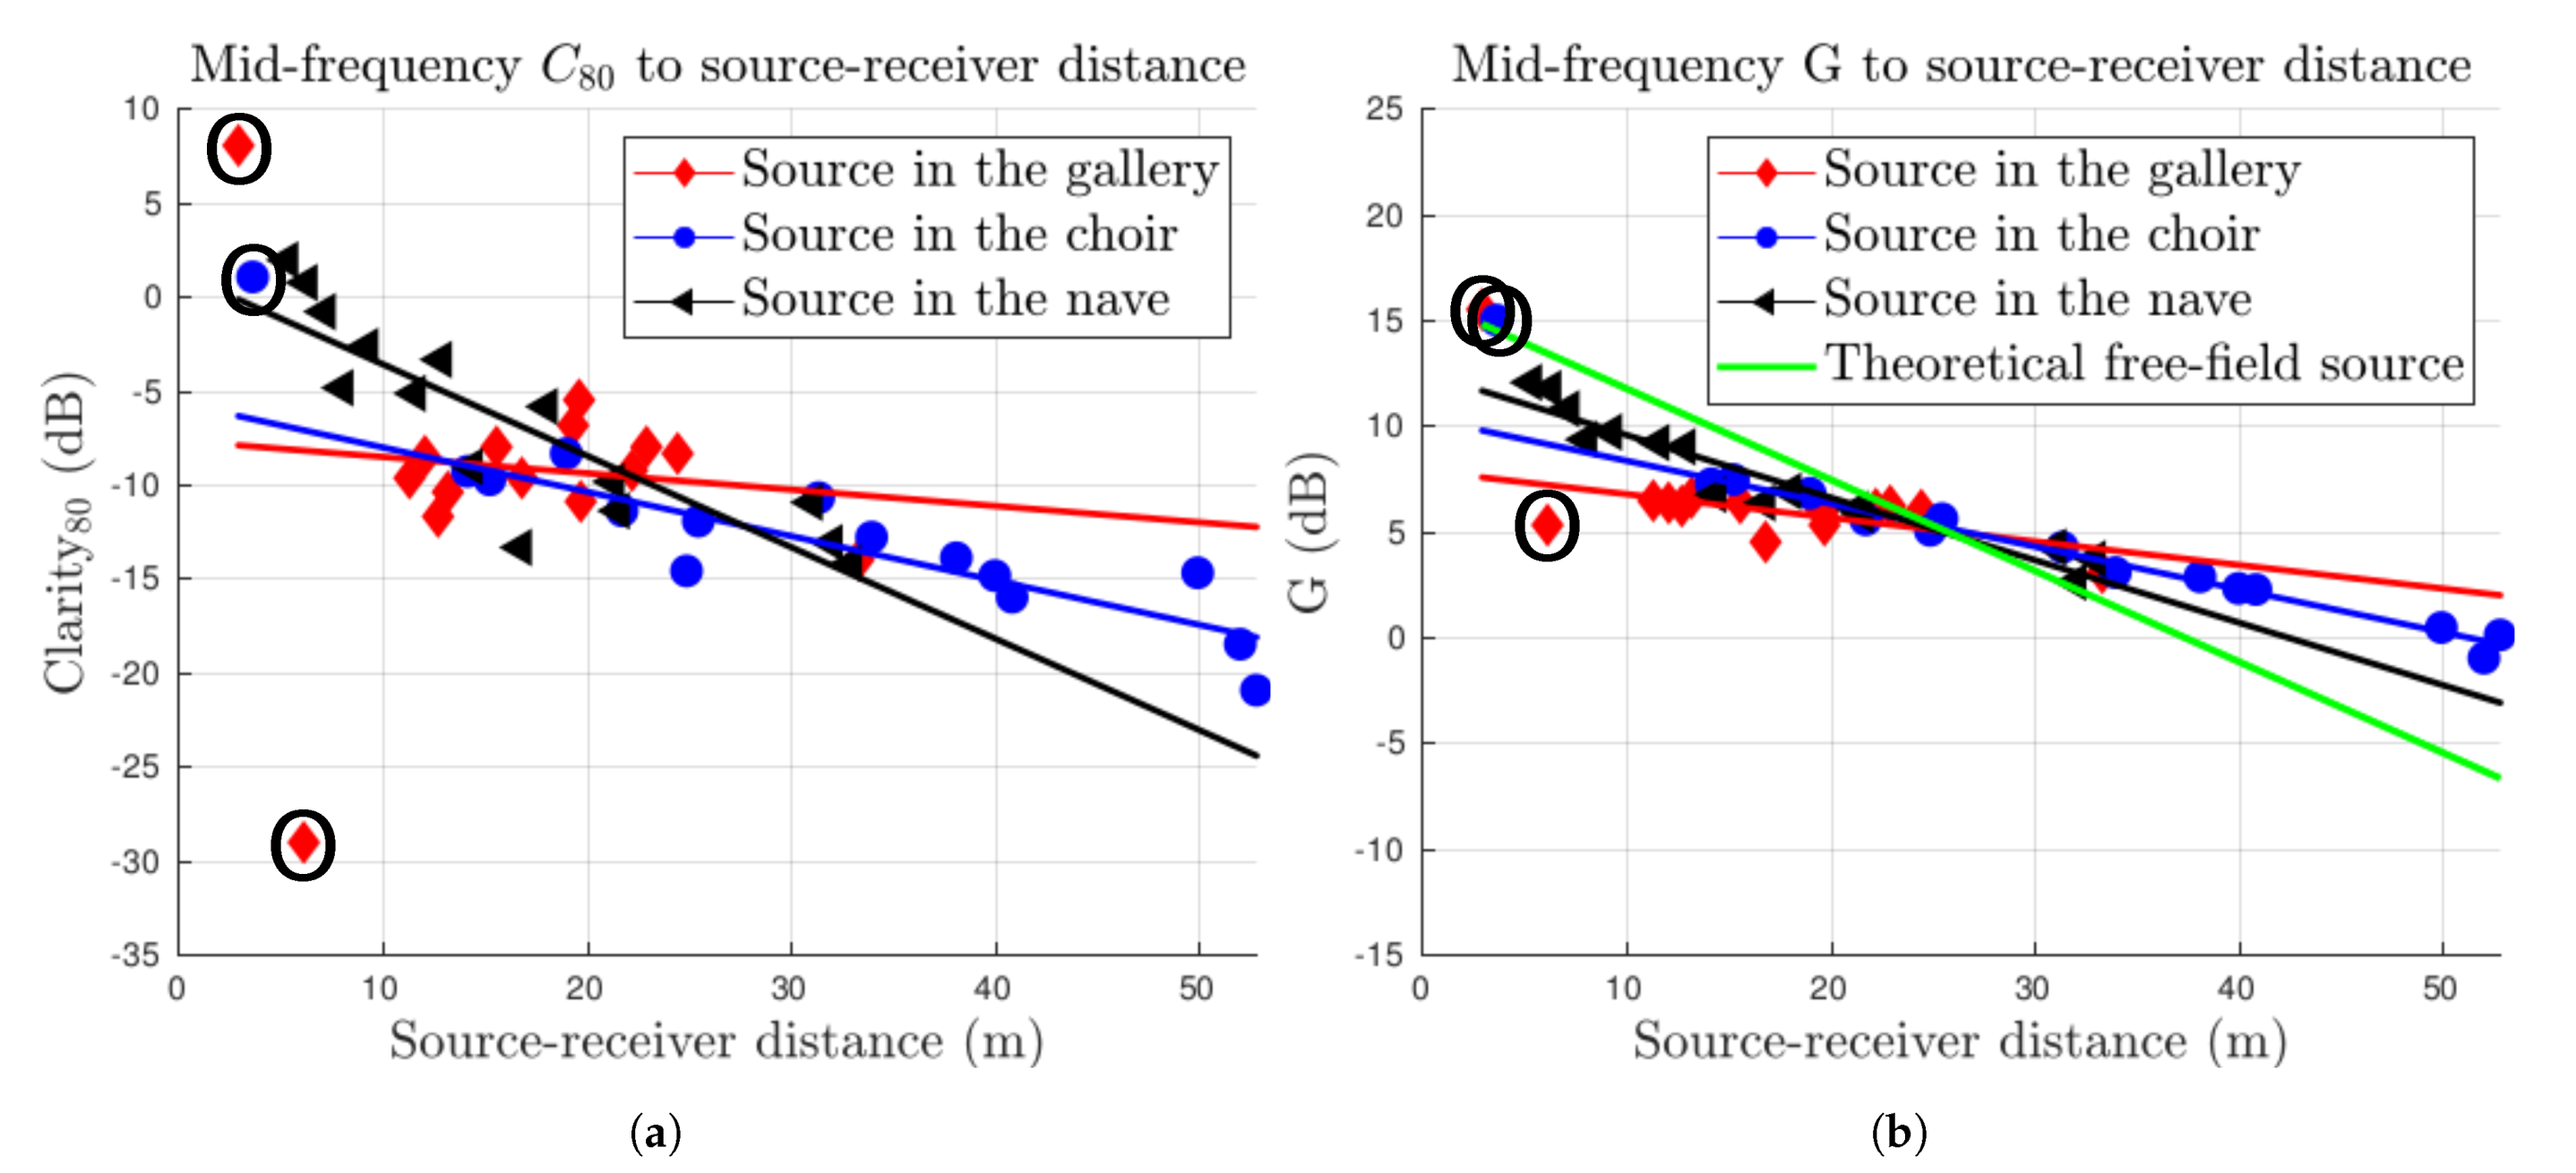
4.2. Acoustics in the Nave

Within the nave, the acoustic simulations aim first at characterizing the acoustics of the space itself and, second, at evaluating any difference between various source locations. As such, the data in this section are presented separately, according to the source position. The three source positions are in the gallery (point P1 in Figure 9, nuns’ position), in the choir (point P2, monks’ position), or in the nave, by the high altar (point P3). T 20 , EDT, and G results are shown in Figure 13. As the results in this section are in general spatially averaged, the standard deviations are also shown as an estimate of the spatial variations between listener positions.
The average reverberation time in the reconstructed abbey is shown in octave band resolution Figure 13a. Results for the three different source positions are shown, and are very similar; also shown in the graph is a gray area delimiting values that are within 1 JND of the global average. All lines fall entirely within this area, indicating that there are no significant differences in the reverberation time in the nave depending on the location of the sound source; also shown in Figure 13d are the standard deviations of T 20 for each of the source positions. These are shown together with the global JND for reverberation time. All standard deviations fall below the JND line, indicating that the variations of the reverberation time are on average imperceptible. This indicates that the late acoustic response within the nave was, in general, diffuse and not characterized by significant spatial variations.
In general, the reverberation time is long, but comparable to similar spaces. T 20 is significantly decreased compared to modern day measurements, as expected by the discussion in Section 3.1.1. In Table 2, the mid-frequency reverberation time ( T m ) is shown together with measurement results from the modern day church (from in [43]) and some other Gothic churches around the Baltic Sea (from in [11]). These results allow for a basic comparison between the reconstructed abbey and similar spaces.
Spatially averaged EDT values for each source position are shown in Figure 13b. Again, the gray area delimits values within 1 JND of the global average. The variations for different source positions are greater than those seen for T 20 , but only the results for the choir are significant compared to the JND. This difference is, however, small. Comparing the global EDT values to the guidelines proposed by Martellotta et al [34] shows that the average EDT exceeds the recommended values for the reconstruction.
In Figure 13e, the standard deviation of the EDT is shown for each source position together with the global JND. The standard deviation for a source in the gallery is smaller than the others, and falls below 1 JND for low frequencies. The typical variations for the sources in the nave and in the choir exceed 1 JND. This shows that the perceived reverberance of sources in those two locations varies significantly depending on the listener’s position. It also indicates that the small difference in average EDT between sources in the choir and elsewhere (seen in Figure 13e) may be too small to be relevant, compared to the variations between receiver positions.
G in the nave is shown in Figure 13e, in octave band resolution for each of the three source positions under consideration. The gray area delimits values within 1 JND of the global average. In this case, there are significant differences between the average results for the three positions. Sound emitted from the source by the high altar is on average heard louder, and sound from sources in the choir are on average heard more quietly. Part of the explanation for this fact may be that there are more receivers with a direct line-of-sight to the sound source in the nave than for the sources in the gallery and the choir. The contribution of the direct sound has a significant impact on the overall sound pressure level, and thus on G.
The standard deviations of G is also shown, in Figure 13f. Again, these are shown together with the corresponding JND. This graph shows that for sources located in the choir or by the high altar, the spatial variations of G are of a very similar magnitude, and significantly larger than when the source is located in the gallery. This can partially be explained by the position of the gallery in the middle of the church. G is affected by the distance between the source and the receiver, and the gallery’s position ensures that the distance between source and receiver varies minimally.
C 80 simulation results are shown in octave band resolution in Figure 14. As C 80 is not expected to be uniform in a space, all measurement points are shown, together with a line indicating the spatial average. The average C 80 for sources in the choir and gallery fall in the region of −15 dB to −5 dB, significantly below what would be characterized as “good” for a concert hall. Clarity for sources located by the high altar is better, at about −5 dB to about 2 dB.
Although C 80 is not expected to be uniform in a space, the results in Figure 14 show that most values fall in clusters around the average value. However, there is one outlier in Figure 14a, when the source is located in the gallery. This estimate comes from the receiver located underneath the gallery, below point P1 in Figure 9. It is separated from the sound source by the physical structure of the gallery itself, and there is no direct line of sight. A review of the acoustic simulation reveals that the first sound energy reaching this location from the source in the gallery is a second-order reflection, showing that sound energy reaching this location from the gallery consists solely of reflections of order two or higher. This significantly decreases the cohesion and energy level in early parts of the impulse response, leading to a very poor clarity of sources in the gallery as perceived by listeners beneath it.
The acoustic field in the nave is further analyzed to determine whether the spatial variations for sources in the choir and by the high altar, seen in Figure 13e,f and Figure 14, are caused by acoustic subspaces. It is found that the spatial variations can be explained well by the distance between source and receiver. Linear regression models for mid-frequency G and C 80 to source–receiver distance are shown in Figure 15, and the R 2 -values are presented in the caption. Except for sources in the gallery, more than 70% of the typical spatial variations in G and C 80 can be explained by the source–receiver distance.
In Figure 15, the results from within the gallery, within the choir, and the outlier found in Figure 14 are marked, and not included in the linear regression models. They deviate significantly from the pattern defined by the regression line, indicating that the assumption that these locations are governed by the acoustic properties of a certain subspace is accurate. However, no other measurement points show a similar deviation from the prediction. Thus, there are no indications that there are distinct acoustical subspaces in the reconstructed church except those already identified.
Another pattern emerges in the evaluation of source–distance dependence, showing that the influence of distance varies depending on the location of the sound source. As shown in Figure 15a, C 80 decreases as source–receiver distance increases and the reverberant field becomes more dominant. The linear regression quantifies the influence of distance for each source position. The effects of distance is most strongly seen when the sound source is located in the nave, by the high altar. Moving the sound source to the choir decreases this effect slightly. When the sound source is in the gallery, the effect is almost entirely gone, and clarity is not significantly affected by increasing the distance to a sound source in the gallery. This analysis is confirmed by a review of the R 2 -values for the respective linear regression models. These indicate that only about 6% of the variations of C 80 in the nave for sources in the gallery can be explained by the distance between receiver and source. The values are significantly higher for sources in the choir and nave.
In Figure 15b, the distance dependence of G is examined and compared to the SPL decay of a free-field source. To facilitate comparison, the free-field condition is approximated with a linear regression model and is not normalized to the source’s SPL at a distance of 10 m. As would be expected, the G decreases with increased source–receiver distance across all data series. However, the slope of the decays within the church are softer than that for the free field condition. This is due to the sustained reflections of the enclosed space. The G decay is fastest for the free field condition, followed by the source by the high altar. For sources in the choir, the effect is smaller and for sources in the gallery smaller still.
These results indicate that the acoustic perception of sources by the high altar (P3 in Figure 9) strongly depends on the listener’s position, which implies that the sound field created by such a source is less homogeneous. This may be explained by the lack of nearby reflecting structures around that source position, as compared to the choir and gallery. Accordingly, there are no strong early reflections supporting the transmission of sound from this location. Thus, acoustic energy is dispersed in all directions, whereas the vaulted ceiling above the gallery and the walls of the apse reinforce early reflection and direct the the spread of acoustic energy from the gallery and the choir into the nave.
There is also a significant difference between the choir and the gallery in distance dependence, which can be understood further by again turning to the raytracing model shown in Figure 12. From these graphs, it appears that, after about 100 ms, the acoustic energy is distributed much more evenly in the nave when the source is located in the gallery, rather than the choir. This behavior can be explained by two factors. First, the gallery is located in a much more advantageous location in the middle of the church. This leads to a much more even distribution of sound energy initially. Second, the gallery is larger and interacts with multiple ceiling vaults, while the acoustic energy from the choir only is reflected by the vaults of one bay. The reflections from multiple ceiling vaults leads to a much greater scattering of the acoustic field, and a greater diffusion overall. These two factors together give a more even distribution of acoustic energy when the source is located in the gallery.

5. Discussion

The room acoustic analysis of the reconstructed abbey reveals the presence of two distinct acoustical subspaces, which coincides with locations of significant liturgical importance. The nuns’ gallery and the monks’ choir are characterized by shorter EDT, greater G, and improved C 80 compared to the rest of the church. These better acoustic conditions facilitate the auditory elements of liturgical practices, which are a fundamental part of the monastical congregations’ daily tasks. Examples of such subspaces have been found in many other worship spaces [31,32,33] and are sometimes referred to as a “church within a church”, indicating their role as an exclusive environment for the initiated. The presence of two such locations, rather than one, is an expected consequence of the presence of two separate monastic enclosures within the same church.
Despite their similarity as acoustic subspaces with improved conditions for liturgical activities, there are distinct differences between the gallery and the choir. The proximity of the gallery to the vaulted ceiling both improves the clarity within it and results in a rather homogenous sound field in the nave when a sound source is located in the gallery. Within the choir, as compared to within the gallery, the reverberation time is more significantly different to that in the nave. This could imply a weaker coupling between the acoustic subspace in the choir and the nave, than between the gallery and the nave. This could be a reason for the poor acoustic transmission from the choir to the nave.
Such differences may reflect a religious intent, irrespective of whether there was an acoustical intent in the design. The position of the gallery reflects a religious intent to premier the nuns within this abbey, and the improved acoustic transmission from this location supports this intent. Its location makes the gallery both acoustically and visually characteristic for the whole church, and establishes the nuns’ position as central within the monastic order. The reflections from the ceiling vaults cause the nuns’ chants to be perceived as coming “from above”. This could reflect an acoustic intent of making the nuns sound more heavenly.
The spatial variations in the church can be heard in the auralizations (as presented in the supplementary material) of elements from a Friday sext. When both source and listener is in the gallery, or both in the choir, intelligibility is acceptable and the acoustics support chants, prayers, and responsories sufficiently to seem plausible. Reverberation from the nave can be heard, but is not strong enough to dominate the sound field. The services as perceived outside the respective monastical subspace give a very different impression. Individual syllables can not be distinguished, the locations of the sound sources are difficult to determine and the reverberance dominates perceived sound. This is the case for the perception of monks from within the gallery, nuns from within the choir and both from within the nave. Monks and nuns sound distant, yet omnipresent. Liturgical interactions between monks, nuns or people in the nave were thus likely not possible during daily services.
Further analysis of the auralizations themselves, with listening tests, could lead to additional insights regarding the experiences of historical visitors to this place. For example, the introduction of HRTFs is needed in order to evaluate the perceptual impact of the nuns’ elevated position, to further evaluate the theory of their voices sounding more heavenly. Such research could show more clearly the perceptual differences between the experiences of the monastical congregations and the pilgrims. Furthermore, it may be possible to use the results of the simulation as a tool for VR performances, where singers experience the “live” simulated acoustics of the historical space as they sing. Such setups may minimize the effects of recording in an anechoic chamber.
The reverberation time within the nave is long but comparable to other churches around the Baltic sea. Although no comparison could be made for other Scandinavian or Nordic churches, comparisons to Gothic churches in other countries around the Baltic Sea (Germany and Poland) indicate some similarities in the acoustic cultural heritage. However, as the sample size is so small, further research is needed before any conclusions can be drawn.
The significant reverberation within the nave, and especially the long EDT, indicates that the space in the sext configuration is not suitable for the Gregorian chants usually performed there. This conclusion is supported by listening to the auralizations. However, in the more festive condition examined, with an increased number of visitors and members of the congregations, the EDT is decreased sufficiently within the nave to be within Martellotta et al.’s [34] guidelines for Gregorian chant. While there are no indications that this was intentional, it implies that during events aimed at a more general public, the acoustics of the church supported such events. Accordingly, the acoustics could be considered somewhat self-regulatory; when there are few listeners in the nave, acoustics are sufficient only for the important monastical congregations, and when the number of visitors in the nave increases, the larger number of visitors experience an acceptable acoustic field.
However, caution should be applied when making quantitative comparisons of archaeoacoustical simulations to guidelines or measurements, such as the comparisons made above. The rate of uncertainty in the model may be significant, both due to uncertainties in the material parameters and in the geometric modeling techniques [53,54]. The calibration procedure employed in this paper reduces these uncertainties, but can not remove them entirely.
Despite these words of caution, it should be noted that the major conclusions of this work concern the acoustic subspaces in the gallery and nave. These effects are primarily caused by the geometrical configuration of the space, which has been established based on the thorough historical research presented in Section 3.1. As such, the qualitative conclusions regarding improved acoustic conditions for the monastical congregations holds, despite the uncertainties presented regarding the absolute values of calculated parameters.

6. Conclusions

The room acoustic analysis in this paper shows that acoustical subspaces were formed in locations of religious and liturgical importance. These acoustical subspaces offered improved acoustics for the monastical congregations for which the church was built. Of the two congregations, the nuns were more central, and this is reflected in the design and acoustics of the church.
Although some of the results of the acoustic analysis of the gallery may have been possible with a less accurate digital model, the thorough acoustical analysis has benefited from the substantial historic research underlying it and finds its validation from it. The precise determination of the gallery’s size, elevation, position, and form has been shown to have consequences for the sound field within the gallery and within the nave. This shows that archeo-acoustical modeling benefits from tight collaboration between acousticians, historians, and 3D-artists.

Supplementary Materials

The following are available online at https://www.mdpi.com/2076-3417/11/4/1586/s1.

Author Contributions

Conceptualization, H.A., M.B., C.A., D.B.H., E.L.S. and K.S.L.; methodology, M.B., C.A., E.L.S. and K.S.L.; formal analysis, H.A. and M.B.; investigation, M.B., C.A., E.L.S. and K.S.L.; writing—original draft preparation, H.A. and C.A.; writing—review and editing, H.A. M.B., C.A. and D.B.H.; visualization, H.A. and C.A.; supervision, D.B.H. and E.L.S.; funding acquisition, D.B.H., E.L S. and K.S.L. All authors have read and agreed to the published version of the manuscript.

Funding

This research was funded by the Swedish Research Council grant number 2016-01784.

Institutional Review Board Statement

Not applicable.

Informed Consent Statement

Not applicable.

Data Availability Statement

The data presented in this study are available on request from the corresponding authors.

Acknowledgments

The authors express gratitude to: Brekke & Strand Akustik AB for providing ODEON 16.0 and Cubase 11.0 licences; Marcin Brycki from Brekke & Strand Akustik AB for leading the recording sessions and performing the mixing; Milab Microphones AB for providing microphones for recording; the singers involved in the recordings; Nikolaos-Georgios Vardaxis and Erling Nilsson from Engineering Acoustics LTH for valuable inputs; Tim Näsling from Brekke & Strand Akustik AB for useful tips and discussions during room acoustic modelling; Stefan Lindgren at LU Humanities Lab for the 3D scan of the church; Mattias Hallgren at Traditionsbärarna for input regarding historical construction.

Conflicts of Interest

The authors declare no conflict of interest. The funders had no role in the design of the study; in the collection, analyses, or interpretation of data; in the writing of the manuscript; or in the decision to publish the results.

Appendix A. Material Parameters for Acoustic Simulation

Table A1. Material coefficients used for the room acoustic simulations and auralization of the reconstructed abbey.
MaterialAbsorption FactorMid-Frequency Scattering
63 Hz125 Hz250 Hz500 Hz1000 Hz2000 Hz4000 Hz8000 Hz
Thin silk textile, freely suspended 10.050.050.060.390.630.700.730.730.01
Wool textile 10.070.070.310.490.750.700.600.600.01
Thick wool (carpet) 10.020.020.060.140.370.600.650.650.01
Heavy velvet 10.030.030.030.150.40.500.500.500.01
Thick linen against stone 10.010.010.020.050.150.300.400.400.01
Wooden construction, not painted 20.090.090.090.080.080.100.070.070.60
Wooden construction, painted 20.110.110.110.100.100.100.070.070.40
Wooden decoration, painted 2,30.120.120.120.150.150.180.180.190.99
Hollow wooden structure, painted 10.400.400.300.200.170.150.100.100.60
Plastered brick 60.1020.0290.1440.0970.0070.0160.0080.0030.20
Limestone 60.0280.0740.0050.0340.090.0280.0840.0090.003
Plastered limestone 40.070.060.050.050.040.040.040.040.001
Ceiling vaults 50.120.090.090.050.040.030.030.030.30
Leaded glass windows 60.2540.2590.240.0160.1010.0390.4950.0030.14
Iron lattice 50.010.010.010.020.060.030.030.030.001
People 10.620.620.720.800.830.840.850.85
1 From an ODEON standard material [50]; 2 Suarez et al. [55]; 3 Alonso et al. [56]; 4 Postma et al. [51]; 5 Own data; 6 Determined by genetic algorithm optimization, see Section 3.3.2.

References

  1. UNESCO. Concept of Digital Heritage; UNESCO: London, UK, 2019.
  2. UNESCO. Convention for the Safeguarding of the Intangible Cultural Heritage; UNESCO: London, UK, 2003.
  3. Lubman, D.; Kiser, B.H. The History of Western Civilization Told through the Acoustics of its Worship Spaces. In Proceedings of the 17th International Congress on Acoustics, Rome, Italy, 2–7 September 2001. [Google Scholar]
  4. Martellotta, F. Optimal Reverberation Conditions in Churches. In Proceedings of the International Congress on Acoustics 2007, Madrid, Spain, 2–7 September 2007; Sociedad Espanola de Acustica: Madrid, Spain, 2007. [Google Scholar]
  5. Howard, D. Recordings of Music Written for St. Mark’s. In Word, Image, and Song: Essays on Early Modern Italy; University of Rochester Press: Rochester, NY, USA, 2013; Volume 1, pp. 89–100. [Google Scholar]
  6. Navarro, J.; Sendra, J.J.; Muñoz, S. The Western Latin church as a place for music and preaching: An acoustic assessment. Appl. Acoust. 2009, 70, 781–789. [Google Scholar] [CrossRef]
  7. Pedrero, A.; Ruiz, R.; Díaz-Chyla, A.; Díaz, C. Acoustical study of Toledo Cathedral according to its liturgical uses. Appl. Acoust. 2014, 85, 23–33. [Google Scholar] [CrossRef]
  8. Aletta, F.; Kang, J. Historical Acoustics: Relationships between People and Sound over Time. Acoustics 2020, 2, 9. [Google Scholar] [CrossRef] [Green Version]
  9. Đorđević, Z.; Novković, D.; Andrić, U. Archaeoacoustic Examination of Lazarica Church. Acoustics 2019, 1, 24. [Google Scholar] [CrossRef] [Green Version]
  10. Elicio, L.; Martellotta, F. Acoustics as a cultural heritage: The case of Orthodox churches and of the “Russian church” in Bari. J. Cult. Herit. 2015, 16, 912–917. [Google Scholar] [CrossRef]
  11. Girón, S.; Álvarez-Morales, L.; Zamarreño, T. Church acoustics: A state-of-the-art review after several decades of research. J. Sound Vib. 2017, 411, 378–408. [Google Scholar] [CrossRef]
  12. Kosała, K. Calculation Models for Acoustic Analysis of St. Elizabeth of Hungary Church in Jaworzno Szczakowa. Arch. Acoust. 2016, 41, 485–498. [Google Scholar] [CrossRef]
  13. Niemas, M.; Sadowski, J.; Engel, Z. Acoustic Issues of Sacral Structures. Arch. Acoust. 1998, 23, 87–104. [Google Scholar]
  14. Kanev, N. Resonant Vessels in Russian Churches and Their Study in a Concert Hall. Acoustics 2020, 2, 23. [Google Scholar] [CrossRef]
  15. Swedish Research Council. The Multisensory World of Vadstena Abbey in the Late Middle Ages. 2016. Available online: https://www.swecris.se/betasearch/details/project/201601784VR?lang=en (accessed on 11 January 2021).
  16. Scarre, C.; Lawson, G. Archaeoacoustics; McDonald Institute for Archaeological Research: Cambridge, UK, 2006. [Google Scholar]
  17. Boren, B.; Longair, M. A Method for Acoustic Modeling of Past Soundscapes. In Proceedings of the Acoustics of Ancient Theatres Conference, Patras, Greece, 18–21 September 2011; European Acoustics Association and the Hellenic Institute of Acoustics: Patras, Greece, 2011. [Google Scholar]
  18. Berardi, U.; Iannace, G.; Maffei, L. Virtual reconstruction of the historical acoustics of the Odeon of Pompeii. J. Cult. Herit. 2016. [Google Scholar] [CrossRef]
  19. Martellotta, F.; Álvarez-Morales, L. Virtual acoustic reconstruction of the church of Gesú in Rome: A comparison between different design options. In Proceedings of the Forum Acusticum 2014, Krakow, Poland, 7–12 September 2014; The Polish Acoustical Society: Krakow, Poland, 2014. [Google Scholar] [CrossRef]
  20. Alonso, A.; Sendra, J.J.; Suárez, R.; Zamarreño, T. Acoustic evaluation of the cathedral of Seville as a concert hall and proposals for improving the acoustic quality perceived by listeners. J. Build. Perform. Simul. 2014, 7, 360–378. [Google Scholar] [CrossRef]
  21. Sender, M.; Planells, A.; Perelló, R.; Segura, J.; Giménez, A. Virtual acoustic reconstruction of a lost church: Application to an Order of Saint Jerome monastery in Alzira, Spain. J. Build. Perform. Simul. 2018, 11, 369–390. [Google Scholar] [CrossRef]
  22. Selfridge, R.; Cook, J.; McAlpine, K.; Newton, M. Creating Historic Spaces in Virtual Reality using off-the-shelf Audio Plugins. In Proceedings of the 2019 AES International Conference on Immersive and Interactive Audio, York, UK, 27–29 March 2019; Audio Engineering Society: York, UK, 2019. [Google Scholar]
  23. Postma, B.N.J.; Katz, B.F.G. Perceptive and objective evaluation of calibrated room acoustic simulation auralizations. J. Acoust. Soc. Am. 2016, 140, 4326–4337. [Google Scholar] [CrossRef]
  24. Katz, B.F.G.; Poirier-quinot, D.; Postma, B.N.J. Virtual reconstructions of the Théâtre de l ’ Athénée for archeoacoustic study. In Proceedings of the 23rd International Congress on Acoustics integrating 4th EAA Euroregio 2019, Aachen, Germany, 9–13 September 2019; Deutsche Gesellschaft für Akustik: Aachen, Germany, 2019; pp. 303–310. [Google Scholar]
  25. Kleiner, M.; Dalenbäck, B.I.; Svensson, P. Auralization—An Overview. J. Audio Eng. Soc. 1993, 41, 861–875. [Google Scholar]
  26. Mehra, R.; Rungta, A.; Golas, A.; Lin, M.; Manocha, D. WAVE: Interactive Wave-based Sound Propagation for Virtual Environments. IEEE Trans. Vis. Comput. Graph. 2015, 21, 434–442. [Google Scholar] [CrossRef] [PubMed]
  27. Pelzer, S.; Aspöck, L.; Schröder, D.; Vorländer, M. Interactive Real-Time Simulation and Auralization for Modifiable Rooms. Build. Acoust. 2014, 21. [Google Scholar] [CrossRef]
  28. Poirier-Quinot, D.; Katz, B.; Noisternig, M. EVERTims: Open source framework for real-time auralization in VR. In Proceedings of the AM ’17, London, UK, 23–26 August 2017; ACM: New York, NY, USA; London, UK, 2017. [Google Scholar]
  29. Vorländer, M. Auralization. Fundamentals of Acoustics, Modelling, Simulation, Algorithms and Acoustic Virtual Reality, 1st ed.; Springer: Berlin, Germany, 2008; pp. 1–335. [Google Scholar] [CrossRef]
  30. Anderson, J.S.; Bratos-Anderson, M. Acoustic coupling effects in St Paul’s Cathedral, London. J. Sound Vib. 2000, 236, 209–225. [Google Scholar] [CrossRef]
  31. Álvarez-Morales, L.; Lopez, M.; Alvarez-Corbacho, A.; Bustamante, P. Mapping the acoustics of Ripon cathedral. In Proceedings of the 23rd International Congress on Acoustics, Aachen, Germany, 9–13 September 2019; Deutsche Gesellschaft für Akustik: Aachen, Germany, 2019. [Google Scholar]
  32. Boren, B.; Longair, M.; Orlowski, R. Acoustic Simulation of Renaissance Venetian Churches. Acoust. Pract. 2013, 1, 17–28. [Google Scholar] [CrossRef]
  33. Alonso, A.; Suárez, R.; Sendra, J. The Acoustics of the Choir in Spanish Cathedrals. Acoustics 2018, 1, 4. [Google Scholar] [CrossRef] [Green Version]
  34. Martellotta, F. Subjective study of preferred listening conditions in Italian Catholic churches. J. Sound Vib. 2008, 317, 378–399. [Google Scholar] [CrossRef]
  35. Martellotta, F. Identifying acoustical coupling by measurements and prediction-models for St. Peter’s Basilica in Rome. J. Acoust. Soc. Am. 2009, 126, 1175–1186. [Google Scholar] [CrossRef] [PubMed]
  36. Andersson, I.; Ljungstedt, S.; Malm, G. Vadstena Klosterkyrka. 1, Kyrkobyggnaden; Riksantikvarieämbetet och Kungl. Vitterhets-, Historie-, och Antikvitetsakademien: Borås, Sweden, 1991. [Google Scholar]
  37. Strinnholm Lagergren, K. The invitatory antiphons in Cantus sororum: A unique repertoire in a world of standard chant. Plainsong Mediev. Music. 2018, 27, 121–142. [Google Scholar] [CrossRef]
  38. Berthelson, B. Studier i Birgittinerordens Byggnadsskick 1, Anläggningsplanen och dess Tillämpning; Kungl. Vitterhets-, historie- och antikvitetsakademien: Stockholm, Sweden, 1947. [Google Scholar]
  39. Andersson, A. Vadstena Klosterkyrka II. Inredning; Riksantikvarieämbetet och Kungl. Vitterhets-, historie- och antikvitetsakademien: Borås, Sweden, 1983. [Google Scholar]
  40. Sigurdson, J.M.; Zachrisson, S. Aplagårdar och Klosterliljor: 800 år kring Vadstena Klosters Historia; Artos: Skellefteå, Sweden, 2010. [Google Scholar]
  41. Nyberg, T.S. Birgittinische Klostergründungen des Mittelalters; Gleerup: Lund, Sweden, 1965. [Google Scholar]
  42. Bennett, R. Vadstena klosterkyrka III. Gravminnen; Riksantikvarieämbetet och Kungl. Vitterhets-, Historie-, och Antikvitetsakademien: Borås, Sweden, 1985. [Google Scholar]
  43. Autio, H.; Bard, D. A statistical method for parameter estimation from Schroeder decay curves. In Proceedings of the INTER-NOISE 2018, The 47th International Congress and Exposition on Noise Control Engineering, Chicago, IL, USA, 26–29 August 2018; INCE-USA: Chicago, IL, USA, 2018. [Google Scholar]
  44. Alonso, A.; Sendra, J.J.; Suárez, R. Sound Space Reconstruction in the Cathedral of Seville for major feasts celebrated around the main chancel. In Proceedings of the Forum Acusticum 2014, Krakow, Poland, 7–12 September 2014; The Polish Acoustical Society: Krakow, Poland, 2014. [Google Scholar]
  45. Sancta Birgitta. Reuelaciones Extrauagantes; Almqvist & Wiksell: Stockholm, Sweden, 1956. [Google Scholar]
  46. Klemming, G.E. (Ed.) Lucidarium. In Heliga Birgittas Uppenbarelser; P. A. Nordstedt & Söner: Stockholm, Sweden, 1884; Volume 5. [Google Scholar]
  47. Ugglas, C.R.A. En svensk korsväg med målade stationsbilder, del 1. Fornvännen 1938, 33, 230–272. [Google Scholar]
  48. Sancta Birgitta. Opera Minora, Vol 1: Regula Saluatorie; Almqvist & Wiksell: Stockholm, Sweden, 1975. [Google Scholar]
  49. Boren, B.; Abraham, D.; Naressi, R.; Grzyb, E.; Lane, B.; Merceruio, D. Acoustic Simulation of Bach’s Performing Forces in the Thomaskirche. In Proceedings of the 1st EAA Spatial Audio Signal Processing Symposium, Paris, France, 6–7 September 2019; Sorbonne Université: Paris, France, 2019. [Google Scholar]
  50. ODEON Room Acoustics Software. 2020. Available online: https://www.geonoise.com/odeon-room-acoustics-software/ (accessed on 26 December 2020).
  51. Postma, B.N.J.; Katz, B.F.G. Creation and calibration method of acoustical models for historic virtual reality auralizations. Virtual Real. 2015, 19, 161–180. [Google Scholar] [CrossRef]
  52. ISO 3382-1:2009. Acoustics—Measurement of Room Acoustic Parameters—Part 1: Performance Spaces; Technical Report; ISO: Geneva, Switzerland, 2009. [Google Scholar]
  53. Pilch, A. Optimization-based method for the calibration of geometrical acoustic models. Appl. Acoust. 2020, 170. [Google Scholar] [CrossRef]
  54. Vorländer, M. Computer simulations in room acoustics: Concepts and uncertainties. J. Acoust. Soc. Am. 2013, 133, 1203–1213. [Google Scholar] [CrossRef]
  55. Suárez, R.; Alonso, A.; Sendra, J.J. Archaeoacoustics of intangible cultural heritage: The sound of the Maior Ecclesia of Cluny. J. Cult. Herit. 2016, 19, 567–572. [Google Scholar] [CrossRef]
  56. Alonso, A.; Suárez, R.; Sendra, J.J. Virtual reconstruction of indoor acoustics in cathedrals: The case of the Cathedral of Granada. Build. Simul. 2017, 10, 431–446. [Google Scholar] [CrossRef]
Figure 1. Present day church. View from east to west.
Applsci 11 01586 g001
Figure 2. 3D scan showing only the church’s original 15th century parts. View to the north, with the chancel and the location of the monks’ choir to the west, on the left.
Applsci 11 01586 g002
Figure 3. 3D model of three reconstructed chapels (left foreground, middle, right background). In the far left corner is the side of an altar with textile curtains, and a platform on its front covered by a carpet. View from the northeastern side of the nuns’ gallery (compare with Figure 4) towards southwest.
Applsci 11 01586 g003
Figure 4. 3D model of the nuns’ gallery (other nave elements mentioned in the text are not visualized here), showing the entrance niche in the northern wall, leading through a crossing to the gallery. The panels on the shorter sides have small windows for visual access. The gallery is supported from beneath by four brick pillars. View from south to north.
Applsci 11 01586 g004
Figure 5. 3D model of the monks’ choir with beams fitted in the wall niches to the left, supporting the platform. The back part of the stalls are modeled based on preserved stalls used by the monks. View from the west towards the east. The main altar is visible east of the platform.
Applsci 11 01586 g005
Figure 6. Simplification of vaults and chapels in the acoustic model, view from below with floor layer being hidden. The elaborate wooden walls around the altars and graves (compare to Figure 3) are rendered with boxes which are assigned a 45% transparency in ODEON. Screenshot from Google Sketch-up.
Applsci 11 01586 g006
Figure 7. Simplification of statues from the visual model to the acoustic model. Screenshot from Google Sketch-up.
Applsci 11 01586 g007
Figure 8. Comparison between simulated and measured T 20 values in the modern church. The red triangles show the results of the calibrated simulation, and the black boxes correspond to measurements together with frequency-dependent 1 JND error bars. The results for six different listener–receiver combinations are shown across center octave-band frequencies from 63 to 8000 Hz. For low frequencies, some values could not be extracted from the measurements and only the simulated results are shown. The average error in JND is highest in the 63 Hz and 8000 Hz octave bands with 1.2 and 1.4, respectively; the remaining octave bands have values between 0.2 and 0.7.
Applsci 11 01586 g008
Figure 9. Top-down view of the digital reconstruction of the abbey. North is up in the figure. The monks’ choir is the red area to the left, and the nuns’ gallery is the red area in the center. Three source positions—P1, P2, and P3—are marked.
Applsci 11 01586 g009
Figure 10. Graphs showing (a) T20, (b) early decay time (EDT), (c) C80, and (d) G in octave band resolution in the reconstructed abbey choir and gallery. The results for the gallery (red) are shown with dotted lines corresponding to ±1 JND. When the results for the choir (blue) falls within these lines, there is no perceivable difference between the two data sets.
Applsci 11 01586 g010
Figure 11. Energy decay curves in the (a) nuns’ gallery and (b) monks’ choir in the reconstructed abbey. The small insets show the early parts of the decay. Each line corresponds to the results in one octave band.
Applsci 11 01586 g011
Figure 12. Images illustrating the dispersion of acoustic energy, as approximated by an acoustic particle model, over time. Subfigure (a) shows the progression when the source is located in the choir, and subfigure (b) shows when the source is located in the gallery. From top to bottom, the pictures show snapshots at 20 ms, 60 ms, 80 ms, and 120 ms.
Applsci 11 01586 g012
Figure 13. Overview of room acoustic parameters in the reconstructed church. Results are shown for three different source positions in octave band resolution. (a) The average T20 and (d) its standard deviation. (b) The EDT and (e) its standard deviation. (c) The G and (f) its standard deviation. All standard deviations are shown compared to the global average JND of that parameter (dotted line). The gray areas in graphs (ac) delimit values within 1 JND of the global average.
Applsci 11 01586 g013
Figure 14. C80 in octave bands simulated for the recreated church, shown for 13 different receiver positions. The spatial mean (line) is also shown. (a) C80 when the sound source is located in the nuns’ gallery. One position produces significantly lower clarity. (b) C80 when the sound source is located in the choir. (c) C80 when the sound source is located by the high altar in the nave.
Applsci 11 01586 g014
Figure 15. (a) Mid-frequency C80 and (b) mid-frequency G as they vary with source–receiver distance; also shown are linear regression models estimating the influence of source–receiver distance for each source locations. R2 values for the models in subfigure (a): Source in the gallery: (R2 ≈ 0.06), choir: (R2 ≈ 0.78), and nave (R2 ≈ 0.75). In subfigure (b), the corresponding values are gallery: R2 ≈ 0.48, choir: R2 ≈ 0.98, and nave: R2 ≈ 0.92. In subfigure (b), the regression line for a theoretical omnidirectional source in free field is also shown. Highlighted data points have been excluded from the regression lines. These correspond to configurations entirely within the gallery or choir and the outlier case when the source is in the gallery and the receiver below it.
Applsci 11 01586 g015
Table 1. Room acoustic parameters in various configurations of the reconstructed abbey. The values have been averaged according to ISO 3382-1:2009 [52].
GalleryChoirNave
EmptySextFullEmptySextFullEmptySextFull
T 20 (s)5.174.904.004.063.893.265.375.194.36
EDT (s)1.211.100.622.412.332.215.475.294.55
C 80 (dB)8810111−10−10−10
G (dB)161615151515664
Table 2. Mid-frequency reverberation times for some Gothic churches in Northern Europe.
ChurchVolume (m 3 ) T m (s)
Swedish church, current configuration29,0007.79
Swedish church, historical configuration29,0005.15
Church of our Lady, Krakow, Poland95006.5
Church of St Thomas, Lipsk, Germany18,0004.05
Marien Church, Lübeck, Germany100,0005.50
Publisher’s Note: MDPI stays neutral with regard to jurisdictional claims in published maps and institutional affiliations.

