Article

A Method for Rainfall Detection and Rainfall Intensity Level Retrieval from X-Band Marine Radar Images

College of Intelligent Systems Science and Engineering, Harbin Engineering University, No. 145 Nantong Street, Harbin 150001, China
*
Author to whom correspondence should be addressed.
Appl. Sci. 2021, 11(4), 1565; https://doi.org/10.3390/app11041565
Submission received: 14 January 2021 / Revised: 5 February 2021 / Accepted: 6 February 2021 / Published: 9 February 2021

Abstract

:
Currently, it is a hot research topic to retrieve the wave parameters by using X-band marine radar. However, the rainfall noise usually exists in the collected marine radar images, which seriously interferes with the extraction of the wave parameters. To reduce the influence of rainfall noise, the zero-pixel percentage (ZPP) method is widely used to detect rainfall in radar images, but the detection accuracy is limited, and the selection of the threshold needs to be further studied. Based on the ZPP method, the ratio of zero intensity to echo (RZE) method for rainfall detection is proposed in this paper. The detection threshold is determined by statistical analysis of a large amount of radar data. Additionally, it is proposed for the first time to retrieve the rainfall intensity level from X-band marine radar images. In addition, the concept of the occlusion area is proposed. The proposed area and the wave area are used as the rainfall detection area of the radar image, respectively, for experimental research. The data obtained from the Pingtan experimental base in Fujian Province are used to verify the effectiveness of the proposed method. The experimental results show that the detection accuracy of the proposed method is 11.7% higher than that of the ZPP method, and the accuracy of rainfall intensity level retrieval is 84%.

1. Introduction

The observation and exploration of the ocean have many significances in the utilization of marine resources, the safety of ship navigation, and the construction of shore ports. Through the high-resolution radar equipment, the wave motion can be observed in real time. The ocean parameters such as wavelength, wave direction, wave height and wave period can be obtained [1], and the ocean dynamic parameters such as wind, current and wave can be extracted [2,3,4]. In the process of ocean information extraction, many noises affect the extraction accuracy, including co-channel interference, target and rainfall [5,6]. Among them, rainfall has the greatest impact on the radar image and seriously interferes with the accurate extraction of ocean wave information [7]. In order to obtain these data in real time, wave observation equipment and wave inversion method have been studied by researchers.
The existence of rainfall can change the roughness of the ocean surface, which increases the radar backscattering [8]. The existence of rainfall also increases the attenuation of electromagnetic waves and reduces the measuring range of radar [9]. In the case of high rainfall intensity, the electromagnetic wave signal is seriously interfered, which seriously affects the extraction of wave parameter information and wind parameter information [10,11]. Currently, rainfall in the process of ocean wave retrieval is mostly regarded as interference, and the rain-contaminated radar images are detected, screened and suppressed by algorithms [12]. Rainfall can also be regarded as the research target, and the information of rainfall intensity level can be obtained in real time by using radar equipment [13]. The marine radar is used for navigation and rainfall detection at the same time, which has become a hot research topic. This research has great value in saving resources on board, controlling equipment cost, improving convenience and timeliness.
There are many research achievements in the field of rainfall detection by marine radar. The statistic characteristic—the mean value and variation coefficient of a radar echo image—is used as classifying criteria to distinguish rainfall and no rainfall in Ref. [14]. A method combined quality control with the three-dimensional evaluation parameters of surface roughness and signal-to-noise ratio (SNR) is proposed in Ref. [15] to detect and deal with the rain data. The above two methods are based on the statistical characteristics of the radar image to detect rainfall. The statistical parameters only can reflect the local characteristics of the sea surface rather than the overall characteristics, so the accuracy of rainfall detection is not satisfactory. The concept of zero-pixel percentage (ZPP) was first proposed by Lund et al. [16], and the threshold of rainfall detection is set as 50% to determine whether the radar image is contaminated by rainfall. Although the rain-contaminated radar image is successfully detected, the accuracy is limited due to the selection of the threshold. In Ref. [17], two sets of radar systems, Decca and Furuno, were used for experiments. It is found that different radar antenna height may produce different shadow effect, which means the threshold of the ZPP method for rainfall detection is different. Based on engineering experience and a large number of ocean wave retrieval experiments, the threshold of the ZPP method is set as 10% in Ref. [18]. In the same year, the threshold set to 10% was verified in Ref. [19]. In addition, other methods to detect rain-contaminated radar images have been proposed. Huang et al. [20] proposed a new parameter to distinguish rain-free radar images and rain-contaminated radar images. For one radar image, if the intensities of all pixels in one azimuth direction are higher than a threshold, the direction is defined as the high-clutter direction (HCD). Then, if the number of HCDS accounts for more than 5% of all directions in the image, the image is determined as a rain-contaminated image. However, this threshold will change greatly with the different radar systems and sea conditions, so the selection of the threshold needs further study. In Ref. [21], a support vector machine (SVM)-based method for rainfall detection from X-band marine radar images is presented. Since several images collected by the SVM-based method are incorrectly detected under the swell-dominated sea, the accurate detection model cannot be obtained. Therefore, the application environment of the SVM-based method is relatively limited. In Ref. [22], a novel rainfall detection method based on the difference in the correlation characteristics is presented. The correlation coefficient of the X-band marine radar images has little difference in the same lagged azimuth when the weather is light rain and heavy rain, and the error exists in the determination of the threshold due to the existence of correlation difference fluctuation in the experiment. Therefore, it is difficult to accurately detect whether the radar image is contaminated by rainfall, and this method needs further research and improvement.
Then, the rainfall intensity level of the radar image detected as rainfall is determined. Currently, rain gauge and weather radar are mainly used to measure rainfall intensity. The rain gauge is used to measure the precipitation of a fixed point in a period of time. There are two common types, siphon rain gauge and bucket rain gauge. The weather radar is mainly divided into digital weather radar, Doppler weather radar and phased array weather radar, which can realize the functions of large-scale rainfall prediction in space and quantitative rainfall retrieval [23]. Additionally, the research on rainfall intensity level retrieval by marine radar is almost blank.
At the beginning of the 21st century, the radar reflectivity-rainfall intensity (Z-R) relation method is widely used to determine rainfall intensity level by rain gauge and weather radar. The Z-R relationship will change with different types of precipitation [24]. Meanwhile, the combination method and improved method of the Z-R relation method have also been proposed. In Ref. [25], the S-band Doppler weather radar is used to combine the Z-R relation method with the Mie theory, which can improve the accuracy of rainfall retrieval. The short wavelength of the millimeter-wave cloud radar can cause strong attenuation from raindrops in heavy rainfall observation, and the attenuation increases with the increase of rainfall intensity. Therefore, researchers used the attenuation phenomenon to estimate the rainfall and proposed a new method by using Ka-band cloud radar [26]. During this period, new rainfall retrieval methods have been proposed. A Zero-Layer Bright Band MOSVI (B-M) method is proposed in Ref. [27], which uses synthetic aperture radar (SAR) to retrieve rainfall. However, no suitable radar model can really achieve the accuracy, so the model and simulation algorithm will be further improved in the future work. In Ref. [28], the stationary wavelet transform (SWT) method is used to extract the frequency reflectivity and rainfall information in the wavelet domain, so as to obtain the estimated value of rainfall. In recent years, more popular deep learning methods are used for rainfall retrieval, such as [29,30]. In Ref. [29], convolutional neural networks and back propagation neural networks are used to improve the accuracy of precipitation retrieval. In Ref. [30], a nonparametric deep learning method by using precipitation radar is applied to rainfall retrieval, and the experimental results are satisfactory.
Currently, the ZPP is still widely used to detect rainfall because it has the advantages of simple operation, easy to understand and easy to realize in engineering, but the selection of the threshold needs to be further studied. The ZPP method proposed by Lund et al. in Ref. [16] is improved in this article. The echo intensity average ( μ ) parameter is introduced and combined with ZPP parameter, which is defined as the ratio of zero intensity to echo (RZE). The occlusion area is used as the rainfall detection area of the radar image to improve the detection accuracy, and the detection threshold is determined by statistical analysis of a large number of radar image data. Additionally, the wave area of the radar image is also used as rainfall detection area to verify the detection performance of the proposed method. The rainfall intensity fitting function is obtained by the optimal fitting of a large number of radar image data, which is used to retrieve the radar image detected as rainfall to determine the rainfall intensity level. This article is the first article to select the occlusion area for rainfall detection, and also the first article to retrieve the rainfall intensity level from X-band marine radar images. The method of this article not only retains the advantages of the ZPP method, but also solves the problem of threshold selection.
The remainder of this article is organized as follows. In Section 2, the data used in this study and the preprocessing of these data are introduced. In Section 3, the concepts of RZE parameter and occlusion area are proposed. In Section 4, the RZE method for rainfall detection and rainfall intensity level retrieval is presented. In Section 5, the effectiveness of the proposed method is verified by the collected data. Conclusions are summarized in Section 6.

2. Data Overview and Pre-Processing

The collected radar image data cannot be directly used for rainfall detection and should be pre-processed. In addition, the co-channel interference is produced in most of the raw radar images, which seriously affects the accuracy of rainfall detection. Therefore, it is necessary to suppress the co-channel interference before detecting rainfall.

2.1. Data Overview

From 2005 to 2012, the sea navigation test and land mooring test named “wave retrieval technology of Shipborne X-band Marine radar” were carried out in Bohai Sea area and East China Sea area by the research group of Harbin Engineering University. In this experiment, the wave monitoring equipment was developed and the performance of this equipment was tested. In order to further verify the accuracy of the wave monitoring equipment, a large number of sea experiment data and weather data were collected by the research group in the ocean observation station of Haitan Island in Pingtan County from 2013 to 2015. The experimental site and radar equipment are shown in Figure 1.
The rainfall data is automatically recorded by the rain gauge of the observation station, and the accuracy of the rain gauge is 0.1 mm. With reference to the actual radar image, the micro rain less than 0.1 mm is set as 0.05 mm.
The radar image in this article is the actual measurement data collected by X-band marine radar in August 2013, and the configuration of the radar is given in Table 1. The rotatory period of the radar antenna is about 2.5 s, and the pulse repetition frequency is 2 kHz. The time interval between adjacent radar image sequences is 85 s, and each of the radar image sequence consists of 32 images. The sector area with azimuth from 50° to 90° and radial from 80 to 600 points is selected as the occlusion area of the radar image.

2.2. Data Pre-Processing

As shown in Figure 2a, the co-channel interference is produced in most of the raw radar images, which seriously affects the quality of these radar images. During the preprocessing of these radar images, the correlation method in spatial domain is used to detect and eliminate the co-channel interference noise. Firstly, the threshold is determined by the constant false alarm rate (CFAR) method, and the position of the interference noise line in the radar image is detected by the correlation method. Then, the modified Laplace linear template is used to locate the noise points on the interference line. Finally, the noise points detected by the piecewise interpolation method are repaired to filter out the noise. The radar image after co-channel interference removal is shown in Figure 2b.
After removing the co-channel interference from these radar images, the time resolution is set to 10 min by the moving average method during the experiment. It is assumed that the spatial distribution of rainfall is uniform in a short period of time. The average value of RZE parameters of 32 radar images in a group of radar image sequence is taken as the RZE parameter of this sequence during this period, and the rainfall of this sequence is the accumulated value of rainfall during this period.
Since the acquisition time of a radar image sequence is about 1.5 min and then pauses for 1.5 min, there are about three complete radar image sequences collected in 10 min. The RZE parameter of three adjacent radar image sequences within 10 min is calculated by the Equation (1). The processed value is approximately the RZE parameter within 10 min.
S ( i ) = S ( i 1 ) + S ( i ) + S ( i + 1 ) 3
where S ( i ) and S ( i ) are the data values to be processed and processed, and S ( i 1 ) and S ( i + 1 ) are the adjacent data values to be processed.
The rainfall intensity of three adjacent radar image sequences within 10 min are calculated by the Equation (2). The processed value is the accumulated rainfall intensity within 10 min.
I ( i ) = I ( i 1 ) + I ( i ) + I ( i + 1 )
where I ( i ) and I ( i ) are the data values to be processed and processed, and I ( i 1 ) and I ( i + 1 ) are the adjacent data values to be processed.

3. RZE Parameter

3.1. Review and Explanation of ZPP and μ

ZPP [16] is defined as the ratio of the number of image pixels with zero intensity to the total number of pixels, which is used as a quality control parameter to detect rainfall and can be expressed as
Z P P = P 0 P × 100 %
where P 0 denotes the number of image pixels with zero intensity, and P denotes the total number of pixels.
The echo intensity is the reflection of the echo signal received by the radar receiver on the radar image, which can indicate whether the radar image is contaminated by rainfall. When the constant power electromagnetic wave is transmitted by the radar transmitter, after attenuation, scattering, reaching the target and returning to the receiver, the radar will store the received signal in the form of voltage. Therefore, the voltage value can reflect the echo intensity on the radar image [14].
The mean echo intensity ( μ ) represents the strength of echo signal in a certain area of the radar image, which can be expressed as
μ = 1 m n i = 1 m j = 1 n f ( x i , y j )
where m and n are the range value of the selected radar image, f ( x i , y j ) is the echo intensity value of the pixel ( x i , y j ) on the radar image and the unit is V .
The ZPP and μ are two classical rainfall detection parameters, which can reflect the rainfall intensity in radar images. Each parameter is compared with the set threshold to determine whether the radar image is contaminated by rainfall, but the detection speed of the single parameter is slow and the detection error is large.

3.2. The RZE

It can be seen from Figure 3 that with the increase of rainfall intensity, the ZPP parameter decreases and the μ parameter increases gradually. The values of the two parameters change inversely with the increase of rainfall intensity. Therefore, the ratio of ZPP to μ is defined as combination parameters, known as RZE. The RZE can more clearly determine whether the radar image is contaminated by rainfall and improve the accuracy of rainfall detection. The formula can be expressed as
R Z E = Z P P μ

3.3. The Occlusion Area

It is assumed that the spatial distribution of rainfall is uniform in a short period of time. As shown in Figure 4a, the rainfall detection area of the radar image generally includes the whole radar image and the wave area. The whole radar image has the random superposition interference of various echo noises such as fixed objects, ships, waves, etc., and the sea state is relatively complex [20]. The main noise in the wave area is the ocean wave echo, which shows bright and dark stripes in the red sector area of the radar image. Therefore, the characteristics of the wave area are clearer and the random superposition interference is less, which makes the wave area more widely used.
The occlusion area on the radar image is the black sector of Figure 4. Among them, the occlusion area in Figure 4a has little or no echo, and the occlusion area in Figure 4b has very obvious echo. Therefore, the occlusion area of the radar image can be used to detect rainfall.
In Figure 5, the reason for the existence of the occlusion area is that the masts, buildings, mountains and other obstructions are close to the radar. Most of the electromagnetic waves are blocked and cannot reach the sea surface, because the radar is set lower than the shelter. When the weather is sunny, the electromagnetic wave cannot be transmitted to the sea surface behind the shelter, and the radar echo will not be generated in the occlusion area. When the weather is rainy, the rain echo appears in the occlusion area due to the backscattering of raindrops. The backscattering of raindrops can significantly improve the brightness of the occlusion area. Therefore, compared with the whole radar image and the wave area, the occlusion area is more suitable for rainfall detection in the radar image.
In this article, the rainfall detection area is defined in the occlusion area for rainfall detection and rainfall intensity level retrieval. Additionally, the detection area is also defined in the wave area to verify the detection performance of the proposed method.

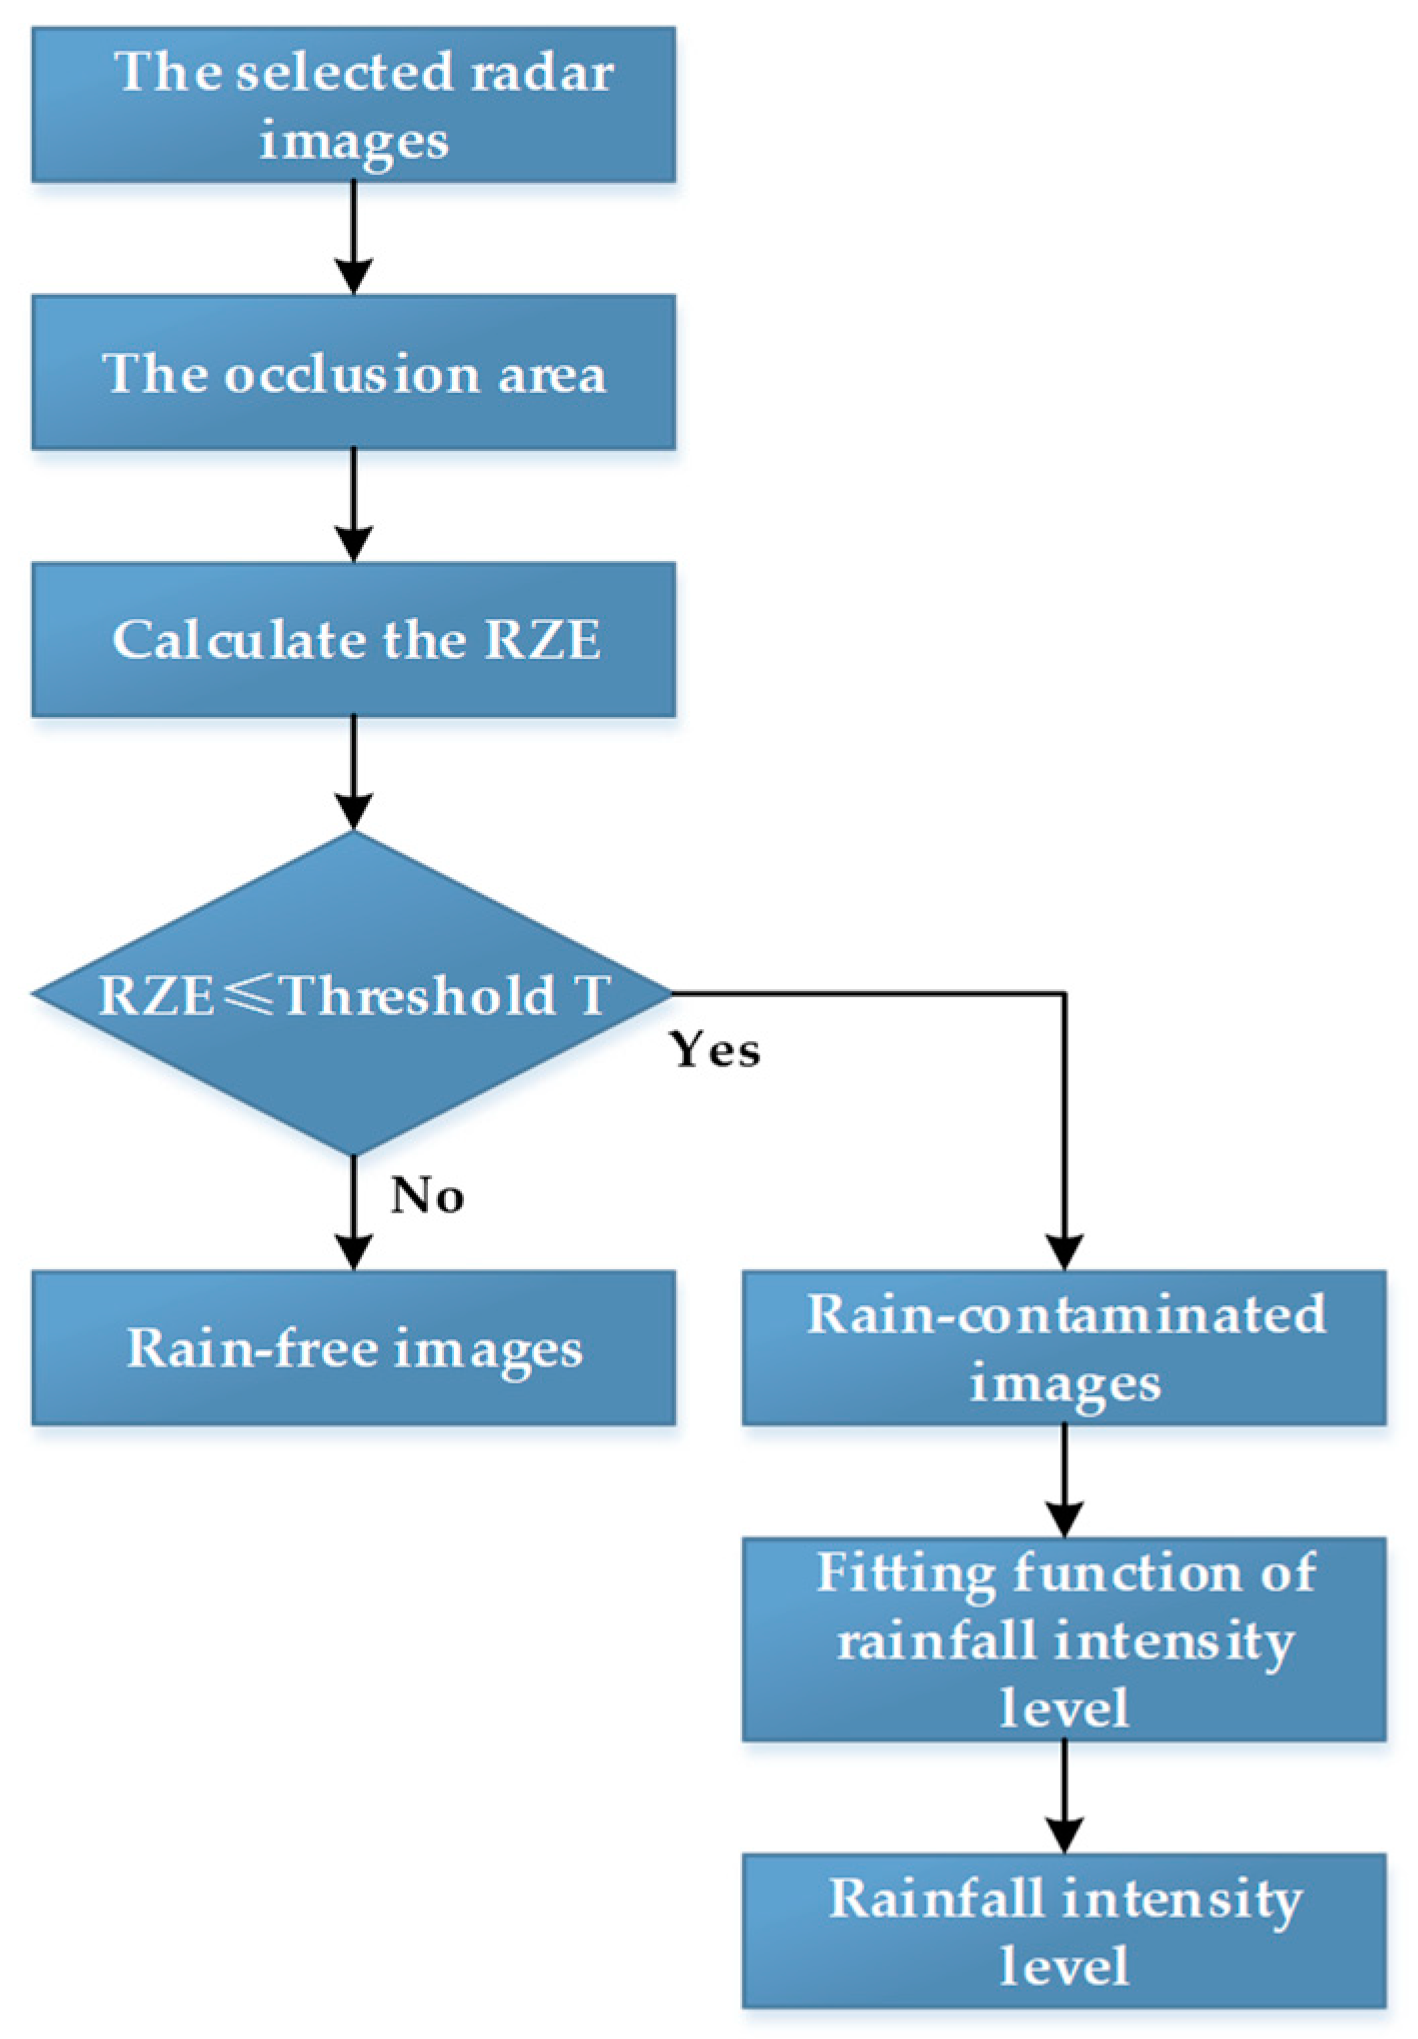
4. The RZE Method for Rainfall Detection and Rainfall Intensity Level Retrieval

The RZE method for rainfall detection is mainly divided into threshold acquisition and rain-contaminated radar image determination. Firstly, the offline observation experiment is carried out. A large number of radar images are used to calculate ZPP and μ in the occlusion area, and rainfall information of each radar image is recorded synchronously. The RZE parameters of each image are calculated by the Equation (5), and the threshold T is determined by statistical analysis of the RZE parameters. Then, the ZPP and μ are calculated in the occlusion area of a selected radar image, and the RZE parameter is calculated by the Equation (5). Finally, the RZE parameter is compared with the threshold T to determine whether the radar image is contaminated by rainfall.
For the radar images detected as rain-contaminated, the rainfall intensity level of these radar images is determined. Firstly, the RZE parameters of a large number of radar images are calculated by the same method mentioned above, and the distribution relationship between RZE parameters and rainfall intensity recorded synchronously by each radar image are analyzed statistically. The distribution relationship is screened and fitted to determine the function of rainfall intensity level. Then, RZE parameters of the rain-contaminated radar images are calculated by the same method mentioned above. Finally, the RZE parameters are substituted into the determined fitting function of rainfall intensity level to obtain the rainfall intensity level. The flow chart of the whole method is shown in Figure 6.

4.1. Rainfall Detection

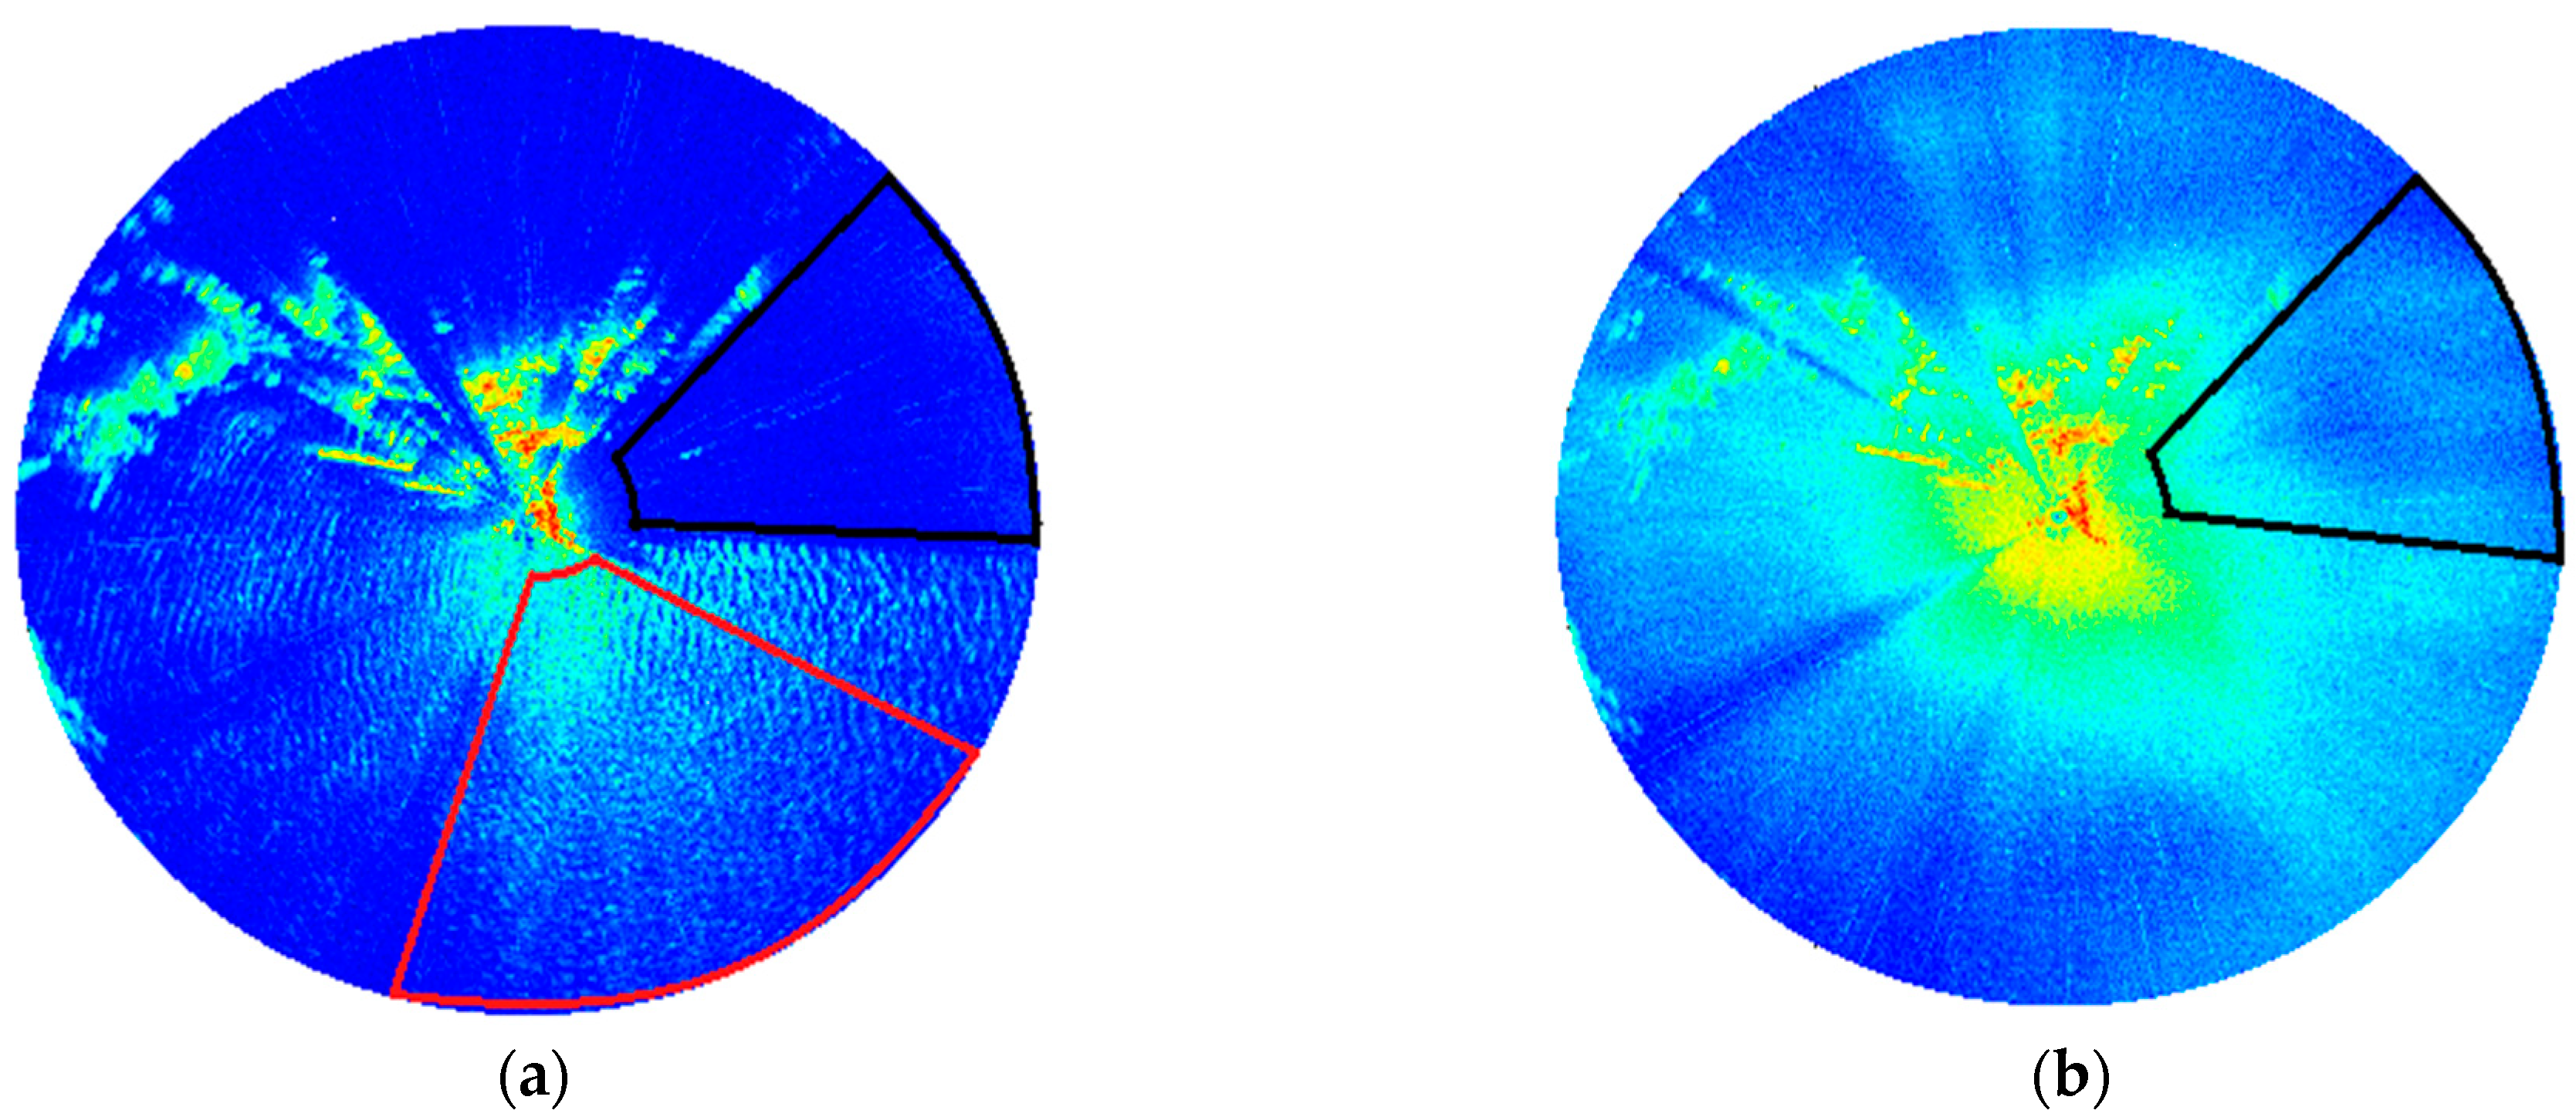
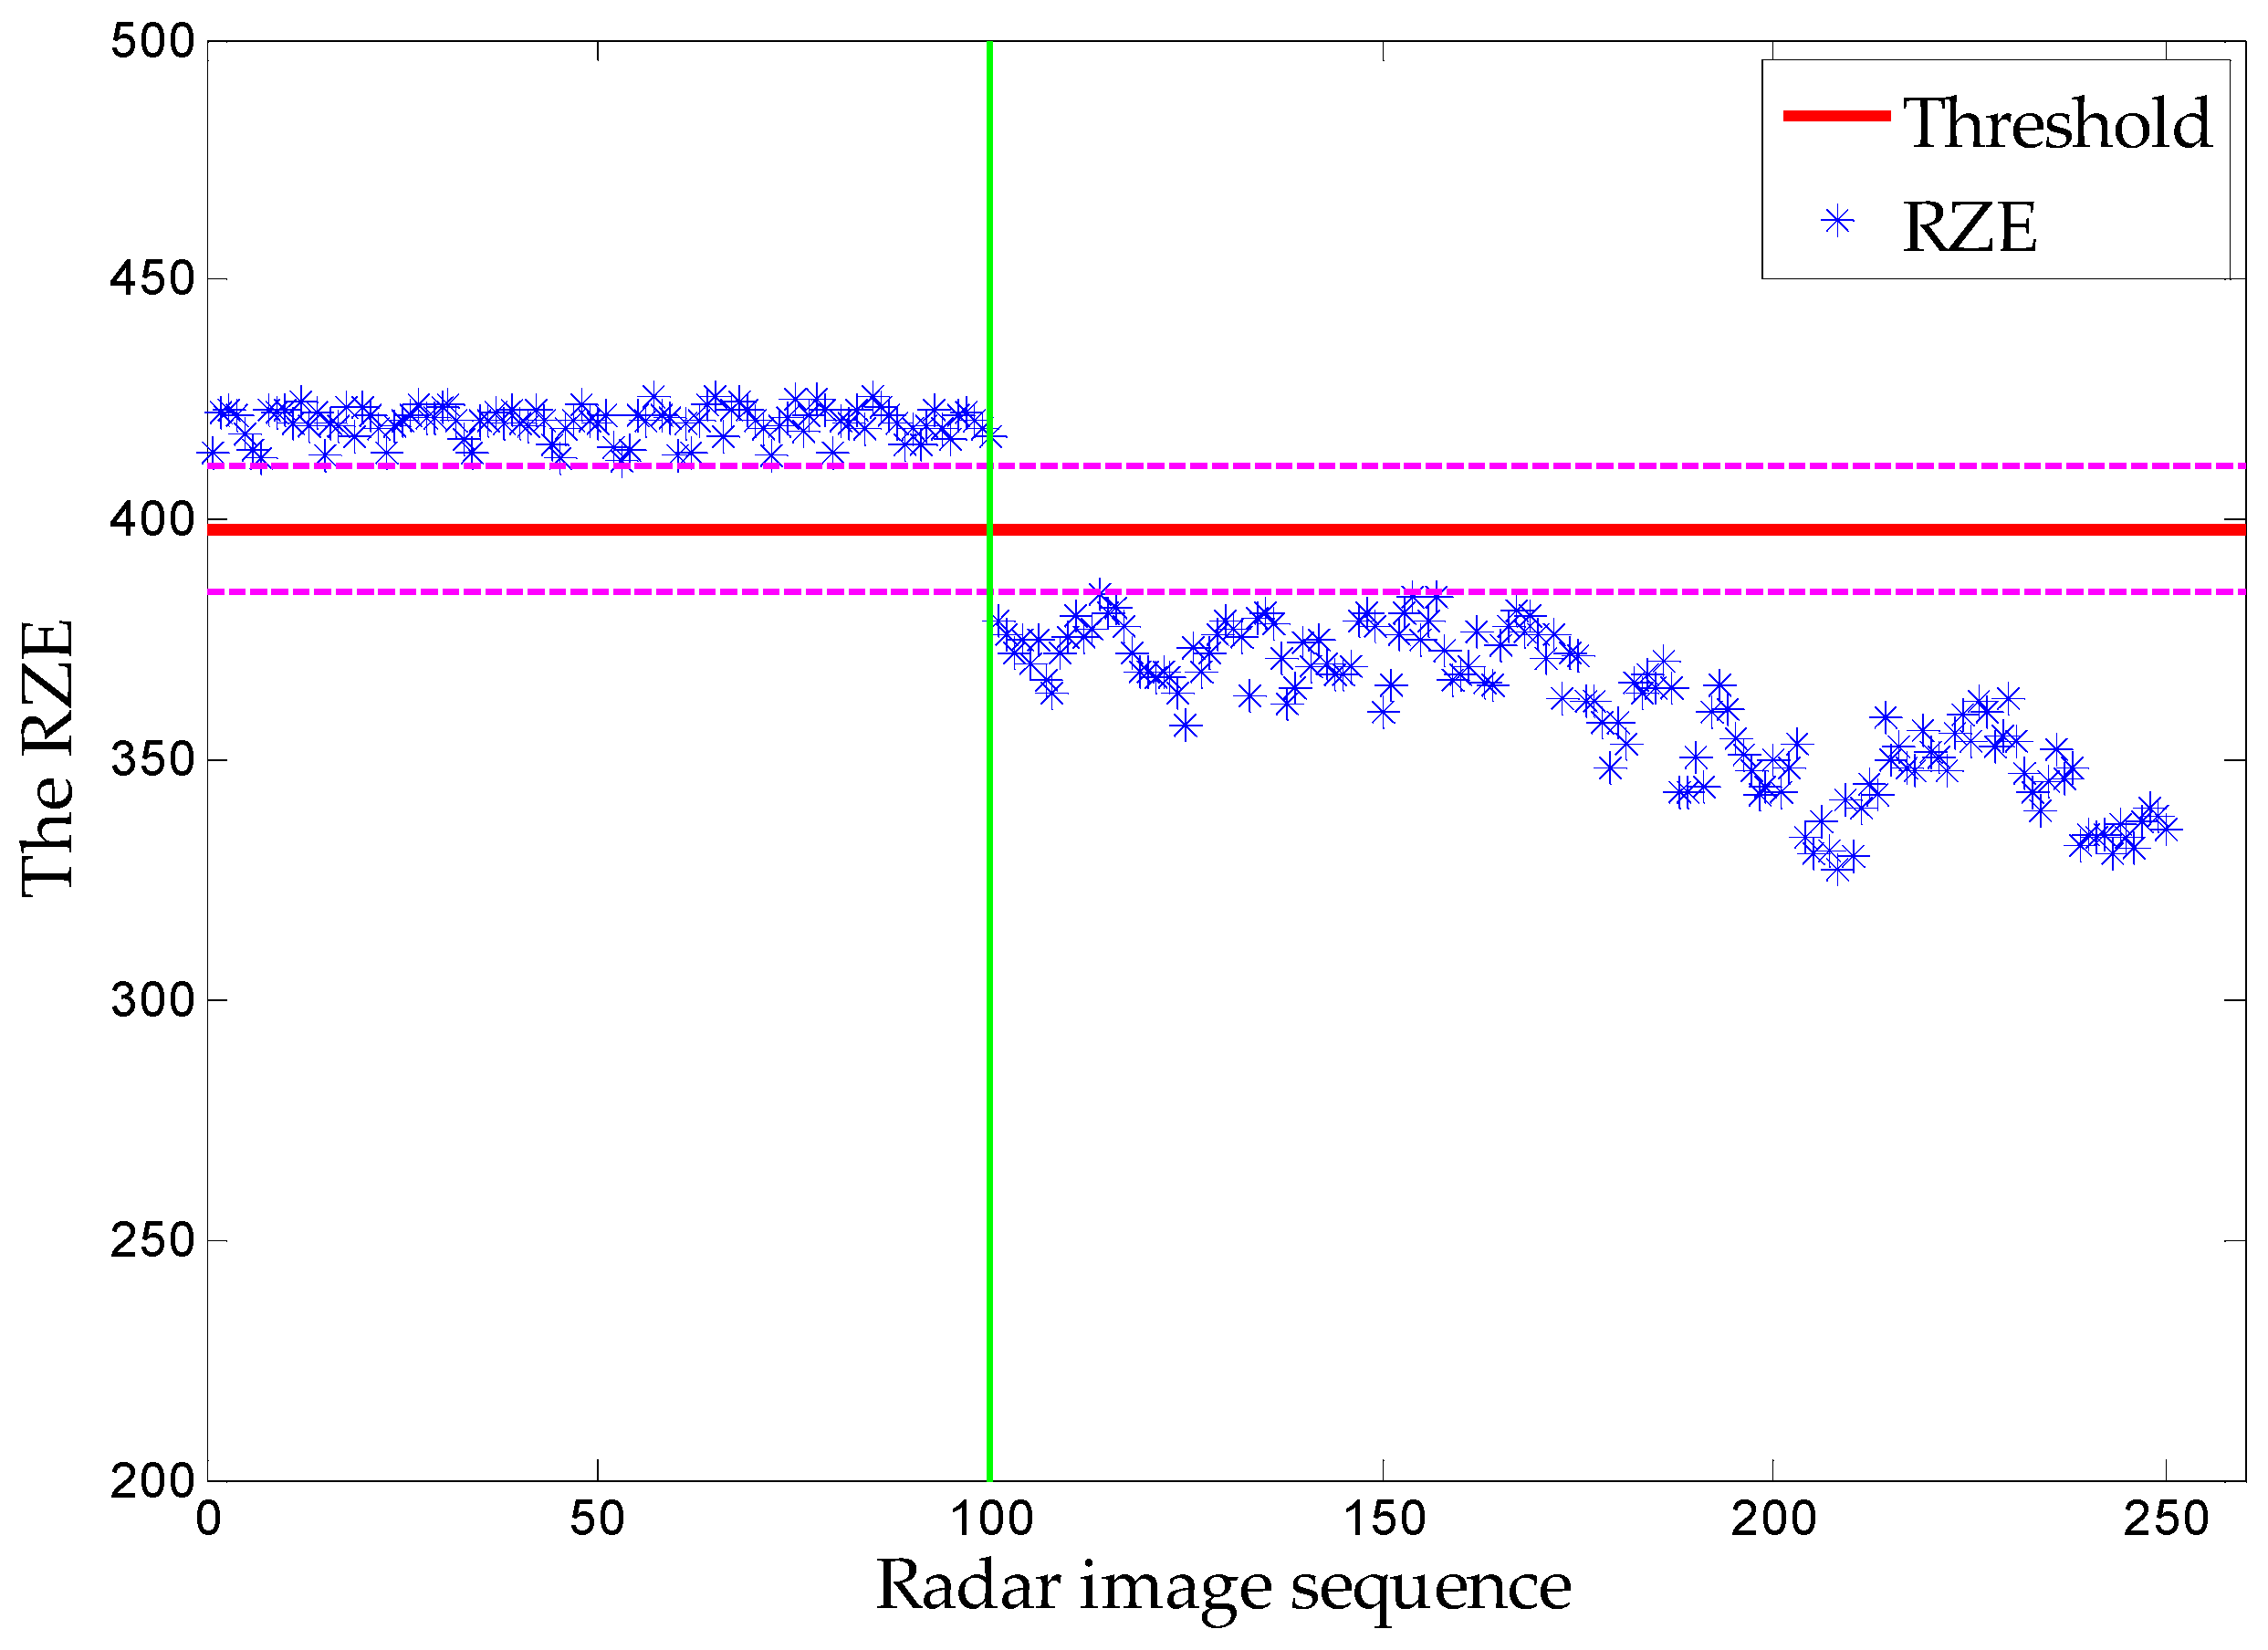
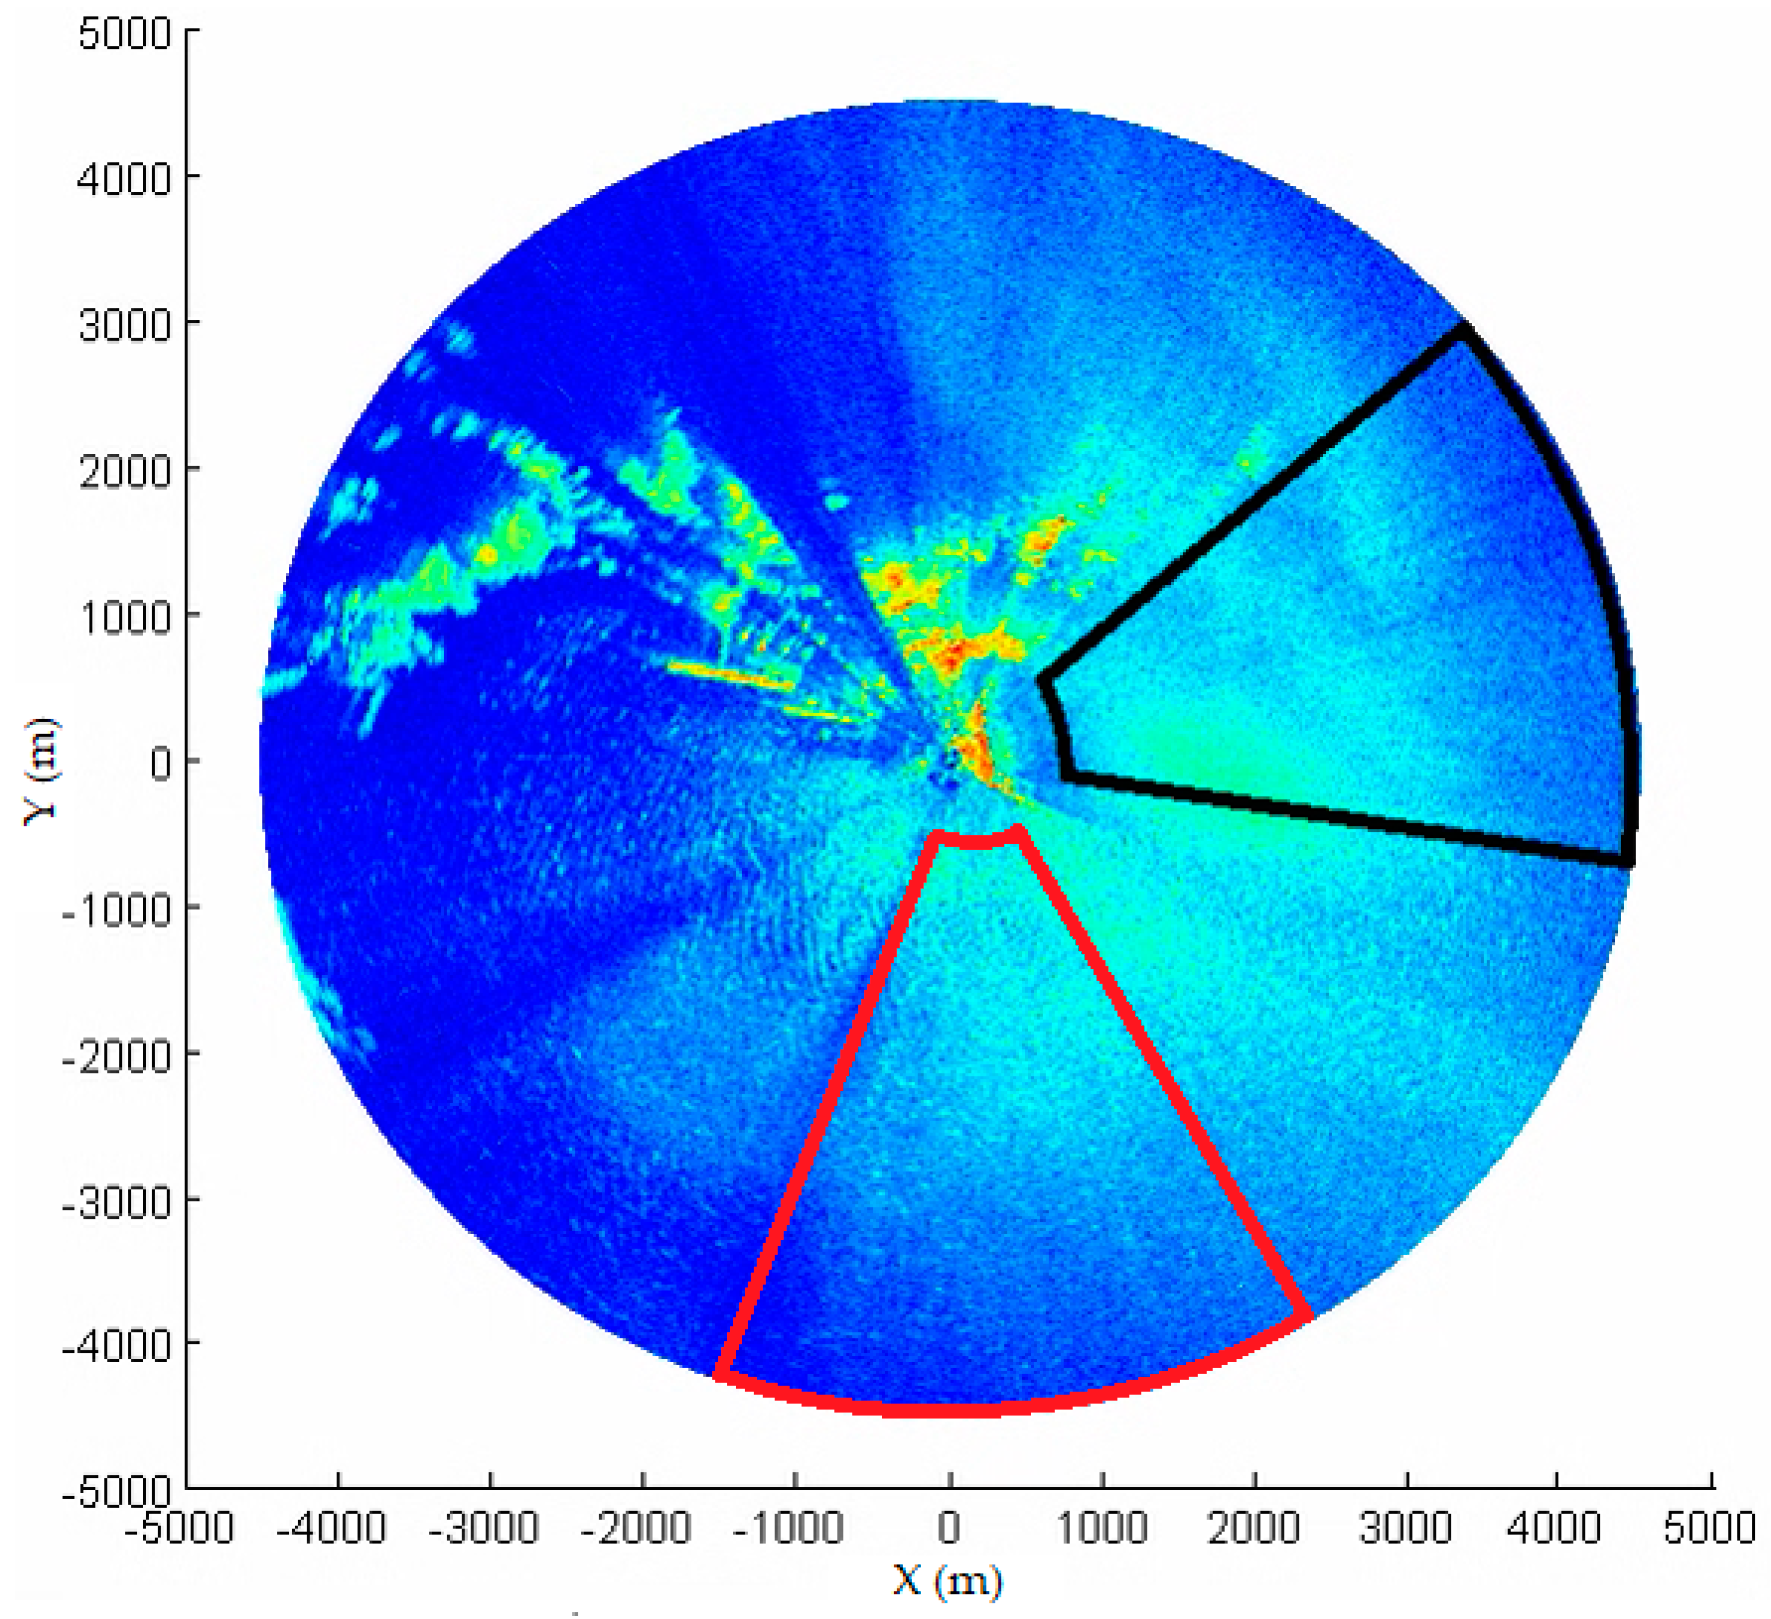
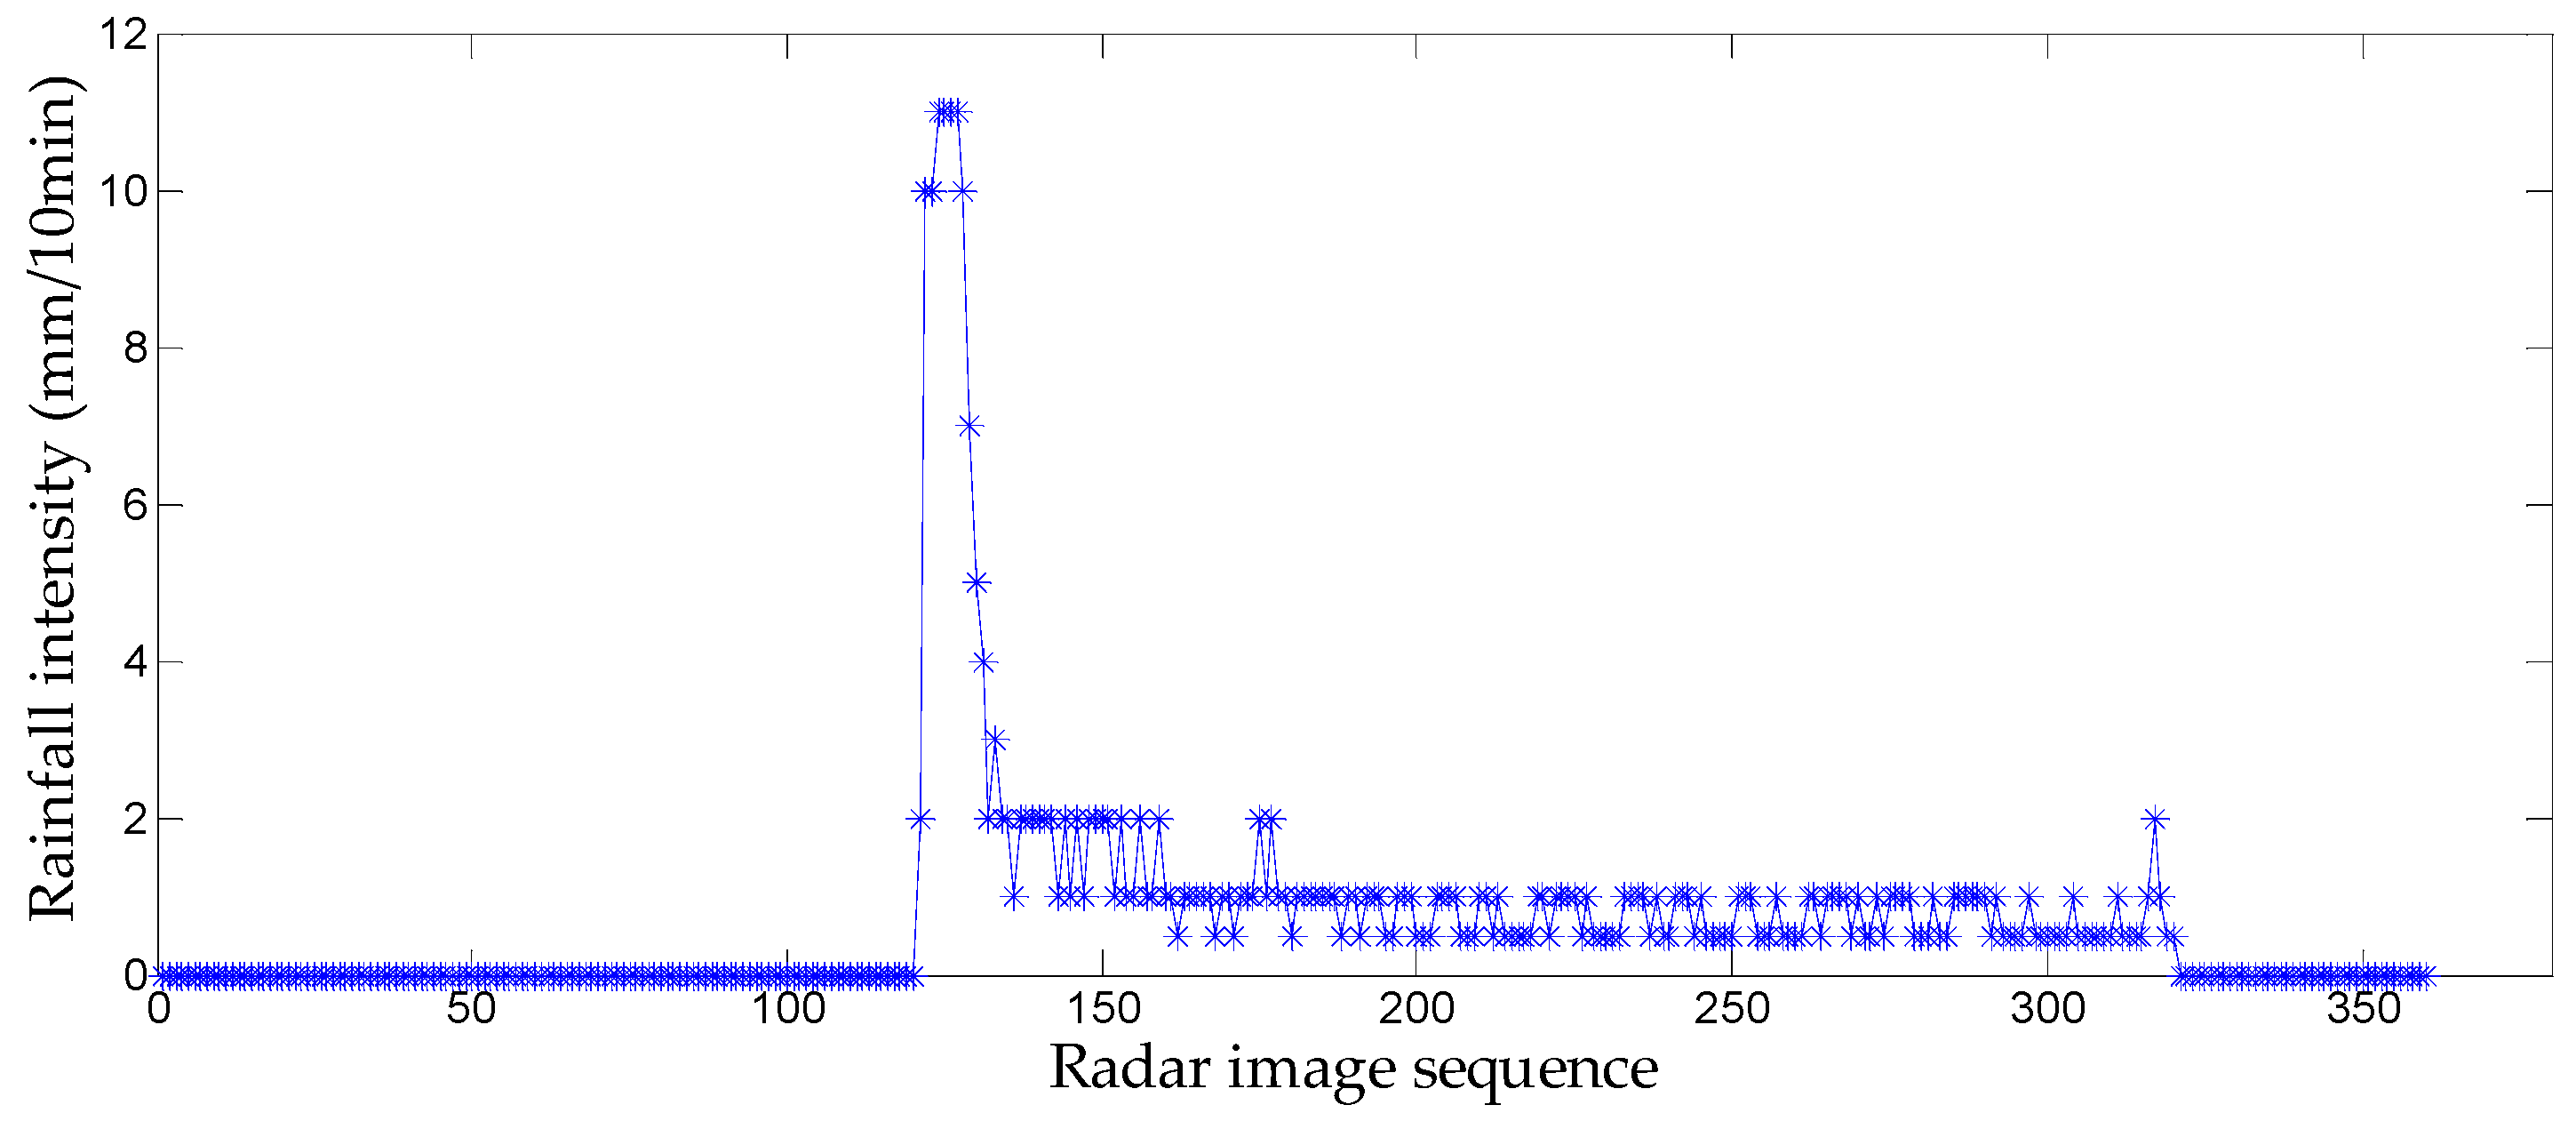
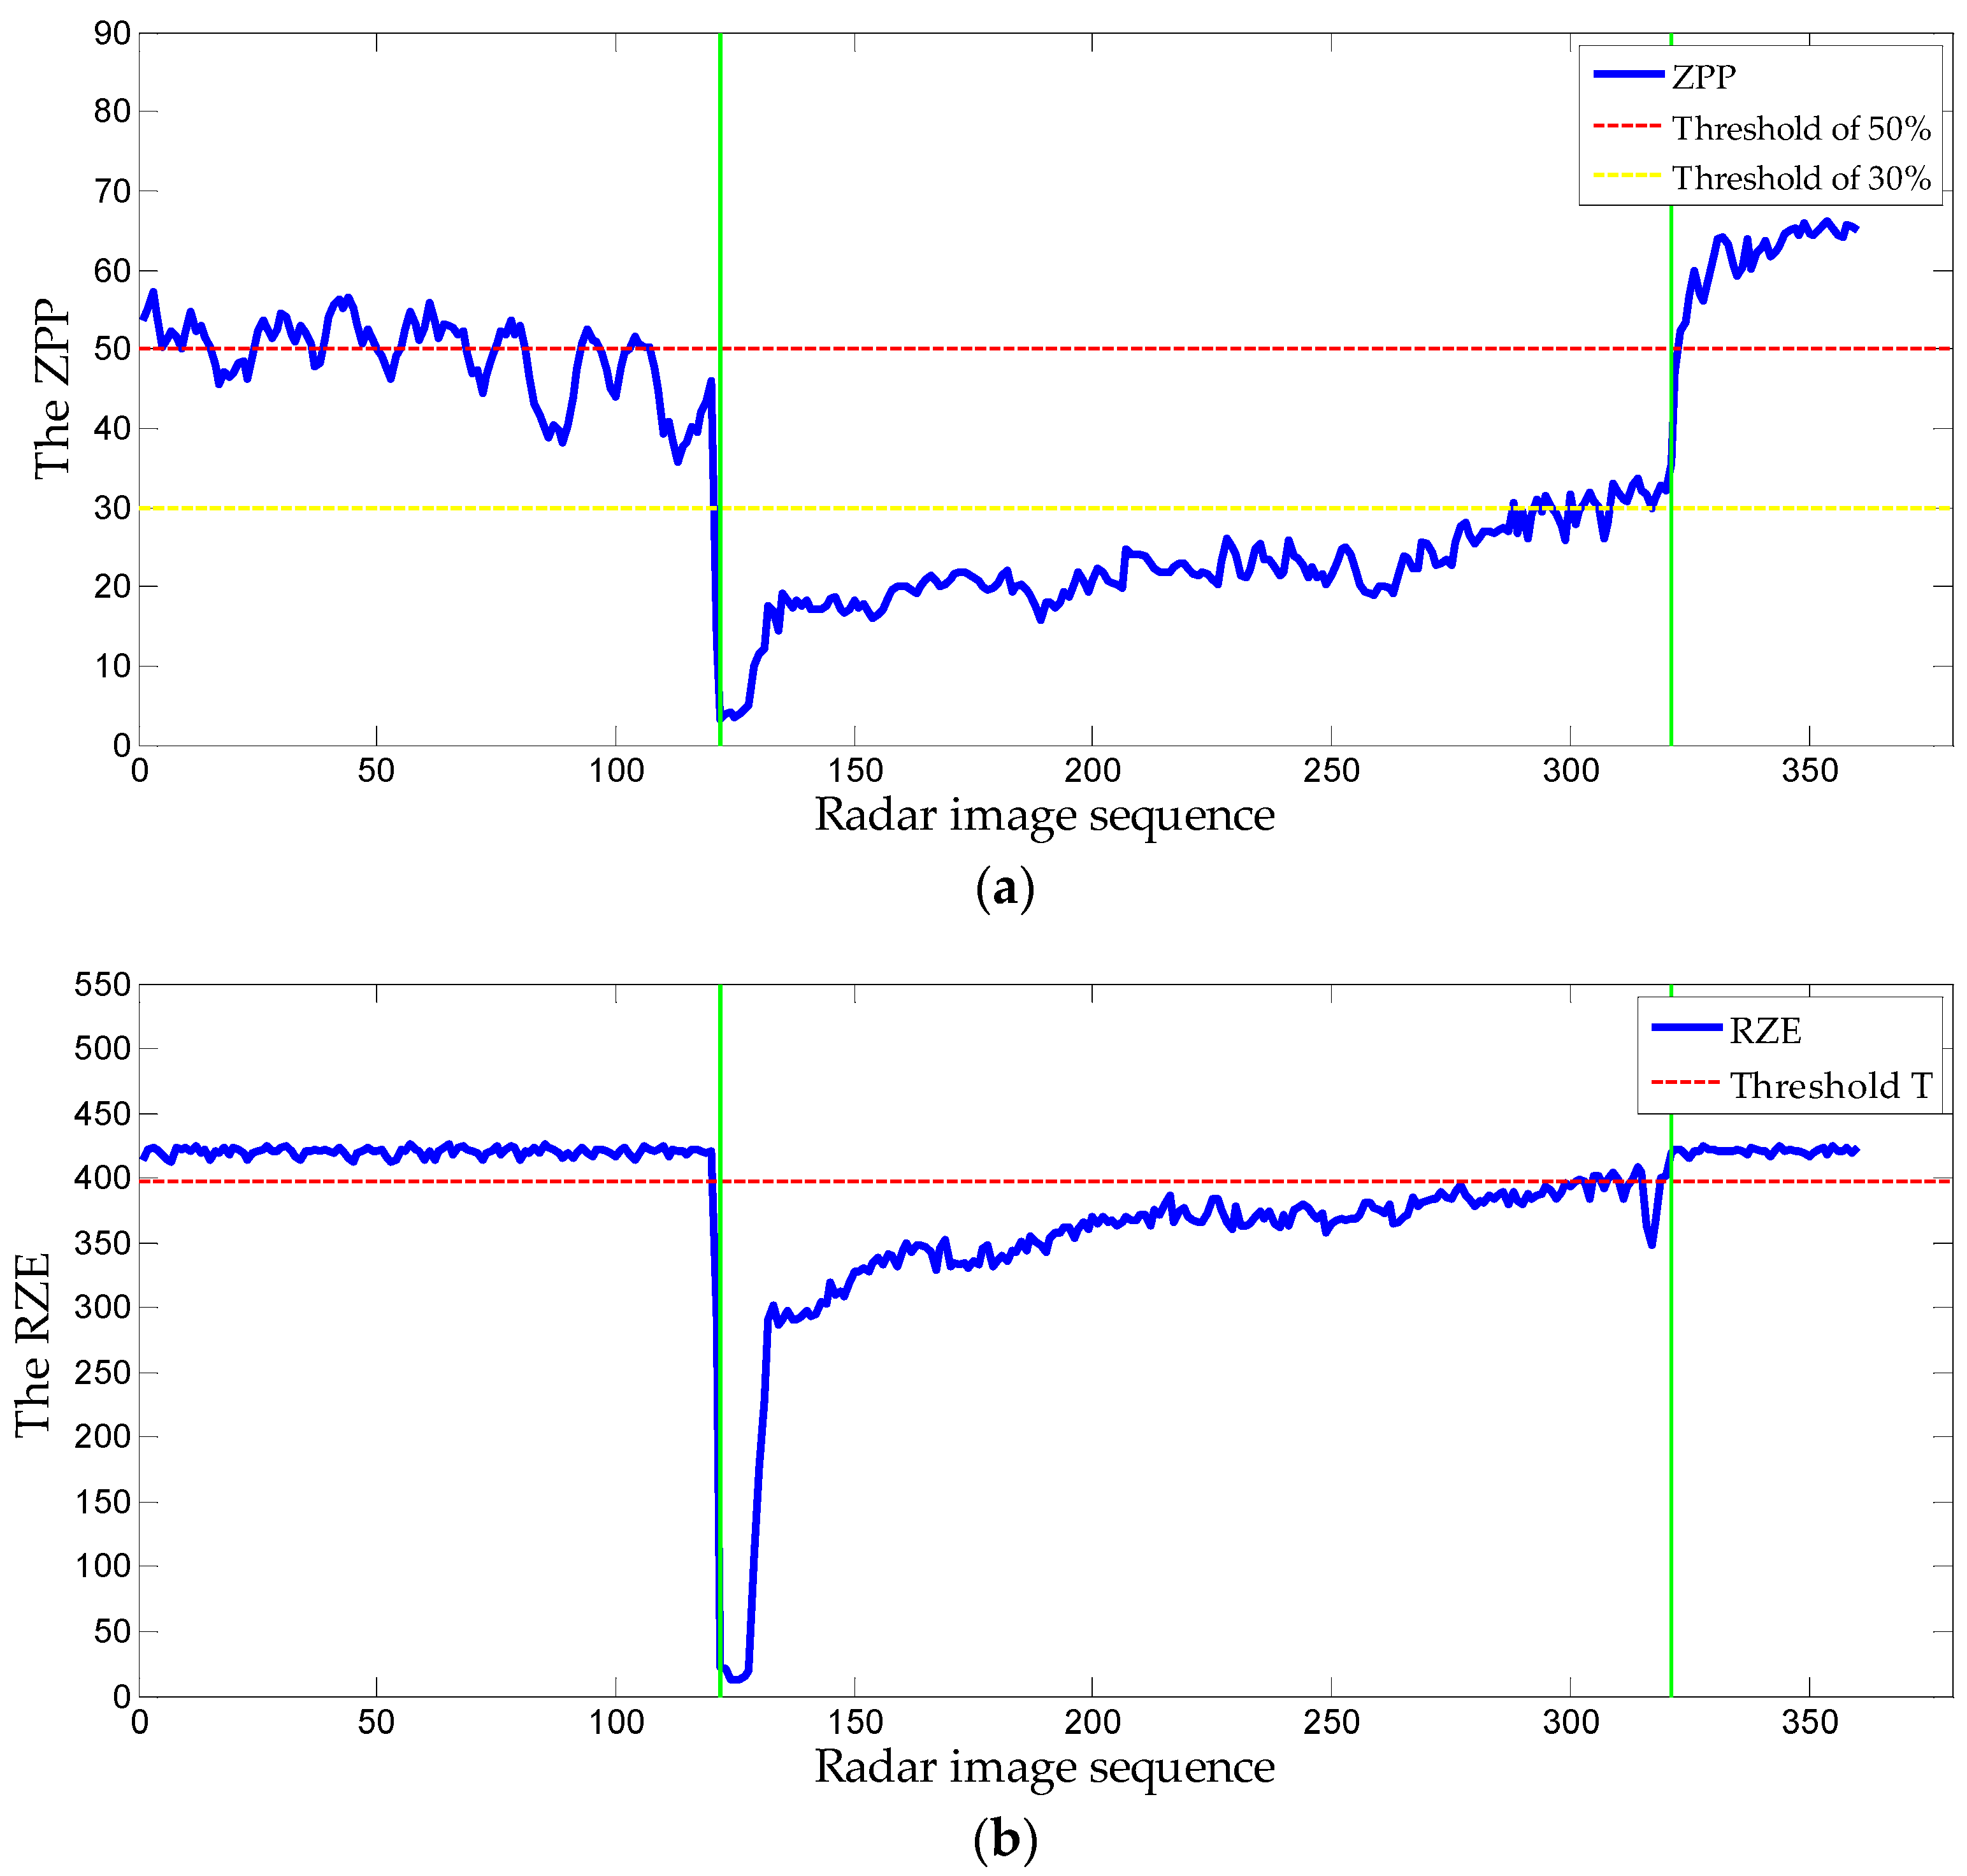
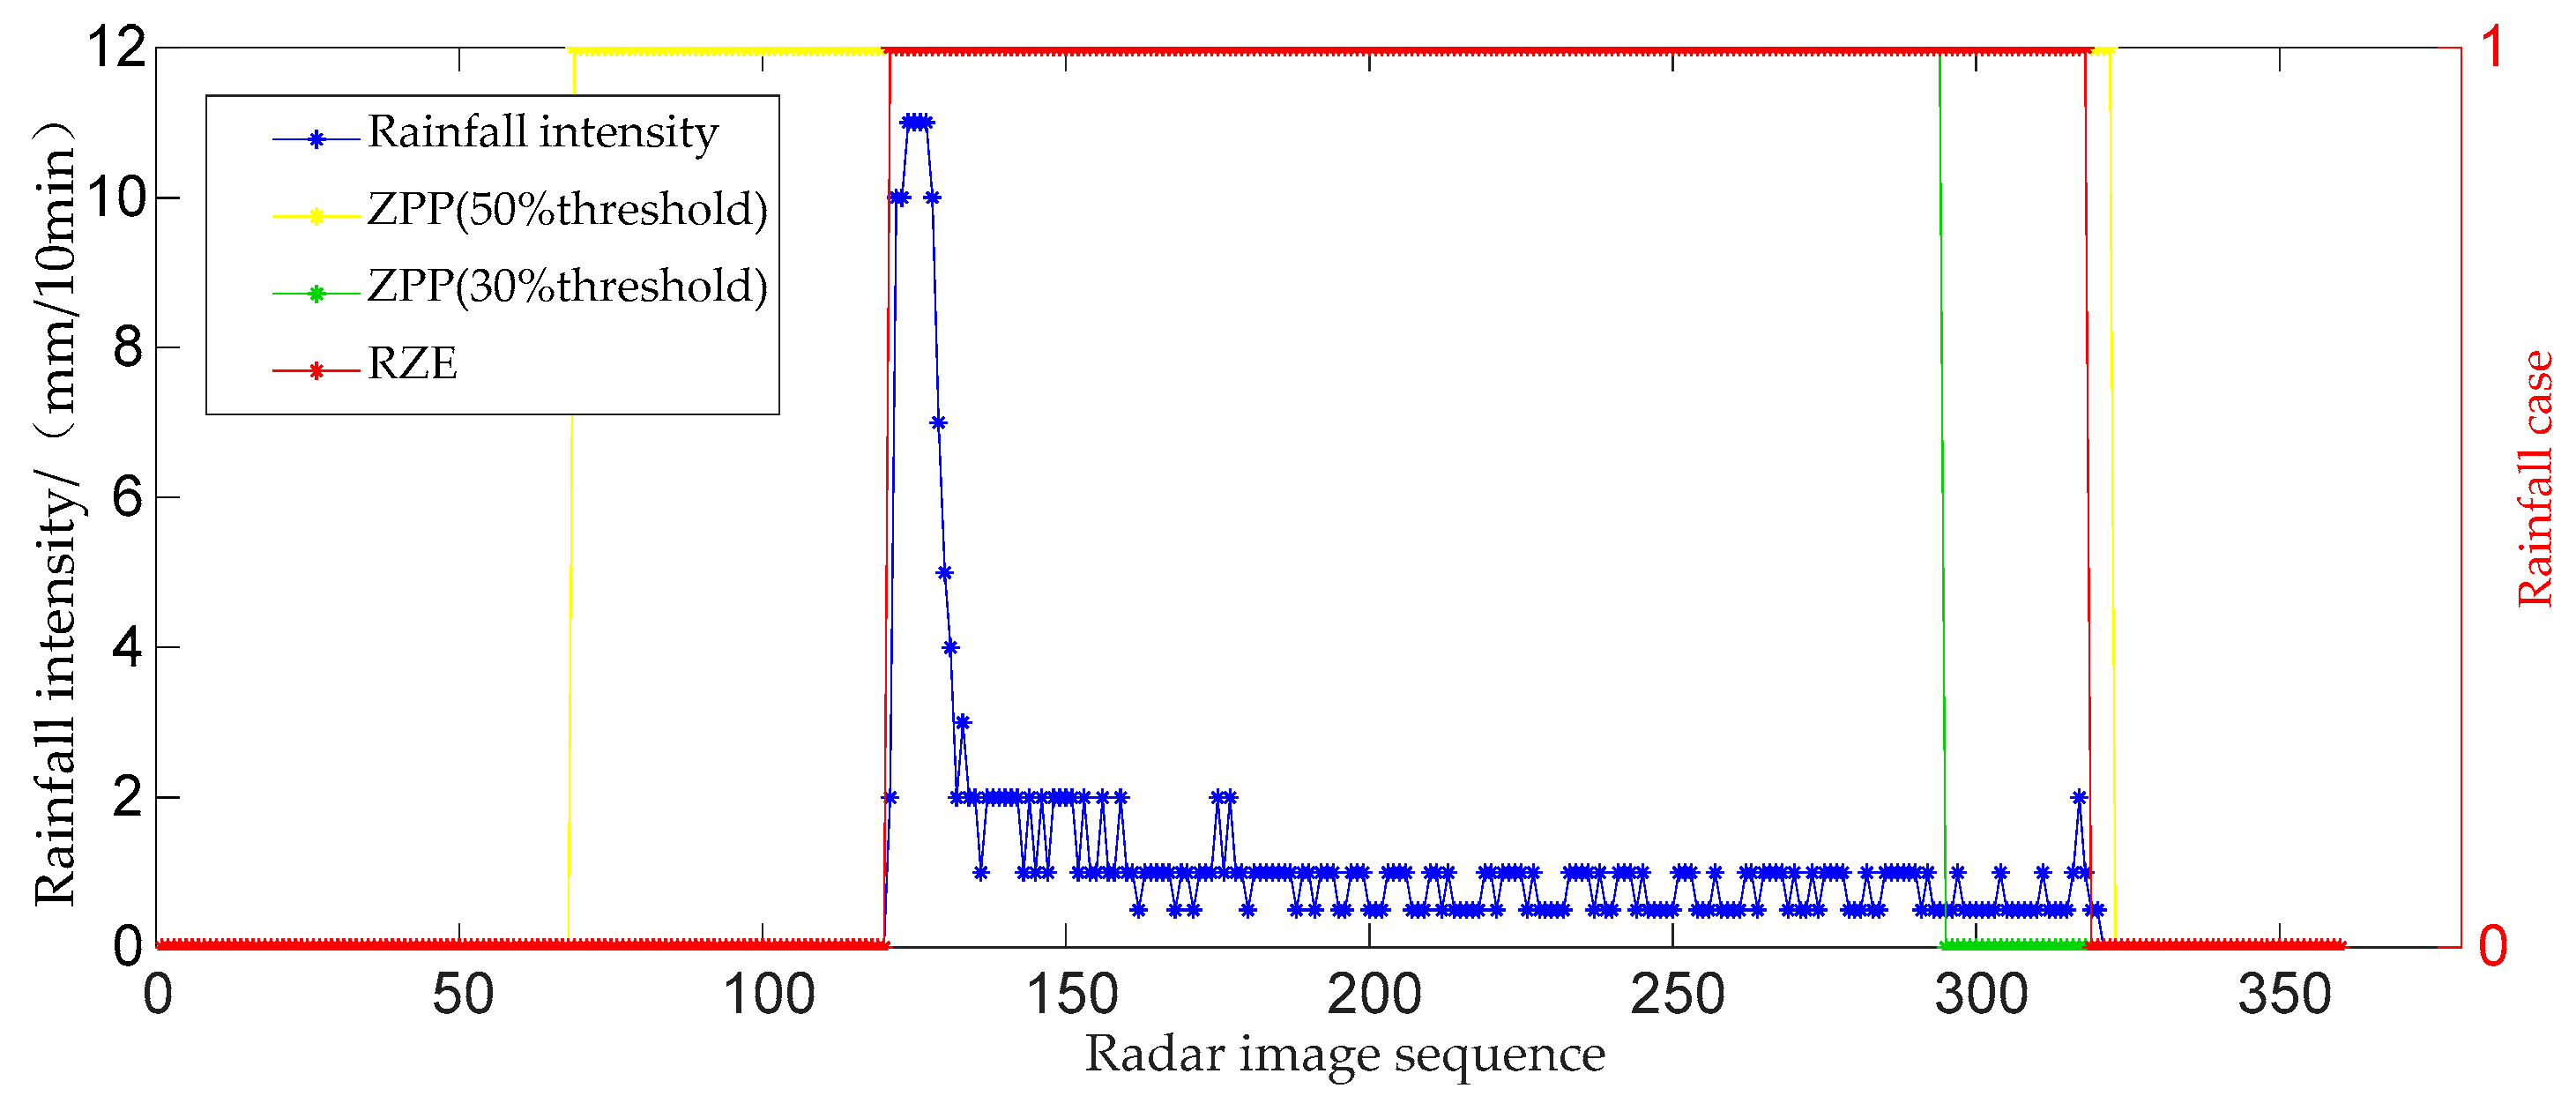
Since the threshold T exists between no rain and light rain, the radar images measured by the rain gauge at 0, 0.1, and 0.2 mm are statistically analyzed. It should be noted that the calculated threshold T is not a fixed value, and the threshold T will change relatively with different data selection and radar equipment. A total of 250 radar images are selected, including 100 rain-free radar images and 150 rain-contaminated radar images. These images are loaded by the image processing software, and the actual rainfall at the corresponding time point are recorded synchronously by the rain gauge. According to the radial distance and angle range of the radar image, the sector occlusion area is determined. The ZPP and μ are calculated in the occlusion area, and the RZE parameter is calculated by the Equation (5).
The calculated RZE parameters are plotted and analyzed, as shown in Figure 7. The 100 radar images to the left of the green solid line are the RZE of the rain-free images, and the minimum value is 410 ( V 1 ) . The 150 radar images to the right of the green solid line are the RZE of the rain-contaminated images, and the RZE are all lower than 386 ( V 1 ) . Meanwhile, there is an obvious dividing line between the RZE of the rain-free images and the rain-contaminated images. Therefore, the 398 ( V 1 ) (the average value of 410 ( V 1 ) and 386 ( V 1 ) ) is used as the threshold T.
According to the method mentioned above, the RZE parameter of a selected radar image is calculated and compared with the determined threshold T to determine whether the radar image is contaminated by rainfall. The detection method is shown in Equation (6). When the RZE of the selected radar image is lower than the threshold T, the selected radar image is considered to be contaminated by rainfall; otherwise, the selected radar image is considered to be without rainfall.
s e l e c t e d   r a d a r   i m a g e = { r a i n - c o n t a m i n a t e d   i m a g e , R Z E < T r a i n - f r e e   i m a g e , R Z E T
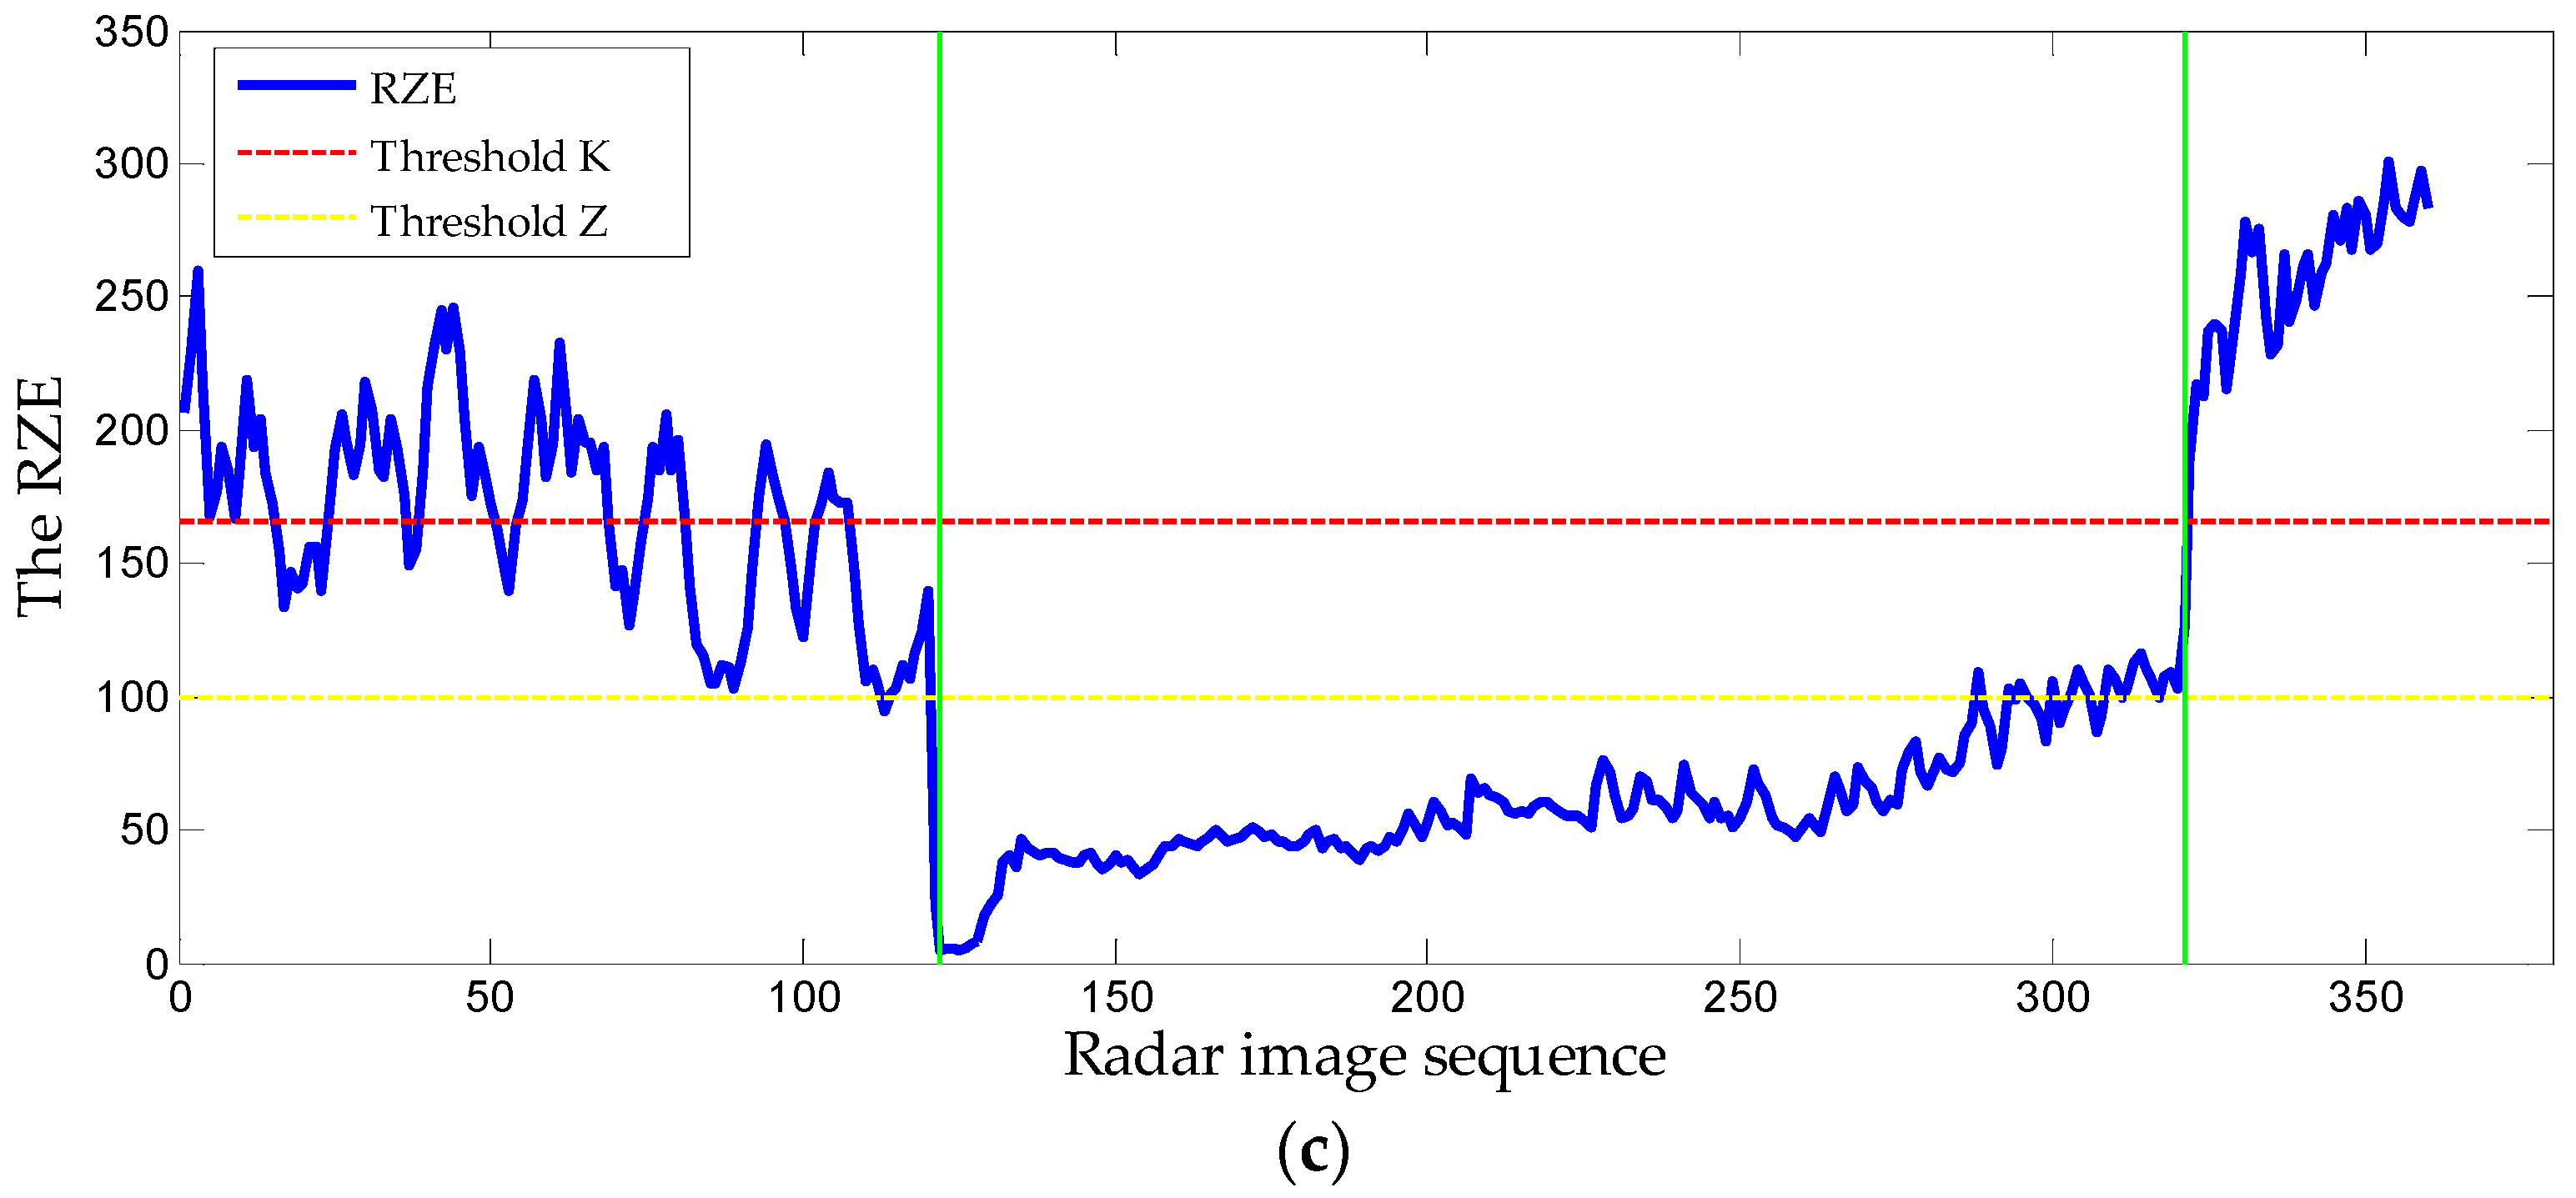
In addition, this article attempts to determine the threshold of rainfall detection when the detection area is defined in the wave area. The main interference of the wave area is the ocean wave echo, which has been introduced in Section 3.3. Due to the effect of wind wave and swell, the μ of the wave area in the absence of rainfall may be close to or greater than that of the wave area in the presence of rainfall, which makes RZE parameter unable to determine whether the radar image is contaminated by rainfall. Therefore, the threshold of rainfall detection cannot be determined by statistical analysis method.
In Ref. [22], a threshold of the thermal noise is proposed for rainfall detection in the same radar system as in this article. When the μ of the wave area is less than 0.3 V, the radar image is determined as the rain-free image of low sea conditions. Additionally, the threshold of the thermal noise is used as the threshold of rainfall detection. Since the values of the ZPP and μ change inversely with the increase of rainfall intensity, the threshold of the RZE can be defined as the ratio of the ZPP threshold to the μ threshold. The threshold of the ZPP is set as 50% from Lund et al. [16]. Therefore, when the detection area is defined in the wave area, the threshold K of rainfall detection is calculated as 166.67 ( V 1 ) . The detection method is shown in Equation (7).
s e l e c t e d   r a d a r   i m a g e = { r a i n - c o n t a m i n a t e d   i m a g e , R Z E < K r a i n - f r e e   i m a g e , R Z E K

4.2. Rainfall Intensity Level Retrieval

Rainfall is defined as the depth of the water layer that rain accumulates from the sky to the ground without infiltration, evaporation or loss. Rainfall can directly show the amount of rain accumulated, and the unit is mm. Rainfall intensity is defined as the average rainfall in a certain period, which can reflect the size of rainfall, that is, rainfall intensity increases with the increase of rainfall. After the data preprocessing in Section 2.2, the time resolution is set as 10 min, and the unit of rainfall intensity is mm/10 min.
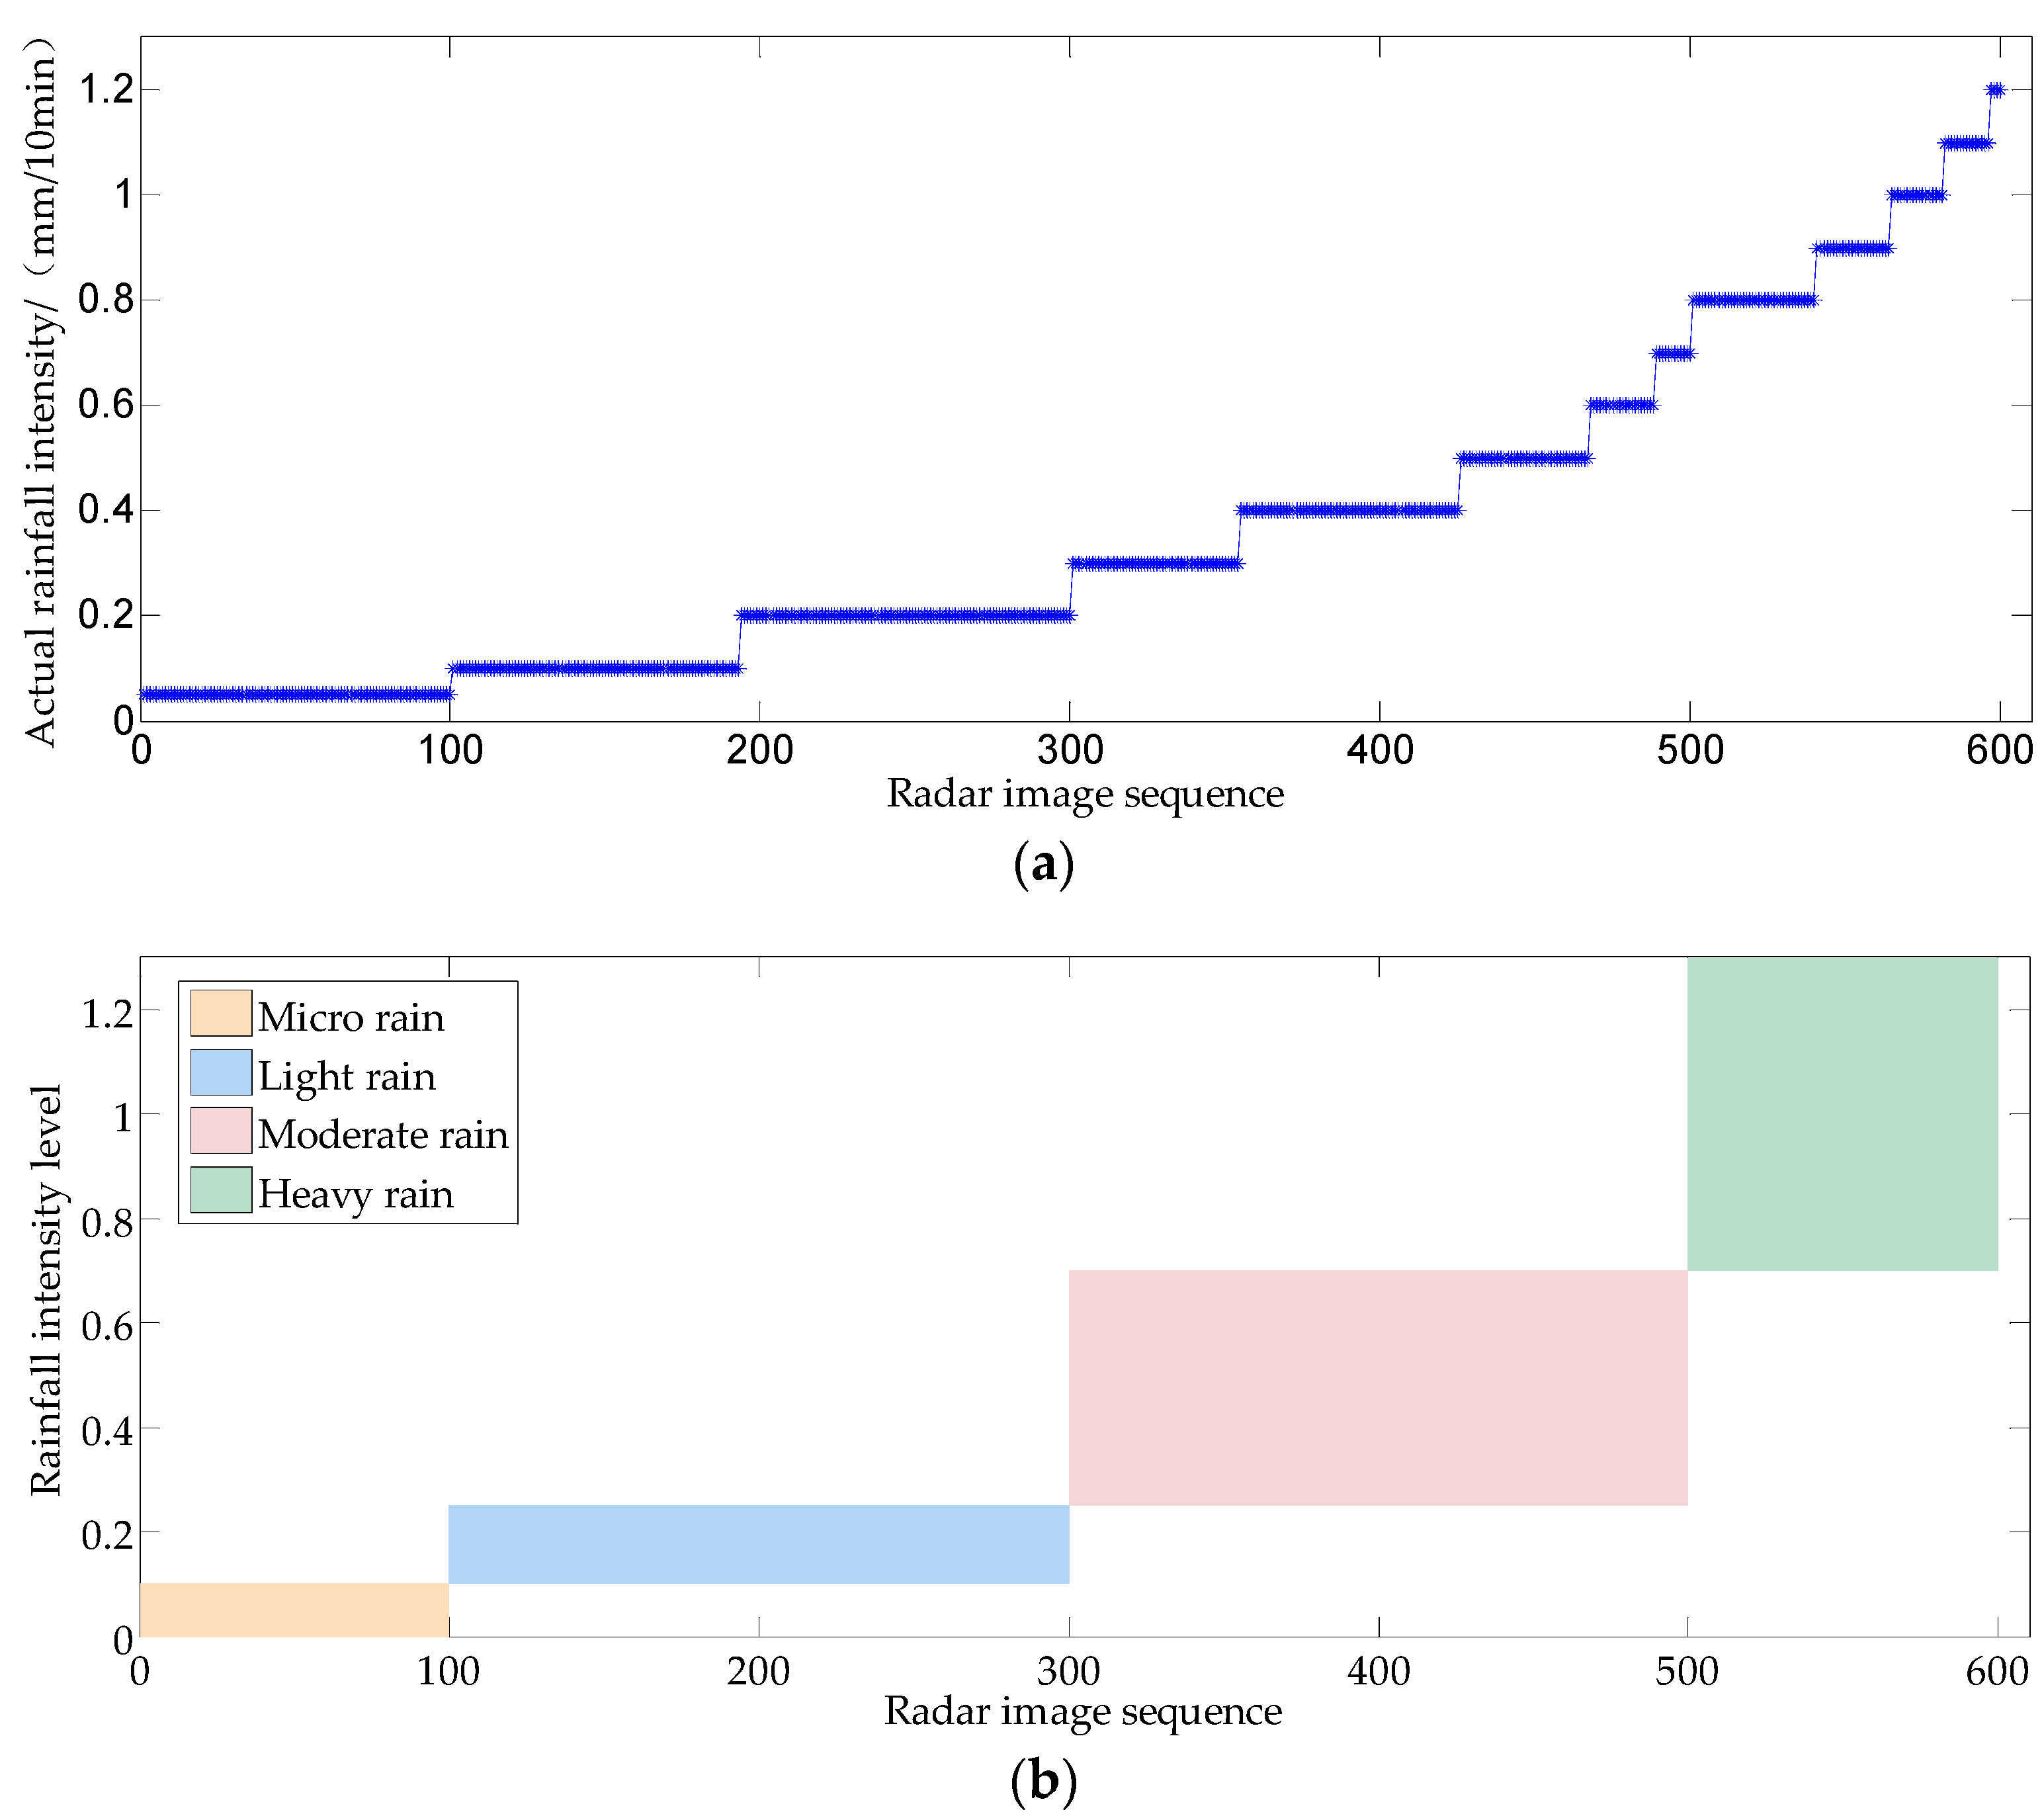
Generally, the rainfall intensity is divided into five levels: micro rain, light rain, moderate rain, heavy rain and torrential rain. The classification standard of rainfall intensity level is shown in Table 2.
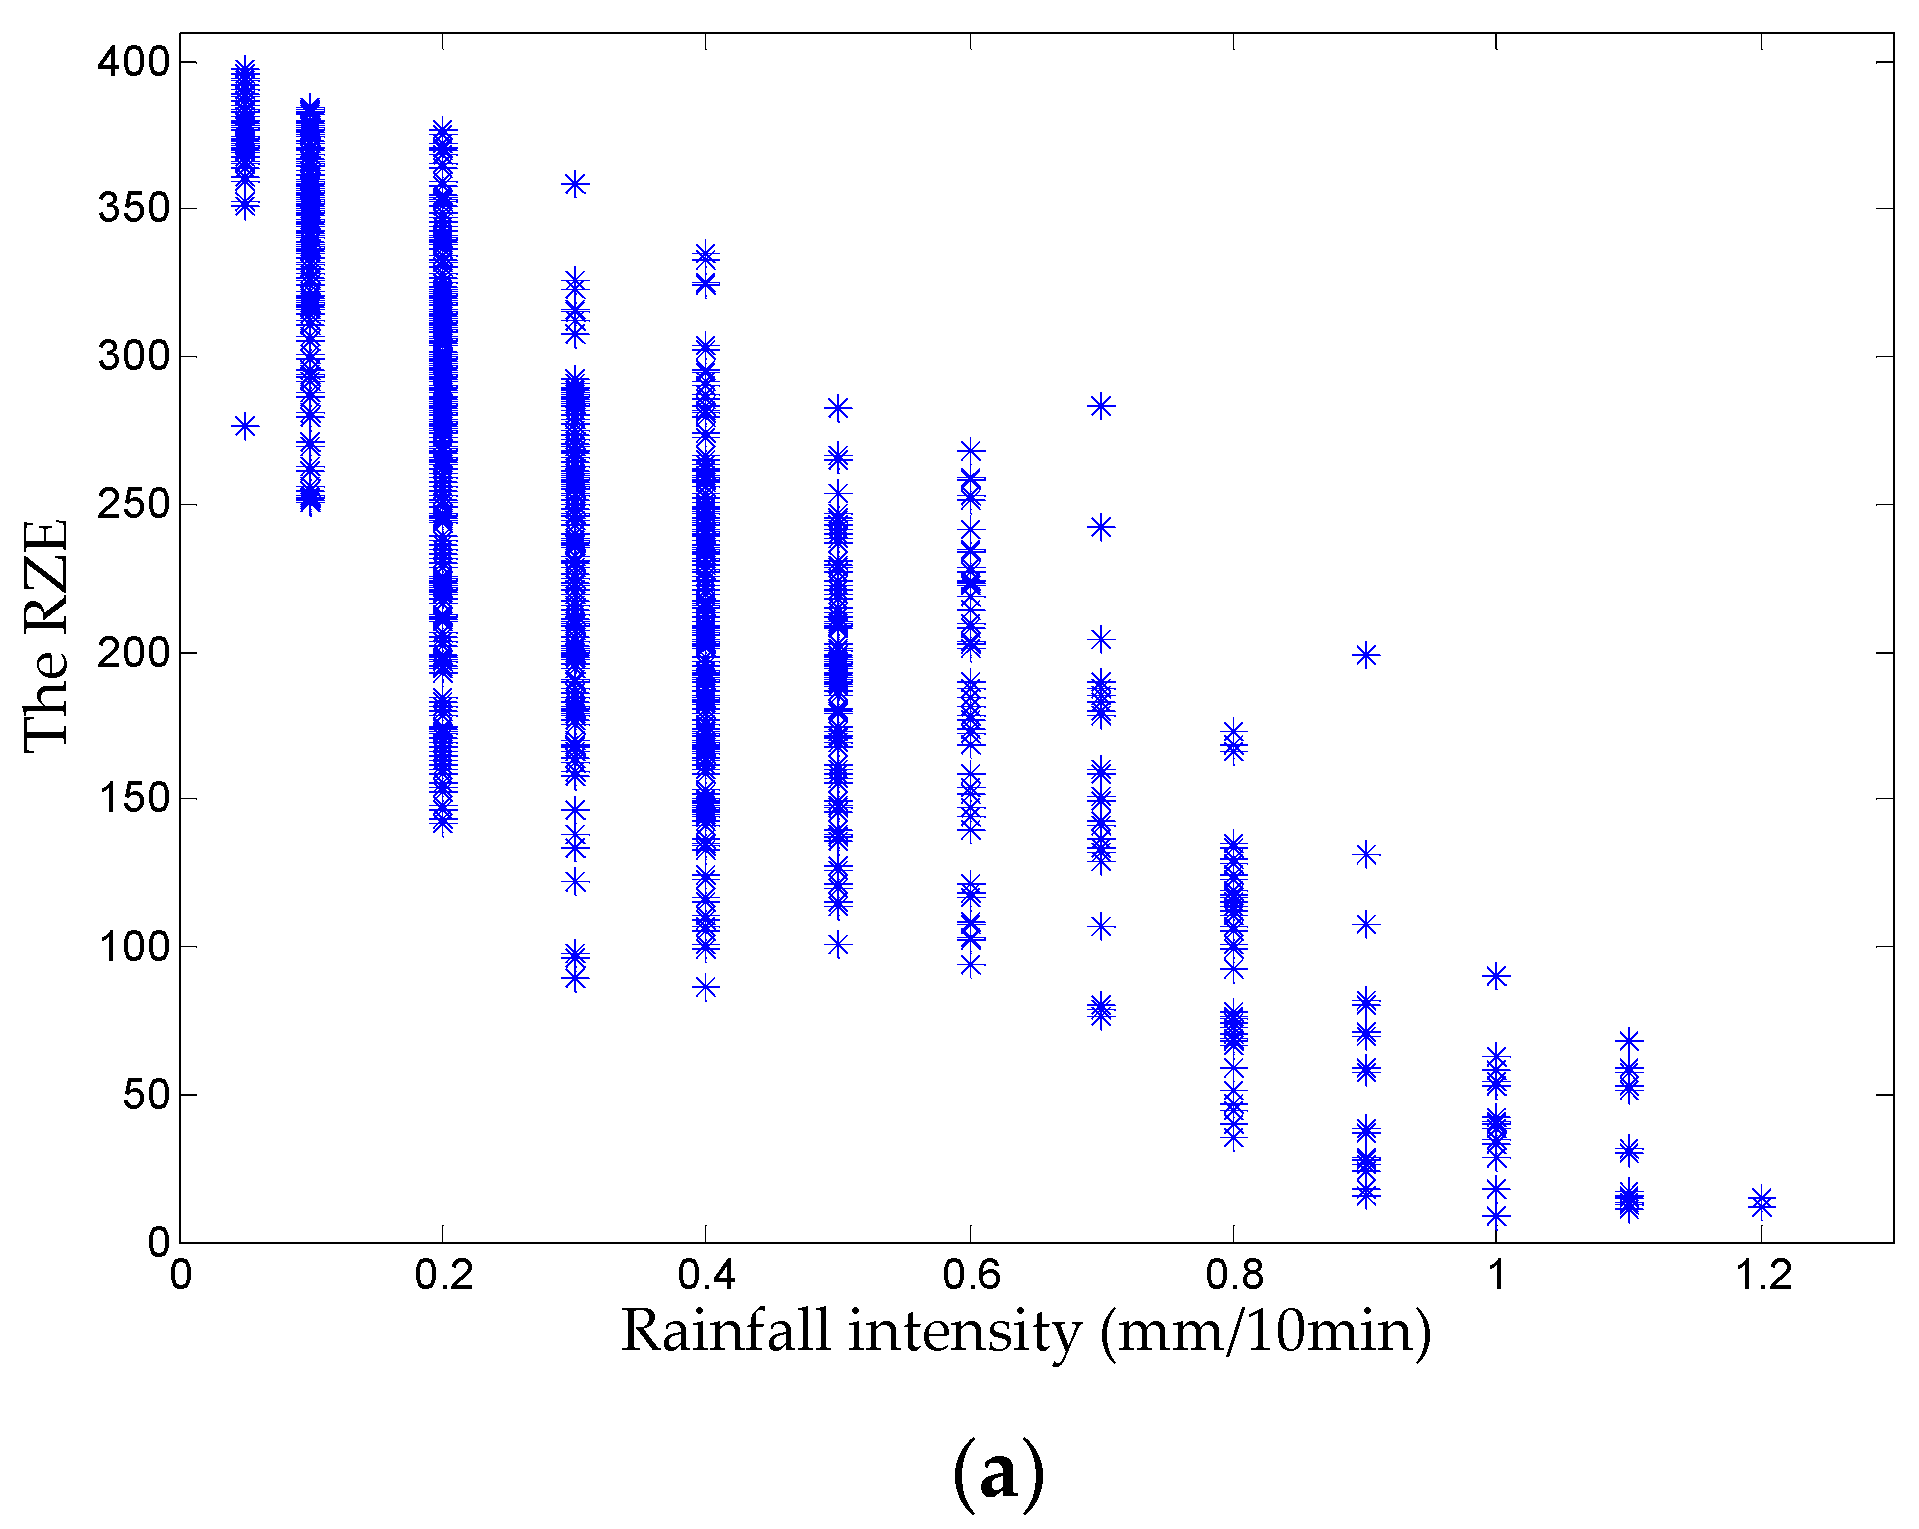
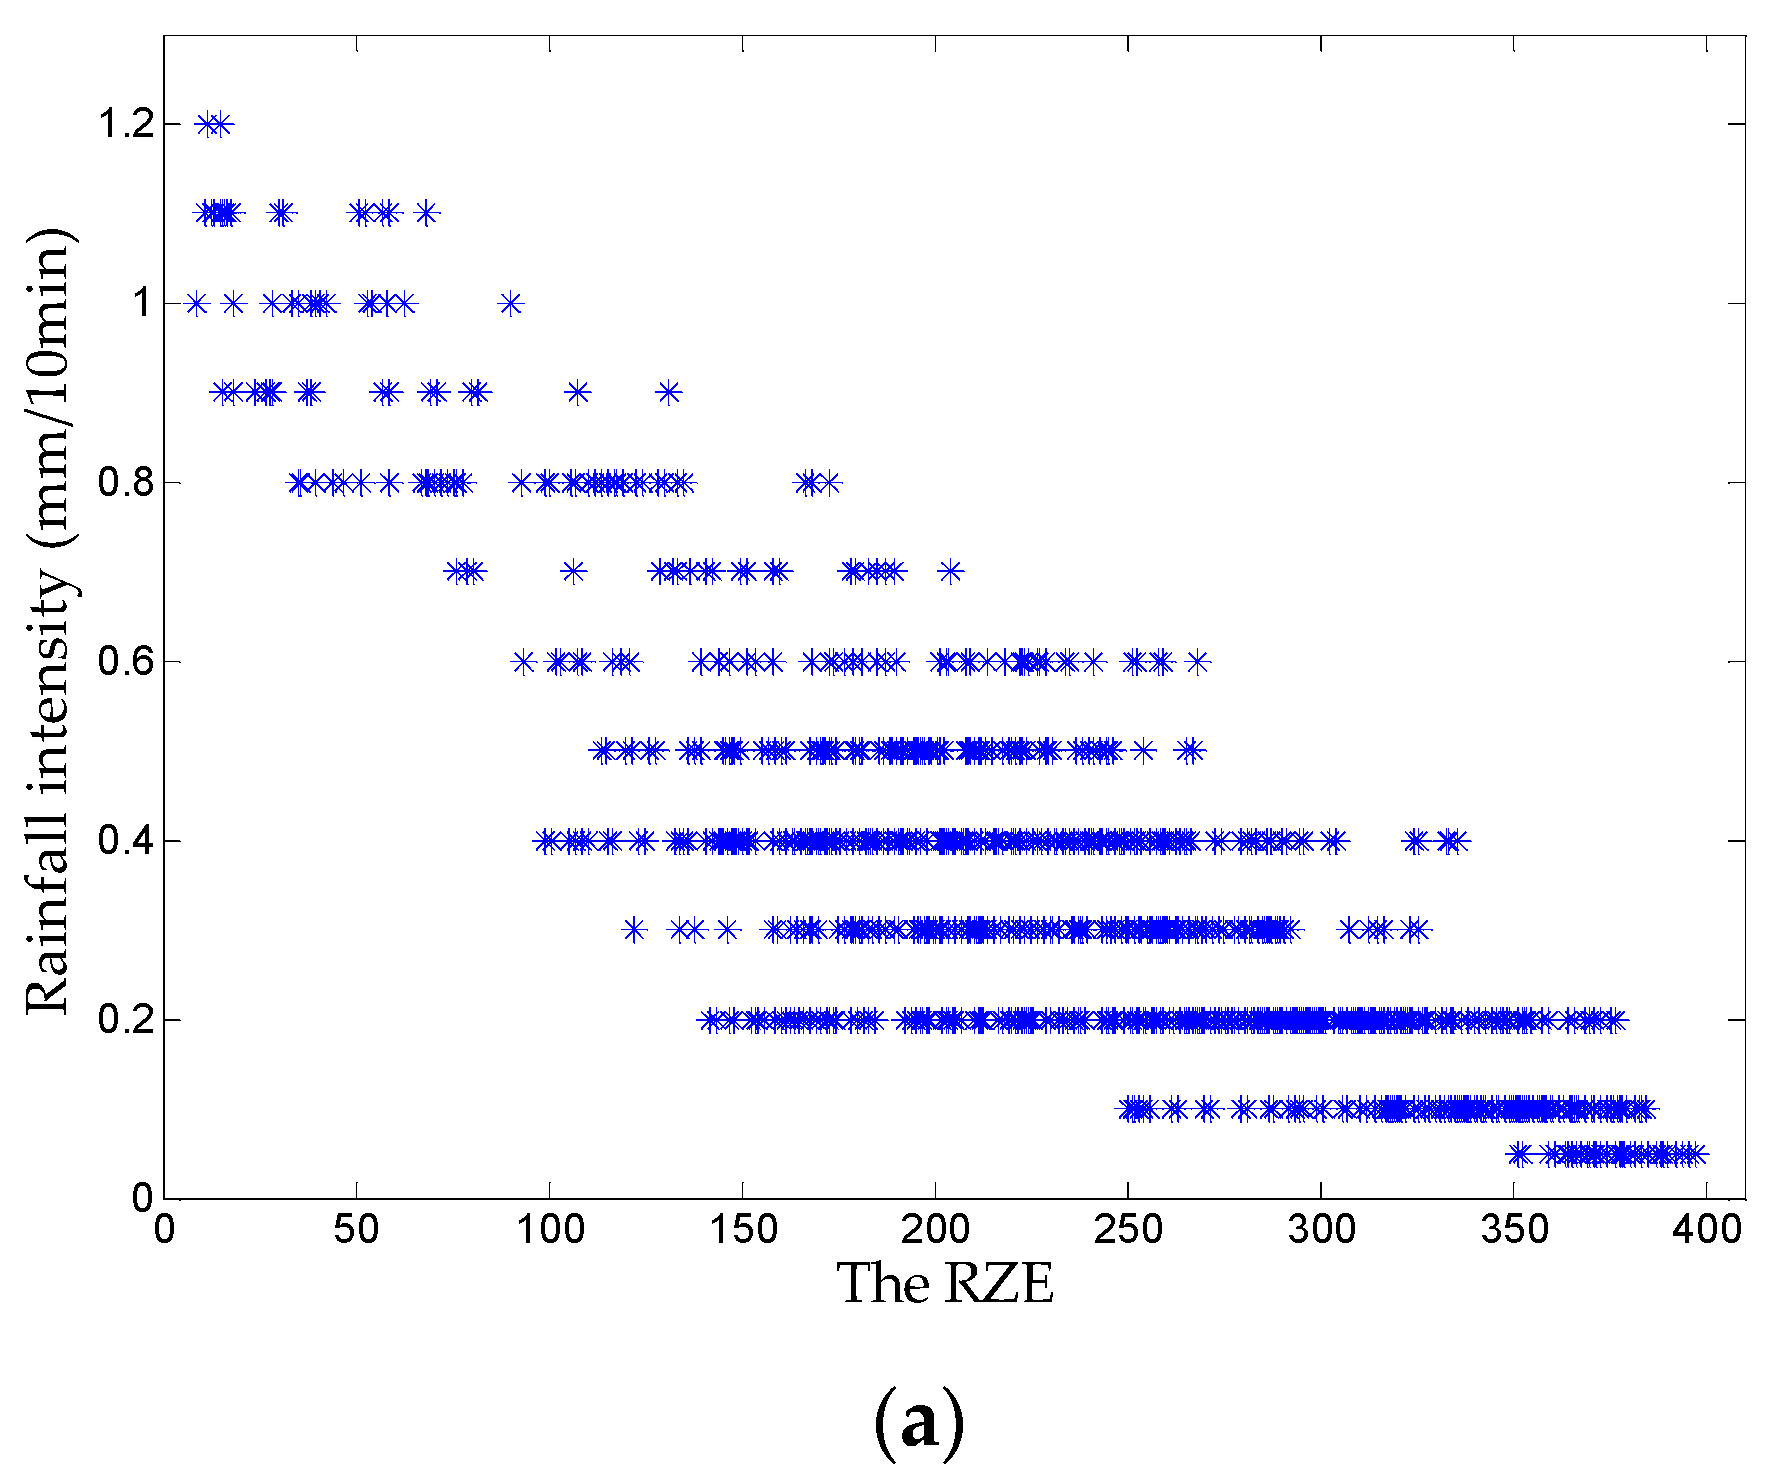
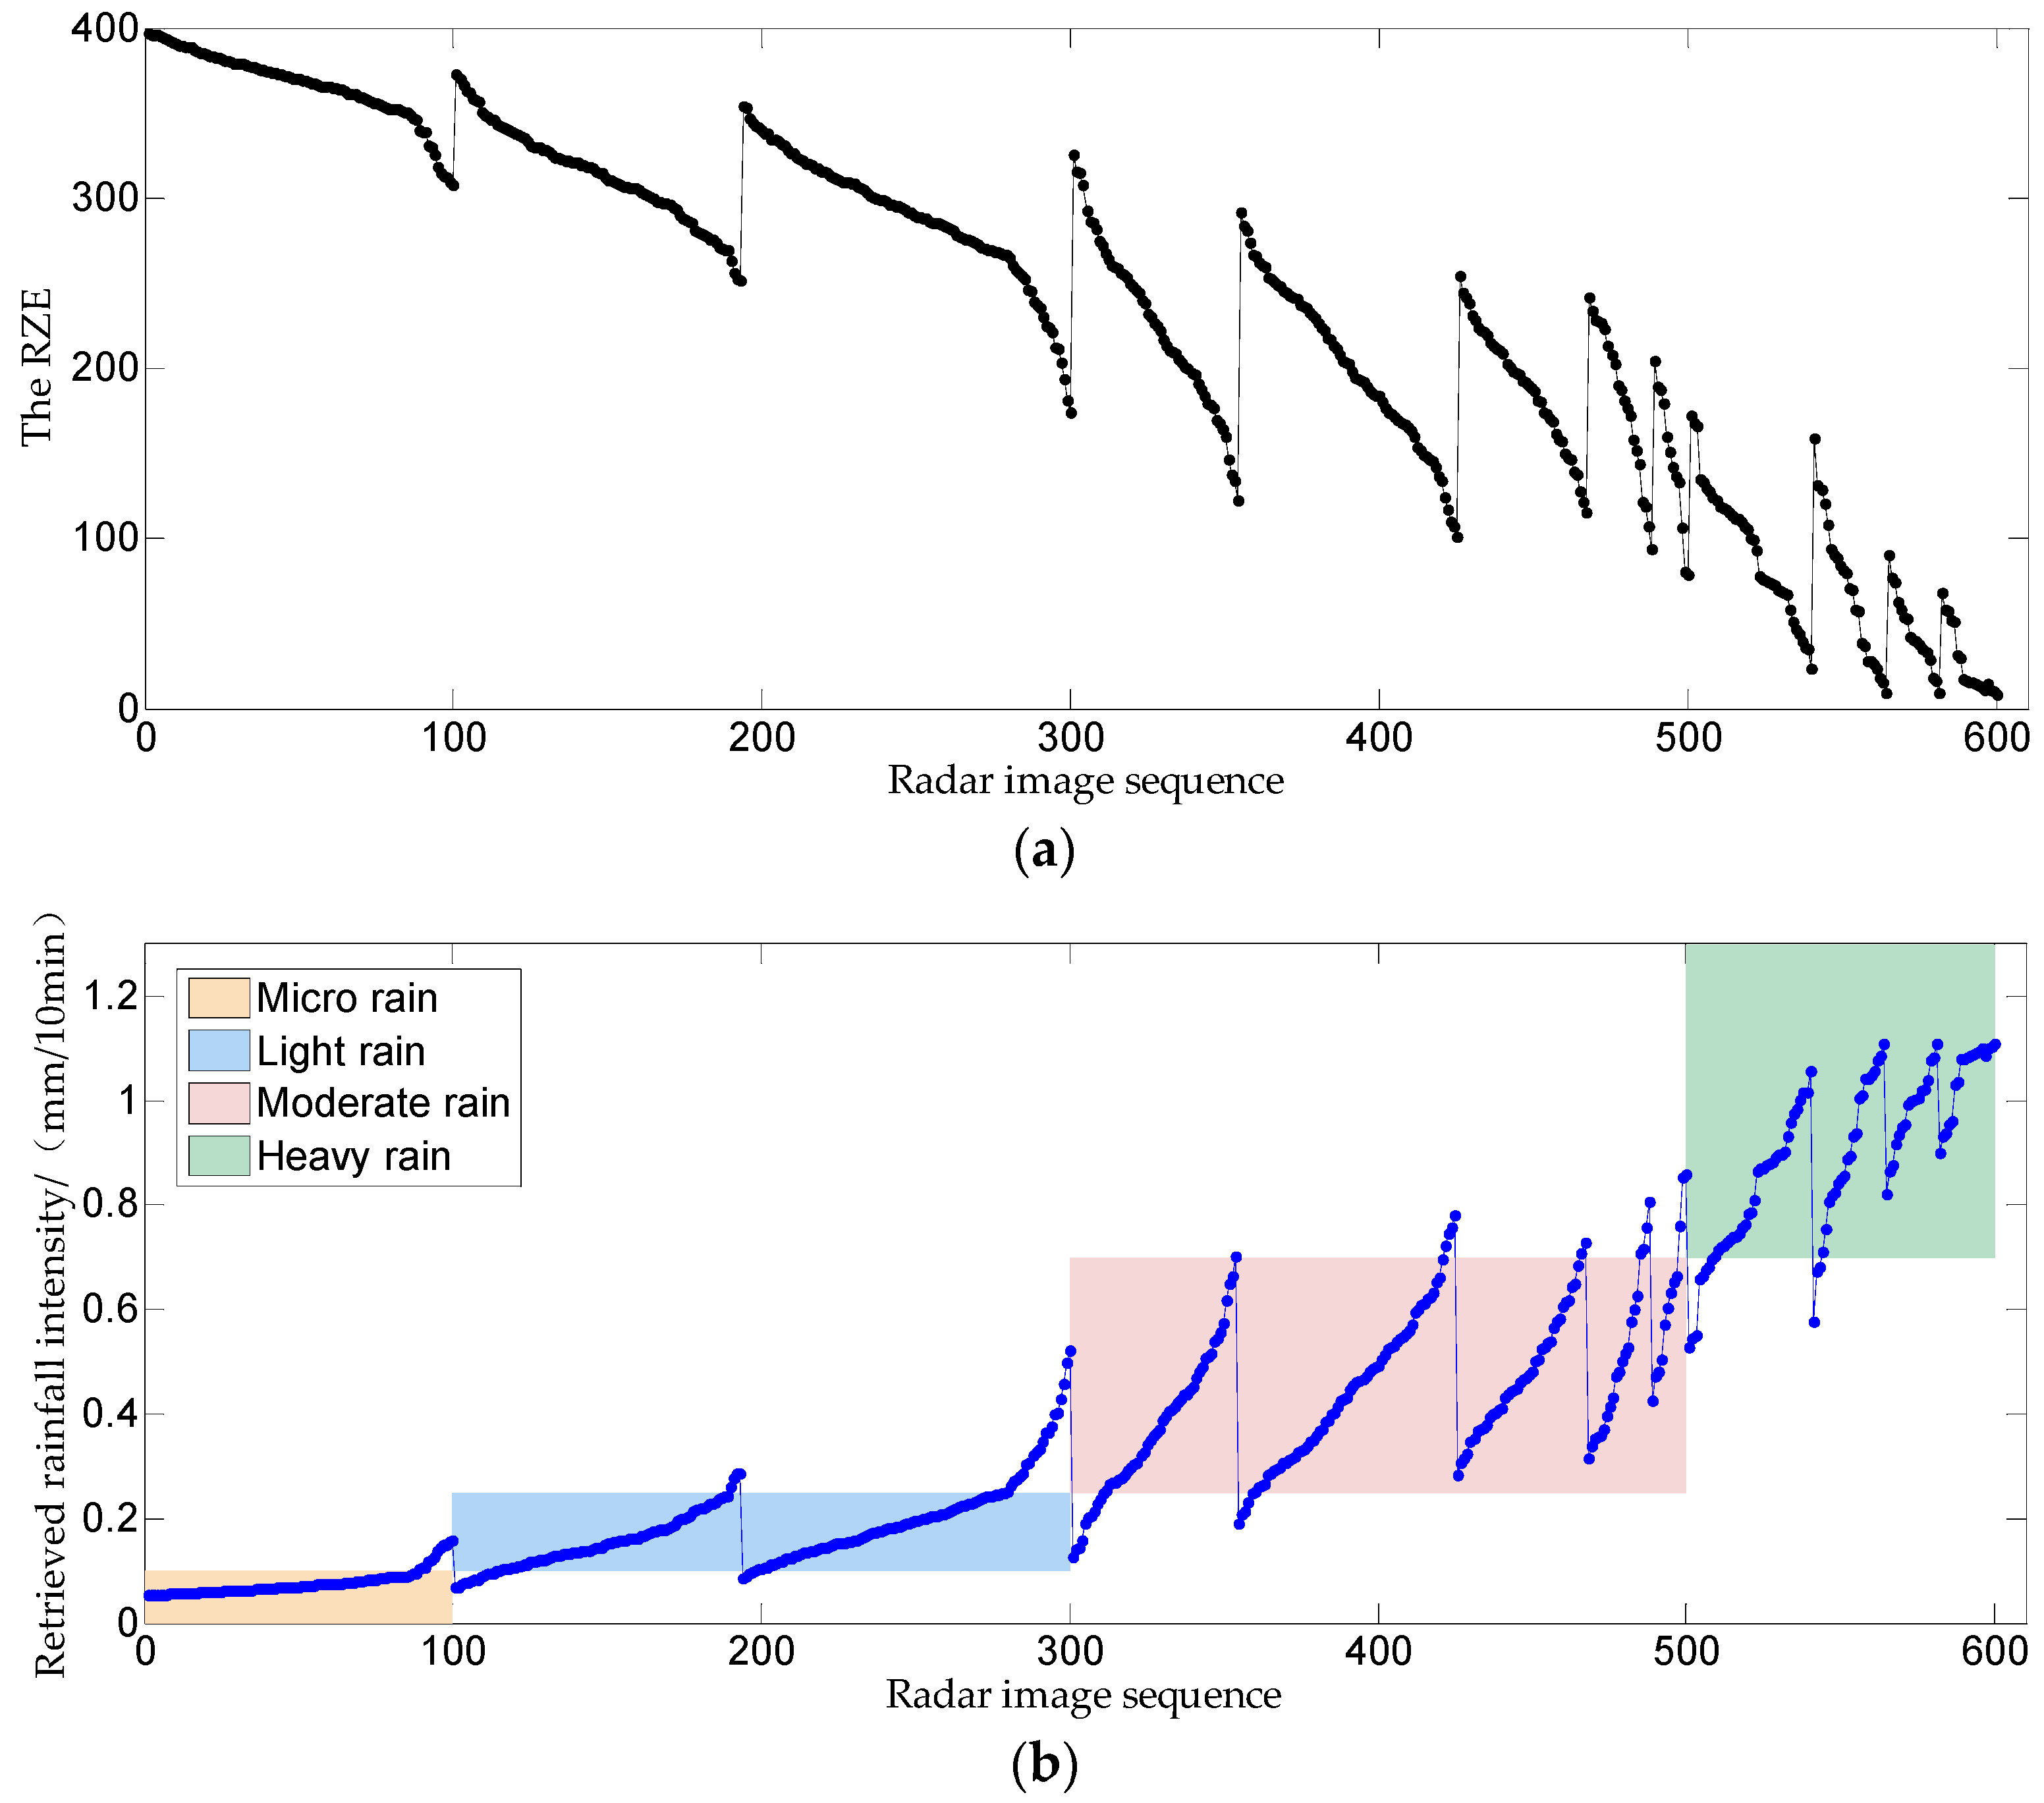
A large number of rain-contaminated radar images under different rainfall intensities are used to determine the fitting function of rainfall intensity level. A total of 1600 rain-contaminated radar images are selected. Among them, 1000 images are used to fit the function of rainfall intensity level and 600 images are used to verify the fitted function. The RZE parameters of the rain-contaminated radar images are calculated by the Equation (5), and the corresponding rainfall intensity is obtained by synchronous recording of the rain gauge. The relationship between RZE parameters and rainfall intensity is shown in 
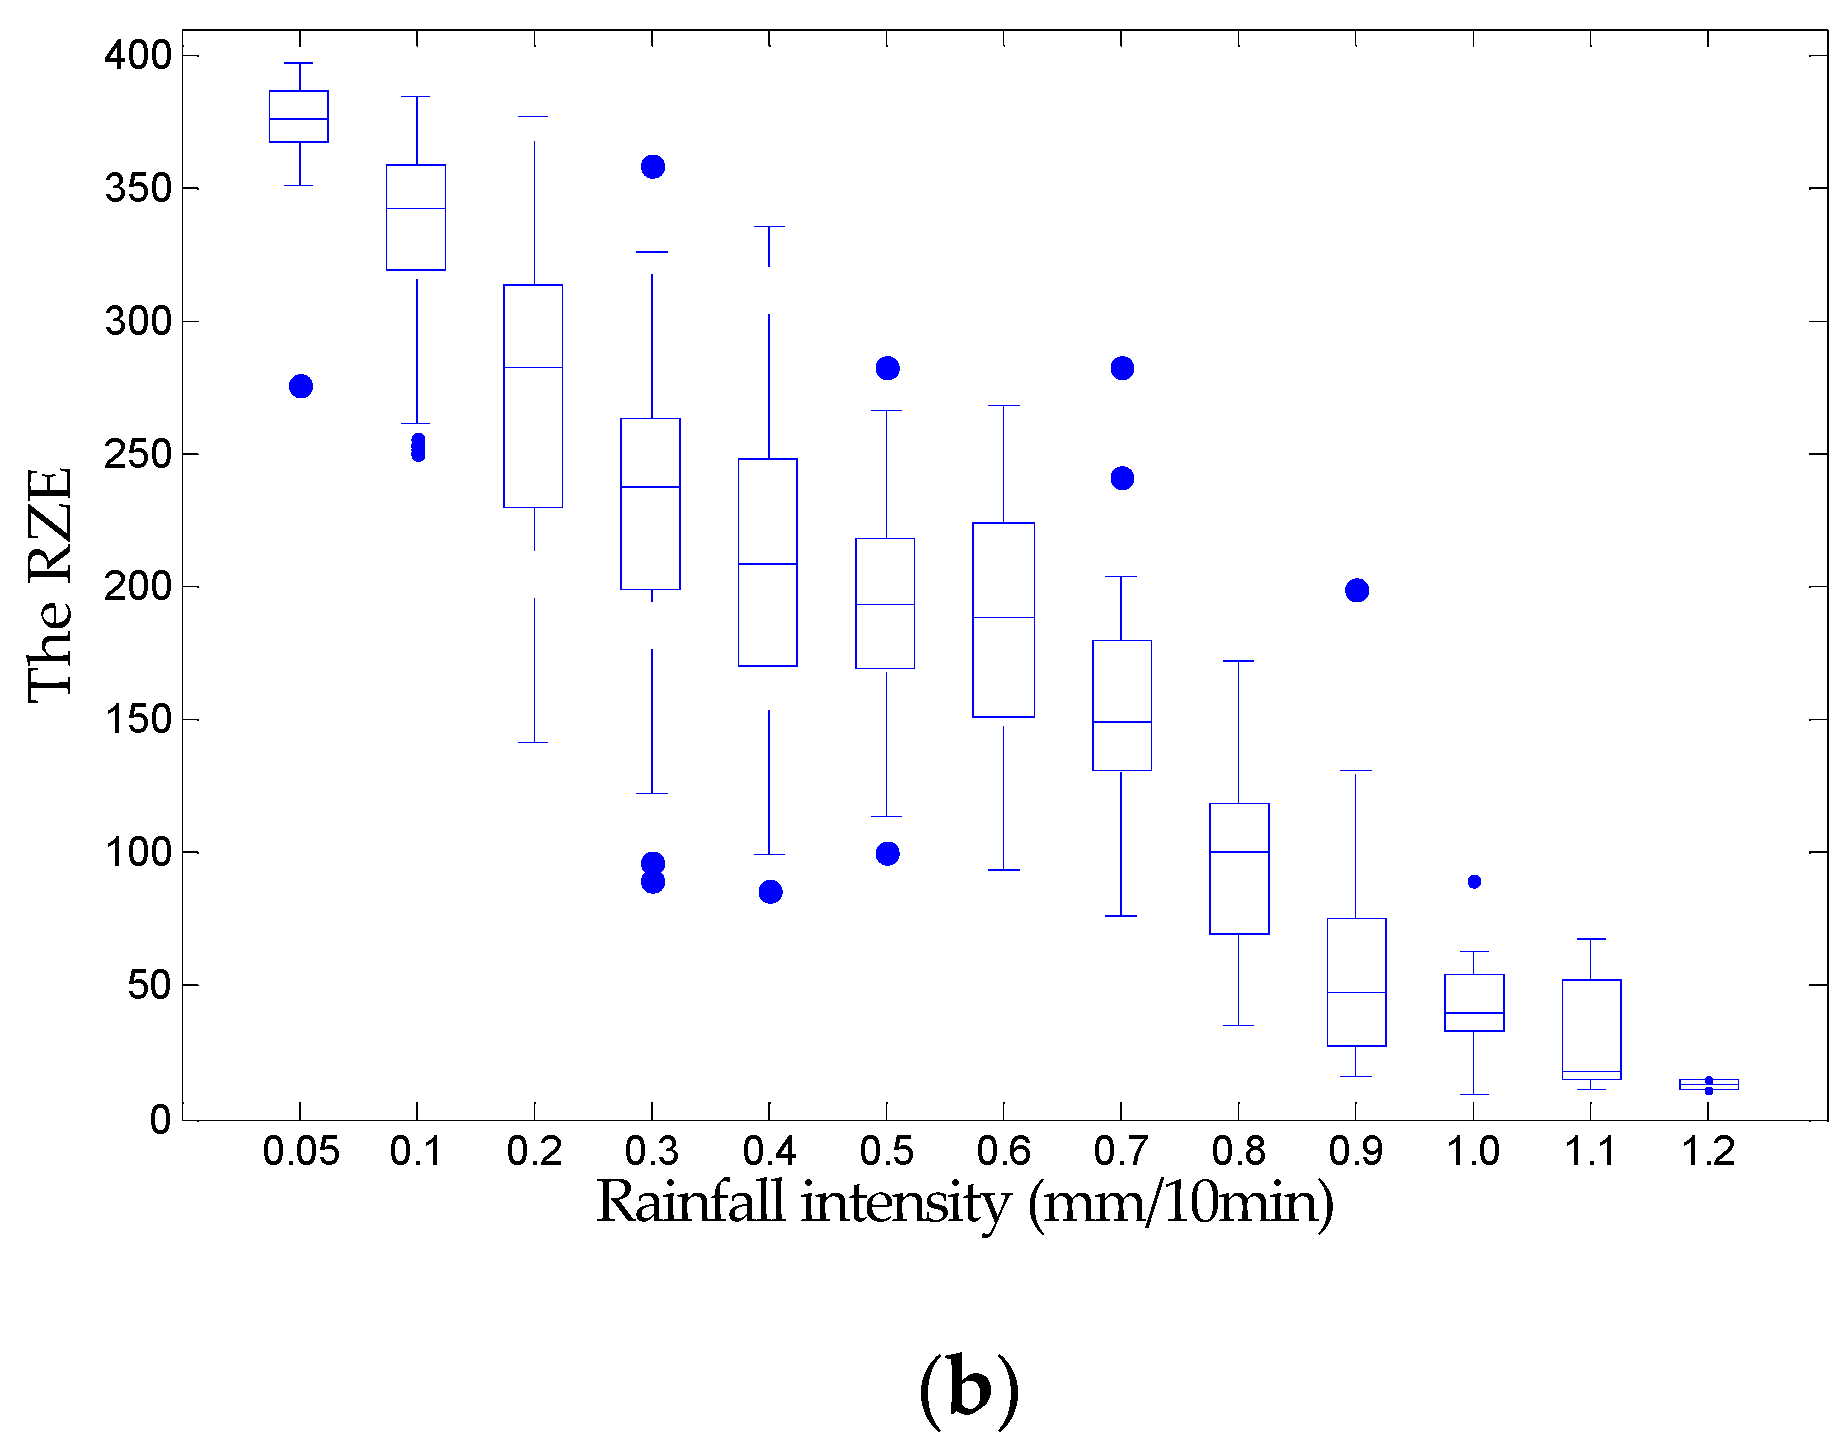
Figure 8a. It can be seen that the RZE parameters decrease with the increase of rainfall intensity. When the rainfall intensity increases to a certain value, the RZE parameters tend to saturation.
In order to visually describe the statistical law of the data under each rainfall intensities, the boxplot of Figure 8a is drawn. It can be seen from Figure 8b that the distribution of the RZE parameters is not regular under different rainfall intensities. However, the median value of the RZE parameters gradually decreases with the increase of rainfall intensity, and the overall trend is also gradually decreasing. In addition, these data values less than Q 1 1.5 I Q R or more than Q 3 + 1.5 I Q R in each group of boxes are defined as the outliers of this group of boxes, where Q 1 is the first quartile, that is, the first horizontal line from bottom to top of a box; Q 3 is the third quartile, that is, the first horizontal line from top to bottom of a box; I Q R is the quartile distance; and I Q R = Q 3 Q 1 .
The existence of these outliers may be caused by the deviation between the acquisition time of the radar image and the recording time of the rain gauge. Therefore, the outliers should be eliminated before the function of rainfall intensity level is fitted.
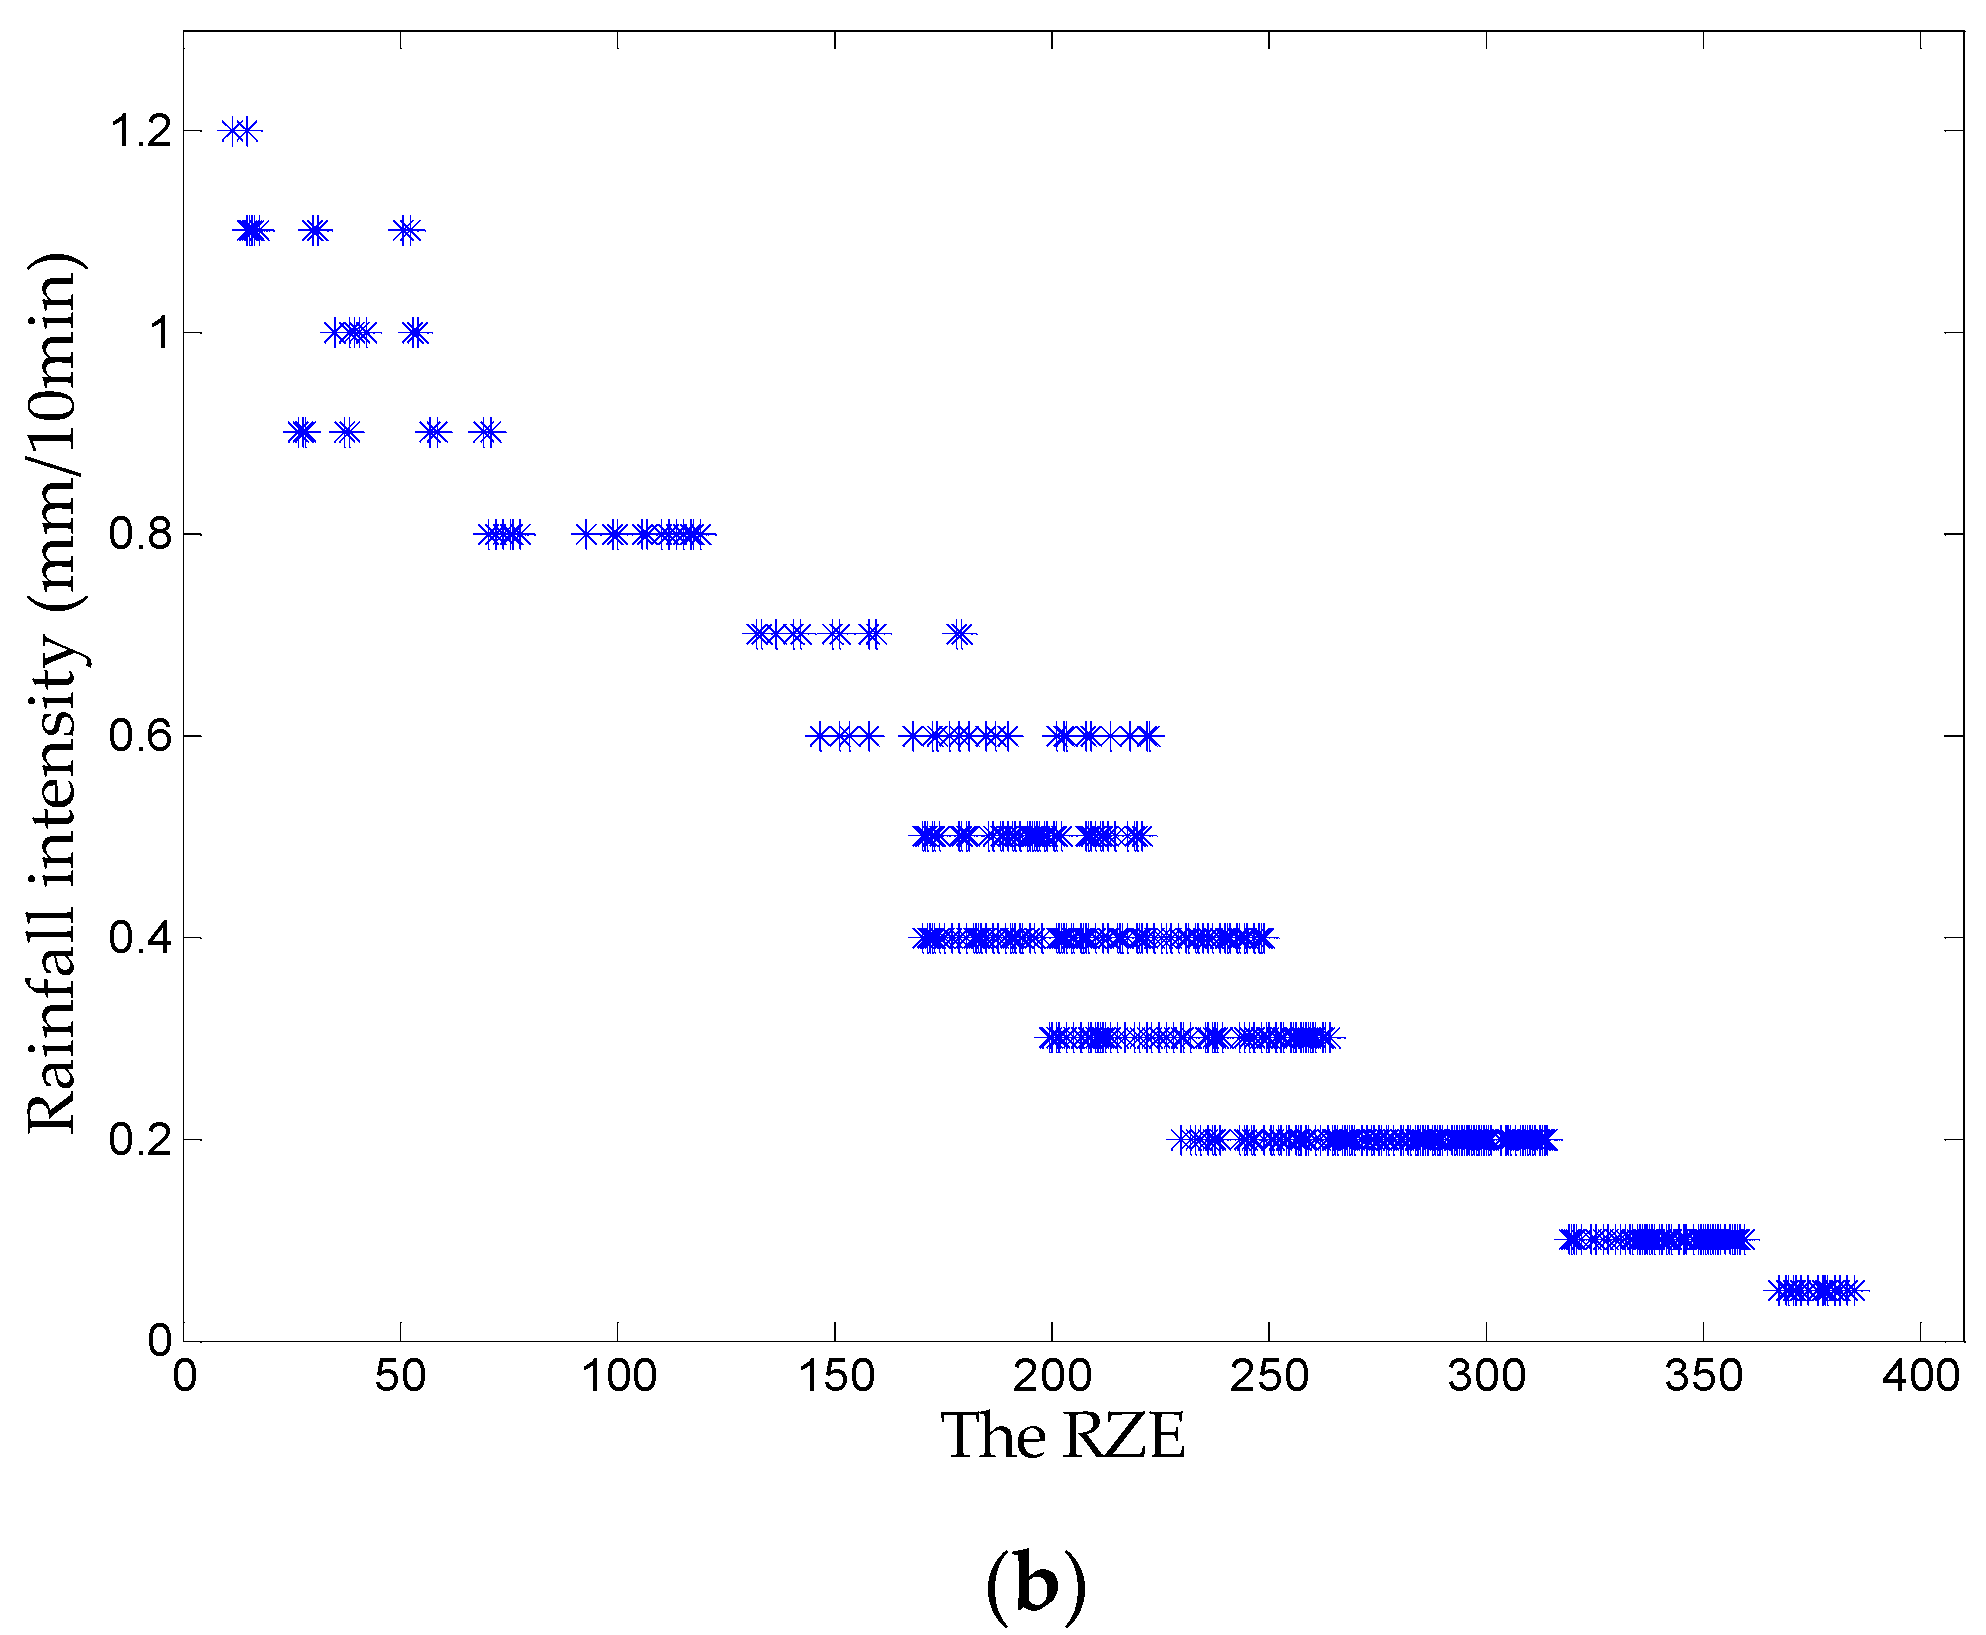
The scatterplot after removing the outliers is shown in Figure 9a, and the data points are distributed horizontally. The main reason is that the accuracy of the rain gauge recording rainfall is 0.1 mm, and multiple RZE parameters are recorded for each rainfall intensity. In addition, the data points for each rainfall intensity are not uniformly distributed and relatively concentrated near the median value. In order to increase the weight of the data near the median value and reduce the fitting error, the data near the median value are selected for each rainfall intensity. The selected 500 groups of data are shown in Figure 9b.
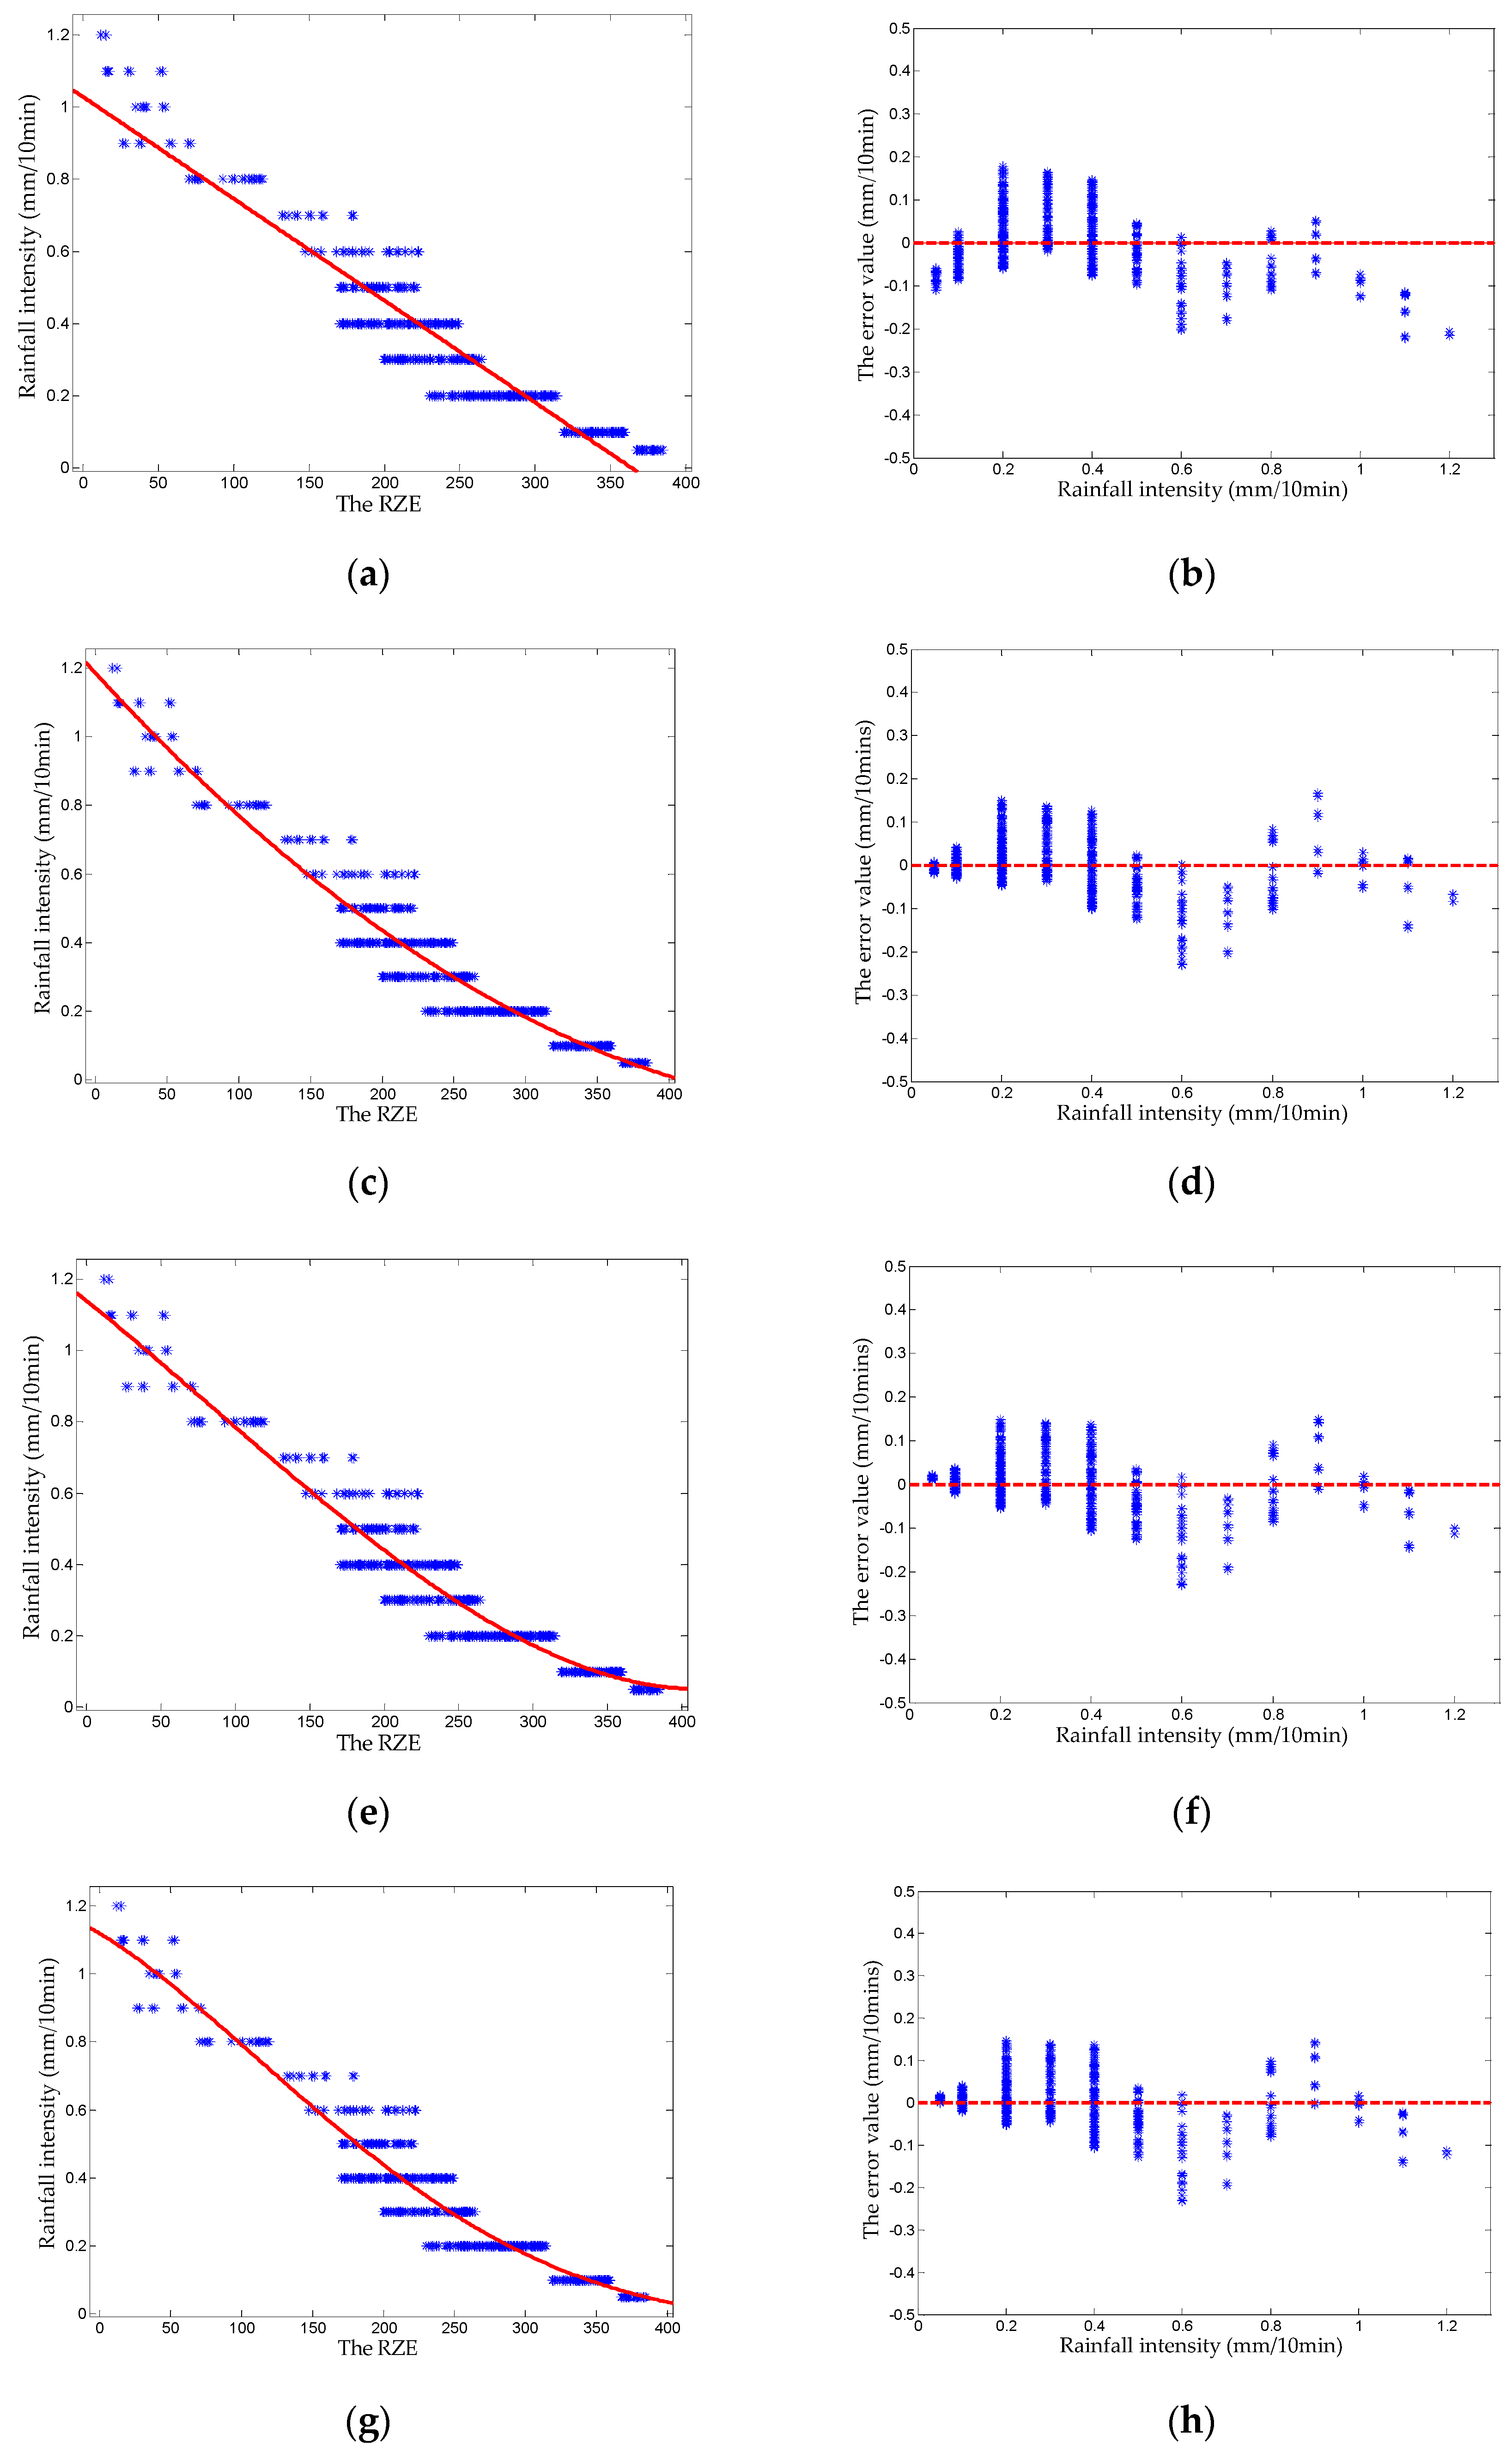
The selected 500 groups of data are fitted linearly by ordinary least squares, and the results of each fitting are statistically analyzed. In the fitting of each order function, the RZE parameters are substituted into the fitted function to obtain the theoretical value of rainfall intensity, and the fitting error of rainfall intensity is obtained by subtracting the theoretical value with the actual value of rainfall intensity.
Figure 10 shows the fitting function and error of each order. The accuracy of fitting can be improved with the increase of the function order, but over fitting will reduce the stability of the function. The error of the second order fitting function is much lower than that of the first order fitting function, especially when the rainfall intensity level is light rain or heavy rain. The error of the second order fitting function is basically in the range of −0.15–0.15 mm/10 min, but the error value is larger when the rainfall intensity level is moderate rain. The error of the third order fitting function is lower than that of the second order fitting function, especially when the rainfall intensity is greater than 0.9 mm/10 min, so the fitting accuracy of the third order function is higher. The error of the fourth order fitting function increases when the rainfall intensity is less than 0.1 mm/10 min and greater than 1.1 mm/10 min, which indicates that the fourth order function has over fitting phenomenon. Therefore, the third order fitting function is used as the fitting function for rainfall intensity level retrieval, and the fitting function is shown as
H = a 1 γ 3 + a 2 γ 2 + a 3 γ + a 4
{ a 1 = 1.123 × 10 0.8 a 2 = 2.839 × 10 0.6 a 3 = 0.003377 a 4 = 1.139
where a 1 , i = 1 , 2 , 3 , 4 are not fixed values with different selected radar image data, and the a 1 , i = 1 , 2 , 3 , 4 in this fitting is shown in Equation (9). γ is the RZE parameter value of the selected rain-contaminated radar image, and H is the value of rainfall intensity. The rainfall intensity level of the selected rain-contaminated radar image can be determined by Table 2.

5. Results and Analysis of Experiment

5.1. Rainfall Detection Results

Firstly, a randomly selected radar image is detected by the RZE method. The fan-shaped area (azimuth 50° to 100° and radial 80 points to 600 points) and the fan-shaped area (azimuth 150° to 200° and radial 80 points to 600 points) of the selected radar image are taken as the occlusion area and the wave area for rainfall detection, as shown in Figure 11.
The ZPP and μ of the occlusion area of the selected radar image are calculated as 46.15% and 0.3814 V, respectively, and the RZE calculated by the Equation (5) is 121.0015 ( V 1 ) . Since the RZE is lower than the threshold T determined in Section 4.1, the selected radar image is rain-contaminated radar image. The rainfall intensity automatically recorded by the rain gauge is 0.4 mm/10 min. Therefore, the result of rainfall detection is correct.
Additionally, the ZPP and μ of the wave area of the selected radar image are calculated as 34.12% and 0.4778 V, respectively, and the RZE calculated by the Equation (5) is 71.4106 ( V 1 ) . Since the RZE is lower than the threshold K determined in Section 4.1, the selected radar image is rain-contaminated radar image, and the result of rainfall detection is also correct.
Then, in order to further demonstrate the rainfall detection performance of the proposed method, the RZE method and the traditional ZPP method are studied together. The X-band marine radar collects a group of radar image sequence every 3 min, and each group of radar image sequences contains 32 radar images. The first radar image in each group of image sequences is selected for rainfall detection. A total of 360 radar images are selected, including 160 rain-free radar images and 200 rain-contaminated radar images, as shown in Figure 12. The blue solid line with stars denotes the rainfall intensity, and the unit of rainfall intensity is mm/10 min.
The rainfall detection results of the X-band marine radar images are shown in Figure 13. Figure 13a shows the performance of the traditional ZPP method for rainfall detection. The blue solid line denotes the curve trend of the calculated ZPP, and the selected area with green solid line denotes the radar image in the presence of rainfall. The red dotted line denotes the determined detection threshold proposed by Lund et al. Figure 13b shows the performance of the RZE method for rainfall detection. The blue solid line denotes the curve trend of the calculated RZE, and the selected area with green solid line denotes the radar image in the presence of rainfall. The red dotted line denotes the detection threshold of the RZE method, which is determined in Section 4.1.
It can be seen from Figure 13a,b that the blue curves of the two methods are almost lower than the detection threshold in the range of rainfall, which indicates that both methods have excellent rainfall detection performance. Among the 200 rain-contaminated radar images, 200 images are detected by the traditional ZPP method and 188 images are detected by the RZE method. The detection accuracy of the traditional ZPP method is slightly higher than that of the RZE method, and both methods meet the engineering requirements. In addition, among 160 rain-free radar images outside the green solid line, 106 images are detected by the traditional ZPP method and 160 images are detected by the RZE method. The detection accuracy of the RZE method is close to 100%, which is much higher than the traditional ZPP method. Therefore, the total detection accuracy of the RZE method is higher than that of the traditional ZPP method.
The detection threshold determined by the ZPP method is different with different radar systems. Based on the actual radar system, the detection threshold of the ZPP method is redefined and discussed. In Figure 13a, the yellow dotted line denotes that the detection threshold is set as 30%. Among the 360 radar images, 180 rain-contaminated radar images and 160 rain-free radar images are detected by the ZPP method, and the total accuracy is 94.4%. Therefore, the detection performance of the ZPP method with redefined threshold is higher than that of the traditional ZPP method with threshold set at 50%.
Figure 13c shows the rainfall detection results of the RZE method when the rainfall detection area is defined in the wave area. The blue solid line denotes the curve trend of the calculated RZE, and the selected area with green solid line denotes the radar image in the presence of rainfall. The red dotted line denotes the detection threshold K determined in Section 4.1, and the yellow dotted line denotes the calculated threshold Z when the threshold of the ZPP is set as 30%.
Among the 360 radar images, 200 rain-contaminated radar images and 108 rain-free radar images are detected under the detection threshold K, and 182 rain-contaminated radar images and 159 rain-free radar images are detected under the detection threshold Z. The total detection accuracies of the two thresholds are 85.6% and 94.7%, respectively, which is similar to the detection accuracy of the ZPP method, but the detection speed of the RZE method is faster. The reason is that the RZE parameter is 1 / μ times of the ZPP parameter when the detection area of the two parameters is defined in the same wave area. Therefore, the RZE method can also complete the task of rainfall detection when the detection area is defined in the wave area, but the detection performance of the RZE method in the wave area is far less than that in the occlusion area.
To better reflect the advantages of the RZE method for rainfall detection in the occlusion area, the performance of the RZE method and ZPP method are compared in Figure 14. The RZE method for rainfall detection in the wave area is not compared in Figure 14, because its detection performance is similar to the performance of the ZPP method. The horizontal coordinate denotes the radar image sequence, the left vertical coordinate denotes the rainfall intensity, and the right vertical coordinate denotes the rainfall detection results of three methods. The value of 1 denotes the radar image in the presence of rainfall, and the value of 0 denotes the radar image in the absence of rainfall. The blue solid line denotes the rainfall intensity, and the yellow, green and red solid lines denote the rainfall detection results of the ZPP method (50% threshold), the ZPP method (30% threshold) and the RZE method. It can be seen that rain-free images are detected as rain-contaminated images by the ZPP method (50% threshold) in radar image sequence of 69 to 120, and rain-contaminated images are detected as rain-free images by the ZPP method (30% threshold) in radar image sequence of 295 to 320. The RZE method has the highest accuracy of rainfall detection, so the proposed method has better rainfall detection performance than that of the ZPP method.
The detection results of the two methods are statistically analyzed, as shown in Table 3. The results show that the accuracy of the RZE method (occlusion area) is 11.7% higher than that of the traditional ZPP method (50% threshold) and 2.3% higher than that of the ZPP method (30% threshold). The accuracy of the RZE method (wave area and threshold K) is approximately equal to that of traditional ZPP method (50% threshold), and the accuracy of the RZE method (wave area and threshold Z) is approximately equal to that of ZPP method (30% threshold).

5.2. Rainfall Intensity Level Retrieval Results

The radar image detected as rainfall in Section 5.1 is used to determine the rainfall intensity level through the fitting function of the rainfall intensity obtained in Section 4.2. The RZE parameter calculated by the Equation (5) is substituted into the fitting function, and the theoretical value of rainfall intensity is 0.4411 mm/10 min. According to Table 2, the rainfall intensity level is moderate rain, which is consistent with the actual rainfall intensity measured by the rain gauge. Therefore, the result of the rainfall intensity level retrieval by the fitting function is correct.
In order to further verify the performance of the rainfall intensity level retrieval, a total of 600 rain-contaminated radar images are selected for experiments. Among them, due to the lack of data of micro rain and heavy rain, 100 radar images are selected by the two classification standards, respectively. The data of light rain and moderate rain are relatively large, and 200 radar images are selected by the two classification standards, respectively. The actual rainfall intensity of 600 rain-contaminated radar images is shown in Figure 15a.
As the measurement accuracy of the rain gauge is 0.1 mm, the actual rainfall intensity measured by the rain gauge can produce a certain range of error. According to Table 2, the actual rainfall intensity is divided into four levels: micro rain, light rain, moderate rain and heavy rain, which can better verify the accuracy of the rainfall intensity calculated by the fitting function, as shown in Figure 15b.
Figure 16a shows the RZE value of 600 selected rain-contaminated radar images calculated by the Equation (5), and the corresponding value of the rainfall intensity calculated by the fitting function is shown in Figure 16b. It can be seen that the retrieval data of the rainfall intensity level in the color classification area is correct, and the retrieval data outside the color classification area is incorrect.
The statistical results of the rainfall intensity level are shown in Table 4. When the rainfall intensity level is light rain, the rainfall in the occlusion area of the radar image is unstable and the rainfall distribution is uneven, which makes the accuracy of rainfall intensity retrieval low. When the rainfall intensity level is moderate rain or heavy rain, the occlusion area of the radar image is seriously disturbed by rainfall and the brightness changes greatly, which makes the accuracy of rainfall intensity retrieval higher.
In addition, due to the interference of the ocean wave echo in the wave area, the rainfall intensity fitting function cannot be determined by statistical analysis method. Therefore, the RZE method for rainfall intensity level retrieval in the wave area needs to be further studied in future work.

6. Conclusions

Currently, the ZPP method is the most widely used method for rainfall detection in X-band marine radar images. However, the ZPP method has many disadvantages, such as difficult threshold selection, low detection accuracy and random interference of wave echo in the detection area. Therefore, many new methods of rainfall detection have been being proposed by researchers.
In this article, the RZE method for rainfall detection in the occlusion area of the X-band marine radar images is proposed. The RZE method is a combination parameter method, which determines the detection threshold by statistical analysis of a large number of radar image data. Additionally, when the rainfall detection area is defined in the wave area of the radar image, the RZE method also completes the task of rainfall detection. In addition, it is proposed for the first time to retrieve the rainfall intensity level from X-band marine radar images. The radar images detected as rainfall are determined by the RZE method, and the retrieval result is compared with the actual rainfall intensity measured by the rain gauge to verify the effectiveness of the proposed method. The experimental results show that the RZE method not only has better rainfall detection performance compared to the ZPP method, but also can effectively retrieve rainfall intensity level from X-band marine radar images.
Although the RZE method can effectively detect rainfall, it should be noted that the detection accuracy of the proposed method should be further investigated and improved when the detection area is defined in the wave area of the radar image. In addition, when the RZE method is used to retrieve rainfall intensity level, the relationship between the raindrop size and the radar echo is not considered. Moreover, the error exists in the verification of the retrieved rainfall intensity results in this paper, since the rainfall measurement methods of the rain gauge and the radar are different. In the future, the data collected from different sea areas and other radar systems should be used to further verify the applicability of the proposed method.

Author Contributions

Conceptualization, Z.L. and L.S.; methodology, L.S.; software, L.S.; validation, Z.L., L.S. and Y.Z.; formal analysis, L.S.; resources, Z.L.; writing—original draft preparation, L.S.; writing—review and editing, Z.L.; project administration, Z.L.; funding acquisition, Z.L. All authors have read and agreed to the published version of the manuscript.

Funding

This research was funded by the Natural Science Foundation of Jiangsu Province of China, grant number BK20180988, the National Natural Science Foundation of China, grant number 41906154.

Institutional Review Board Statement

Not applicable.

Informed Consent Statement

Not applicable.

Data Availability Statement

The data presented in this study are available on request from the corresponding author. The data are not publicly available due to privacy.

Conflicts of Interest

The authors declare no conflict of interest.

References

  1. Nieto-Borge, J.C.; Hessner, K.; Jarabo-Amores, P.; MataMoya, D. Signal-to-noise ratio analysis to estimate ocean wave heights from X-band marine radar image time series. IET Radar Sonar Navig. 2008, 2, 35–41. [Google Scholar] [CrossRef] [Green Version]
  2. Huang, W.; Liu, X.; Gill, E. Ocean wind and wave measurements using X-band marine radar: A comprehensive review. Remote Sens. 2017, 9, 1261. [Google Scholar] [CrossRef] [Green Version]
  3. Huang, W.; Carrasco, R.; Shen, C.; Gill, E.; Horstmann, J. Surface Current Measurements Using X-Band Marine Radar With Vertical Polarization. IEEE Trans. Geosci. Remote Sens. 2016, 54, 2988–2997. [Google Scholar] [CrossRef]
  4. Wei, Y.; Zhang, J.-K.; Lu, Z. A novel successive cancellation method to retrieve sea wave components from spatio-temporal remote sensing image sequences. Remote Sens. 2016, 8, 607. [Google Scholar] [CrossRef] [Green Version]
  5. Shen, J.; Li, Y.; Dai, Y.; Lu, Z. Research on co-channel interference suppression algorithm for X-band radar images. J. Instrum. 2011, 32, 1–3. [Google Scholar]
  6. Liu, R.; Fan, H.; Xiao, H. Labeled Multi-Bernoulli Filter Joint Detection and Tracking of Radar Targets. Appl. Sci. 2019, 9, 4187. [Google Scholar] [CrossRef] [Green Version]
  7. Chen, Z.; He, B.; Zhang, B.; Ma, Y. A method to correct the influence of rain on X-band marine radar image. IEEE Access 2017, 5, 25576–25583. [Google Scholar] [CrossRef]
  8. Wael, G.; Allan, B.; Marvin, L.; Christian, S.; Annette, M. Rain Microstructure Parameters Vary with Large-Scale Weather Conditions in Lausanne, Switzerland. Remote Sens. 2018, 10, 811. [Google Scholar]
  9. Contreras, R.F.; Plant, W.J. Surface effect of rain on microwave backscatter from the ocean: Measurements and modeling. J. Geophys. Res. Ocean. 2006, 111, 1–18. [Google Scholar] [CrossRef] [Green Version]
  10. Chen, Z.; He, B.; Zhang, B.; Qiu, Z.; Yin, B. A new algorithm to retrieve wave parameters from marine X-band radar image sequences. IEEE Access 2014, 52, 4083–4091. [Google Scholar]
  11. Wang, H.; Qiu, H.; Zhi, P.; Wang, L.; Chen, W.; Akhtar, R.; Raja, M. Study of Algorithms for Wind Direction Retrieval from X-Band Marine Radar Images. Electronics 2019, 8, 764. [Google Scholar] [CrossRef] [Green Version]
  12. Liu, X.; Huang, W.; Gill, E. Wind direction estimation from rain-contaminated marine radar data using the ensemble empirical mode decomposition method. IEEE Trans. Geosci. Remote Sens. 2017, 55, 1833–1841. [Google Scholar] [CrossRef]
  13. Chen, X.; Huang, W. Identification of Rain and Low-Backscatter Regions in X-Band Marine Radar Images: An Unsupervised Approach. IEEE Trans. Geosci. Remote Sens. 2020, 58, 4225–4236. [Google Scholar] [CrossRef]
  14. Hao, Y.; Tang, Y.; Lu, Z. Analysis and processing of rainfall observation data in Marine radar wave measuring system. Remote Sens. Technol. Appl. 2008, 23, 125–129. [Google Scholar]
  15. Shen, J.; Li, Y.; Dai, Y.; Wang, S. Identificantion and suppression of rain interference on X-band radar images. Opt. Precis. Eng. 2012, 20, 1846–1853. [Google Scholar] [CrossRef]
  16. Lund, B.; Graber, H.C.; Romeiser, R. Wind retrieval from shipborne nautical X-band radar data. IEEE Trans. Geosci. Remote Sens. 2012, 50, 3800–3811. [Google Scholar] [CrossRef]
  17. Liu, Y.; Huang, W.; Gill, E.; Peters, D.; Vicen-Bueno, R. Comparison of algorithms for wind parameters extraction from shipborne X-band marine. IEEE J. Sel. Top. Appl. Earth Obs. Remote Sens. 2015, 8, 896–906. [Google Scholar] [CrossRef]
  18. Wang, Y.; Huang, W. An algorithm for wind direction retrieval from X-band marine radar images. IEEE Geosci. Remote Sens. Lett. 2016, 13, 252–256. [Google Scholar] [CrossRef]
  19. Liu, X.; Huang, W.; Gill, E. Wave height estimation from shipborne X-band nautical radar images. J. Sens. 2016, 2016, 1–7. [Google Scholar] [CrossRef]
  20. Huang, W.; Liu, X.; Gill, E. An empirical mode decomposition method for sea surface wind measurements from X-band nautical radar data. IEEE Trans. Geosci. Remote Sens. 2017, 55, 6218–6227. [Google Scholar] [CrossRef]
  21. Chen, X.; Huang, W.; Zhao, C.; Tian, Y. Rain detection from X-band marine radar images: A support vector machine-based approach. IEEE Trans. Geosci. Remote Sens. 2019, 58, 2115–2123. [Google Scholar] [CrossRef]
  22. Zheng, Y.; Shi, Z.; Lu, Z.; Ma, W. A Method for Detecting Rainfall from X-Band Marine Radar Images. IEEE Access 2020, 8, 19046–19057. [Google Scholar] [CrossRef]
  23. Huang, C.; Zheng, X.; Tait, A.; Dai, Y.; Yang, C.; Chen, Z.; Li, T.; Wang, Z. On using smoothing spline and residual correction to fuse rain gauge observations and remote sensing date. J. Hydrol. 2014, 508, 410–417. [Google Scholar] [CrossRef]
  24. Tokay, A.; Hartmann, P.; Battaglia, A.; Gage, K.; Clark, W.; Williams, C. A Field Study of Reflectivity and Z-R Relations Using Vertically Pointing Radars and Disdrometers. J. Atmos. Ocean. Technol. 2008, 26, 1120–1134. [Google Scholar] [CrossRef]
  25. Mazari, N.; Sharif, H.; Xie, H.; Tekeli, A.; Zeitler, J.; Habib, E. Rainfall observations and assessment using vertically pointing radar and X-band radar. J. Hydroinf. 2017, 19, 2017151. [Google Scholar] [CrossRef]
  26. Oh, S.; Kollias, P.; Lee, J.; Lee, S.; Lee, Y.; Jeong, J. Rain-rate estimation algorithm using signal attenuation of Ka-band cloud radar. Meteorol. Appl. 2020, 27, 1–13. [Google Scholar] [CrossRef] [Green Version]
  27. Xie, Y.; Li, N. Study on the algorithm to retrieve precipitation based on three-layer structures with X-band synthetic aperture radar. J. Appl. Remote Sens. 2019, 13, 034524. [Google Scholar] [CrossRef]
  28. Zhang, C.; Wang, H.; Zeng, J.; Ma, L.; Guan, L. Short-Term Dynamic Radar Quantitative Precipitation Estimation Based on Wavelet Transform and Support Vector Machine. J. Meteorol. Res. 2020, 34, 228–241. [Google Scholar] [CrossRef]
  29. Tian, W.; Yi, L.; Liu, W.; Huang, W.; Ma, G.; Zhang, Y. Ground radar precipitation estimation with deep learning approaches in meteorological private cloud. J. Cloud Comput. Adv. Syst. Appl. 2020, 9, 1–12. [Google Scholar] [CrossRef] [Green Version]
  30. Chen, H.; Chandrasekar, V.; Tan, H.; Cifelli, R. Rainfall Estimation From Ground Radar and TRMM Precipitation Radar Using Hybrid Deep Neural Networks. Geophys. Res. Lett. 2019, 46, 1–10. [Google Scholar] [CrossRef]
Figure 1. The experimental site and radar equipment.
Applsci 11 01565 g001
Figure 2. (a) Furuno raw radar image with co-channel interference; (b) Image in (a) after co-channel interference removal.
Applsci 11 01565 g002
Figure 3. The occlusion area and the statistical histogram of the radar echo intensity under different rainfall intensities. (a) The occlusion area of the rain-free radar image; (b) The occlusion area of the radar image with light rain; (c) The occlusion area of the radar image with heavy rain; (d) Statistical histogram of (a). The blue color corresponds to the proportion of radar echo intensity. ZPP and μ are 98.8% and 0.23 V, respectively; (e) Statistical histogram of (b). ZPP and μ are 53.3% and 0.35 V, respectively; (f) Statistical histogram of (c). ZPP and μ are 1.28% and 0.55 V, respectively.
Applsci 11 01565 g003
Figure 4. The rainfall detection area with rain-free and rain-contaminated radar image. (a) Rain-free radar image. The black sector area is the occlusion area and the red sector area with obvious wave texture is the wave area; (b) Rain-contaminated radar image. The black sector area is the occlusion.
Applsci 11 01565 g004
Figure 5. The reason for the presence of the occlusion area.
Applsci 11 01565 g005
Figure 6. Flow chart of rainfall detection and rainfall intensity retrieval.
Applsci 11 01565 g006
Figure 7. Determination of the threshold T.
Applsci 11 01565 g007
Figure 8. Relationship between the RZE and rainfall intensity. (a) Scatterplot of the RZE and rainfall intensity; (b) Boxplot of (a).
Applsci 11 01565 g008aApplsci 11 01565 g008b
Figure 9. Scatterplot of the outliers removed. (a) 1000 groups of data; (b) 500 groups of data.
Applsci 11 01565 g009aApplsci 11 01565 g009b
Figure 10. The fitting function and error graph of each order. (a) The fitting function of first order; (b) The error graph based on (a); (c) The fitting function of second order; (d) The error graph based on (c); (e) The fitting function of third order; (f) The error graph based on (e); (g) The fitting function of fourth order; (h) The error graph based on (g).
Applsci 11 01565 g010
Figure 11. The selected radar image.
Applsci 11 01565 g011
Figure 12. The rainfall intensity recorded during the experiment.
Applsci 11 01565 g012
Figure 13. The rainfall detection results of the X-band marine radar images. (a) The ZPP method; (b) The RZE method for rainfall detection in the occlusion area; (c) The RZE method for rainfall detection in the wave area.
Applsci 11 01565 g013aApplsci 11 01565 g013b
Figure 14. The radar image sequence comparison among the RZE method, the ZPP method (30% threshold), the ZPP method (50% threshold) and the rainfall intensity.
Applsci 11 01565 g014
Figure 15. The actual rainfall intensity. (a) The actual rainfall intensity measured by the rain gauge; (b) The actual rainfall intensity after classification.
Applsci 11 01565 g015
Figure 16. Rainfall intensity level retrieval results. (a) The RZE substituted into fitting function; (b) Rainfall intensity retrieved by fitting function.
Applsci 11 01565 g016
Table 1. The Configuration of the X-band Marine Radar.
Radar ParametersThe Performance
Antenna Height45 m
Radar Antenna Speed 26 6 + 2 rpm
Pulse Power25 kw
Antenna Gain31 dB
Radar Frequency9375 mhz ± 30 mhz
PolarizationHH
Horizontal Beam Width0.9°
Vertical Beam Width21°
Range Resolution7.5 m
Pulse Repetition Frequency2000 Hz
Pulse Width0.07 us
Grazing Angle<5°
Table 2. The classification standard of rainfall intensity level.
LevelRainfall Intensity (mm/10 min)
micro rain0~0.1
light rain0.1~0.25
moderate rain0.25~0.7
heavy rain0.7~1.5
torrential rain>1.5
Table 3. The results of rainfall detection by the ZPP and RZE method.
Rain-Free Images (160)Rain-Contaminated Images (200)Total Images (360)
Correct NumberAccuracyCorrect NumberAccuracyTotal Accuracy
ZPP (50% threshold)10666.3%200100%85%
ZPP (30% threshold)160100%18090%94.4%
RZE (occlusion area)160100%18894%96.7%
RZE (wave area and threshold K)10867.5%200100%85.6%
RZE (wave area and threshold Z)15999.4%18291%94.7%
Table 4. The statistical results of the rainfall intensity level.
Actual Rainfall Intensity LevelMicro RainLight RainModerate RainHeavy Rain
standard/mm/10 min0~0.10.1~0.250.25~0.70.7~1.5
Total data100200200100
Retrieved as micro rain8819
Retrieved as light rain1215616
Retrieved as moderate rain 2517010
Retrieved as heavy rain 1490
Accuracy88%78%85%90%
Total accuracy84%
Publisher’s Note: MDPI stays neutral with regard to jurisdictional claims in published maps and institutional affiliations.

