Article

On the Energy Performance of Micro-Encapsulated Phase Change Material Enhanced Spackling with Night Ventilation

Department of Civil Engineering and Energy Technology, OsloMet–Oslo Metropolitan University, 0166 Oslo, Norway
*
Author to whom correspondence should be addressed.
Appl. Sci. 2021, 11(4), 1472; https://doi.org/10.3390/app11041472
Submission received: 23 December 2020 / Revised: 1 February 2021 / Accepted: 4 February 2021 / Published: 6 February 2021
(This article belongs to the Special Issue Advancement in Phase Change Material Technologies)

Abstract

:
Phase change material (PCM) is an attractive solution for improvement of thermal performance in buildings, and have excited a vast amount of research in recent years. There are however practical challenges with ensuring adequate phase transitions of the PCM to exploit the passive heat storage benefits. Night ventilation (NV) with free cooling have surfaced as one of the most promising methods to properly utilize PCMs and maximize energy savings. This work deals with a novel spackling compound enhanced with microencapsulated PCM. The product is intended for use at inner walls and ceiling surfaces of buildings and is suited for new and retrofitting building applications. Ensuing former experimental studies, a validated simulation model is developed and used to study the PCM with natural and hybrid NV strategies in an office building during summer conditions in Oslo, Norway. Cooling load reduction and energy savings are analyzed with varying air flow rates of 0.5–5 air changes per hour (ACH) and 2–4 mm PCM layer thickness. It is shown how increasing air flow rates and PCM thickness greatly enhances energy performance, but at a diminishing rate. Although the NV alone can reduce the cooling load by 11.5% at 1 ACH, 40.2% at 3 ACH and 59.8% at 5 ACH, one can achieve further reduction up to 19.5%, 78.2% and 95.5% for the respective ACHs with 4 mm PCM. The natural NV provides more energy savings compared to the hybrid strategy. As energy requirement by fans increases with the increase of air flow rates in the hybrid strategy, the energy savings eventually start to reduce. The hybrid strategy can save 38% energy at most with 3 ACH, and the savings is increased to 50% with the inclusion of 4 mm PCM. On the other hand, the natural strategy saves 56% of energy at the same air flow rate, and 69% with 4 mm of PCM.

1. Introduction

Improvement of energy efficiency is one of the priority research areas for the construction engineers/scientists towards the mitigation of the socioeconomic challenges like climate change nowadays. Most countries have committed to the Paris Agreement by United Nations (UN) to pursue efforts to limit the extent of global average rise in temperature [1]. European Union (EU) aims to achieve climate-neutrality by 2050 and wants to lead global efforts in this way. Buildings and the building sector as a whole are responsible for over 30% of the world’s total energy demand, and 40% of direct and indirect CO 2 emissions. The International Energy Agency (IEA) describes this sector to be a source of the enormous untapped potential of energy efficiency [2]. A key part of the strategy is to maximize the energy efficiency of buildings [3]. The increasing amount of research findings shows that the incorporation of PCMs in building/construction materials is an effective solution in new constructions and in retrofit solutions [4]. PCMs are a promising passive cooling technology which can increase a building’s thermal mass in an effective way [5,6,7,8]. The use of thermal mass in the building envelope have been widely used historically as a thermal energy storage system (TES), and when utilized beneficially it can reduce heating and cooling loads, shift peak load hours as well as dampen the diurnal indoor temperature swings throughout the day [9]. The chemical composition of the PCM can be tailored to achieve suitable melting temperatures for a wide range of climates and environments, and this has been identified by numerous studies as the key design parameter for successful application of the material [10,11,12,13]. Indeed, PCMs are widely utilized in building materials. Among these, PCM enhanced wallboards/gypsum boards are one of the common techniques [14,15,16,17,18,19,20,21] used in the interior of the building.
However, several key challenges are to improve the thermo-physical properties, e.g., to increase thermal conductivity and latent heat of a PCM incorporated composite. Other important issues are to ensure complete melting-solidification cycle and to ensure the fire safety requirements. The benefits of heat storage in the PCM can be completely lost if incomplete charging occurs repeatedly [10,22]. Application of NV with PCM-integrated gypsum boards was investigated by Barzin et al. [23] and a weekly electricity saving of 73% was reported in their study. The solidifying process can be assisted with enhanced convection, and a commonly proposed strategy is NV where air change rates are increased during night time to remove heat from the building. There is a great interest in coupling NV with free cooling by allowing cool ambient air into the building, which can enhance the heat transfer with the PCM considerably [11,12]. This is dependent on climatic conditions, and works best in locations with diurnal temperature variations of 12–15 °C [24]. NV strategies utilizing free cooling can consist of mechanical ventilation solutions, natural solutions with window openings or hybrid systems which is a combination of both. While all variations can be equally adequate in priming the PCM for good performance, the highest energy savings benefit can be achieved in the natural strategy as ventilation fans can be shut off [25]. Depending upon the building type, pure natural ventilation can often not be utilized efficiently. There are benefits by combining natural and mechanical ventilation strategies into hybrid NV and should be explored.
In their work, Geros et al. [26] revealed three key parameters affecting the efficiency of strategies by experimental measurements in three office buildings in Greece, namely the indoor-outdoor air temperature differential, the useful air flow rate applied during night time and the thermal capacity of the building. Their results showed that during the night, the lower outdoor air temperature, and the higher supply airflow rate increase the efficiency of the NV. Additionally, the importance of thermal mass was clearly revealed in the experiments by increasing the buildings thermal inertia in cooperation with effective NV that produced a lower temperature development and delay in the peak indoor air temperature. Solgi et al. [27] verified these conclusions in an experimental study that the key parameters for NV efficiency are the airflow rate, differential indoor-outdoor temperature and the thickness of the PCM layer, which is equivalent to an increase in thermal mass.
Simulations and experimental work on PCM wallboards installed in lightweight buildings are performed by Evola et al. [28,29]. They reported the air flow rate to be effective and one reaches a point of diminishing returns between 4 and 8 ACH. Zhou et al. [30] simulated the effect of natural NV in a multilayered building with PCM and concluded that the number of ACHs should be as high as possible, where up to 40 ACH was tested. Whenever hybrid NV strategies are used, most studies report a critical value of airflow rates where the energy savings are starting to drop due to fan usage [27]. In the recent study of Liu et al. [31], the authors presented the climatic and seasonal suitability for the combination of PCM and NV. However, an important factor is the control mechanism for the NV strategy. Wang et al. [32] analyzed three different control schemes in a similar climate and office building as in this report. It was reported that the most efficient strategy was the one which ventilated the office space excessively, where the NV control was not deactivated until the surface temperatures dropped below the outdoor air temperatures. Moreover, it was concluded that a strategy which prolonged the operational hours as long as possible, from 21:00–07:00 had a second-best effect. Roach et al. [33] explored a custom control, which aimed at using NV until a certain set point temperature inside the building was reached. Setpoint temperatures of 13, 15, 17 and 19 °C was tested, and it was found that the strategy reaching the lowest indoor temperature was best for energy performance. However, this can lead to problems with overcooling in regards to thermal comfort for early working hours. They concluded that 15 °C could be the optimum set point temperature, but further research is needed. Upon researching more studies on control schemes, it’s noticed that no one-fits-all solution exists. Researchers explore different ideas based on the particular climate and building conditions of study. There is also a lack of recommendations in national standards on the details of NV control mechanisms.
Studies related to quantification of the energy efficiency of buildings equipped with PCMs are not abundant in literature. This is partly due to the novelty of PCM enhanced building materials where few products are in a state to be readily incorporated in building applications, and partly due to the extent of study needed to properly analyze the energy efficiency. A sufficiently long time period with dynamic weather conditions should be investigated to produce reliable results. We summarize some relevant studies addressing the effectiveness of the PCMs for passive cooling in dynamic weather conditions in Table 1. Note that the results are seldom directly comparable as the outcomes are dependent on many variables linked to the PCM, climatic conditions and test setup. The works presented in [23,34,35,36] showed high improvements to either cooling load power draw or reduction of accumulative energy usage by the combination of PCMs and natural NV. Mechanical cooling (air conditioning (AC) or heat pump) were used at night in [37,38,39] to charge the PCMs. Although the results are lower in comparison with NV, significant improvements to the energy efficiency were still achieved. The remaining studies did not consider any cooling strategy of the PCM, and the benefits are subsequently lower.
In the recent work [43], the authors presented an experimental and a parametric study with a novel cost effective spackling material incorporated with microencapsulated PCM (MPCM) produced by Scanscap [44]. It can be realized that a high production cost is involved in the process of making gypsum boards incorporated with MPCM. The spackling material (contains fillers, MPCM, rheological additives and binding agents) acts as a primer coating material at internal wall and ceiling surfaces of building envelopes for passive thermal management and is supposed to cover the entire surface. Additionally, the application of this coating material lies of the range of 1–4 mm at the internal wall and ceiling surfaces of a building. This can be achieved by very simple operations. One of the key advantages of this coating material is that a large surface area of the material can be available for direct and effective interaction with the air inside the building spaces. Moreover, spackling materials can easily be retrofitted into existing building mass as it can be applied to gypsum boards, plasterboards, concrete or bricks. In this work, we further investigate this novel MPCM enhanced spackling material in combination with NV in building applications. Summer conditions in the climate of Oslo, Norway, is chosen to study the spackling material mentioned above. A particular focus of this work is the realistic usage of the material in office environments, complying with the current Norwegian building code, TEK-17 [45]. The work is organized as follows: in Section 2 the methodology and the description of the case studies are presented. The detailed analysis of the results is given in Section 3. Finally, the conclusions are drawn in Section 4.

2. Materials and Methods

In this work, IDA Indoor Climate and Energy 4.8 (IDA ICE) software [46] is used to study the performance of the novel spackling material with NV strategies in a typical office building setup. For better clarity, we first briefly present the validation of the models for PCM wall extension of IDA ICE with the experimental data (see Section 2.2). Subsequently, the detail of problem setup for the case studies is presented in Section 2.3.

2.1. Description of the PCM Spackling

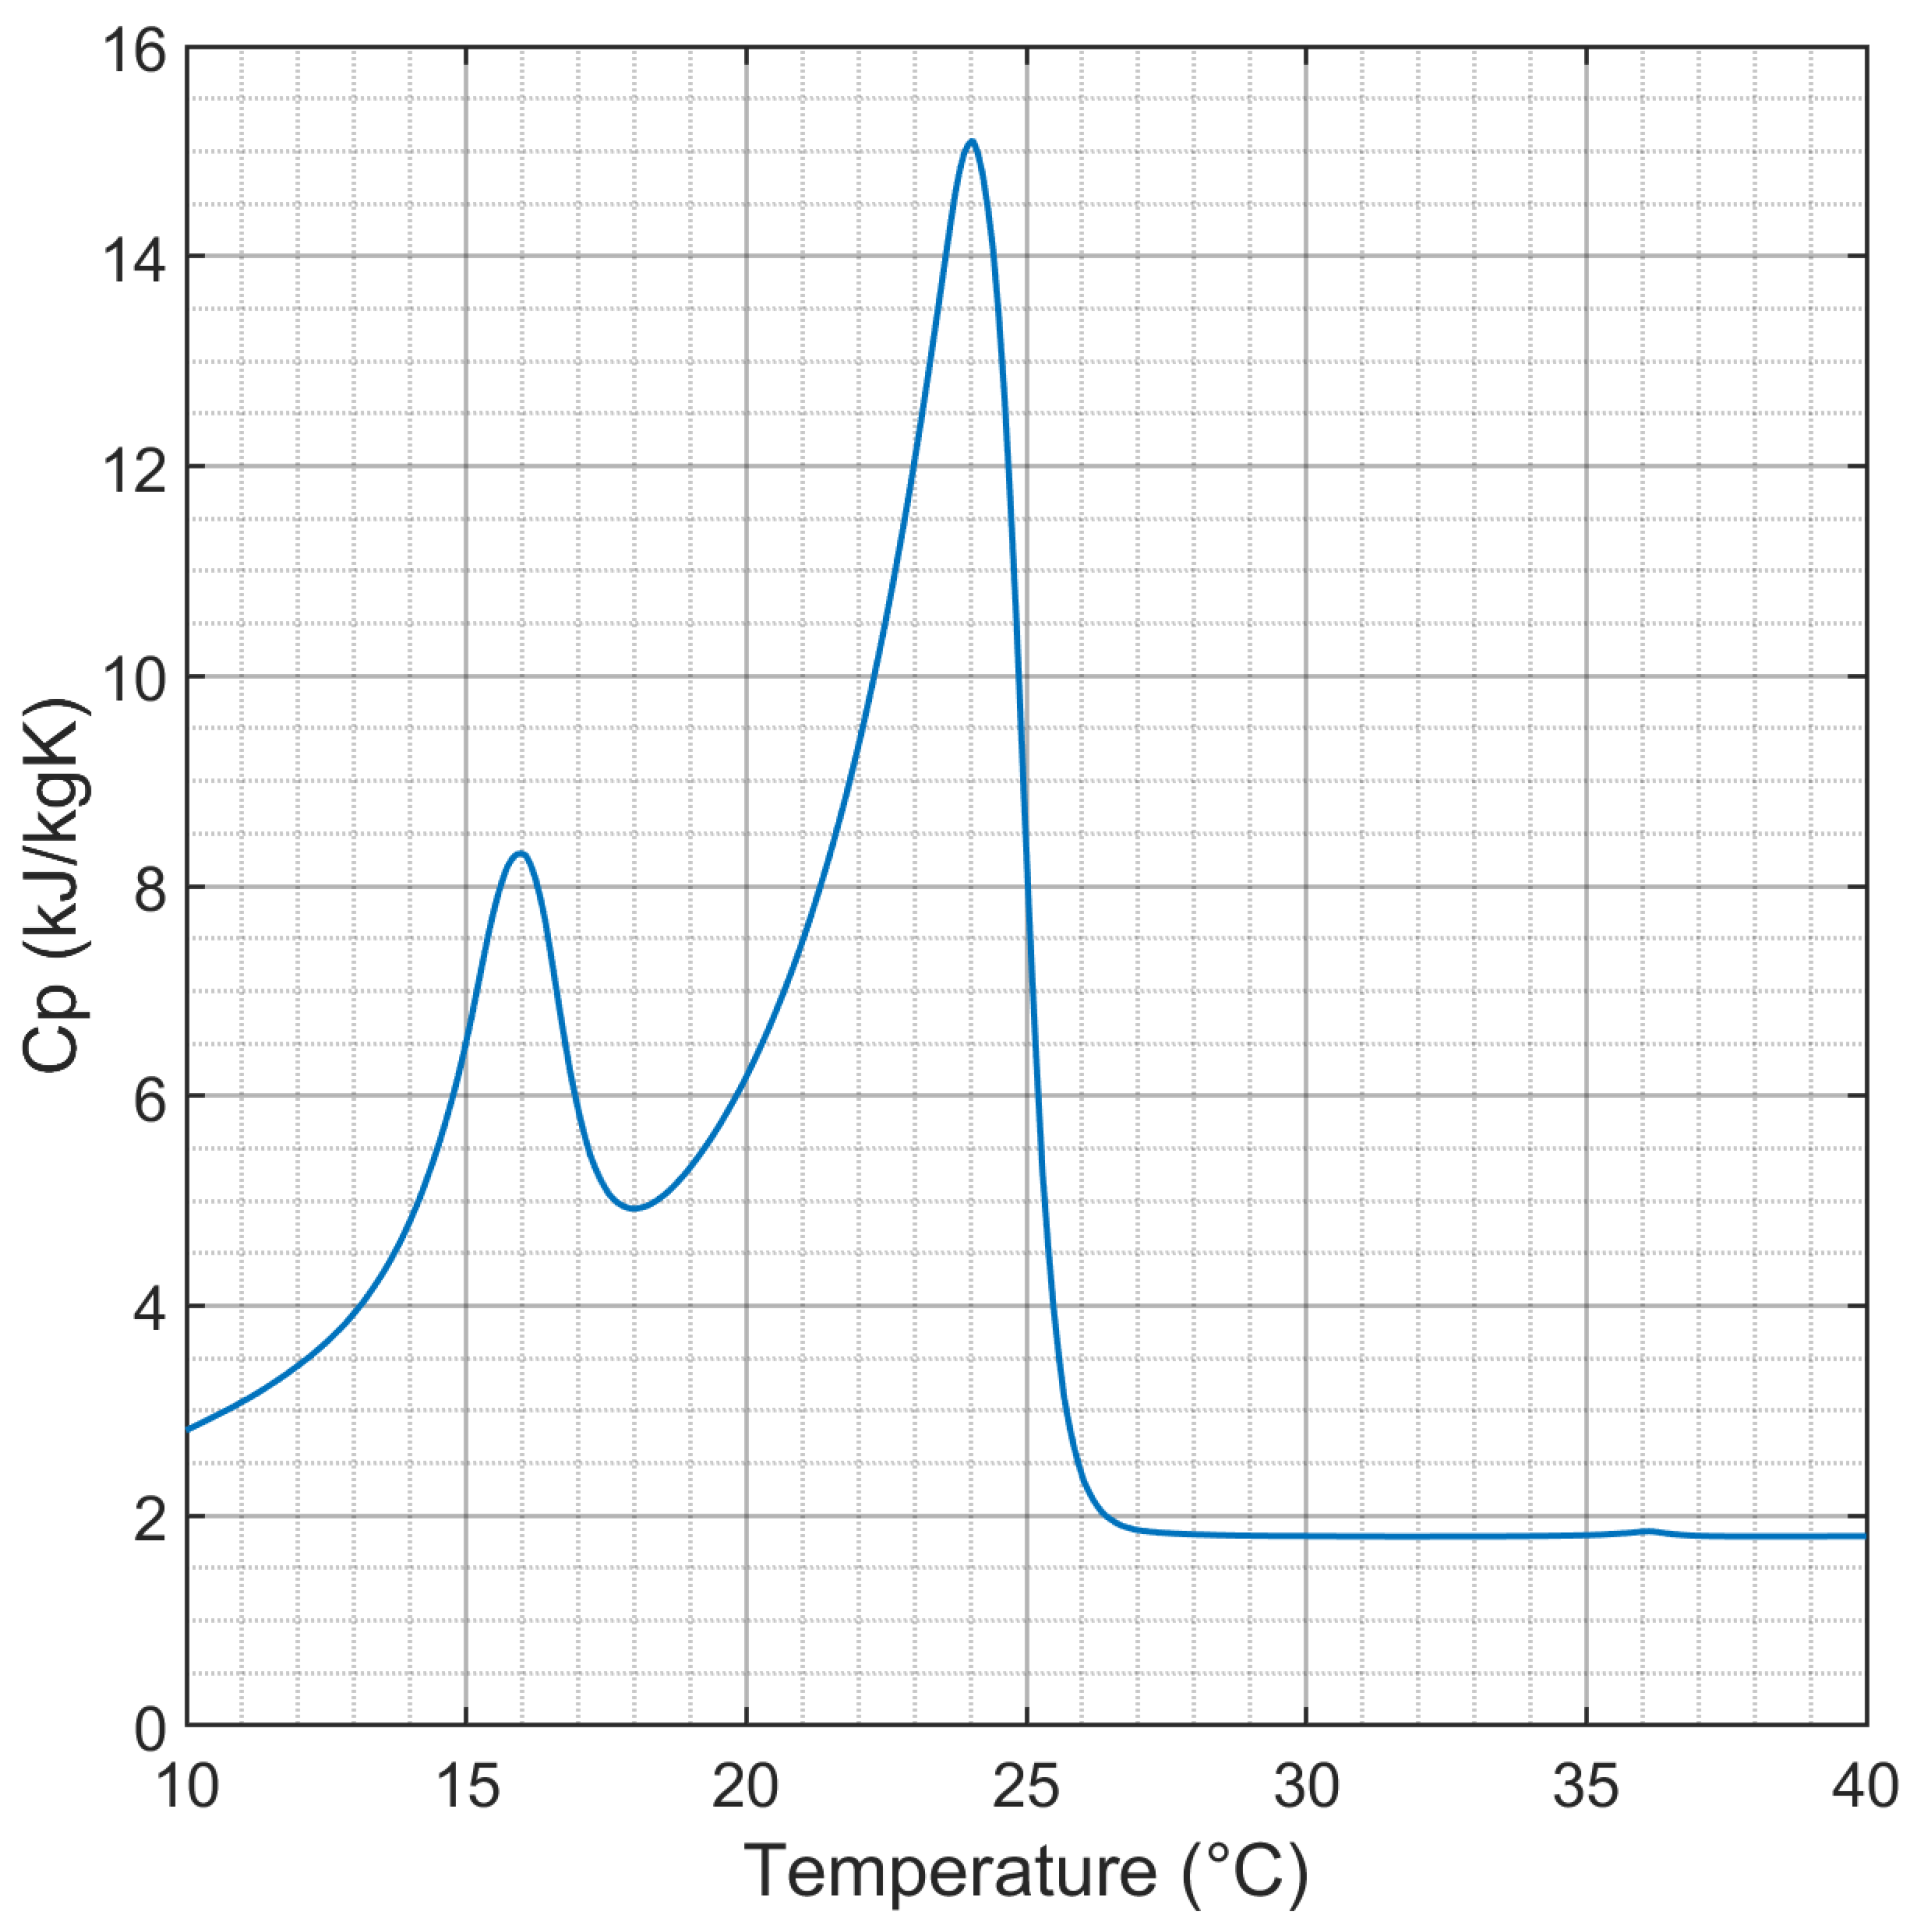
The heat capacity of the PCM spackling had previously been measured with a differential scanning calorimetry (DSC) test (see Figure 1). The overall thermal conductivity of the composite material was measured to be 0.08 W/(m·K) in a guarded hot-box experiment following the standardised method [47]. Other properties are summarized in Table 2.

2.2. Validation of the Simulation Models

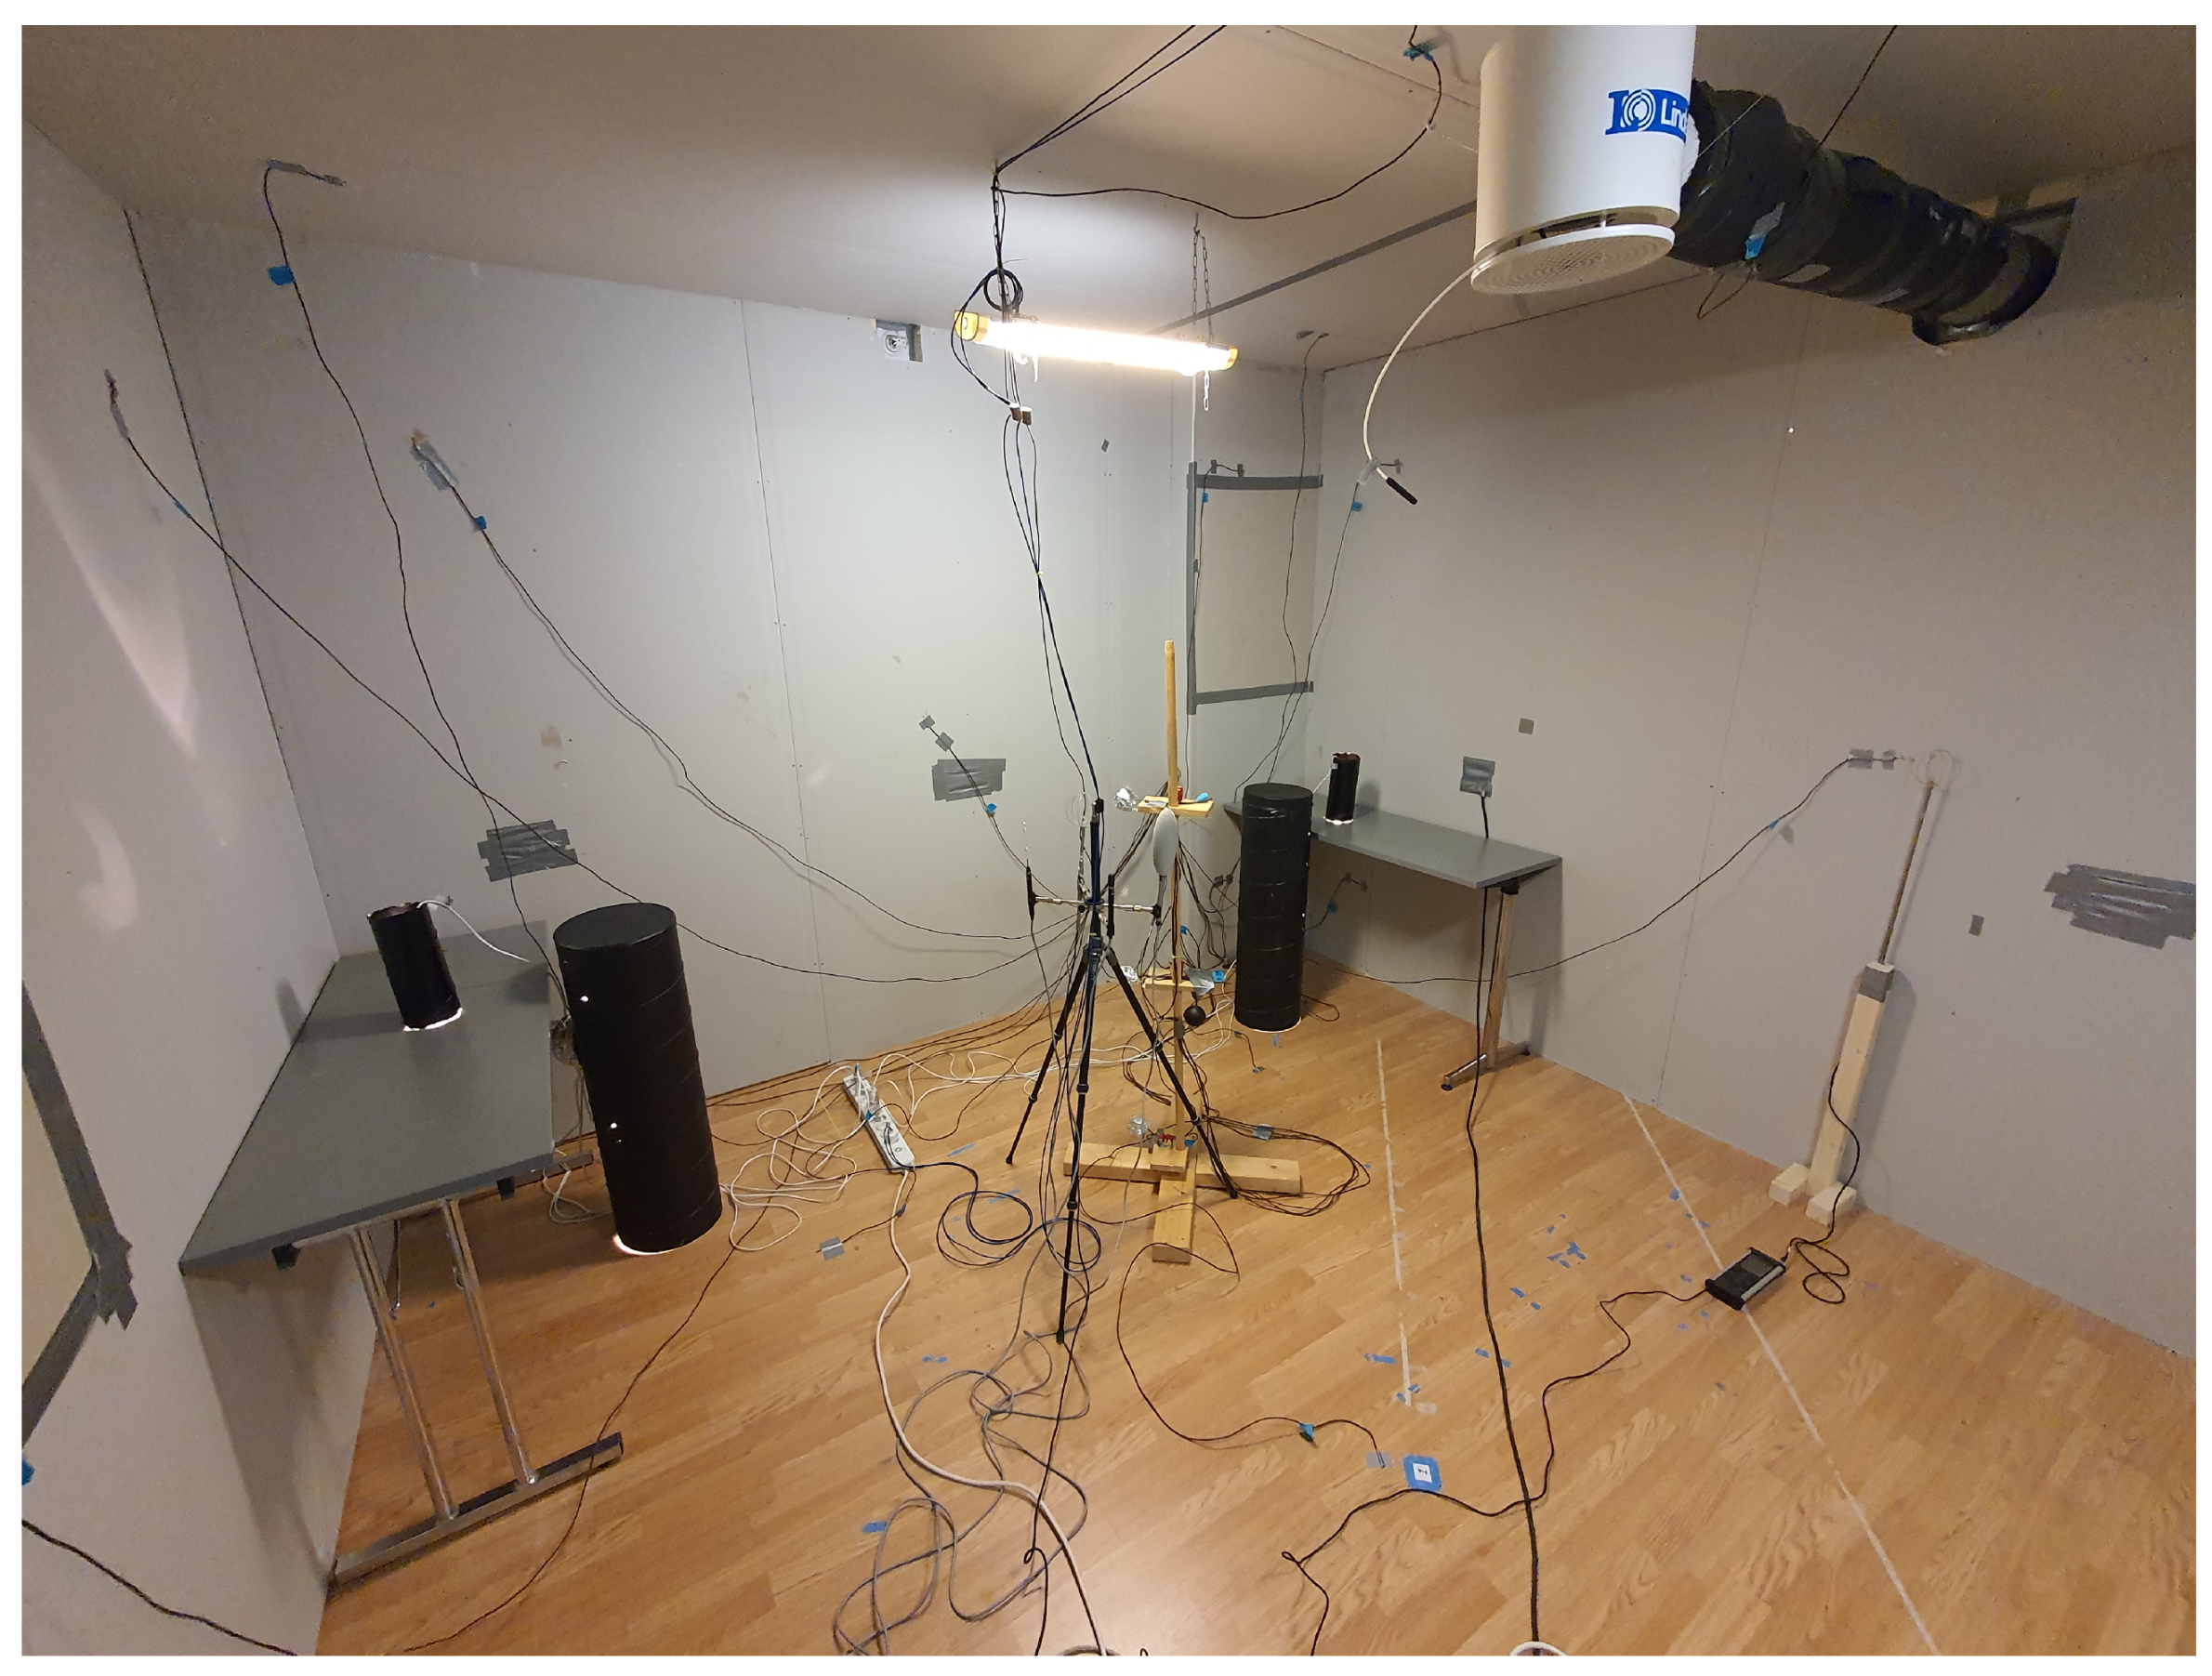
The PCM-spackle used in this work was recently studied by Vik et al. [43] in a climate chamber to measure its impact on the air and the surface temperatures. The chamber was designed to consider a typical office cubicle for two occupants together with a realistic daily schedule of heat gains and suitable room ventilation setup (see Figure 2). The conditions were prescribed in such a way so that one can emulate the normal indoor conditions at summer time for an office environment in the region of Oslo, Norway. The experiments were carried out without and with the application of PCM spackling at the inner walls (1.7 mm average thickness) and ceiling surfaces (2.1 mm average thickness) for 5 days. Also, the working hours were considered between 08:00–18:00, and NV with enhanced air flow rates was set to ensure the charging of the PCM. Interested readers can find the detail of the experimental setup in [43]. We use the aforementioned temperature dependent specific heat capacity and the thermal conductivity as the input parameters to validate the “PCMwallH” module of IDA-ICE with the experimental results. This module uses the partial enthalpy method to account the variable heat capacity of PCM. The comparison between the average air temperature of the simulation and the last 3 days of the climate chamber experiments is illustrated in Figure 3. Fixed timesteps with a resolution of 1 min is used for the simulations to match the thermocouple storage points in the experiments.
First, a very good agreement of thermal behavior between experiment and simulation is achieved for the case without PCM (see Figure 3a). Secondly, the accuracy of the prediction of the PCM model is studied and shown in Figure 3b.
A very good agreement between the curves can be seen again, especially during the business hours, i.e., the melting phase of the PCM. The curves are marginally deviating during the solidifying phase of the PCM. Note that the PCM released more heat earlier in the simulations compared to the experiment. This is most likely due to the effect of the hysteresis or super-cooling, where the true heat capacity curve of the PCM would in reality not be identical when the material is solidifying as when it’s melting. The peak of the curve would in fact be slightly shifted towards a lower temperature during cooling. This is often seen in DSC data for MPCMs when both phase transitions are measured, and typical for the paraffin based PCMs which are normally used for the microencapsulation method [48]. As only the heating curve of the PCM-spackle was known for this study, it was also used for the reverse phase transition during cooling in the IDA-ICE model. This has also been done in similar studies and argued to not be of significant importance for the reliability of the results [29]. Nevertheless, the results are found to be accurate with R 2 = 0.976 and C V R M S E = 1.12 % which indicates a very satisfactory match between the curves (Figure 3b) and the model can be considered as reliable.

2.3. Problem Setup

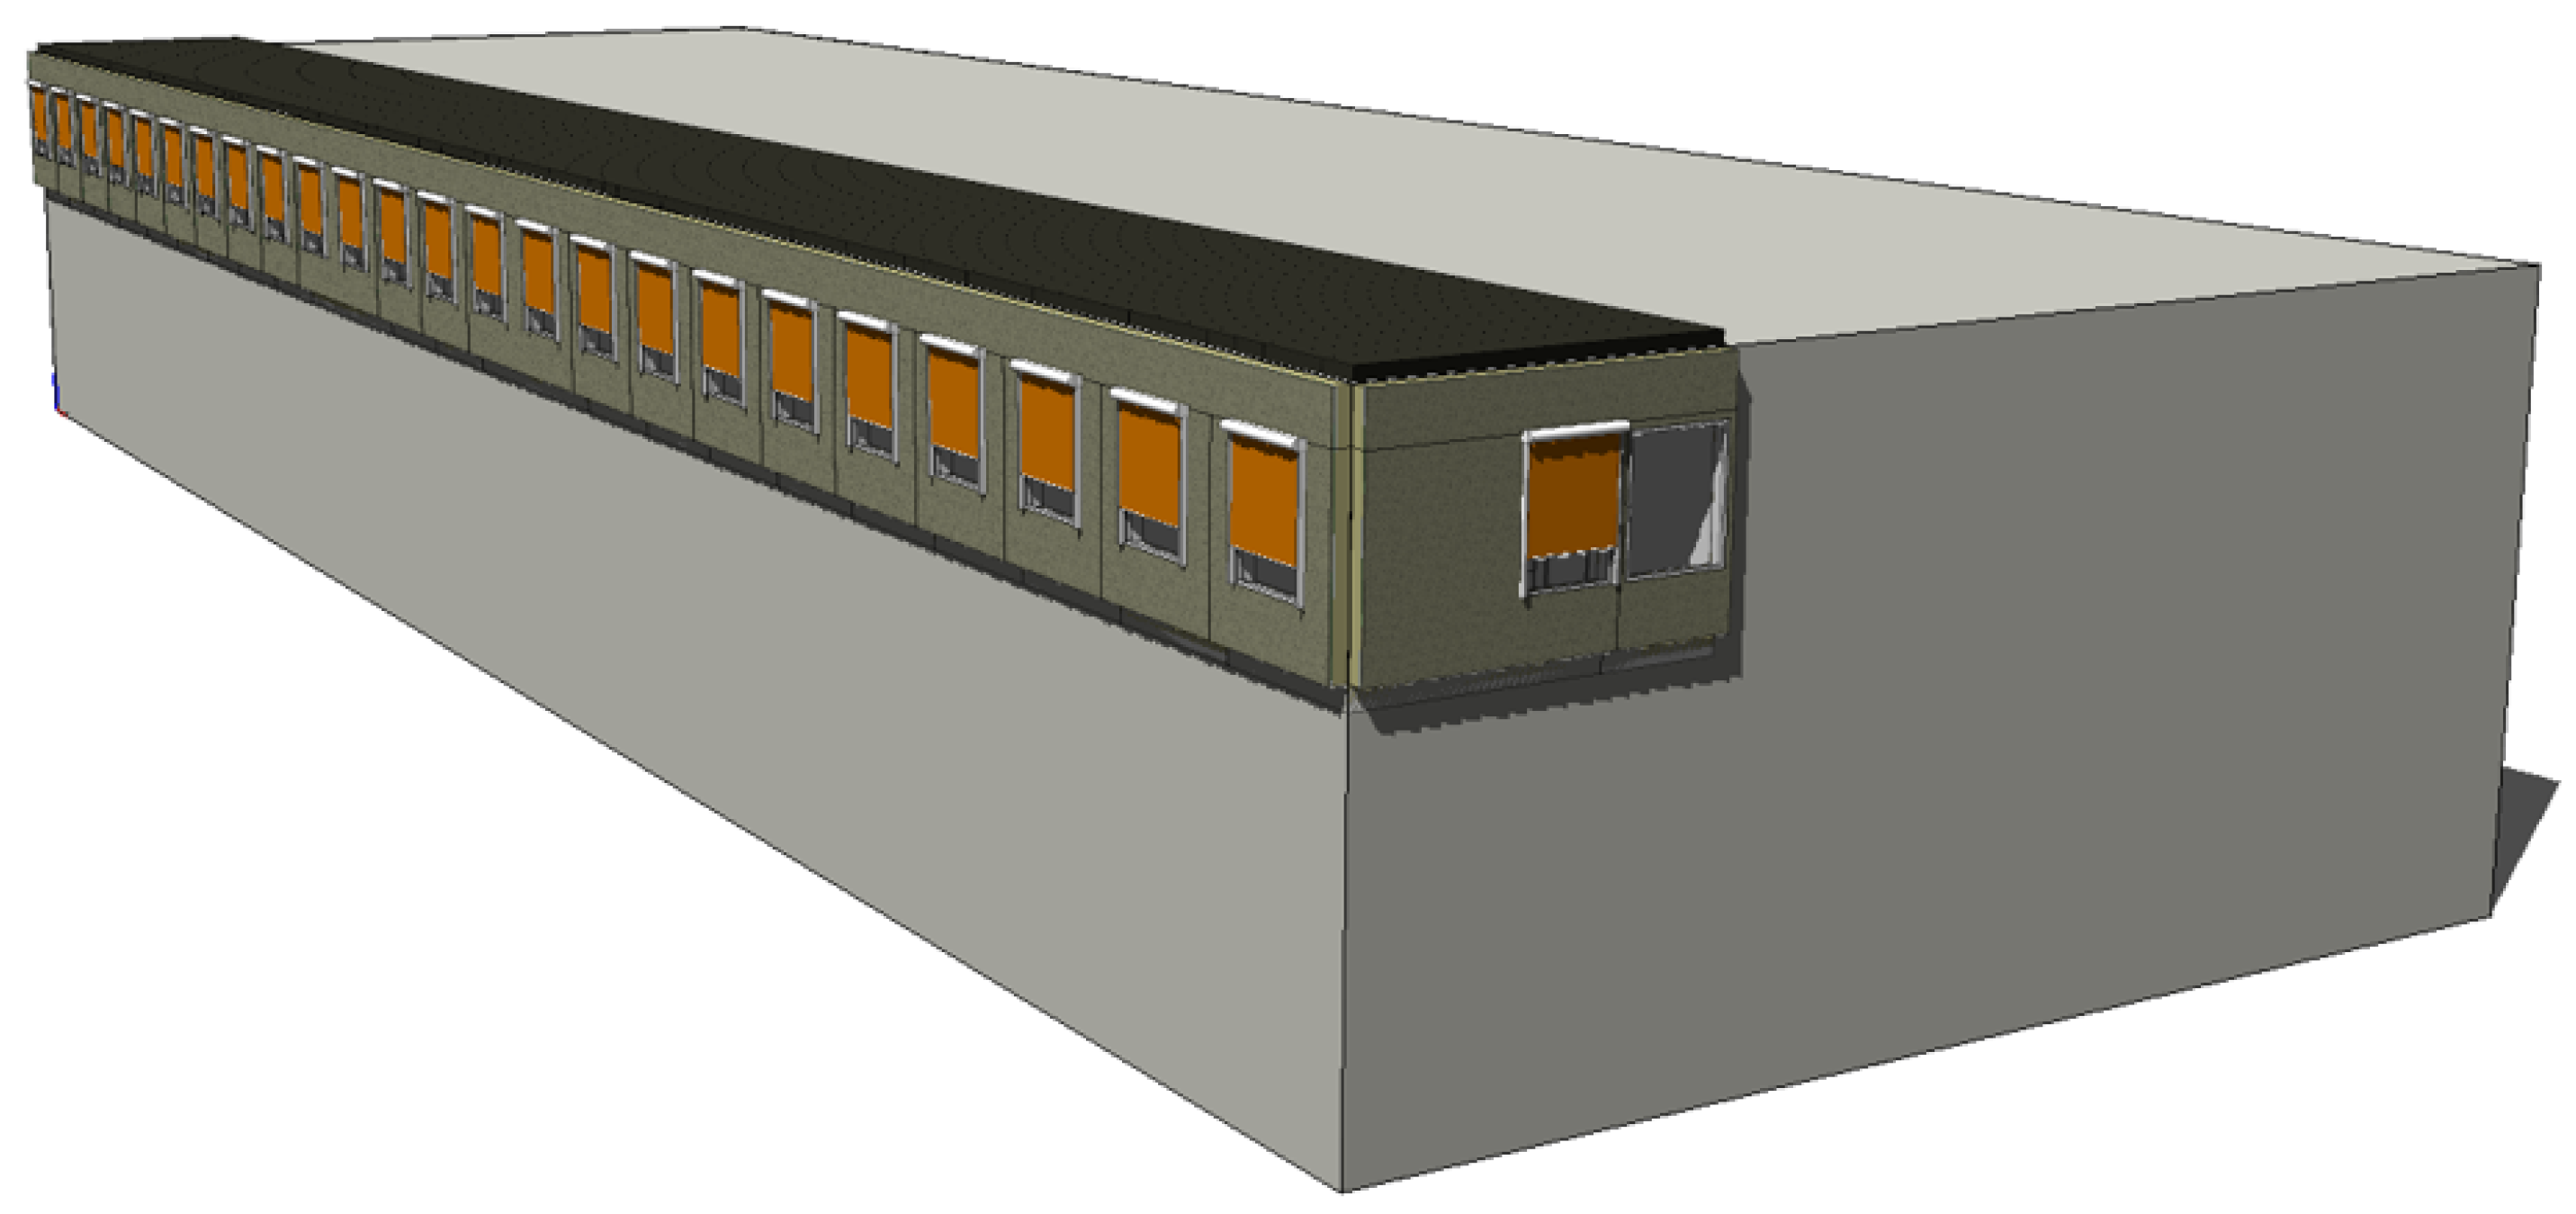
To investigate the performance of the spackling material for a representative office building in connection with different NV strategies with the simulation tool IDA-ICE discussed above, we consider the following setup as shown in Figure 4. The default settings for dynamic simulation are used, where the calculated variables are solved through a variable timestep integration scheme with a tolerance of 0.02. An EnergyPlus weather file with climate data from Oslo, Norway, is used in the model, where the months of June, July and August are simulated. The location is subject to a temperate cold climate, and has a Köppen-Geiger classification: Dfb. The building is modelled to comply with the energy efficiency criteria set by the Norwegian building code, TEK-17 [45]. The choice of the materials and building layout are made in accordance with the modern building techniques and guidelines in Norway. The thermal properties of the building envelope are listed in Table 3. We consider that the cubicles are equipped with diffusive window screens and if the solar flux exceeds 100 W/m2 on the facade a draw signal is invoked to inhibit the overshoot from the allowed net energy demand according to TEK-17 regulations. The total g-value of the windows with and without screens drawn are assigned as 0.53 and 0.27, respectively.
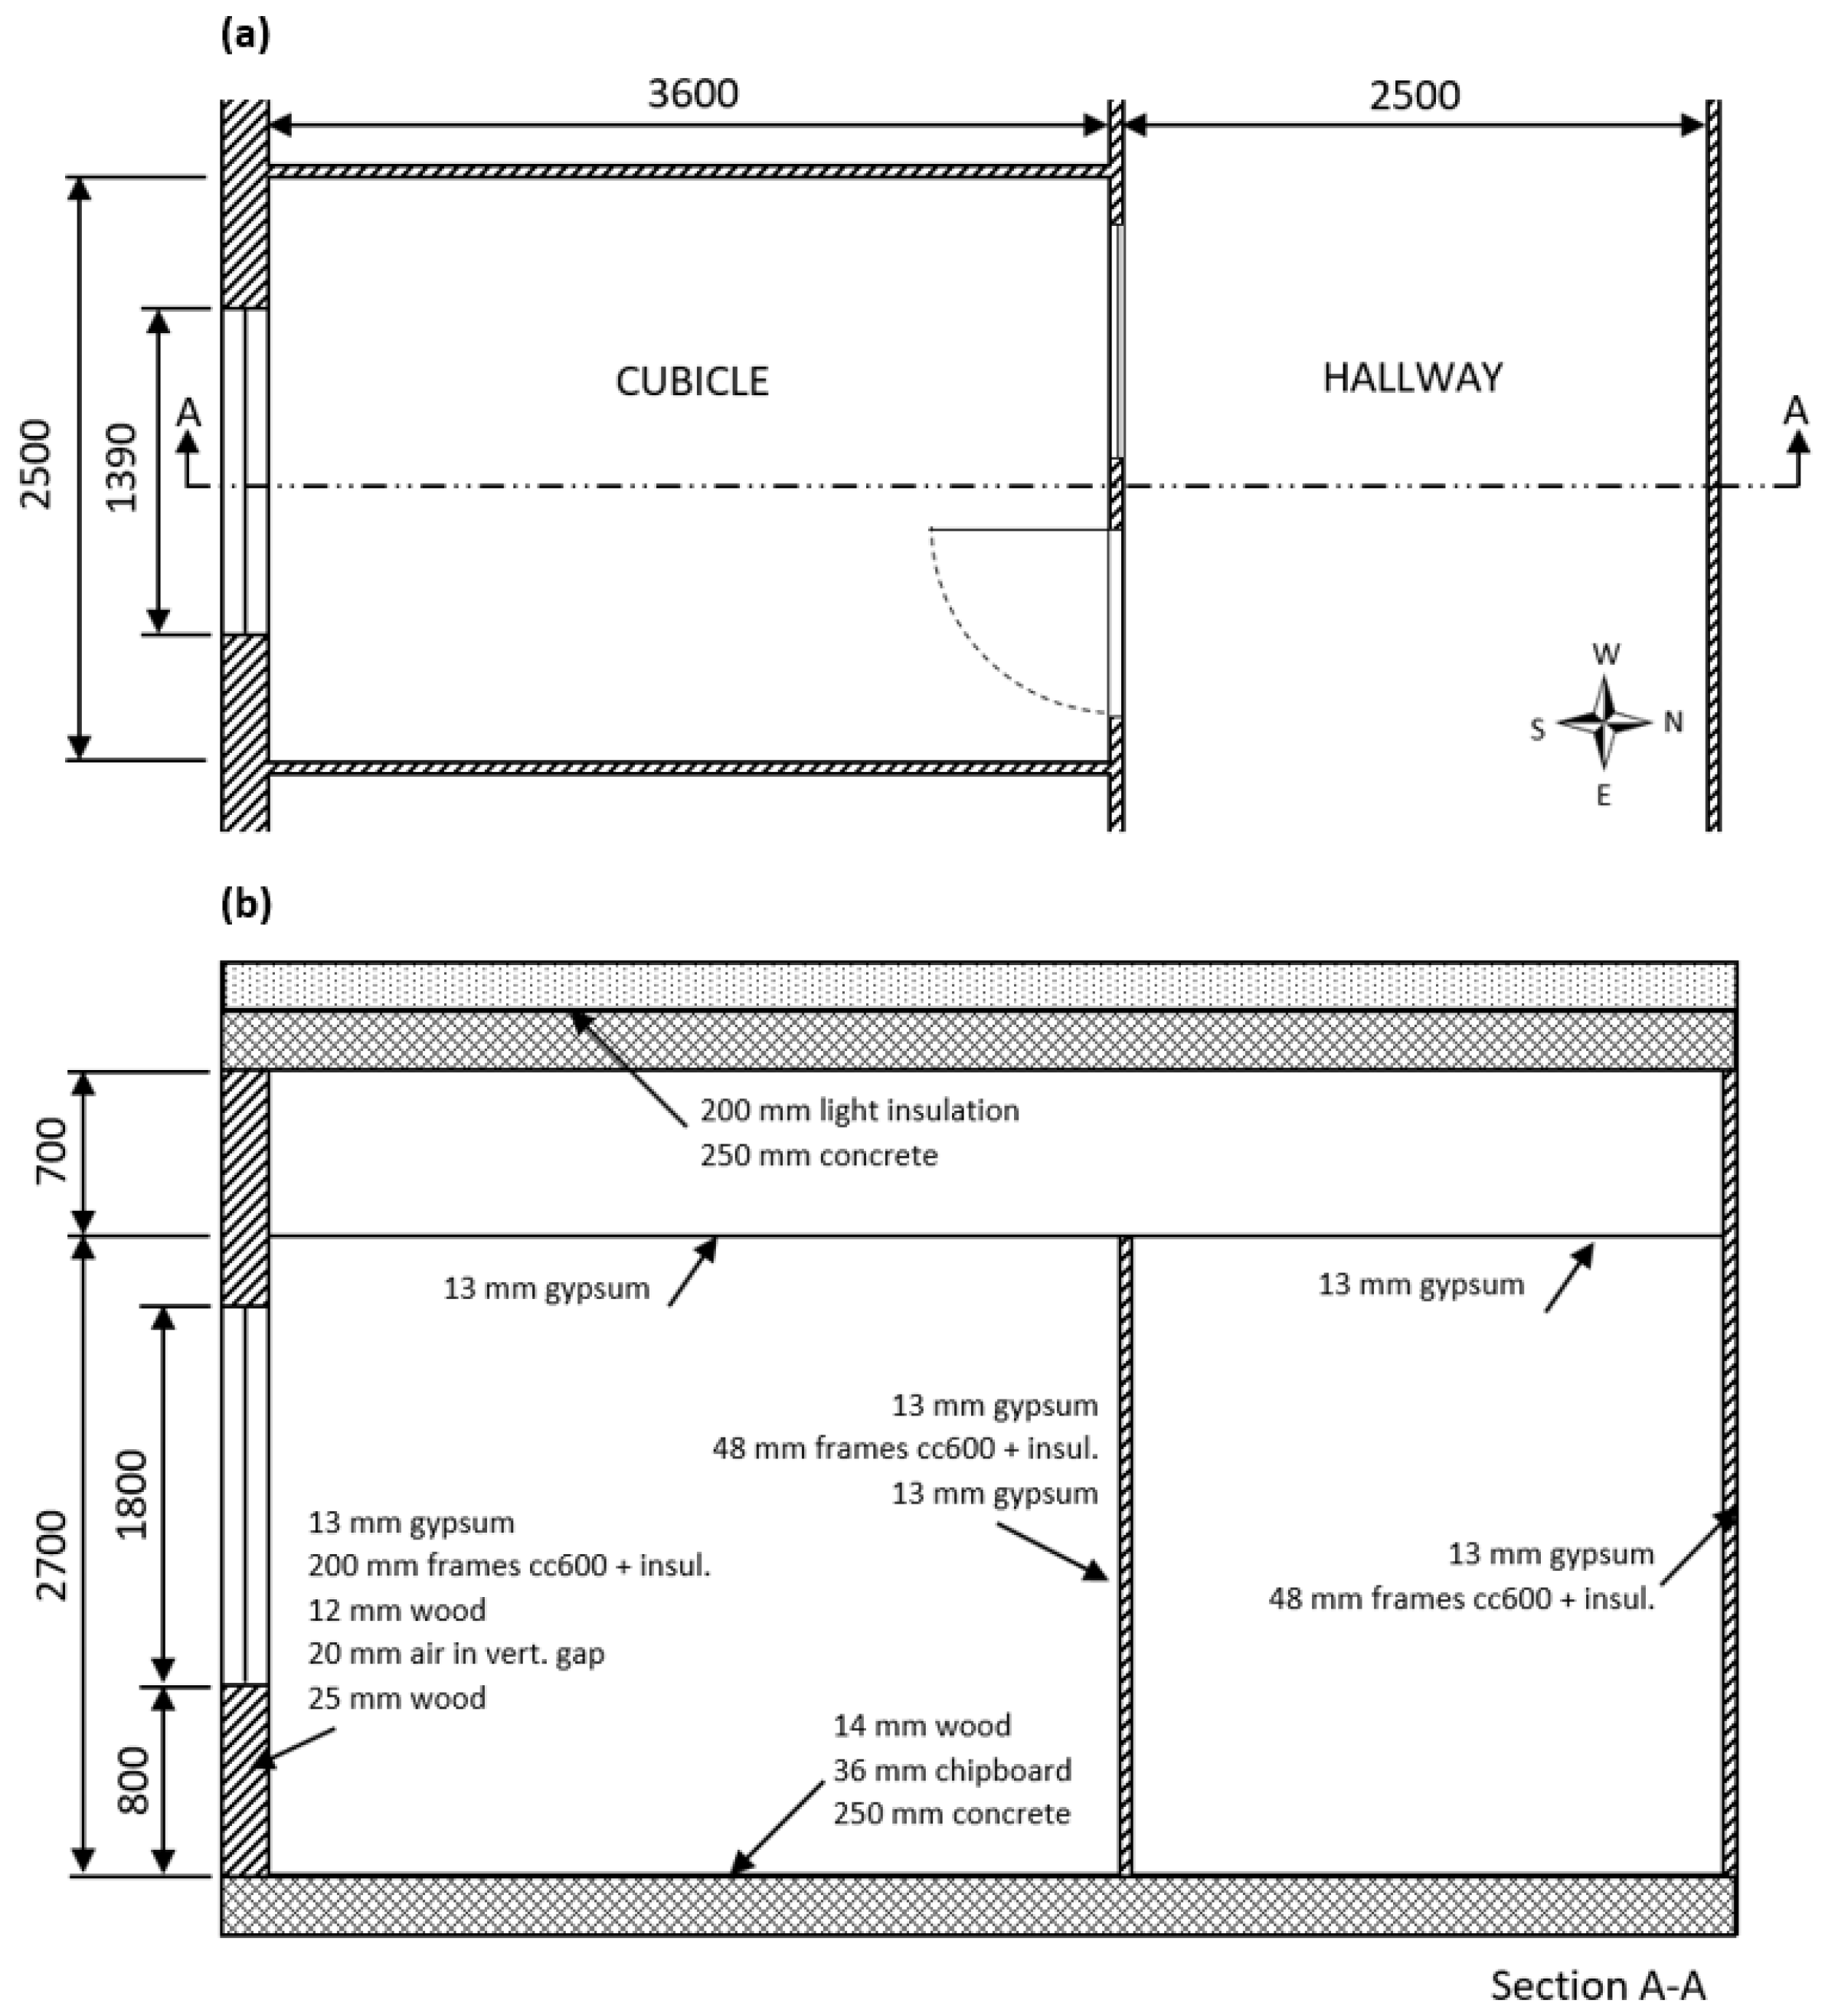
To reduce the computational cost, only the south facing part of the upper floor is considered to be fitted with a detailed interior layout (see Figure 4). This is a multi-zone model with 318 m2 floor area, consisting of multiple single celled cubicles, a hallway, and a technical space above the suspended ceiling. The PCM-spackle is added to the walls and ceiling surfaces of each cubicle. The spacing layout and multi-layered construction elements are detailed in Figure 5 and Table 4. The cubicles and the hallway are equipped with a constant air volume (CAV) ventilation system, supplying air with a temperature of 19 °C whenever active. The air flow rates are prescribed with a min/max schedule based on the working hours of 08:00–18:00, as shown in Table 5. Each cubicle and the hallway are fitted with an ideal cooler activated at 26 °C operative temperature, as this is the upper limit for the thermal comfort set by the Norwegian national standards. This would reveal the surplus heat needed to be evacuated or prevented from entering the occupied space to maintain the thermal comfort criteria.
To reveal the benefit of the careful consideration of the combination of NV strategies with the PCM-spackling we considered both fully natural NV system and a hybrid NV system. The aim is to study the effect on cooling load reduction and energy savings with varying NV air flow rates and PCM layer thickness. In the natural strategy, CAV is shut off and the windows are opened by a varying amount to provide the desired air flow rates. In this strategy, each cubicle is ventilated with single sided window opening, while the hallway is ventilated with window openings in each end. On the other hand, for the hybrid strategy, the windows are opened by a limited and fixed amount, and only the exhaust fan of the CAV system is triggered to extract air from the building by varying amounts. The specific fan power (SFP) of the ventilation system is set as S F P s u p = 1.5 kW/(m3/s) and S F P e x h = 1.0 kW/(m3/s). Both strategies are made active between 21:00–07:00 every day. A minimum allowed indoor set point temperature of 16 °C is used during NV to avoid over-cooling issues leading to thermal discomfort at the morning working hours.
It is evident that only a fixed amount of window opening does not produce a constant ventilation rate and the flow rate depends additionally on the pressure differential between the indoor and outdoor environment. The air flow rate decreases when the indoor temperature drops during NV. Since the air flow rate is the determining parameter for NV efficiency and it is an important parameter for comparison of different strategies, suitable setups of the degree of the opening of the windows are considered to prescribe desired daily average air flow rates. In the cubicles, the windows are opened with a relative opening area between 14–40% with a discharge coefficient, C d = 0.65 , to match the air flow rate range of 0.5–5 ACH. Such a choice of the values of these parameters yielded a basis for a good comparative study with different NV strategies.
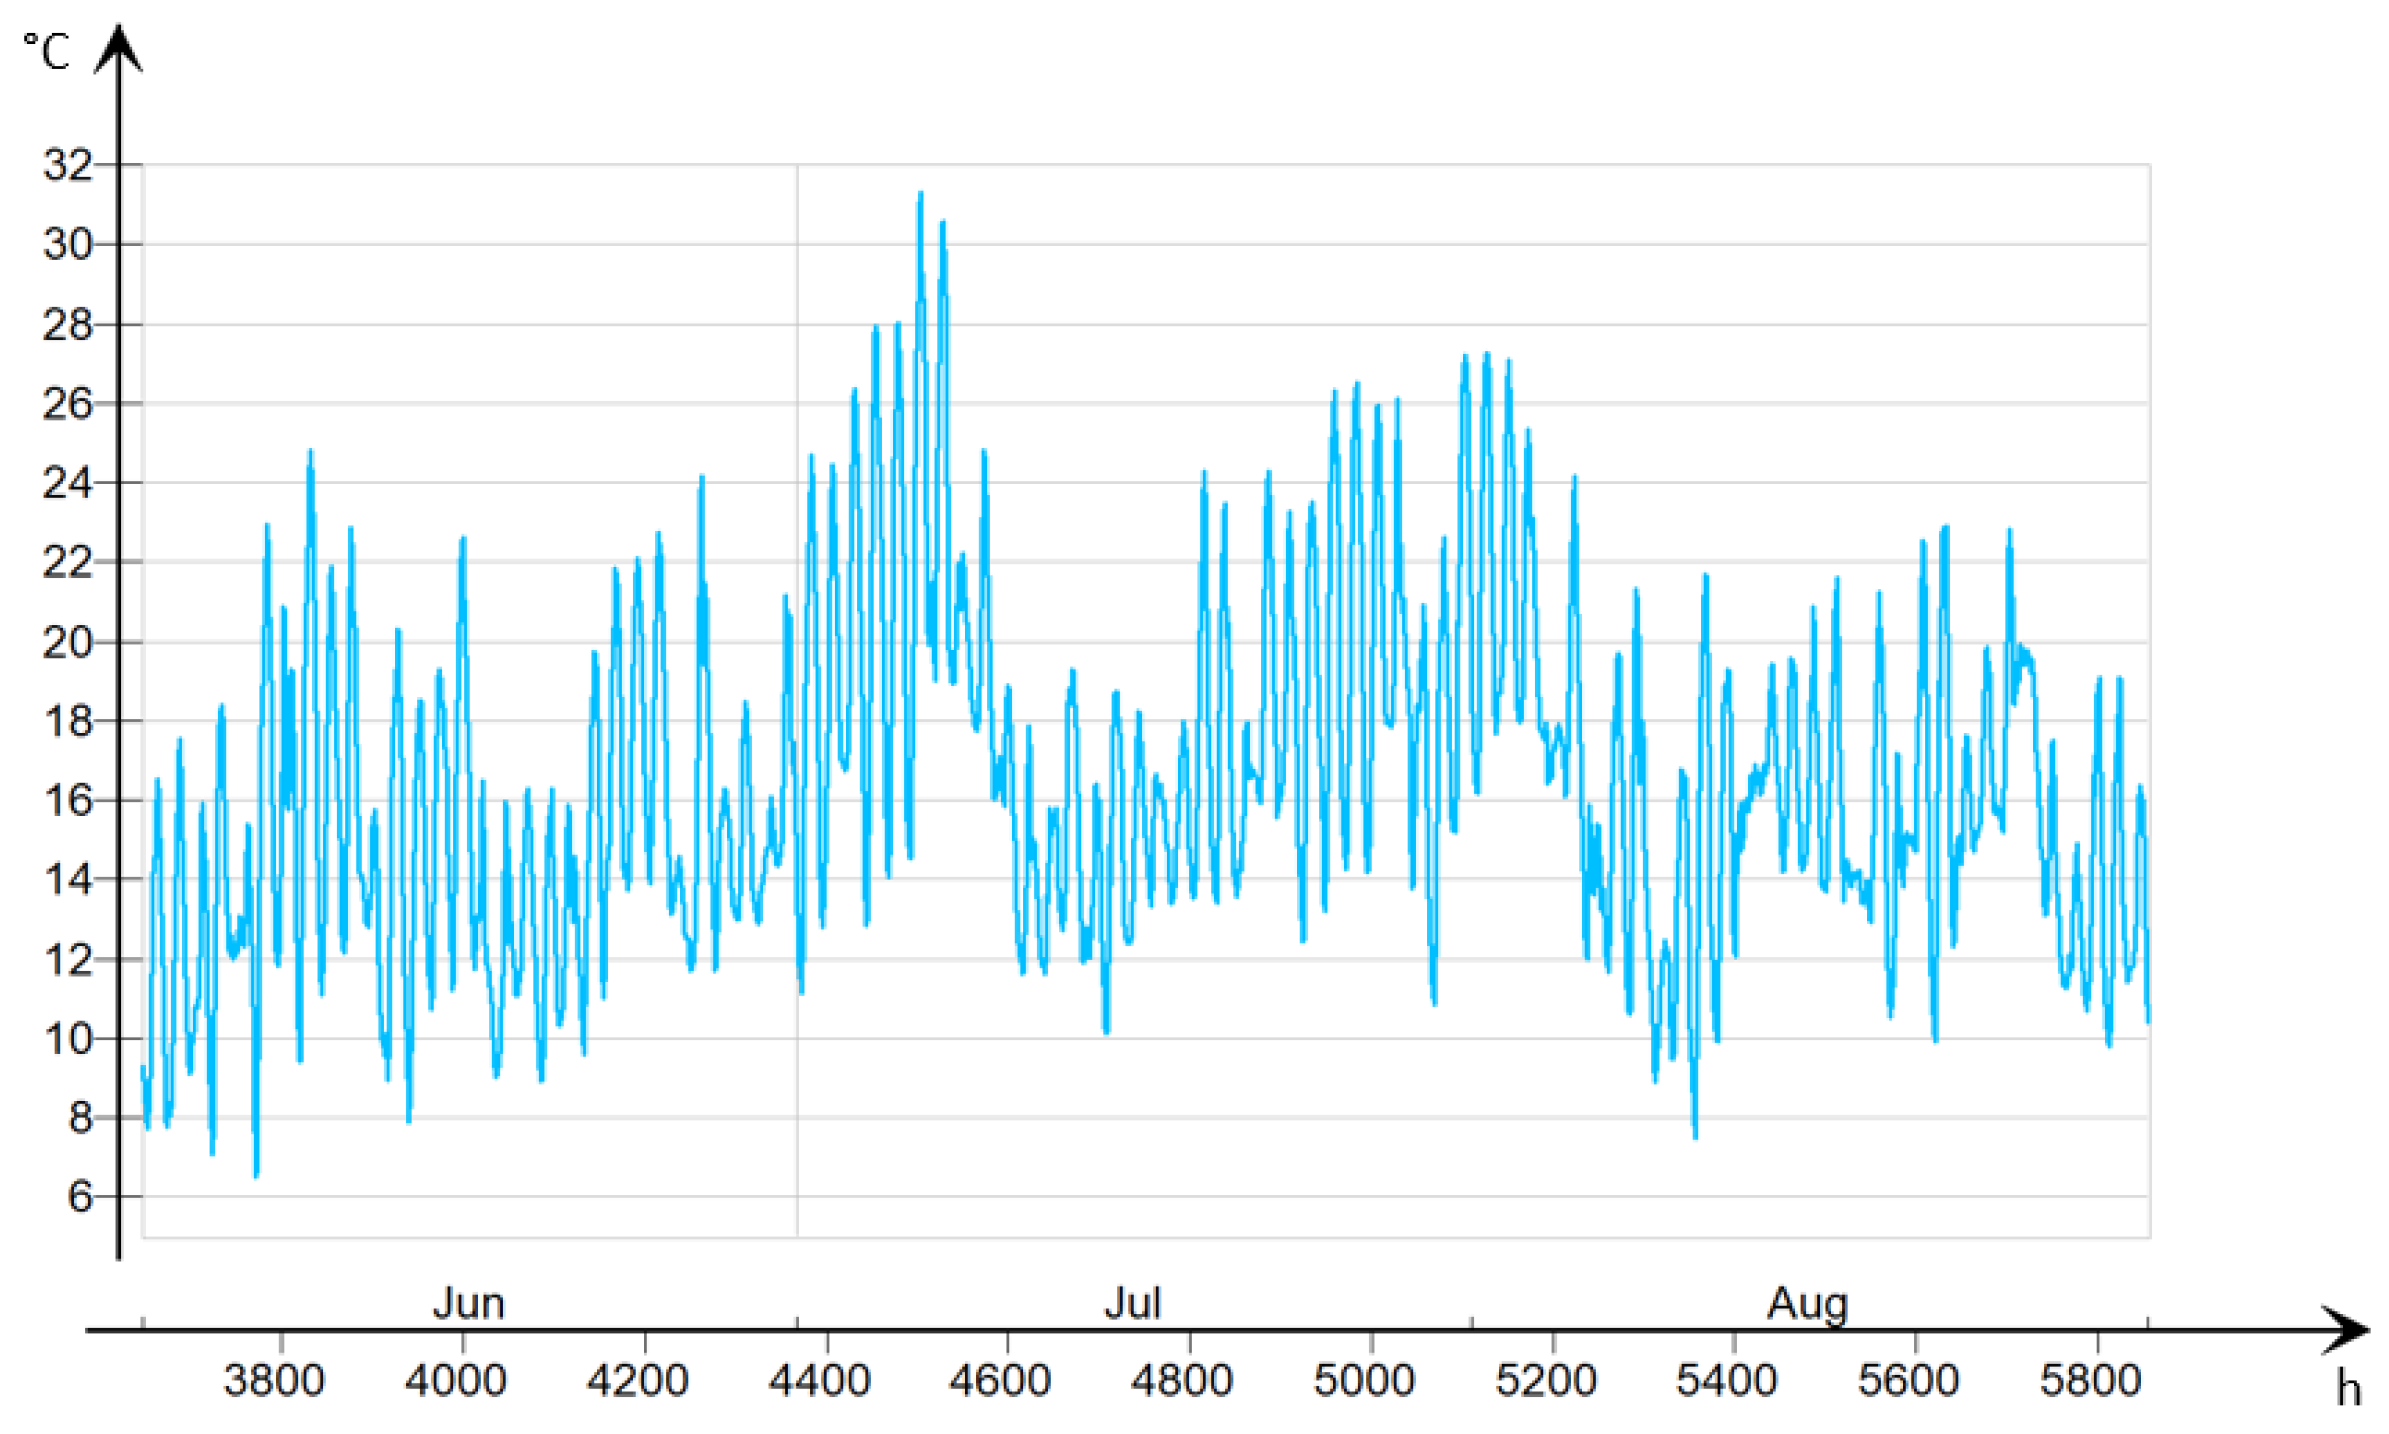
The schedule of all active systems in the simulation model, the CAV ventilation, the NV strategies as well as the internal heat gains are listed in Table 5 and Table 6. For the analysis, the variables under investigation are listed in Table 7. A baseline reference case is simulated without the use of either PCM or NV strategies. Note that the NV strategies are considered with and without PCM spackling to reveal their individual impacts on the energy performance. Figure 6 depicts the variation of the outdoor air temperature during the months of interest for all simulations.

2.4. Measure of Energy Reduction

Evidently, the NV strategies and the PCM-spackle affect the local heat exchange in the zones under consideration and the energy requirement for mechanical cooling is thus a meaningful measure for comparison. To assess this, energy saving (Equation (1)) is calculated for the whole building during the entire simulation period, which reveals the energy saved for cooling in relation to the reference case.
E s a v e d = E l o c a l c o o l i n g , r e f E l o c a l c o o l i n g E l o c a l c o o l i n g , r e f · 100 %
To get a broader picture of how the NV strategies and the PCM-spackle affect the total energy consumption of the building, all energy posts that varies due to the strategies should be considered. Both the natural and the hybrid NV strategy affect the energy requirement by the air handling unit’s (AHU) fans. Additionally, in comparison with the reference case, some extra energy benefits or deficits for the AHU are necessary to consider (Equation (2)). The AHU is equipped with a rotor wheel heat exchanger with an efficiency of 0.9.
E s a v e d = 1 E l o c a l c o o l i n g + E f a n s + Δ E A H U E l o c a l c o o l i n g , r e f + E f a n s , r e f · 100 %
where Δ E A H U = ( E A H U h e a t i n g E A H U h e a t i n g , r e f ) + ( E A H U c o o l i n g E A H U c o o l i n g , r e f ) .
The description of the variables in Equations (1) and (2) are as follows: E s a v e d is the energy saved in relation to the reference case, E l o c a l c o o l i n g is the energy used by local AC units in the occupied zones, E f a n s is the energy used by the AHU’s fans and Δ E A H U is the energy used by the AHU other than the fans. The subscript “ref” indicates values belonging to the reference case, while terms without this subscript belongs to the particular simulation case.

3. Results and Discussion

We performed simulations for all 36 test cases together with the reference test case as mentioned in Table 7 during the entire summer months. The analysis of the results is presented in the following three sections. First, we illustrate the general characteristics of the usage of PCM spackling in Section 3.1. Subsequently, in Section 3.2, we present the analysis of the cooling load reduction and finally, Section 3.3 reveals the energy saving aspects of the MPCM enhanced spackling material in combination with NV.

3.1. Temperature Reduction

The test case of hybrid NV with 3 ACH is chosen as a typical representative case for the analysis of the reduction of the operative temperature (OT) towards the favorable application of the spackling material. Note that the analysis is based on a representative office cubicle in the middle of the building. This evidently reveals the essential features of the benefits of the usage of PCM spackling.
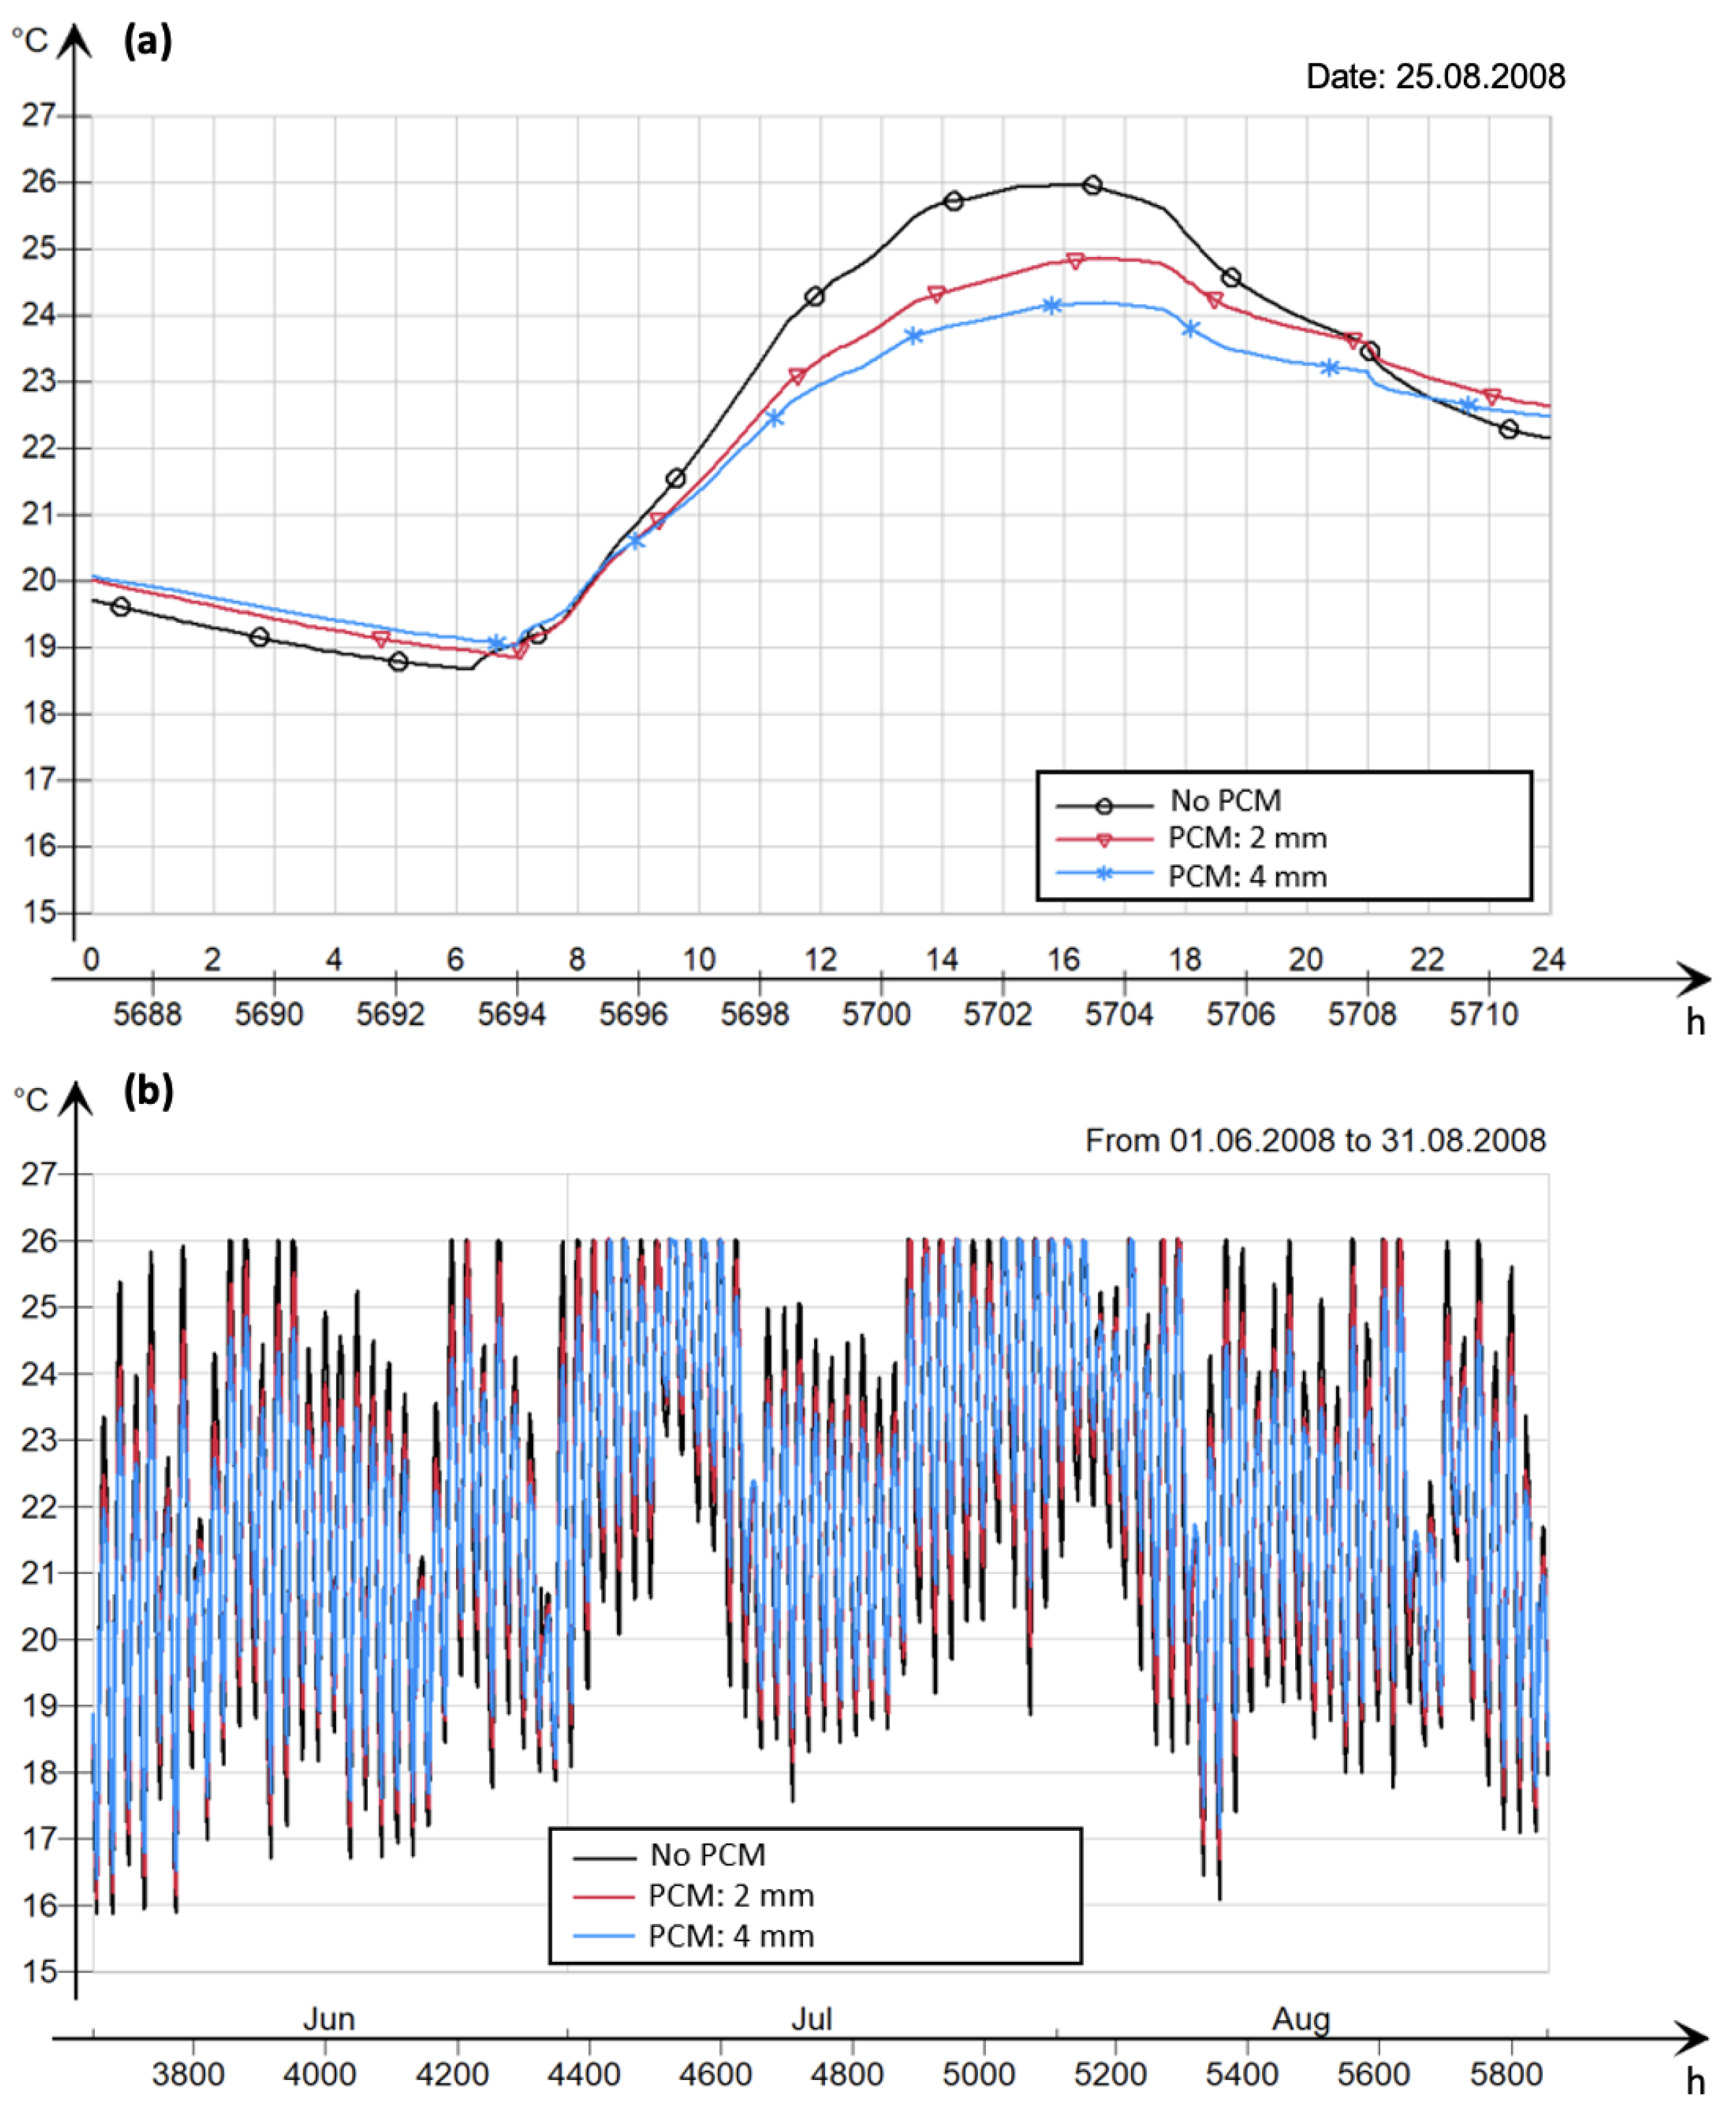
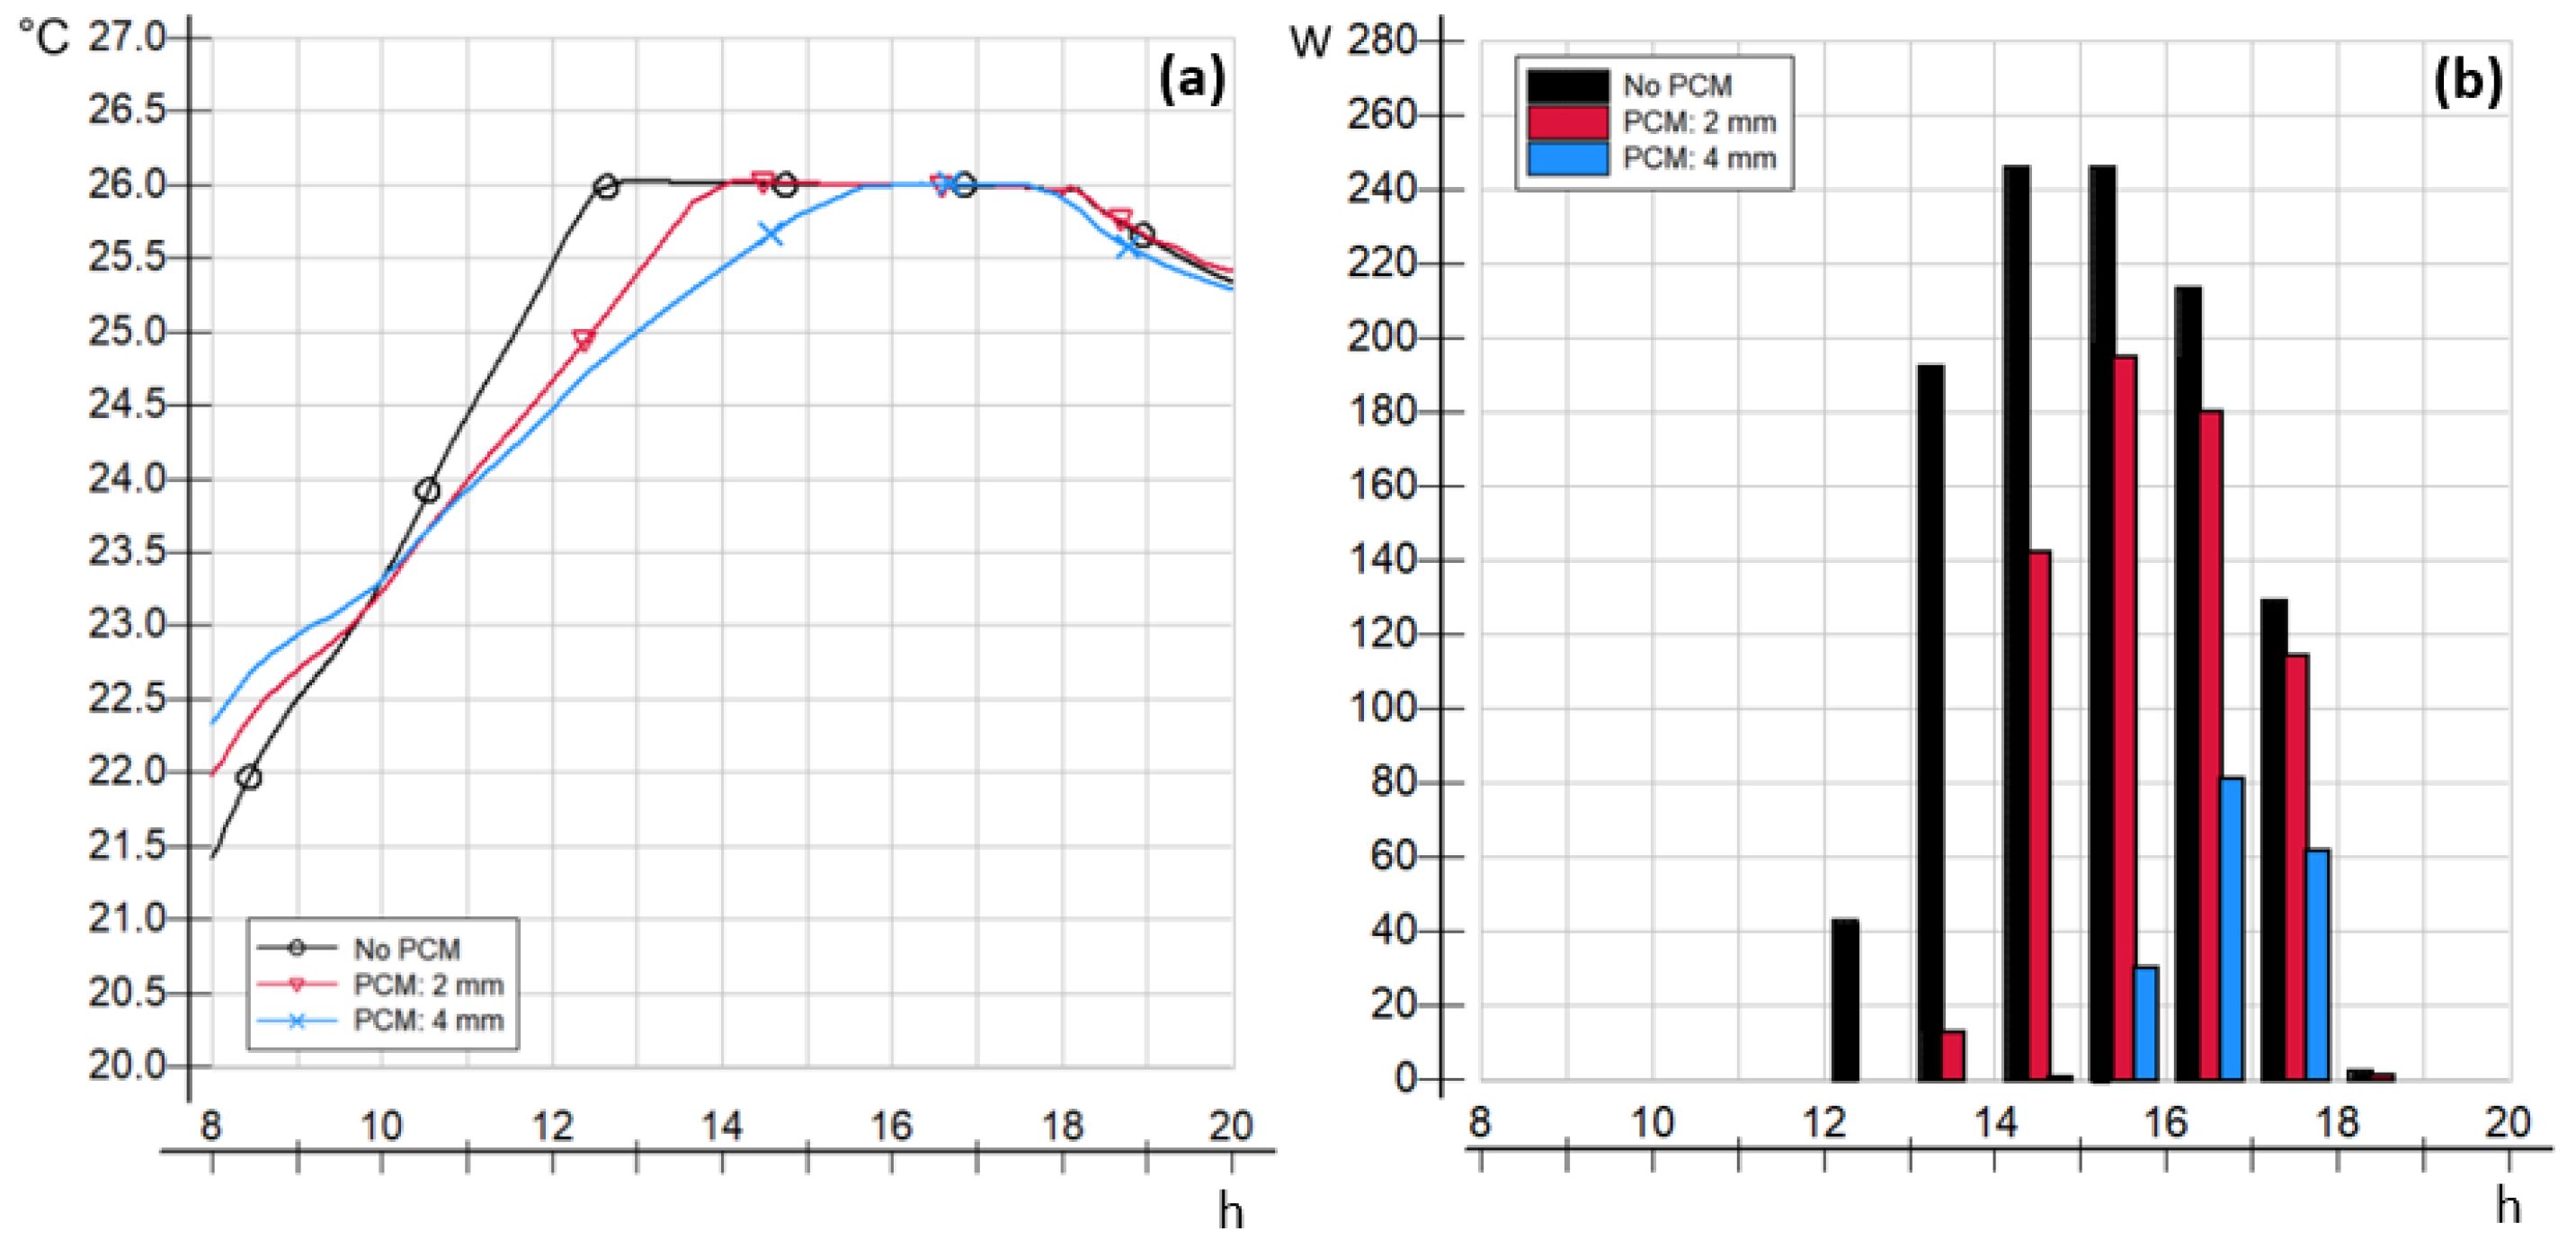
The dynamics of the indoor OT of the representative cubicle is depicted in Figure 7a,b. As expected, a significant cooling effect during night times is observed for the case of “NV without PCM spackling” owing to the effect of NV alone. It can be realised that the mechanical cooling starts operating when OT reaches 26 °C arising from the control strategy. The presence of PCM evidently contributes to additional temperature reduction and one can notice a delay of the occurrence of the peak temperature (≈1 h for both cases with PCM layer thickness of 2 mm and 4 mm). The maximum reduction of temperature is found to be ≈1.1 °C and ≈1.9 °C with increasing thickness of the PCM layers. In Figure 7b, it can be seen that the effect is consistent for the whole simulated period, where daily variations in the OT is noticeably attenuated by the PCM. Also, with the increase in the thickness of the PCM layer a narrower band of high and low temperature peaks is formed across the simulation period. This reveals the effectiveness of the PCM, essentially augmenting the thermal mass and inertia of the buildings to resist temperature fluctuations.

3.2. Cooling Load Reduction

Due to the attenuation effect to the temperature profile, cooling load needed to maintain the thermal comfort is also reduced. When mechanical cooling is activated, all excessive heat in the cubicle must be removed to stop further temperature rise. By delaying the occurrence of the peak temperature to later in the day, the heat gains inside the cubicle can be considerably less which reduces the required mechanical cooling load. A scenario illustrating this is depicted in Figure 8 for a typical day when 26 °C OT is reached, and mechanical cooling is activated. In Figure 8a, it can be seen that the setpoint temperature is reached at a later time in the day, for higher thickness of the PCM layers. The cooling load is significantly reduced progressively from 2 mm to 4 mm thickness of the PCM (see Figure 8b) and this is in accordance with the delay of the associated peak temperature. Note that the cooling load reduction is dependent on several factors like (i) the total heat gain on a particular day, (ii) quality of the charging of the PCM achieved by the NV and (iii) capability of the PCM to shift the peak temperature. Although the scenario depicted in the figure is typical, a couple of days with extreme climatic conditions is observed during the simulation period where the PCM would not function as desired. This is due to a combination of high outdoor temperatures at night leading to inadequate discharge of the stored heat of PCMs, and the prevailing conditions of high outdoor temperatures and solar gain on the following day. In this scenario, no cooling benefit is obtained.
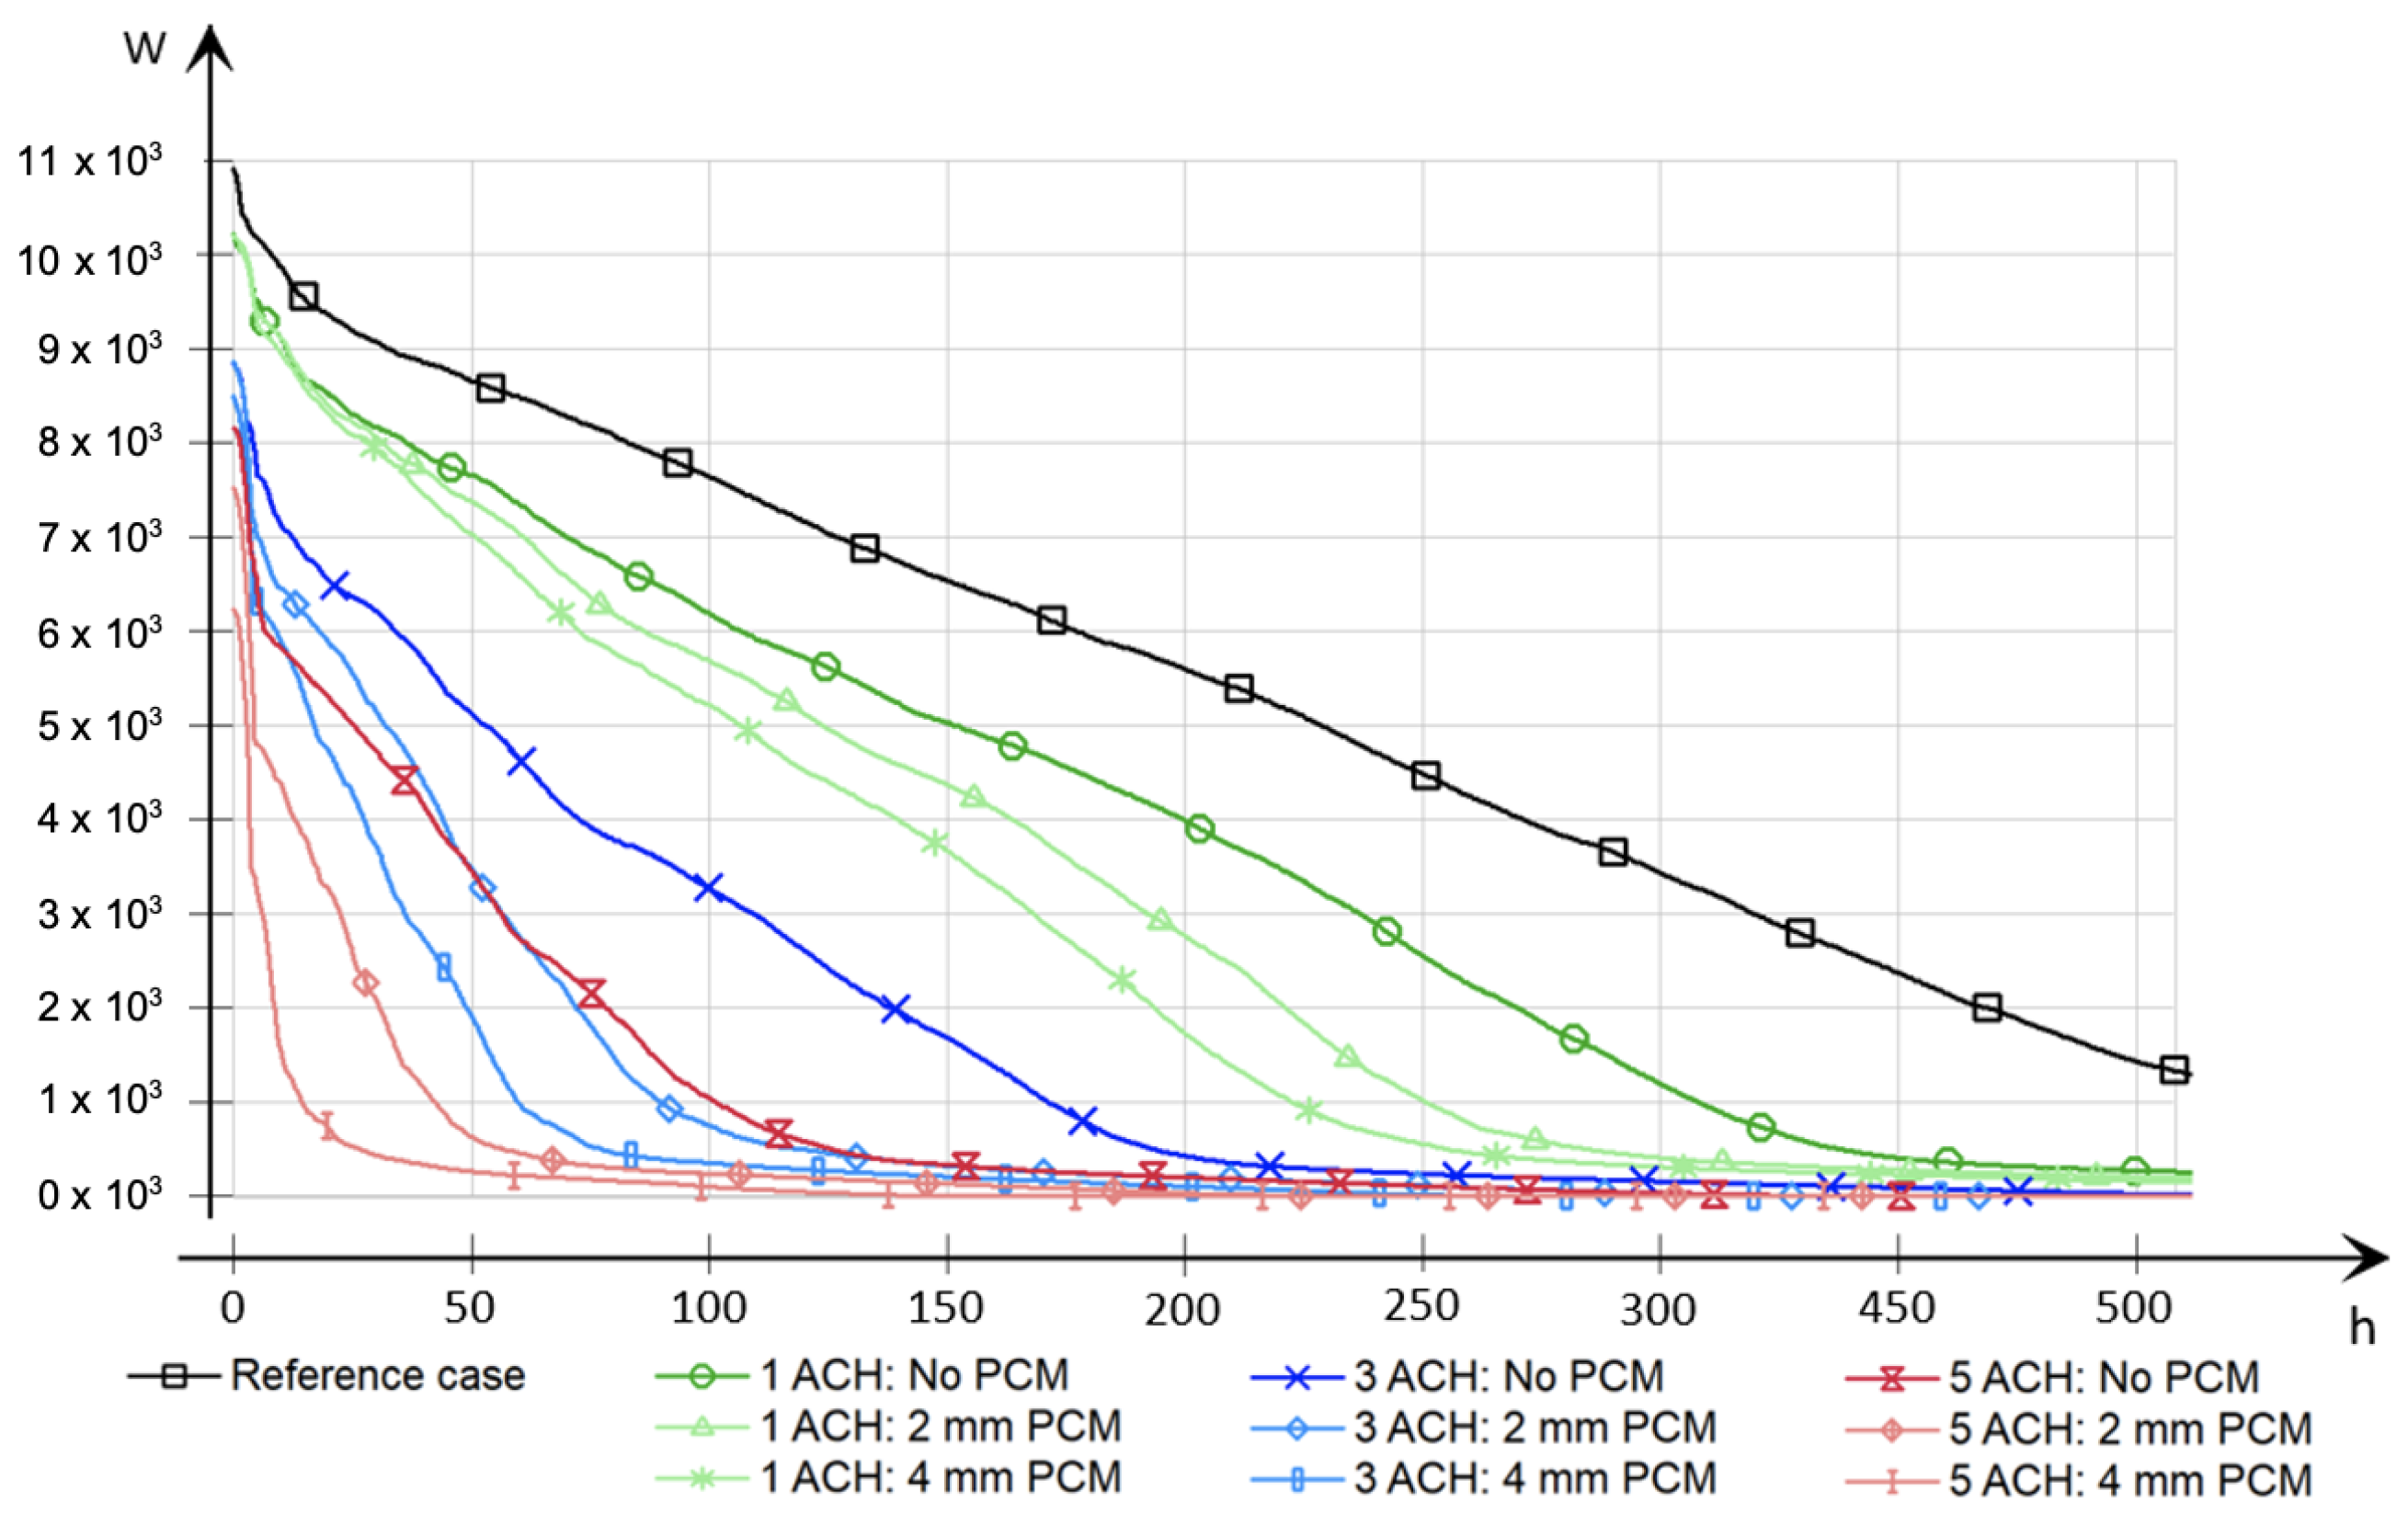
Figure 9 shows a cooling load duration diagram for the whole building, comparing the reference case with the cases of hybrid NV at 1, 3 and 5 ACH with and without PCM. The diagram shows the amount of hours a given magnitude of total cooling load is applied to the building. The extreme climatic scenario mentioned above is the reason for the curves being nearly adjoined close to the Y-axis. However, it is a well established procedure to not size the buildings cooling load capacity for the extreme peaks that occur only on rare occasions, but rather allow for a certain amount of over temperature hours. Disregarding the few hours closest to the Y-axis in the figure, it is clear that increase in the air flow rates of NV reduces the peak cooling load for the building significantly. This is in accordance with the findings of Solgi et al. [34], showing a less cooling load demand of the building when the air flow rates are increased.
Moreover, the addition of the PCM to the NV strategies brings a notable boost to the load reduction and the PCM is more effective at higher air flow rates. For example, limiting the buildings cooling load capacity to the 50 hour mark (see Figure 9), NV alone can reduce the cooling load by 11.5% at 1 ACH, 40.2% at 3 ACH and 59.8% at 5 ACH. Incorporating 4 mm of PCM, further reduction up to 19.5%, 78.2% and 95.5% respectively can be achieved. Indeed, the results show that the PCM can provide significant improvements to the cooling load demand of buildings in contrast to only having NV. This can provide some new insights as previous studies of PCM with NV usually report the results as a combined system. The works in [34,35,41] reported total cooling load reduction in the range of 24.3–53.8%, but the numerical results are not directly comparable as they are highly linked to the type of PCMs and other various factors. However, the mentioned studies reported significant impact from NV and the PCM which is inline with this study.

3.3. Cooling Energy Reduction

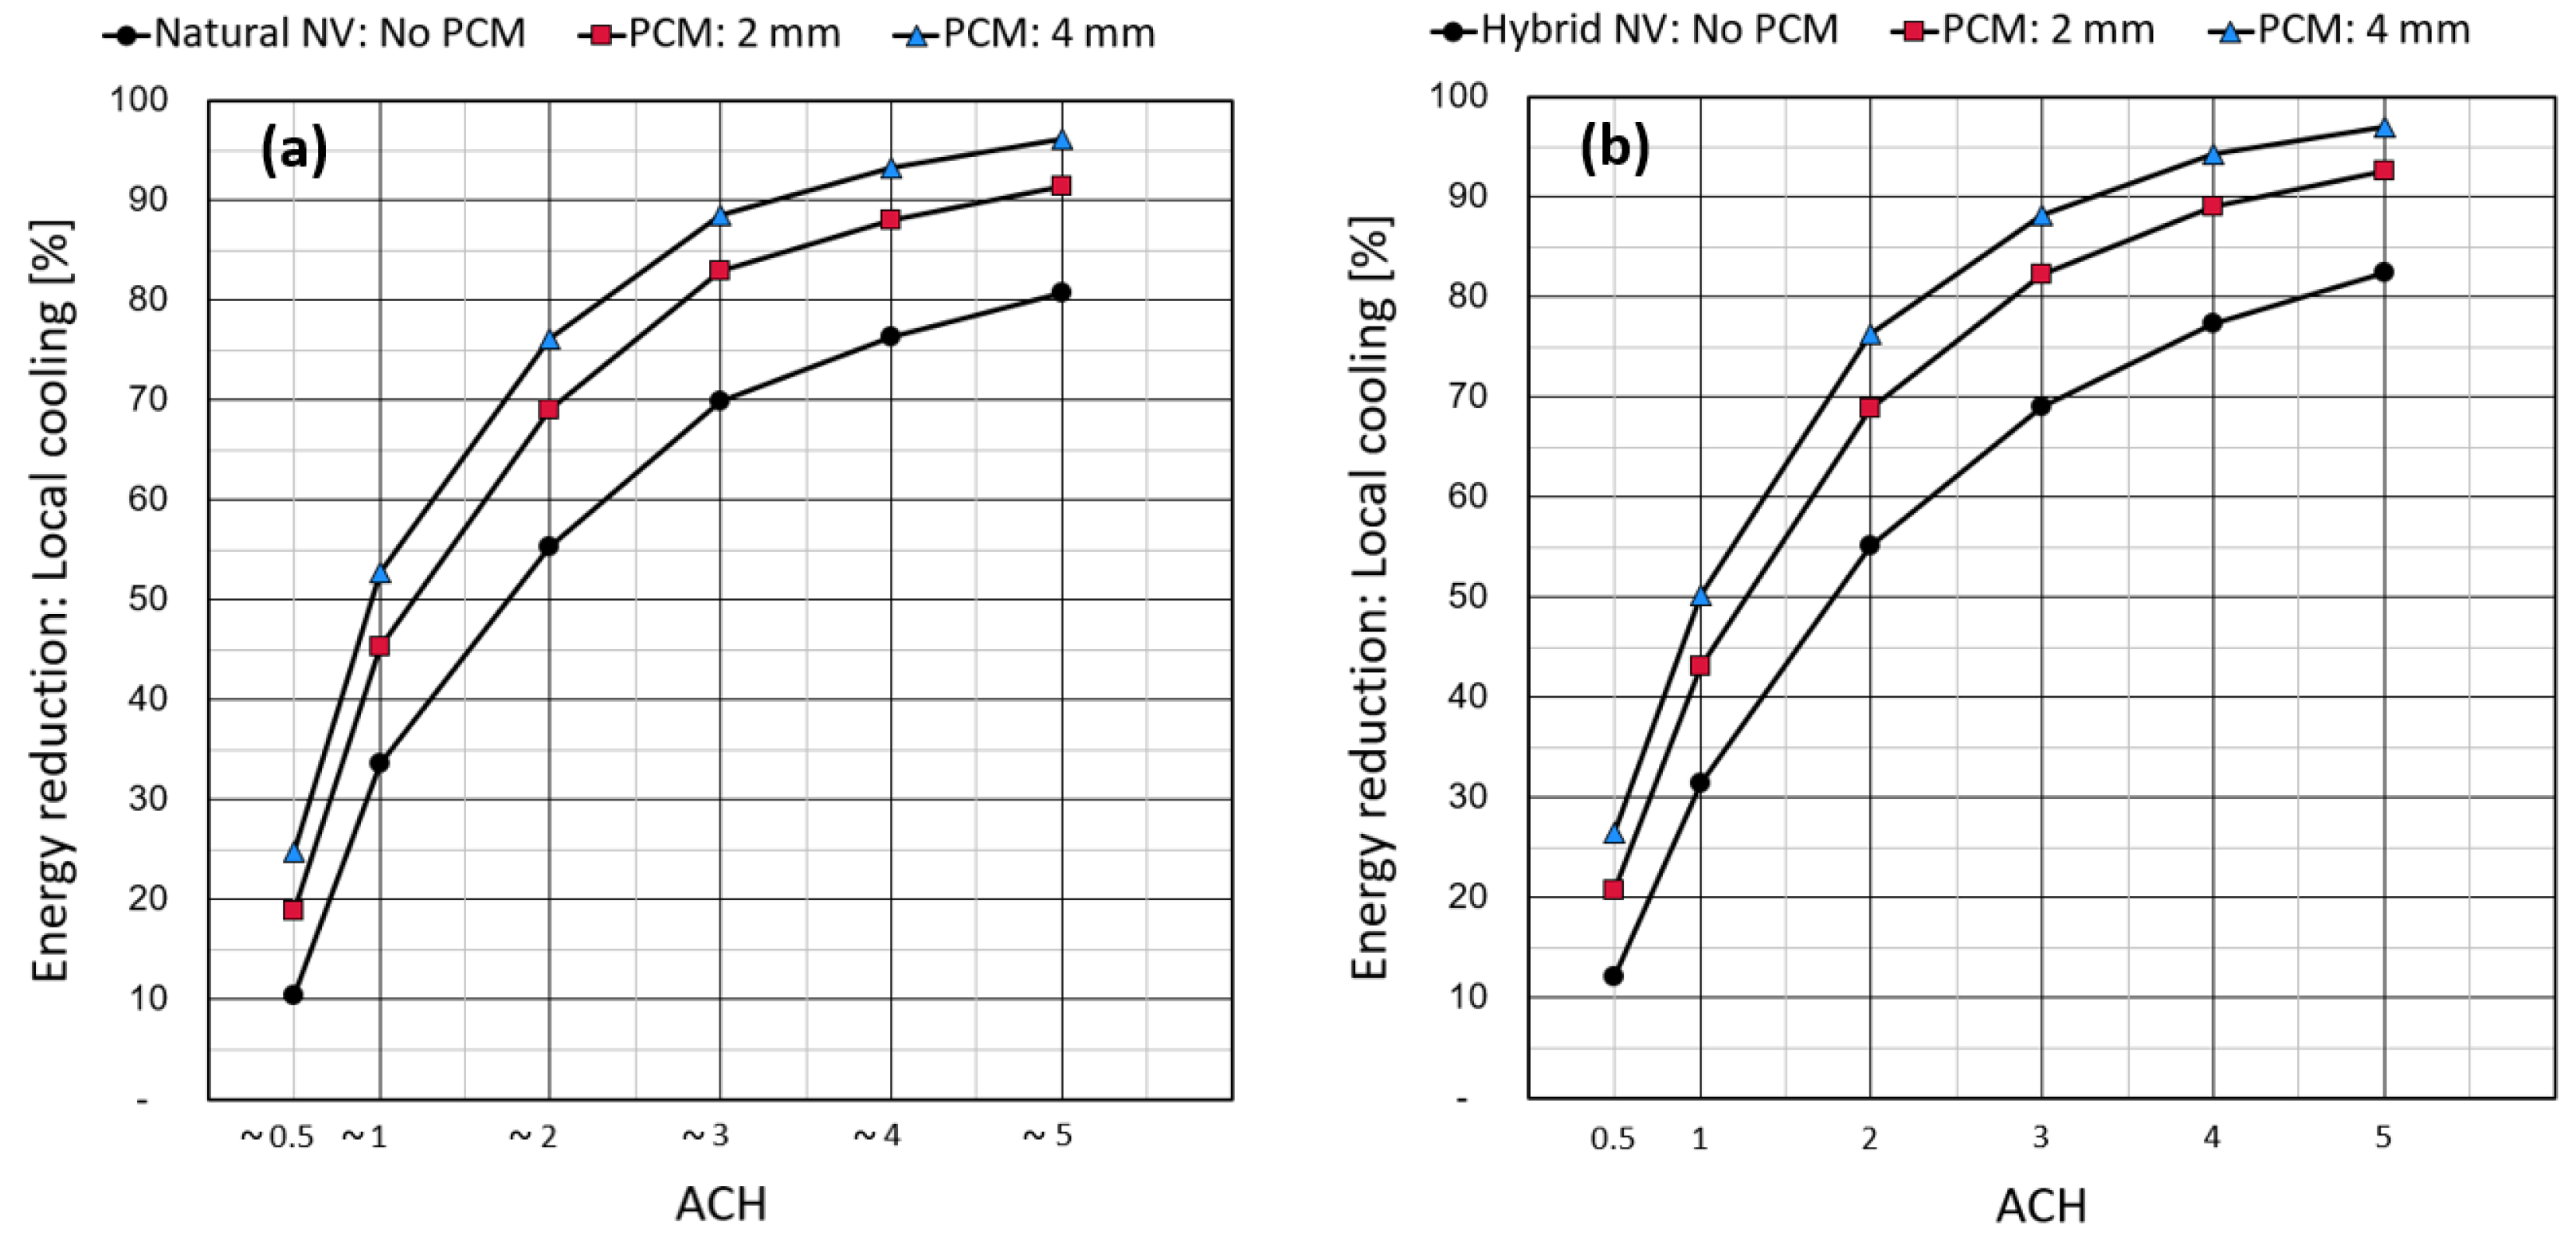
In Figure 10, the energy saved for cooling (see Equation (1)) during the simulation period is shown for both NV strategies. Only the energy spent locally by the ideal coolers in the cubicles are regarded in these calculations. Both the natural and hybrid strategy show nearly identical results as approximately equal air flow rates are maintained for these strategies to have a good comparative basis. It can be seen that increase in the air flow rates during NV increases the potential for energy savings considerably. As for the case of 5 ACH, ≈80% reduction is achieved from NV alone without any PCM. A further increased value, ≈95% is obtained when NV is coupled with 4 mm PCM. Clearly, the slopes of the curves decrease with the increase of ACH and the curves tend to saturate asymptotically. Also, above an air flow rate of 4 ACH, the additional benefits become much smaller. Furthermore, it can be seen that the NV alone is the main contributor to the energy savings, but the PCM adds notable benefits to the savings. At 4 ACH, 2 mm of PCM adds ≈12% of energy savings to the NV, while 4 mm adds ≈17%. The maximum benefit from the PCM occurs at 2 ACH where 2 mm of the PCM adds ≈14% and 4 mm adds ≈21%.
The results correspond well with numerous studies that have confirmed NV air-flow rates and the amount of thermal mass to be some of the key parameters for effective NV [26,27,30,32,49]. Indeed, this is apparent in our results as the energy saved for cooling increases both with higher NV air flow rates and thicker layers of PCM (thermal mass). Moreover, the results are also in line with studies showing diminishing returns occurring around 4–8 ACH [29,49]. A vast amount of research have found PCMs to provide significant energy savings potential, both for heating and cooling across a wide variety of climates [12,50]. However, the results vary considerably due to the complexity of multiple parameters which influences the effectiveness of the material. Also, PCMs are developed in numerous configurations with different approaches to building implementation. It’s evident that results are heavily reliant on the parameters like, the PCM concerned, the quantity of the PCM, test setup, and the method for calculating energy savings. All of these factors are found to vary by a great deal amongst published reports. Some interesting aspects about our results is that it provides a realistic building scenario case and that it separates the impact of the PCM from the accompanied strategy that is needed to cool the PCM at night. Building engineers needs to solve both energy efficiency and thermal comfort requirements, which are usually conflicting goals. These results can be of great value as the case building is aligned with the local energy efficiency criteria, and the results give a comparative basis for the engineer to evaluate different methods to achieve thermal comfort during summer conditions.
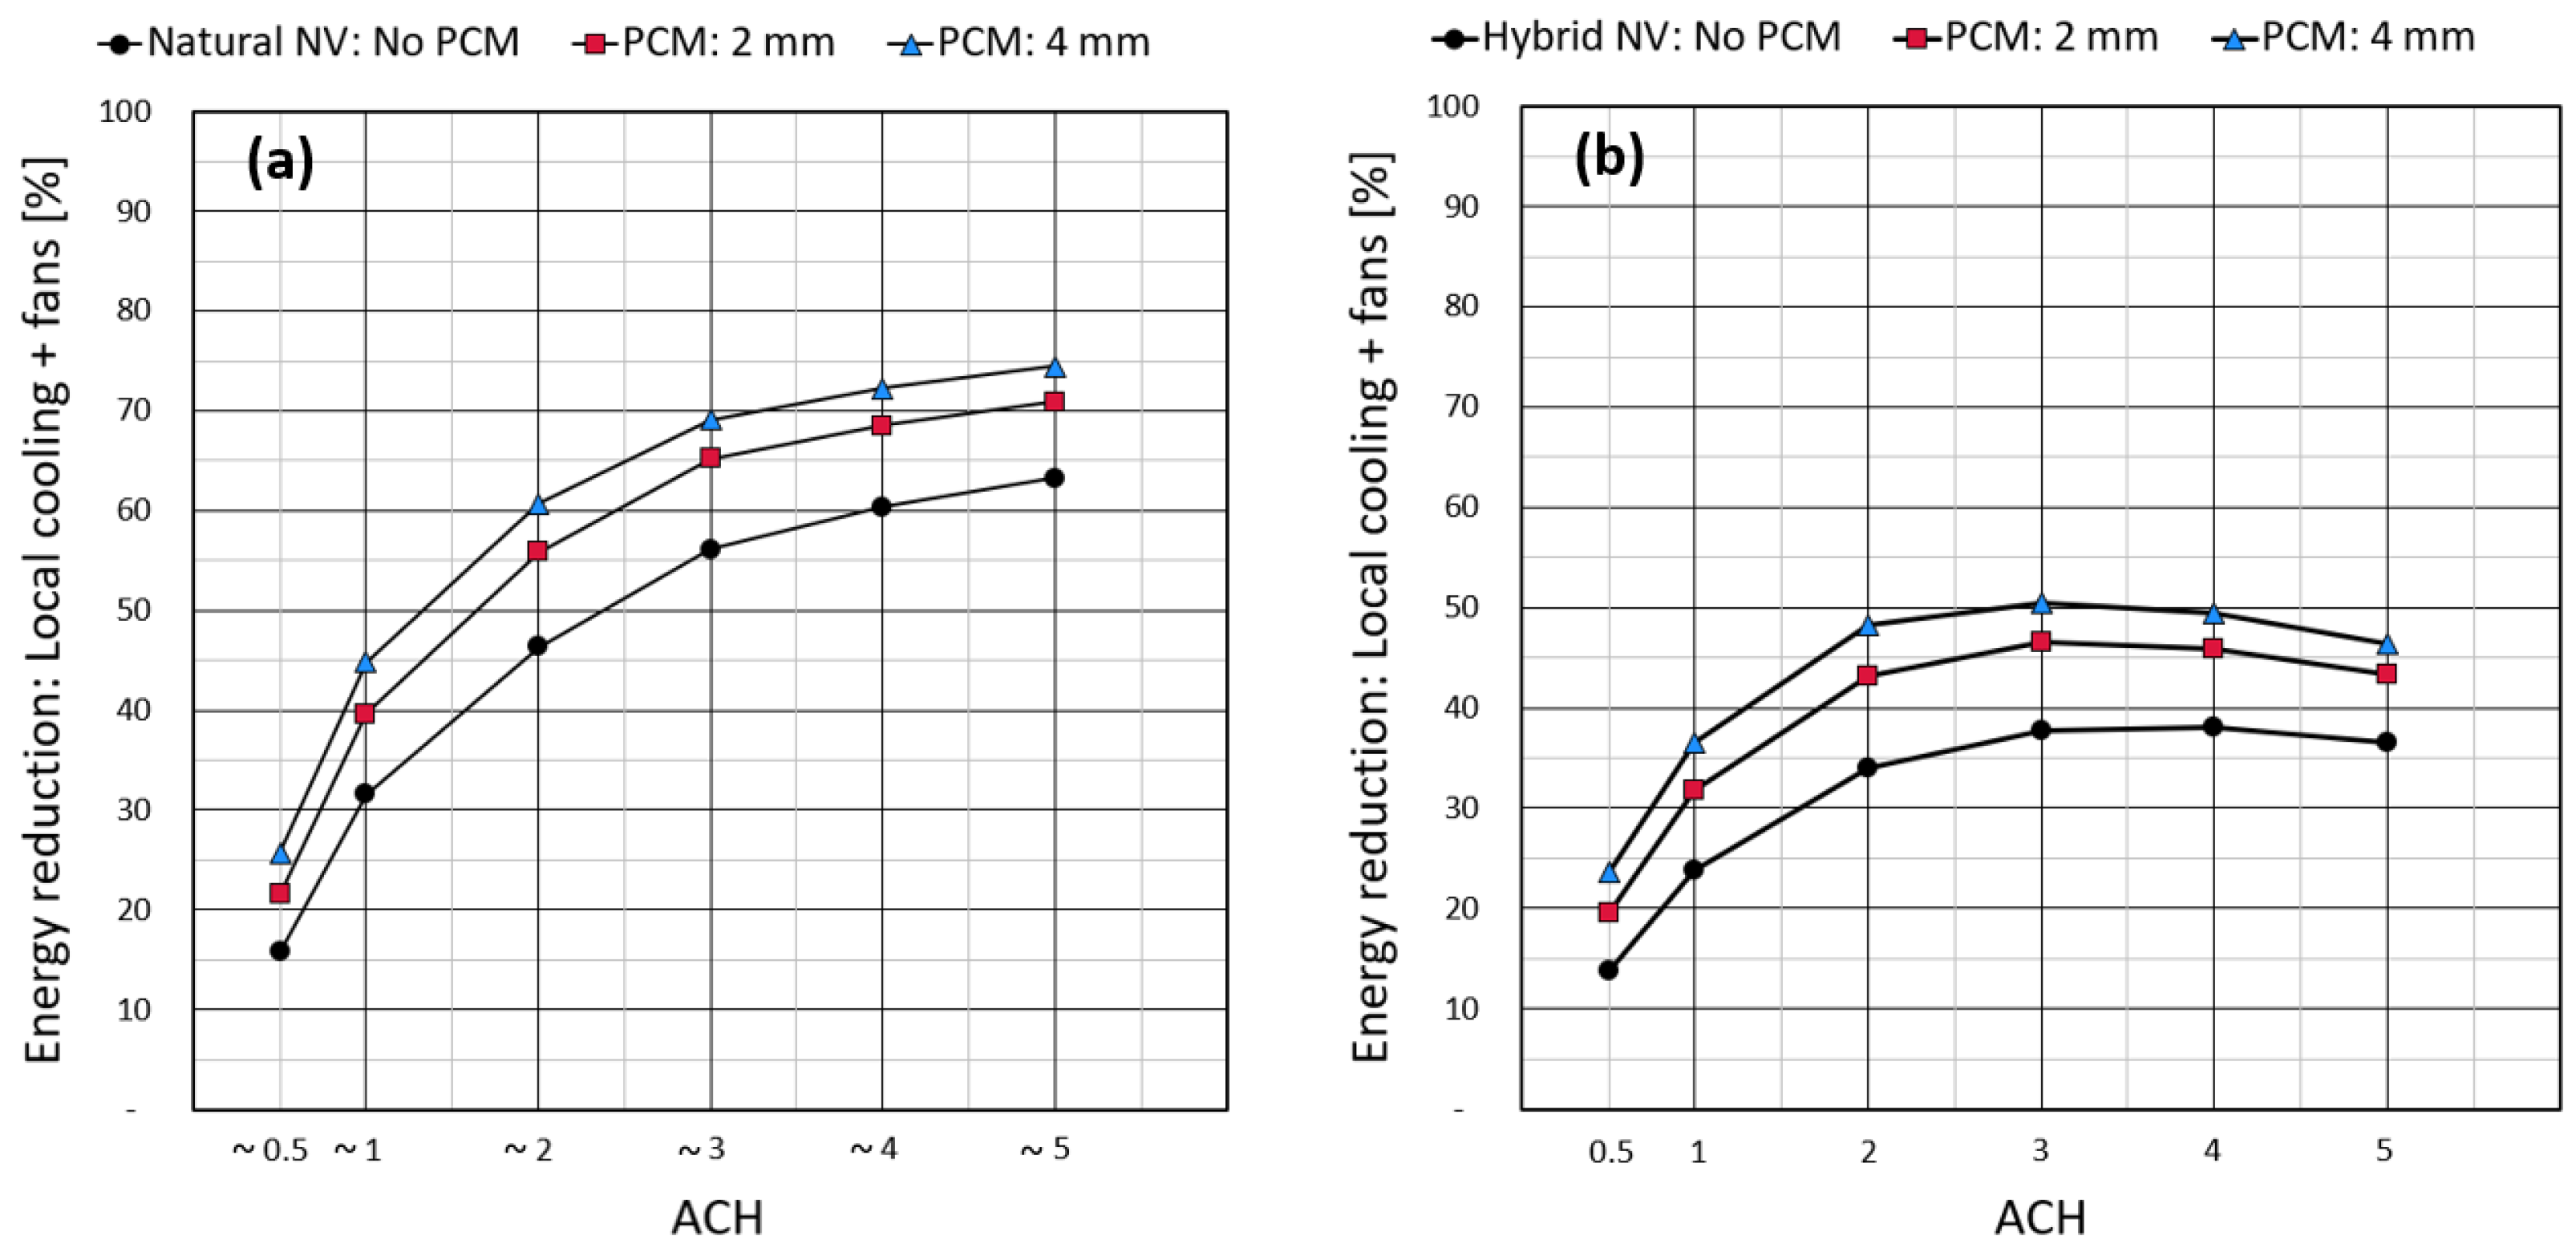
Although both strategies are equally effective in reducing the local cooling demand, Equation (2) is used to calculate the cooling energy savings with all energy posts affected by the strategies. The AHU fans are found to be dominant in terms of their energy expenditure besides the mechanical cooling. The main downside with hybrid NV is the increasing energy usage for fans with increasing air flow rates. With natural ventilation, all fans can be shut off which is an additional bonus compared to the baseline case where the CAV system runs through the night at low air flow rates. Figure 11 shows the results for both strategies.
The natural NV strategy shows the similar tendency as before but the total energy savings are lower when fan usage is included into the fraction (see Equation (2)). Comparing the two cases, it can be seen that natural NV saves more energy for all air flow rates except for the very lowest of 0.5 ACH where they are almost equal. On this basis, it’s apparent that the natural NV case provides the best energy efficiency and should be the preferred strategy if both solutions are equally feasible to implement in a building. Moreover, the total energy savings are decreasing after 3 ACH for the hybrid NV strategy (see Figure 11b). It can also be seen that it’s not worthwhile to increase the airflow rates more than 2 ACH for this strategy, as the total energy savings are reaching a saturated value more quickly before starting to reduce. The results show the effect where energy usage by fans eventually catches up with the energy savings for cooling which is also found in other studies, although the air flow rate at which the drop off occurs varies [27,51]. An important parameter that comes into play is the specific fan power (SFP) of the ventilation system. An energy efficient system with a low SFP can delay this effect. These calculations show a limitation of hybrid NV systems compared to fully passive systems, but there are more aspects that can be analyzed with the hybrid system. It may be desirable to reduce the cooling power load for a building even if the maximum energy savings are not achieved. Higher air flow rates and more PCM was shown previously to be very effective for this measure.

4. Conclusions

This study set out to investigate how a novel spackle material enhanced with microencapsulated PCM could improve thermal behaviour and cooling energy performance in an office building in a temperate cold climate during the summer. The studied application of the material is in the range of 2–4 mm on walls and ceiling surfaces in office cubicles coupled with NV as a strategy to charge the PCM during night time. The results reveal that although being applied only in thin layers it yields a significant boost to the thermal inertia of the environment, slowing down and reducing the indoor temperature development throughout the hot period of the day. This leads to better thermal comfort for the occupants by reducing the operative temperature, and also reducing the cooling load and energy requirement to maintain thermal comfort in buildings.
The analysis revealed that the application of 2 mm and 4 mm PCM spackling in each cubicle could contribute to a maximum of ≈14% and ≈21% additional energy savings for local cooling, respectively. These values are in addition to the very effective NV strategies which boosted the total energy savings to 70–95% from 2–5 ACH. However, going beyond 4 ACH gives diminishing returns in energy savings. When considering the total change in delivered energy to the building, we found that the natural strategy is more beneficial for energy savings for all the studied air flow rates, except for the very low air flow rate of 0.5 ACH where both strategies are equally effective. This is due to the ever increasing energy consumption of the exhaust fan in the hybrid strategy, and it is proven not to be worthwhile to pursue air flow rates higher than 2 ACH for this strategy. The energy savings would in fact start to decrease for the hybrid strategy when going beyond 3 ACH.
Overall, this study found that both PCM technology and NV strategies can contribute significantly to reduce the cooling demand and improve energy efficiency for office buildings in cold temperate climates. The high diurnal temperature variation during the summer is advantageous for utilizing NV and thus improve phase transition cycles of the PCM. The PCM spackling concerned in this study having a melting range of 20–24 °C is suitable for this climate, and the intended application of thin layers at inner building surfaces is favourable for heat exchange with the PCM. The authors recommend further work to investigate the effectiveness of the PCM at increasing layer thickness and perform multi-objective optimization considering different design parameters. In Figure 10 and Figure 11, it can be seen that increasing the PCM layer from 2 mm to 4 mm yields less returns in energy savings compared to the difference between no PCM and 2 mm PCM. This might indicate that the latent heat storage potential of the PCM is not fully exploited with 4 mm PCM in this case study. The methodology mentioned in [28] for calculating PCM effectiveness can be a helpful method to correctly size the amount of PCM for a given building scenario. The PCM spackle can also be investigated with buildings geared towards passive house and nearly zero emission building (NZEB) standards as these thermal environments are known to have challenges with high indoor temperatures during the summer season. Use of PCMs in residential buildings will also be of interest, as the NV strategies designed in this study are better suited for commercial buildings that are vacant during nighttime.
Author Contributions

Conceptualization, A.A.; formal analysis, A.A.; investigation, A.A.; writing–original draft preparation, A.A. and A.C.; writing–review and editing, A.A., A.C. and H.B.M. supervision, T.A.V., H.B.M. and A.C.; project administration, T.A.V., H.B.M. and A.C. All authors have read and agreed to the published version of the manuscript.

Funding

This research received no external funding.

Institutional Review Board Statement

Not applicable.

Informed Consent Statement

Not applicable.

Data Availability Statement

The data presented in this study are available on request from the corresponding author.

Acknowledgments

This study investigated a novel spackling material supplied by Gyproc (Saint-Gobain, Sweden AB) and the authors greatly appreciate the successful collaboration with Ebenezer Twumasi Afriyie and Håkan Söderblom of Gyproc. The authors greatly acknowledge the contribution of Chakkrit Phengphan (Master’s Student, 2020) during the experiments. The authors would also like to thank Øystein Anderson (Senior Engineer) and Ernst Erik Hempel (Staff Engineer) of OsloMet for their support during the experimental work as a part of this manuscript.

Conflicts of Interest

The authors declare no conflict of interest.

Abbreviations

The following abbreviations are used in this manuscript:
ACAir conditioning
ACHAir changes per hour
AHUAir handling unit
CAVConstant air volume
DSCDifferential scanning calorimetry
EUEuropean Union
HVACHeating, ventilation, and air conditioning
IDA-ICEIDA Indoor Climate and Energy
IEAInternational Energy Agency
NZEBNearly Zero Emission Building
MPCMMicroencapsulated phase-change material
NVNight ventilation
OTOperative temperature
PCMPhase-change material
SFPSpecific fan power
TESThermal energy systems
UNUnited Nations

References

  1. Adoption of the Paris Agreement. United Nations/Framework Convention on Climate Change; Adoption of the Paris Agreement: Paris, France, 2015. [Google Scholar]
  2. IEA. Global Status Report for Buildings and Construction 2019. Available online: https://www.iea.org/reports/global-status-report-for-buildings-and-construction-2019 (accessed on 5 February 2021).
  3. European Commission. A Clean Planet for All. A European Strategic Long-Term Vision for a Prosperous, Modern, Competitive and Climate Neutral Economy. 2018. Available online: https://eur-lex.europa.eu/legal-content/EN/TXT/?uri=CELEX%3A52018DC0773 (accessed on 5 February 2021).
  4. Casini, M. Smart Buildings: Advanced Materials and Nanotechnology to Improve Energy-Efficiency and Environmental Performance; Woodhead Publishing: Sawston, UK, 2016. [Google Scholar]
  5. Baetens, R.; Jelle, B.P.; Gustavsen, A. Phase change materials for building applications: A state-of-the-art review. Energy Build. 2010, 42, 1361–1368. [Google Scholar] [CrossRef] [Green Version]
  6. Madessa, H.B. A review of the performance of buildings integrated with Phase change material: Opportunities for application in cold climate. Energy Procedia 2014, 62, 318–328. [Google Scholar] [CrossRef] [Green Version]
  7. Akeiber, H.; Nejat, P.; Majid, M.Z.A.; Wahid, M.A.; Jomehzadeh, F.; Zeynali Famileh, I.; Calautit, J.K.; Hughes, B.R.; Zaki, S.A. A review on phase change material (PCM) for sustainable passive cooling in building envelopes. Renew. Sustain. Energy Rev. 2016, 60, 1470–1497. [Google Scholar] [CrossRef]
  8. Vik, T.A.; Madessa, H.B.; Aslaksrud, P.; Folkedal, E.; Øvrevik, O.S. Thermal performance of an office cubicle integrated with a bio-based PCM: Experimental analyses. Energy Procedia 2017, 111, 609–618. [Google Scholar] [CrossRef]
  9. Balaras, C.A. The role of thermal mass on the cooling load of buildings. An overview of computational methods. Energy Build. 1996, 24, 1–10. [Google Scholar] [CrossRef]
  10. Soares, N.; Costa, J.J.; Gaspar, A.R.; Santos, P. Review of passive PCM latent heat thermal energy storage systems towards buildings’ energy efficiency. Energy Build. 2013, 59, 82–103. [Google Scholar] [CrossRef]
  11. Waqas, A.; Ud Din, Z. Phase change material (PCM) storage for free cooling of buildings—A review. Renew. Sustain. Energy Rev. 2013, 18, 607–625. [Google Scholar] [CrossRef]
  12. Souayfane, F.; Fardoun, F.; Biwole, P.H. Phase change materials (PCM) for cooling applications in buildings: A review. Energy Build. 2016, 129, 396–431. [Google Scholar] [CrossRef]
  13. Osterman, E.; Tyagi, V.; Butala, V.; Rahim, N.; Stritih, U. Review of PCM based cooling technologies for buildings. Energy Build. 2012, 49, 37–49. [Google Scholar] [CrossRef]
  14. Kalnæs, S.E.; Jelle, B.P. Phase change materials and products for building applications: A state-of-the-art review and future research opportunities. Energy Build. 2015, 94, 150–176. [Google Scholar] [CrossRef] [Green Version]
  15. Feldman, D.; Banu, D.; Hawes, D.; Ghanbari, E. Obtaining an energy storing building material by direct incorporation of an organic phase change material in gypsum wallboard. Sol. Energy Mater. 1991, 22, 231–242. [Google Scholar] [CrossRef]
  16. Athienitis, A.; Liu, C.; Hawes, D.; Banu, D.; Feldman, D. Investigation of the thermal performance of a passive solar test-room with wall latent heat storage. Build. Environ. 1997, 32, 405–410. [Google Scholar] [CrossRef]
  17. Neeper, D. Thermal dynamics of wallboard with latent heat storage. Sol. Energy 2000, 68, 393–403. [Google Scholar] [CrossRef]
  18. Zhang, H.; Xu, Q.; Zhao, Z.; Zhang, J.; Sun, Y.; Sun, L.; Xu, F.; Sawada, Y. Preparation and thermal performance of gypsum boards incorporated with microencapsulated phase change materials for thermal regulation. Sol. Energy Mater. Sol. Cells 2012, 102, 93–102. [Google Scholar] [CrossRef]
  19. Borreguero, A.M.; Carmona, M.; Sanchez, M.L.; Valverde, J.L.; Rodriguez, J.F. Improvement of the thermal behaviour of gypsum blocks by the incorporation of microcapsules containing PCMS obtained by suspension polymerization with an optimal core/coating mass ratio. Appl. Therm. Eng. 2010, 30, 1164–1169. [Google Scholar] [CrossRef]
  20. Kuznik, F.; Virgone, J.; Noel, J. Optimization of a phase change material wallboard for building use. Appl. Therm. Eng. 2008, 28, 1291–1298. [Google Scholar] [CrossRef] [Green Version]
  21. Kuznik, F.; Virgone, J. Experimental assessment of a phase change material for wall building use. Appl. Energy 2009, 86, 2038–2046. [Google Scholar] [CrossRef] [Green Version]
  22. Butala, V.; Stritih, U. Experimental investigation of PCM cold storage. Energy Build. 2009, 41, 354–359. [Google Scholar] [CrossRef]
  23. Barzin, R.; Chen, J.J.J.; Young, B.R.; Farid, M.M. Application of PCM energy storage in combination with night ventilation for space cooling. Appl. Energy 2015, 158, 412–421. [Google Scholar] [CrossRef]
  24. Raj, V.A.A.; Velraj, R. Review on free cooling of buildings using phase change materials. Renew. Sustain. Energy Rev. 2010, 14, 2819–2829. [Google Scholar] [CrossRef]
  25. Solgi, E.; Hamedani, Z.; Fernando, R.; Skates, H.; Orji, N.E. A literature review of night ventilation strategies in buildings. Energy Build. 2018, 173, 337–352. [Google Scholar] [CrossRef]
  26. Geros, V.; Santamouris, M.; Tsangrasoulis, A.; Guarracino, G. Experimental evaluation of night ventilation phenomena. Energy Build. 1999, 29, 141–154. [Google Scholar] [CrossRef]
  27. Solgi, E. Experimental and Numerical Investigations of Phase Change Material and Night Ventilation Characteristics in Buildings. Ph.D. Thesis, Griffith University, Brisbane, Australia, 2019. [Google Scholar]
  28. Evola, G.; Marletta, L.; Sicurella, F. A methodology for investigating the effectiveness of PCM wallboards for summer thermal comfort in buildings. Build. Environ. 2013, 59, 517–527. [Google Scholar] [CrossRef]
  29. Evola, G.; Marletta, L. The Effectiveness of PCM Wallboards for the Energy Refurbishment of Lightweight Buildings. Energy Procedia 2014, 62, 13–21. [Google Scholar] [CrossRef] [Green Version]
  30. Zhou, G.; Yang, Y.; Wang, X.; Zhou, S. Numerical analysis of effect of shape-stabilized phase change material plates in a building combined with night ventilation. Appl. Energy 2009, 86, 52–59. [Google Scholar] [CrossRef]
  31. Liu, J.; Liu, Y.; Yang, L.; Liu, T.; Zhang, C.; Dong, H. Climatic and seasonal suitability of phase change materials coupled with night ventilation for office buildings in Western China. Renew. Energy 2020, 147, 356–373. [Google Scholar] [CrossRef]
  32. Wang, Z.; Yi, L.; Gao, F. Night ventilation control strategies in office buildings. Sol. Energy 2009, 83, 1902–1913. [Google Scholar] [CrossRef]
  33. Roach, P.; Bruno, F.; Belusko, M. Modelling the cooling energy of night ventilation and economiser strategies on façade selection of commercial buildings. Energy Build. 2013, 66, 562–570. [Google Scholar] [CrossRef]
  34. Solgi, E.; Fayaz, R.; Kari, B.M. Cooling load reduction in office buildings of hot-arid climate, combining phase change materials and night purge ventilation. Renew. Energy 2016, 85, 725–731. [Google Scholar] [CrossRef]
  35. Rathore, P.K.S.; Shukla, S.K. An experimental evaluation of thermal behavior of the building envelope using macroencapsulated PCM for energy savings. Renew. Energy 2020, 149, 1300–1313. [Google Scholar] [CrossRef]
  36. Zhou, G.; Yang, Y.; Xu, H. Energy performance of a hybrid space-cooling system in an office building using SSPCM thermal storage and night ventilation. Sol. Energy 2011, 85, 477–485. [Google Scholar] [CrossRef]
  37. Gholamibozanjani, G.; Farid, M. Application of an active PCM storage system into a building for heating/cooling load reduction. Energy 2020, 210, 118572. [Google Scholar] [CrossRef]
  38. Castell, A.; Martorell, I.; Medrano, M.; Pérez, G.; Cabeza, L.F. Experimental study of using PCM in brick constructive solutions for passive cooling. Energy Build. 2010, 42, 534–540. [Google Scholar] [CrossRef]
  39. Mi, X.; Liu, R.; Cui, H.; Memon, S.A.; Xing, F.; Lo, Y. Energy and economic analysis of building integrated with PCM in different cities of China. Appl. Energy 2016, 175, 324–336. [Google Scholar] [CrossRef]
  40. Ascione, F.; Bianco, N.; De Masi, R.F.; de’ Rossi, F.; Vanoli, G.P. Energy refurbishment of existing buildings through the use of phase change materials: Energy savings and indoor comfort in the cooling season. Appl. Energy 2014, 113, 990–1007. [Google Scholar] [CrossRef]
  41. Diaconu, B.M.; Cruceru, M. Novel concept of composite phase change material wall system for year-round thermal energy savings. Energy Build. 2010, 42, 1759–1772. [Google Scholar] [CrossRef]
  42. Soares, N.; Reinhart, C.F.; Hajiah, A. Simulation-based analysis of the use of PCM-wallboards to reduce cooling energy demand and peak-loads in low-rise residential heavyweight buildings in Kuwait. Build. Simul. 2017, 10, 481–495. [Google Scholar] [CrossRef]
  43. Vik, T.A.; Madessa, H.B.; Chaudhuri, A.; Aamodt, A.; Phengphan, C.; Afriyie, E.T. Experimental and numerical studies on thermal performance of an office cubicle having gypsum boards coated with PCM-enhanced spackling. In Proceedings of the International Conference Organised by IBPSA-Nordic, 13th–14th October 2020; OsloMet; BuildSIM-Nordic 2020; Selected Papers; SINTEF Academic Press: Oslo, Norway, 2020. [Google Scholar]
  44. Saint-Gobain. Sweden AB. Available online: https://www.gyproc.se/ (accessed on 5 February 2021).
  45. DIBK. Regulations on Technical Requirements for Construction Works. Available online: https://dibk.no/globalassets/byggeregler/regulation-on-technical-requirements-for-construction-works–technical-regulations.pdf (accessed on 5 February 2021).
  46. IDA Indoor Climate and Energy. 2013. Available online: http://www.equa.se/en/ida-ice/ (accessed on 5 February 2021).
  47. ISO. ISO 8990:1994 Thermal Insulation—Determination of Steady-State Thermal Transmission Properties—Calibrated and Guarded Hot Box. Available online: https://www.iso.org/standard/16519.html (accessed on 5 February 2021).
  48. Hawlader, M.N.A.; Uddin, M.S.; Khin, M.M. Microencapsulated PCM thermal-energy storage system. Appl. Energy 2003, 74, 195–202. [Google Scholar] [CrossRef]
  49. Artmann, N.; Manz, H.; Heiselberg, P. Parameter study on performance of building cooling by night-time ventilation. Renew. Energy 2008, 33, 2589–2598. [Google Scholar] [CrossRef]
  50. Nghana, B.; Tariku, F. Phase change material’s (PCM) impacts on the energy performance and thermal comfort of buildings in a mild climate. Build. Environ. 2016, 99, 221–238. [Google Scholar] [CrossRef]
  51. Lain, M.; Hensen, J. The optimization of the mechanical night cooling system in the office building. In Proceedings of the 6th International Conference on Compressors and Coolants, Casta Papiernicka, Slovakia, 27–29 September 2006. [Google Scholar]
Figure 1. DSC output curve for heating of PCM sample (Data provided by Scanscap [44]).
Applsci 11 01472 g001
Figure 2. Climate chamber of the experimental study [43].
Applsci 11 01472 g002
Figure 3. Comparison of average air temperature between experiment and simulation. (a) Without PCM, (b) With PCM.
Applsci 11 01472 g003
Figure 4. Office building modelled in IDA-ICE.
Applsci 11 01472 g004
Figure 5. Layout of a cubicle and the adjacent hallway and technical space. The design is repeated for all neighbouring cubicles. Dimensions are in mm. (a) Plan view. (b) Section view.
Applsci 11 01472 g005
Figure 6. Outdoor air temperature during the simulation period.
Applsci 11 01472 g006
Figure 7. Indoor operative temperature of a representative cubicle. Case: Hybrid NV, 3 ACH. (a) Maximum observed temperature reduction on a single day. (b) The whole simulated period.
Applsci 11 01472 g007
Figure 8. Cooling load reduction for a representative cubicle on a typical day. Case: Hybrid NV, 3 ACH. (a) Operative temperature development. (b) Hourly average mechanical cooling load.
Applsci 11 01472 g008
Figure 9. Cooling load duration diagram for the whole building. Cases of 1, 3 and 5 ACH with and without PCM are compared to the reference case.
Applsci 11 01472 g009
Figure 10. Energy reduction for local cooling in the building. (a) Natural NV strategy. (b) Hybrid NV strategy.
Applsci 11 01472 g010
Figure 11. Total energy reduction for the building. (a) Natural NV strategy. (b) Hybrid NV strategy.
Applsci 11 01472 g011
Table 1. PCM’s impact on cooling performance.
ReferenceType of StudyLocationPCM ConfigurationResultsCooling Strategy
[34]NumericalYazd, IranPCM integrated into29.6–53.8% cooling load reductionNV
building envelope47% energy reduction
[35]ExperimentalMathura, IndiaMacroencapsulated PCM38.8% cooling load reductionNV
integrated into building envelope
[37]ExperimentalAuckland, New ZealandMacroencapsulated PCM10.0–30.4% energy reductionAC
in active storage system
[38]ExperimentalLleida, SpainMacroencapsulated PCM15% energy reductionHeat pump
integrated into building envelope
[40]NumericalMediterranean citiesPCM incorporated plaster2.5–7.2% energy reductionNV
on exterior surfaces
[39]NumericalChinese citiesPCM incorporated7.7–12.9% energy reductionAC
mortar walls
[41]NumericalBéchar, AlgeriaPCM integrated24.3% cooling load reductionNone
wallboards1% energy reduction
[23]ExperimentalAuckland, New ZealandPCM integrated76–92% energy reductionNV
wallboards
[36]NumericalBeijing, ChinaPCM integrated76% energy reductionNV
wallboards
[42]NumericalFarwaniya, KuwaitPCM integrated5–7% cooling load reductionNone
wallboards5% energy reduction
Table 2. Thermal properties of the PCM spackling.
PropertyValue
Density970 kg/m3
Thermal conductivity0.08 W/(m·K)
Onset melt temperature20 °C
Peak melt temperature24 °C
Table 3. Thermal properties of the building envelope.
Ext. ConstructionSurface Area [m2]U-Value [W/(m2·K)]
Walls1710.22
Roof3180.18
Windows701.20
Parameter Value
Infiltration, n 50 1.5 h−1
Thermal bridges, Ψ 0.09 W/(m2·K)
Table 4. Materials used in the office building model.
Materialρ [kg/m3]Cp [J/(kg·K)]λ [W/(m·K)]
Concrete230010501.70
Light insulation207500.036
Insulated frame wall9220100.052
Gypsum board97010900.22
Wood50023000.14
Chipboard100013000.13
Table 5. Ventilation parameters and internal heat gains.
VentilationAir Flow Rate CubiclesAir Flow Rate HallwaySupply Air Temperature
CAV low0.3 ACH/0.7 m3/(h·m2)0.3 ACH/0.7 m3/(h·m2)19 °C
CAV high2 ACH/5.4 m3/(h·m2)0.9 ACH/2.5 m3/(h·m2)19 °C
Night ventilation0.5–5 ACH0.5–5 ACHOutdoor air
Internal heat gainCubiclesHallway
Occupant1.2 Met-
Computer60 W-
Light60 W816 W
Table 6. Schedule of ventilation and internal heat gains.
Mon–FriSat–Sun
System07:00–08:0008:00–18:0018:00–21:0021:00–07:0007:00–21:0021:00–07:00
Internal heat gain
CAV low
CAV high
Night ventilation
Table 7. Simulation cases.
Simulation CasePCM LayerNight Ventilation Air Flow Rate
ReferenceNo PCMCAV low
Natural NV0, 2, 4 mm0.5, 1, 2, 3, 4, 5 ACH
Hybrid NV0, 2, 4 mm0.5, 1, 2, 3, 4, 5 ACH
Publisher’s Note: MDPI stays neutral with regard to jurisdictional claims in published maps and institutional affiliations.