Article

Thermal Effects on Photovoltaic Array Performance: Experimentation, Modeling, and Simulation

1
Department of Mechanical Engineering, California State University, Los Angeles, CA 90032, USA
2
Department of Mechanical Engineering, 5151 State University Dr, Los Angeles, CA 90032, USA
3
CanmetENERGY, Integration of Renewable and Distributed Energy Resources 1615 Boulevard Lionel-Boulet, Varennes, QC J3X 1S6, Canada
*
Author to whom correspondence should be addressed.
These authors contributed equally to this work.
Appl. Sci. 2021, 11(4), 1460; https://doi.org/10.3390/app11041460
Submission received: 12 January 2021 / Revised: 30 January 2021 / Accepted: 1 February 2021 / Published: 5 February 2021

Abstract

:

Featured Application

In this work, heat transfer coefficient/thermal loss factor as a function of wind was determined empirically for a photovoltaic array mounted on top of an industrial building.

Abstract

The performance of photovoltaic (PV) arrays are affected by the operating temperature, which is influenced by thermal losses to the ambient environment. The factors affecting thermal losses include wind speed, wind direction, and ambient temperature. The purpose of this work is to analyze how the aforementioned factors affect array efficiency, temperature, and heat transfer coefficient/thermal loss factor. Data on ambient and array temperatures, wind speed and direction, solar irradiance, and electrical output were collected from a PV array mounted on a CanmetENERGY facility in Varennes, Canada, and analyzed. The results were compared with computational fluid dynamics (CFD) simulations and existing results from PVsyst. The findings can be summarized into three points. First, ambient temperature and wind speed are important factors in determining PV performance, while wind direction seems to play a minor role. Second, CFD simulations found that temperature variation on the PV array surface is greater at lower wind speeds, and decreases at higher wind speeds. Lastly, an empirical correlation of heat transfer coefficient/thermal loss factor has been developed.

1. Introduction

It is well established that photovoltaic (PV) efficiency is dependent on temperature. The temperature of PV arrays is affected by factors such as ambient temperature and wind speed [1,2,3,4]. In recent years, there has been significant interest in studying the influence of the aforementioned factors on PV temperature. Although it is well known that higher temperature will negatively affect PV performance, there is no consensus on the quantitative results [1].
In general, there are three approaches to study the effects of ambient temperature and wind speed on PV temperature: wind tunnel experiments, field measurement, and simulations. In these approaches, researchers aim to determine the heat transfer coefficient directly or obtain a dimensionless Nusselt number from these experiments. A brief summary of some of the existing correlations for flat plates is shown in Table 1. Note that the purpose of Table 1 is not to provide a comprehensive review of available correlations, as a comprehensive list of equations can be found in the review work by Palyvos [5]. Rather, the purpose is to illustrate two points. First, many of these empirical correlations are based on structured equation forms (e.g., linear, power law, boundary layer equation forms) [4], and that the constants/coefficients are determined empirically. Second, these empirical constants/coefficients can differ significantly and depend on the PV orientation relative to the wind, material roughness, solar irradiance, etc. In general, these correlations can become very inaccurate once the setup deviates from the original experiment’s conditions. As a result, Sartori [6] concluded that determining an empirical equation for general application is likely not possible.
More recent studies have focused on developing models to capture the effects of tilt angle, wind direction, turbulence intensity, solar irradiance, ambient temperature on surface temperature, and subsequently, PV performance using modeling and experimentation. Mahboub et al. [4] studied the effects of tilt angle on the convective heat transfer coefficient and developed a new empirical equation based on experimental and computational fluid dynamics (CFD) results. Iakovidis and Ting [1] conducted wind tunnel experiments to quantify the influence of turbulence intensity on local and average heat transfer coefficients. Subsequently, a field experiment by Vasel and Iakovidis [13] concluded that wind direction has a significant effect on the production output of a PV solar plant. The layout of rows of PV arrays can significantly affect the turbulent intensity as air flows through the PV plant. Wu et al. [14,15] conducted wind tunnel experiments and CFD simulations to study the temperature distribution on a PV module, and the results of this work were used by Ghabuzyan et al. [16]. It was found that wind flow contributed to an increase in heat transfer on PV modules, thus leading to greater production. Ogundimu et al. [17] analyzed how solar module orientation and tilt angle can be optimized to maximize solar radiation reception. Furthermore, Bhattacharya et al. [18] and Ma et al. [19] concluded that solar irradiance and ambient temperature are key contributing factors that affect PV performance. It is interesting to note that Ma et al. examined various mathematical models to assess the ability to accurately predict the surface temperature of a solar module under varying environmental conditions. They concluded that wind velocity did not play a significant role in solar module efficiency.
Numerous thermal models have been developed to estimate the effect of heat load on temperature, and consequently, the energy yield. Goverde et al. [20] performed wind tunnel experiments that indicated that the spatial temperature variations caused by wind should be considered for accuracy yield evaluation. Prilliman et al. [21] then developed a fast transient thermal model that accounts for transient climatic conditions and thermal mass of module, which improves energy production prediction. Coskun et al. [22] proposed new correlations based on experimental data, while accounting for variations in irradiance, wind speed, and ambient temperature. These correlations can be used to predict the performance of PV systems. As previously mentioned, although generalized models remain elusive, new correlations based on reliable experimental data need to be developed as PV becomes more widely adopted and integrated with complex flow regimes and building structures.
This work aims to study a flat-roof mounted PV array on an industrial building to examine how wind speed, wind direction, and ambient temperature affect array temperature and production efficiency. A new empirical correlation fit is proposed in this work, which is not available in the literature to the best of the authors’ knowledge. These experimental results are then compared to CFD simulations, as well as an existing empirical model available in PVsyst, an industry-standard PV design package. The remainder of the paper is structured as follows: Section 2 describes the experimental setup; Section 3 discusses the thermal model used in PVsyst; Section 4 focuses on the CFD model; Section 5 summarizes the experimental and numerical results in Section 5.1 and Section 5.2, respectively.

2. Experimental Setup

This work includes data gathered from a solar array located on the roof of the CanmetENERGY facility, located in Varennes, QC, Canada as shown in Figure 1. The PV array began operation on 21 April 2018 and consists of 162 modules. The array is divided into an upper and lower rooftop system. The upper level is the array of interest in this study, and is composed of 75 modules with a total nameplate power of 18.375 kW. It consists of three separate sub-arrays connected to single-phase inverters (6.125 kWp per inverter). Two of these sub-arrays use a 5 kW SolarEdge (SE5000A-US-CAN-U) and a 5 kW Kaco (BP5002xi) inverter. The third sub-array modules are equipped with power optimizers and connected to a 5 kW SolarEdge (SE5000A-US-CAN-U) inverter. The properties of the PV array are shown in Table 2.
The data were collected and divided into two components: electrical measurements of the array and meteorological data from the rooftop weather station. Data measurement interval depended on the instrument’s response time, but most data were collected at 10-second intervals, which could then be resampled to longer periods. Meteorological data include: horizontal, direct, diffuse, and plane of array irradiance, humidity, atmospheric pressure, wind direction and speed, rain quantity, snow depth, ambient temperature, and upper array module temperatures using a thermocouple array (four sensors in total, attached on the backside of the array). AC and DC power are measured at the inverter level, as well as total energy produced by the system at the exit of the transformer. Table 3 lists the equipment that was used in this study.

3. Thermal Model

This section discusses the thermal model used in an industry-standard commercial design package, PVsyst. This thermal model describes the thermal behavior and electrical performance based on the temperature dependence of PV cells, shown in Equation (1), where η r e f is the reference efficiency of the PV array at reference temperature, T r e f , at a solar irradiance of 1000 W/m2. The temperature coefficient, β , is a material property describing the temperature dependence of PV material. If the array temperature, T a r r a y , is known, then the array efficiency, η , can be calculated.
η = η r e f ( 1 β ( T r e f T a r r a y ) )
The temperature of array can be determined by an energy balance of incident solar radiation to PV array and from PV array to the surroundings via convection and radiation. This energy balance is described in Equation (2),
U ( T a r r a y T a m b ) = α G i n c ( 1 η ) ,
where T a m b is the ambient temperature, α is the absorptivity of the PV array, and G i n c is the incident solar irradiance. U is the thermal loss factor/heat transfer coefficient (W/m2·K) and is described in Equation (3). Note that U is equivalent to h, shown in Table 1. This heat transfer coefficient/thermal loss factor is assumed to be linear, where U c is the constant component (W/m2·K) and U v is the component that relates to wind velocity (W/m2·K/(m/s)), which is represented as V (m/s). The U constants are dependent on where the solar array is located and how it is mounted. However, there is a lack of reliable data on its dependence on wind speed and direction [23]; this is especially true at higher wind speeds.
U = U c + U v ( V )
As mention previously, thermal modeling for PV applications is difficult as often not enough information is known about local air flow. Although well-established empirical correlations have been developed for heated plates undergoing convection in order to quantify the mechanisms responsible for heat transfer, they require specialized knowledge and pose a challenge for PV designers.

4. CFD Model

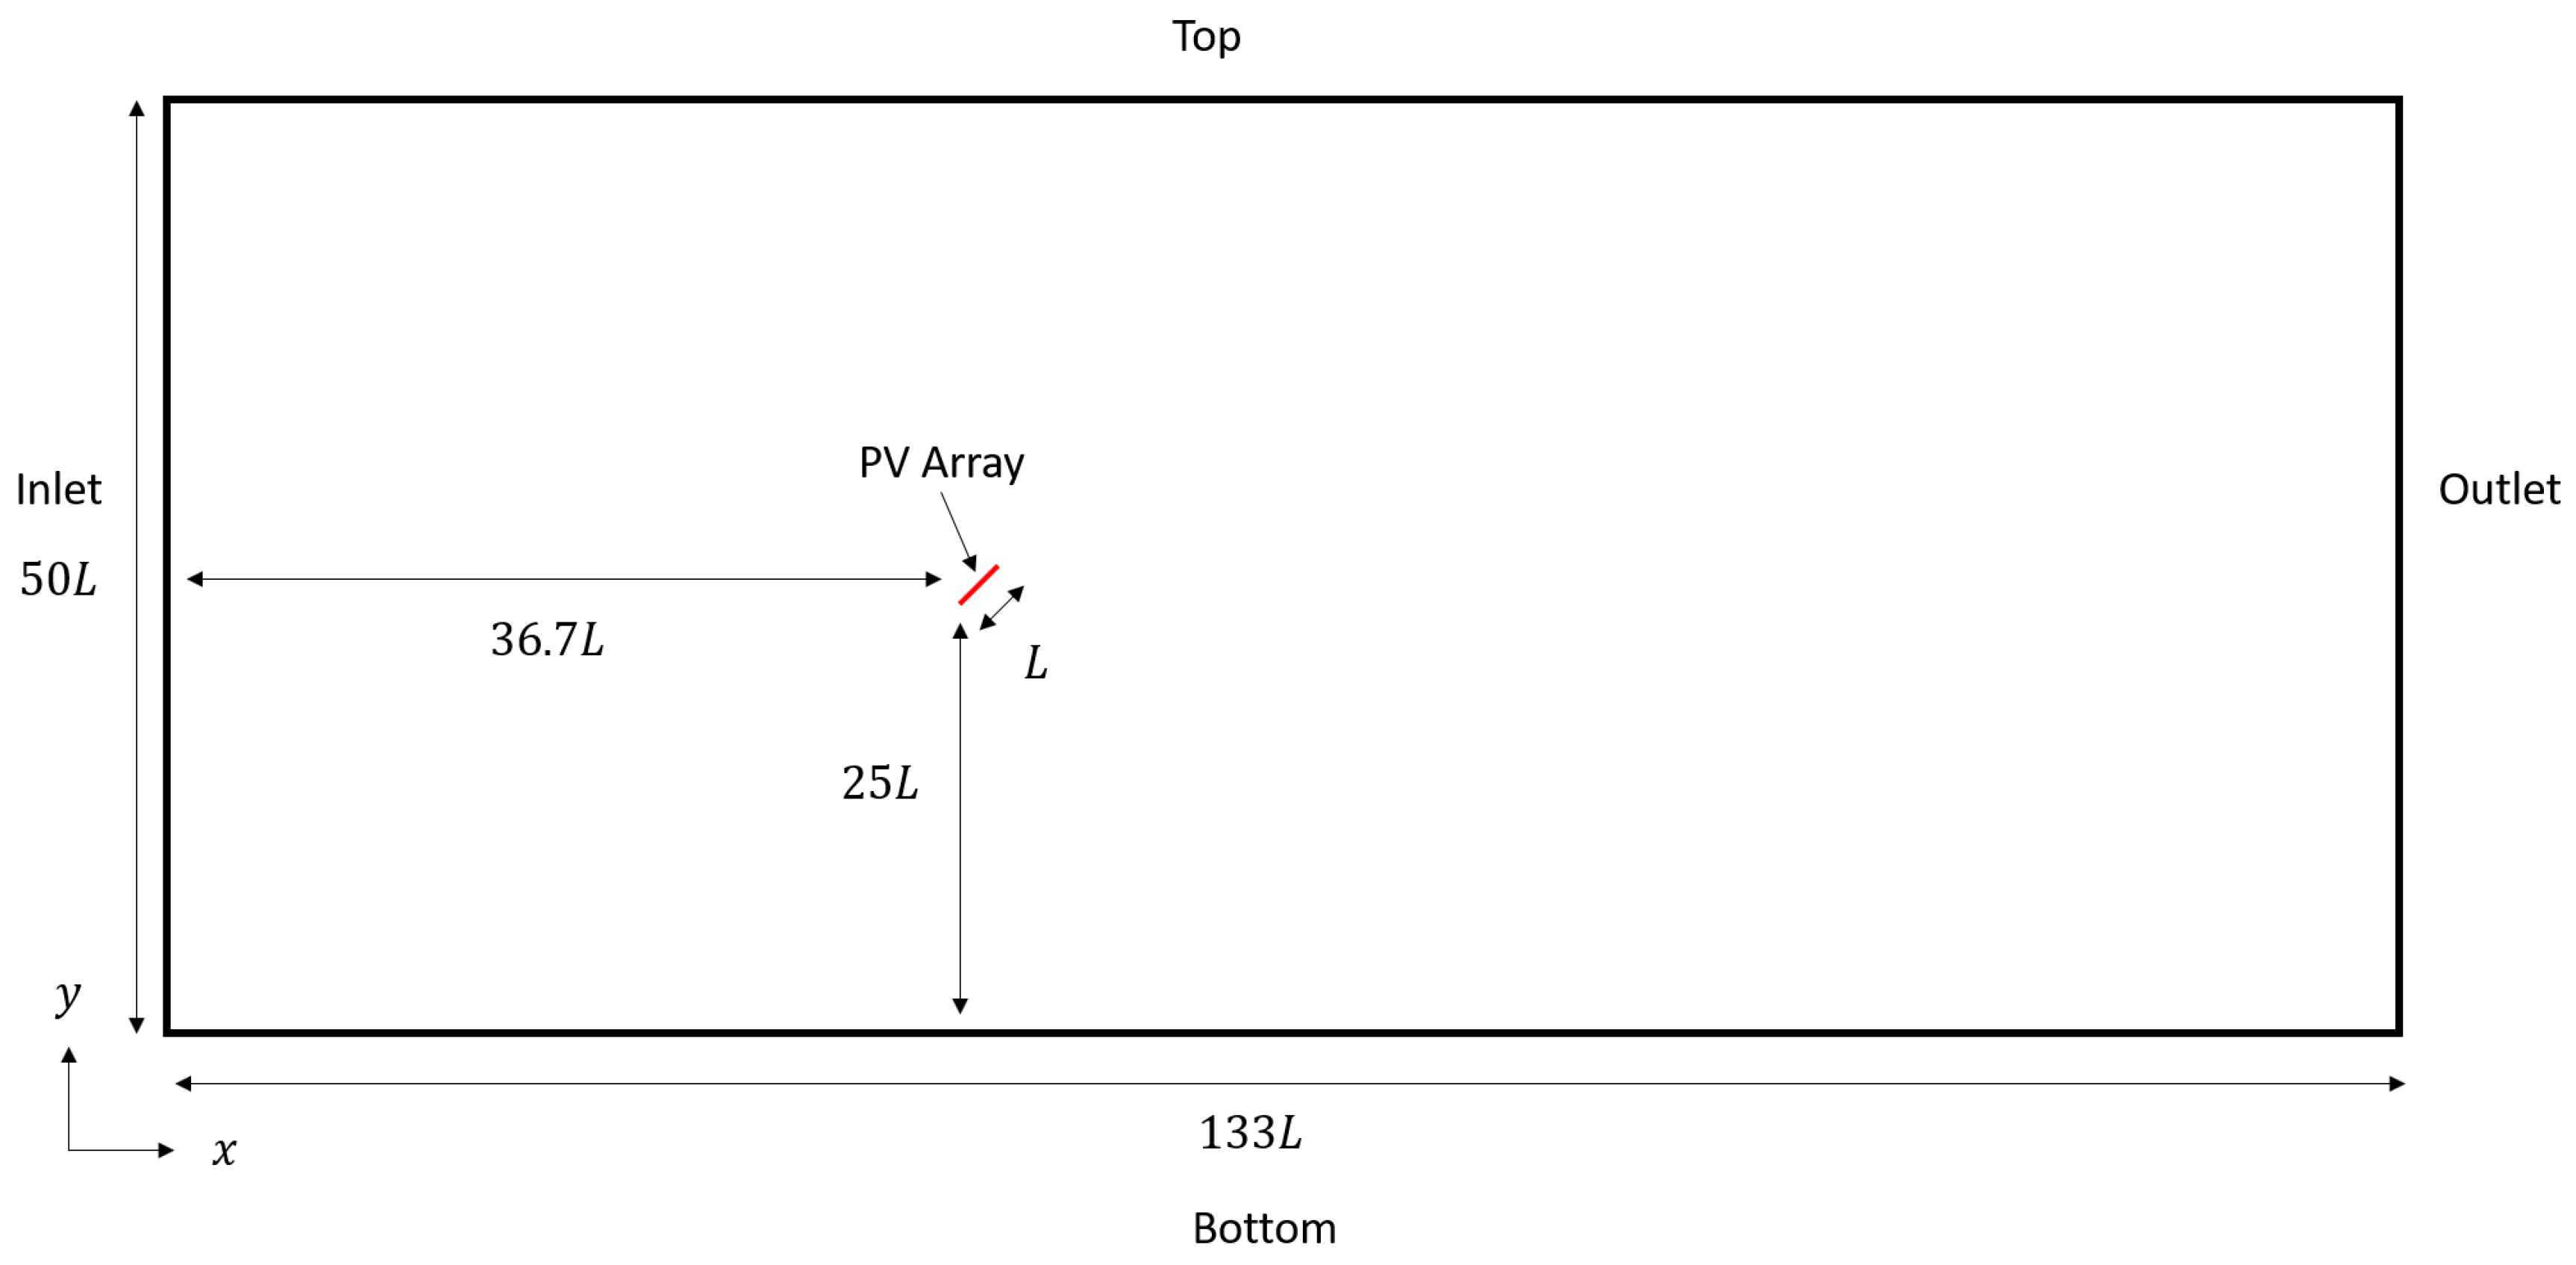
In this work, a simplified CFD model is used to study the effects of convection and radiation on PV array temperature. We consider the PV array to be two dimensional, as the third (depth) dimension of the PV array is far larger than the other two (length and thickness). The length, L, of the array is 3 m and it is 0.04 m in thickness, with a tilt angle of 45° from the x-direction. The domain is 133.3 L in the streamwise direction (x-direction) and 50 L in the vertical direction (y-direction). The PV array is placed 36.7 L downstream from the inlet and 25 L from the bottom boundary. The simulation domain is illustrated in Figure 2.
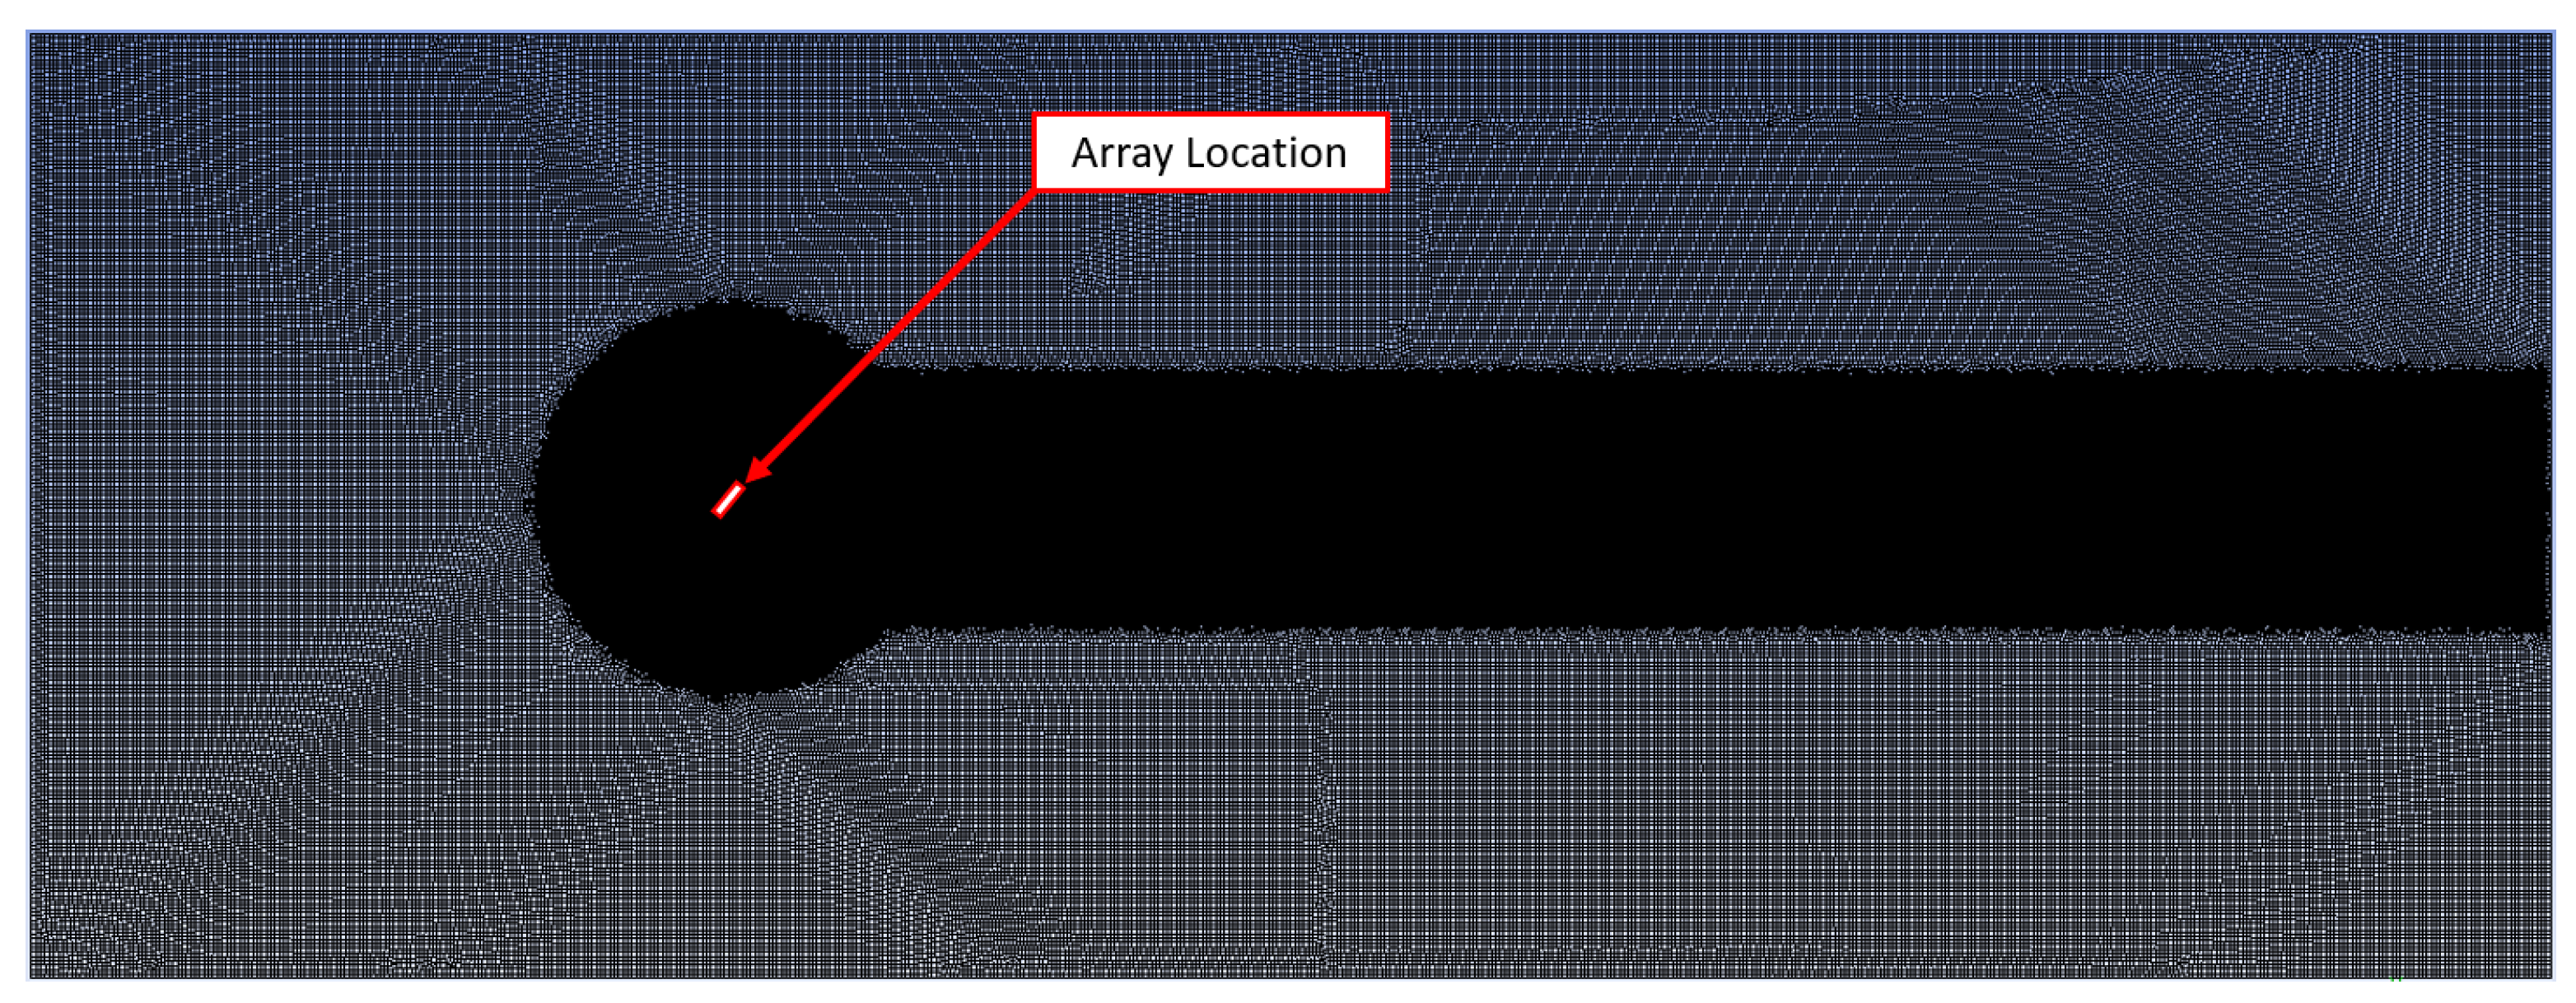
For simplicity, the model does not consider the effects of neighboring structures. The inlet boundary condition is a uniform velocity, ranging from 1 to 9 m/s at 300 K. The pressure outlet boundary condition is imposed on the outlet surface, while the top and bottom boundary conditions are inlet velocities in the streamwise direction. The top surface of the PV array experiences a heat flux of 800 W/m2. The present work was carried out using commercial CFD software, Ansys Fluent 2020, on a Dell Optiplex 780 desktop computer. We used the k ε turbulence model with the Menter Lechner wall treatment, and the P − 1 radiation model is used with a blackbody temperature of 291 K. The coupled pressure–velocity coupling scheme was used, along with pressure discretization of PRESTO!, and QUICK scheme for momentum, turbulence, and energy. Using this CFD model, we studied temperature distribution as well as the thermal loss factor/heat transfer coefficient, which are both functions of wind speed. A mesh sensitivity study was performed, shown in Table 4. A total of four meshes were used, ranging from 176 K cells to 627 K cells. It was found that the heat transfer coefficient values from Mesh 3 and Mesh 4 are consistent; thus, Mesh 3 was used in the remainder of this work to reduce computational cost. The mesh is shown in Figure 3.

5. Results

5.1. Experimental Results

This section presents the experimental results for different environmental conditions and how these conditions affect PV array performance. Wind speed, temperature, solar irradiance, and PV production data were sampled in five-minute increments during the months in which there was no snow coverage on the array. Data were collected and analyzed from June 2018 to October 2018 and from March 2019 to November 2019 with the exception of April 2019 and July 2019 due to missing data for both months. Hourly averages were computed each day from 5 a.m. to 6 p.m., excluding the early mornings and evening hours when uncertainty in solar irradiance is high.
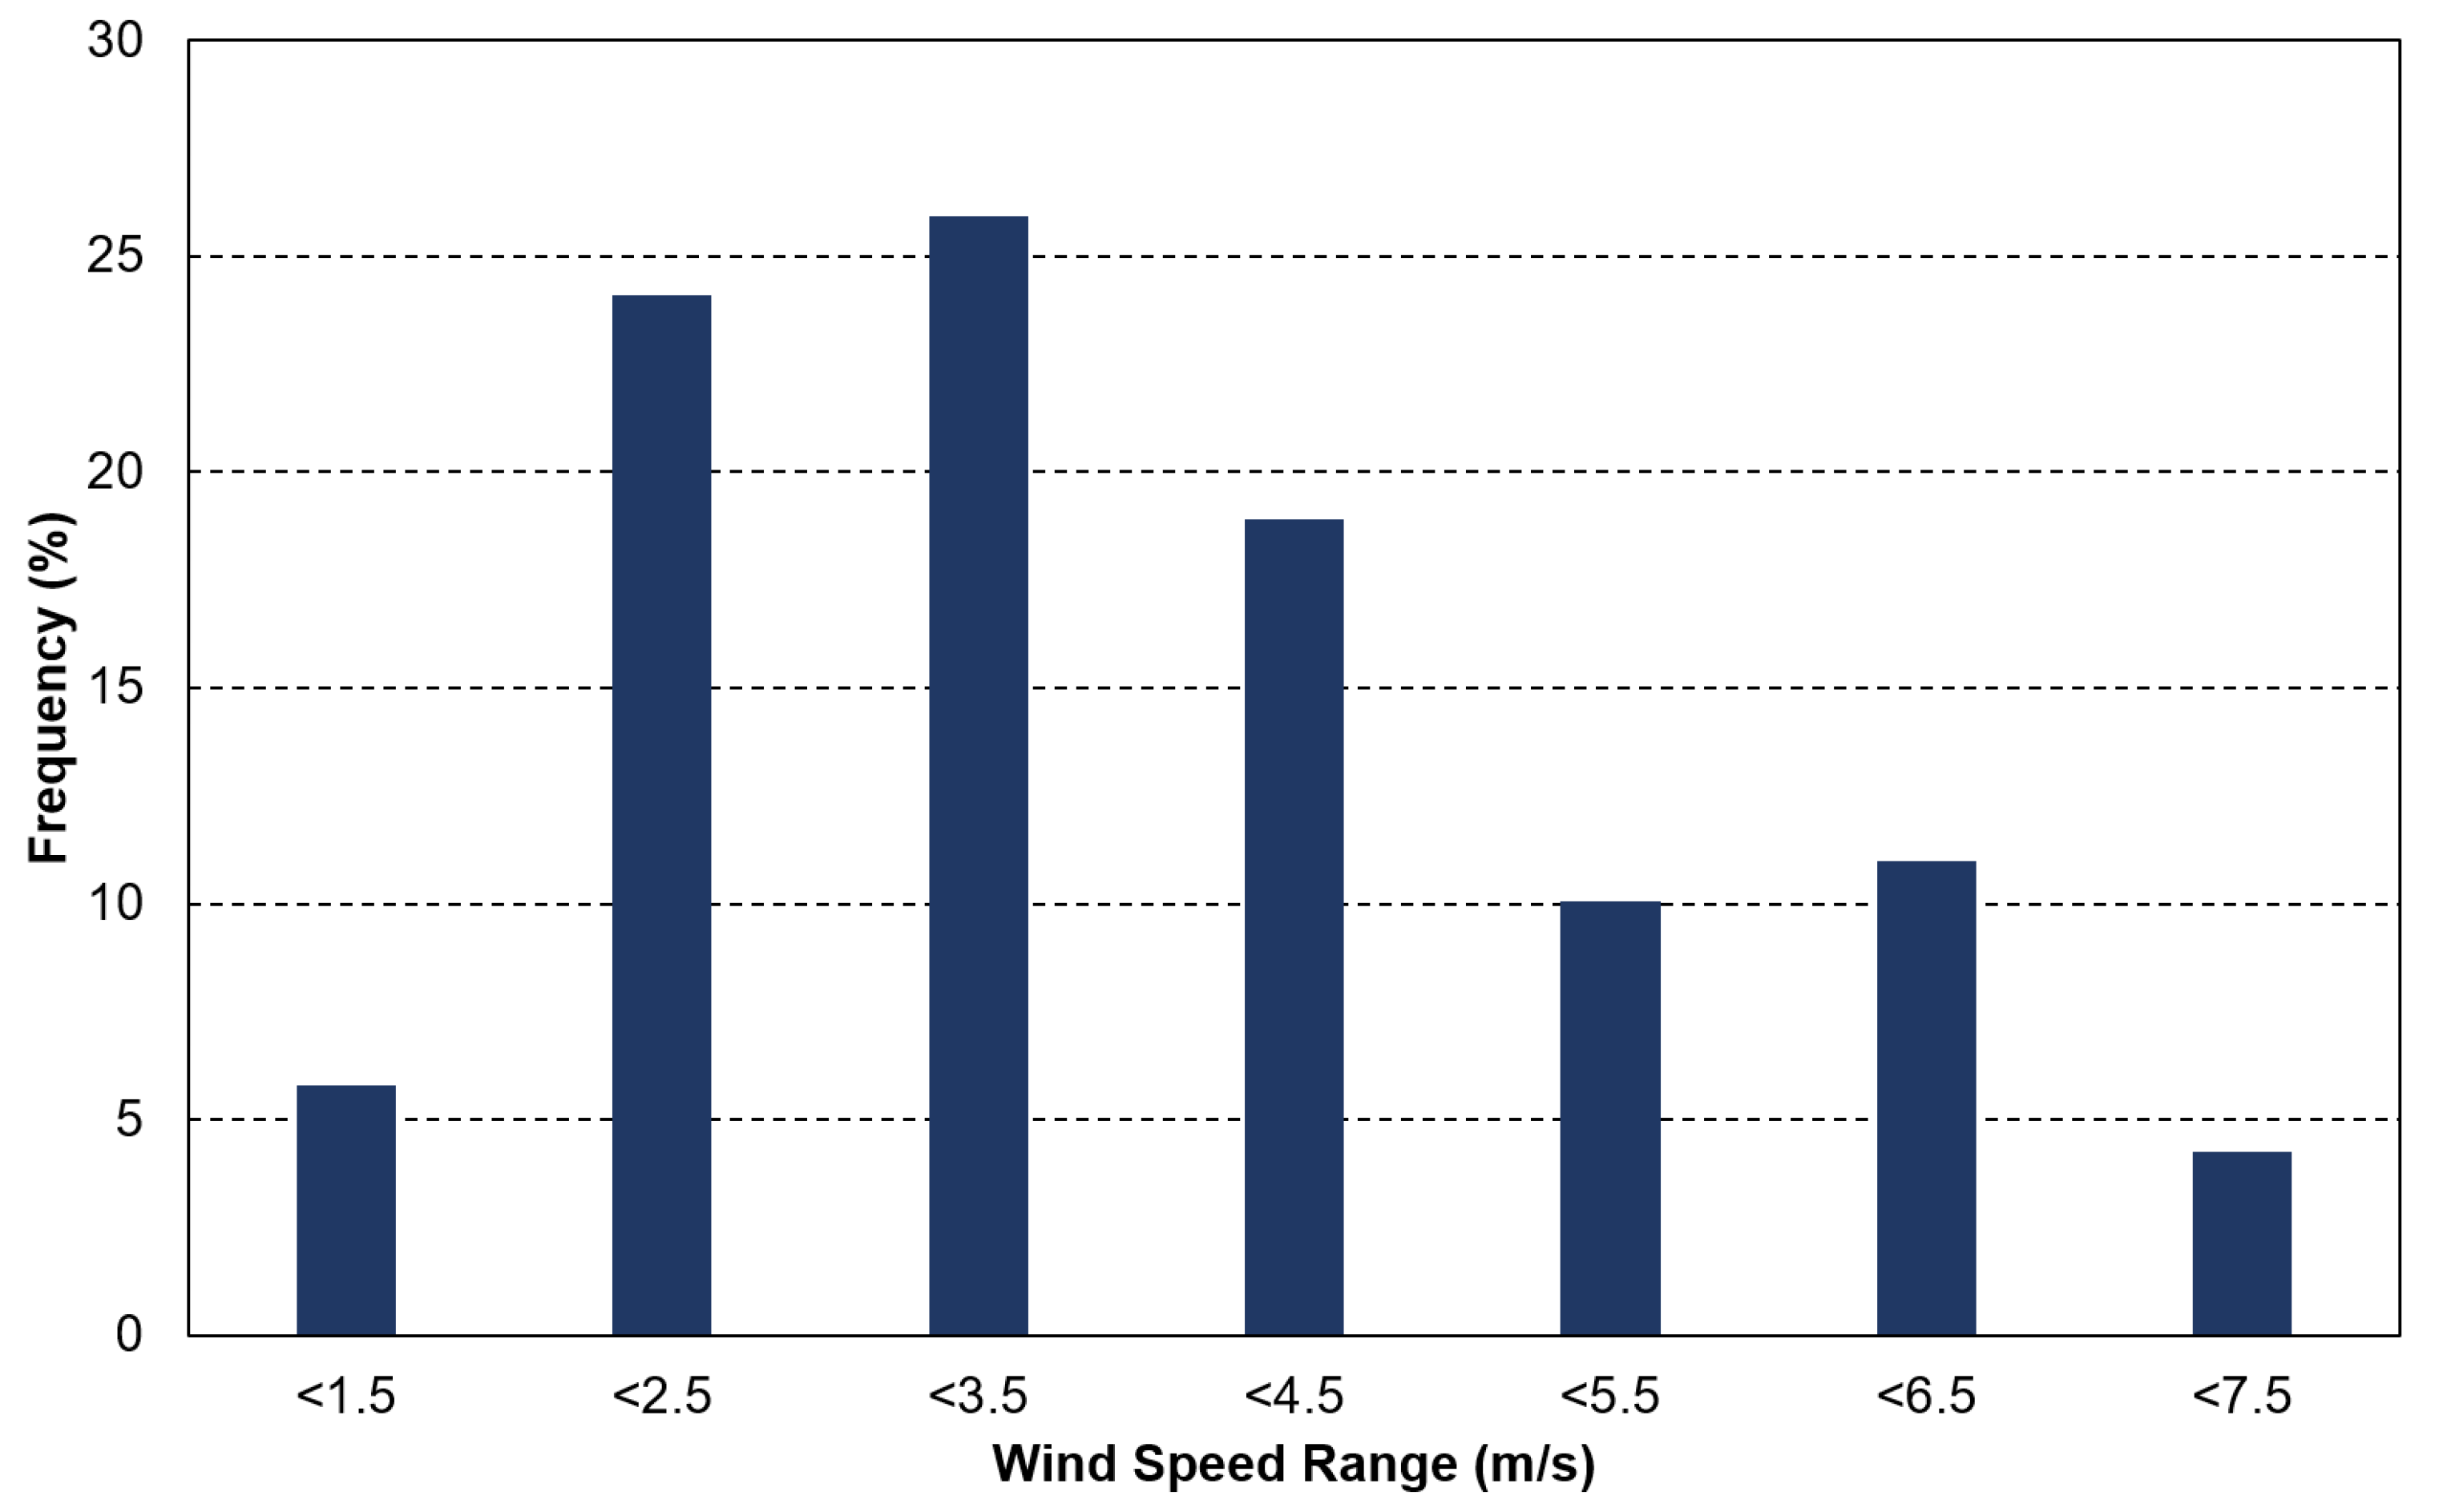
The histogram shown in Figure 4 displays the frequency distribution of wind speeds in which wind data were collected. It can be seen that during this period, most of the wind speeds fall between 1.5 and 4.5 m/s.
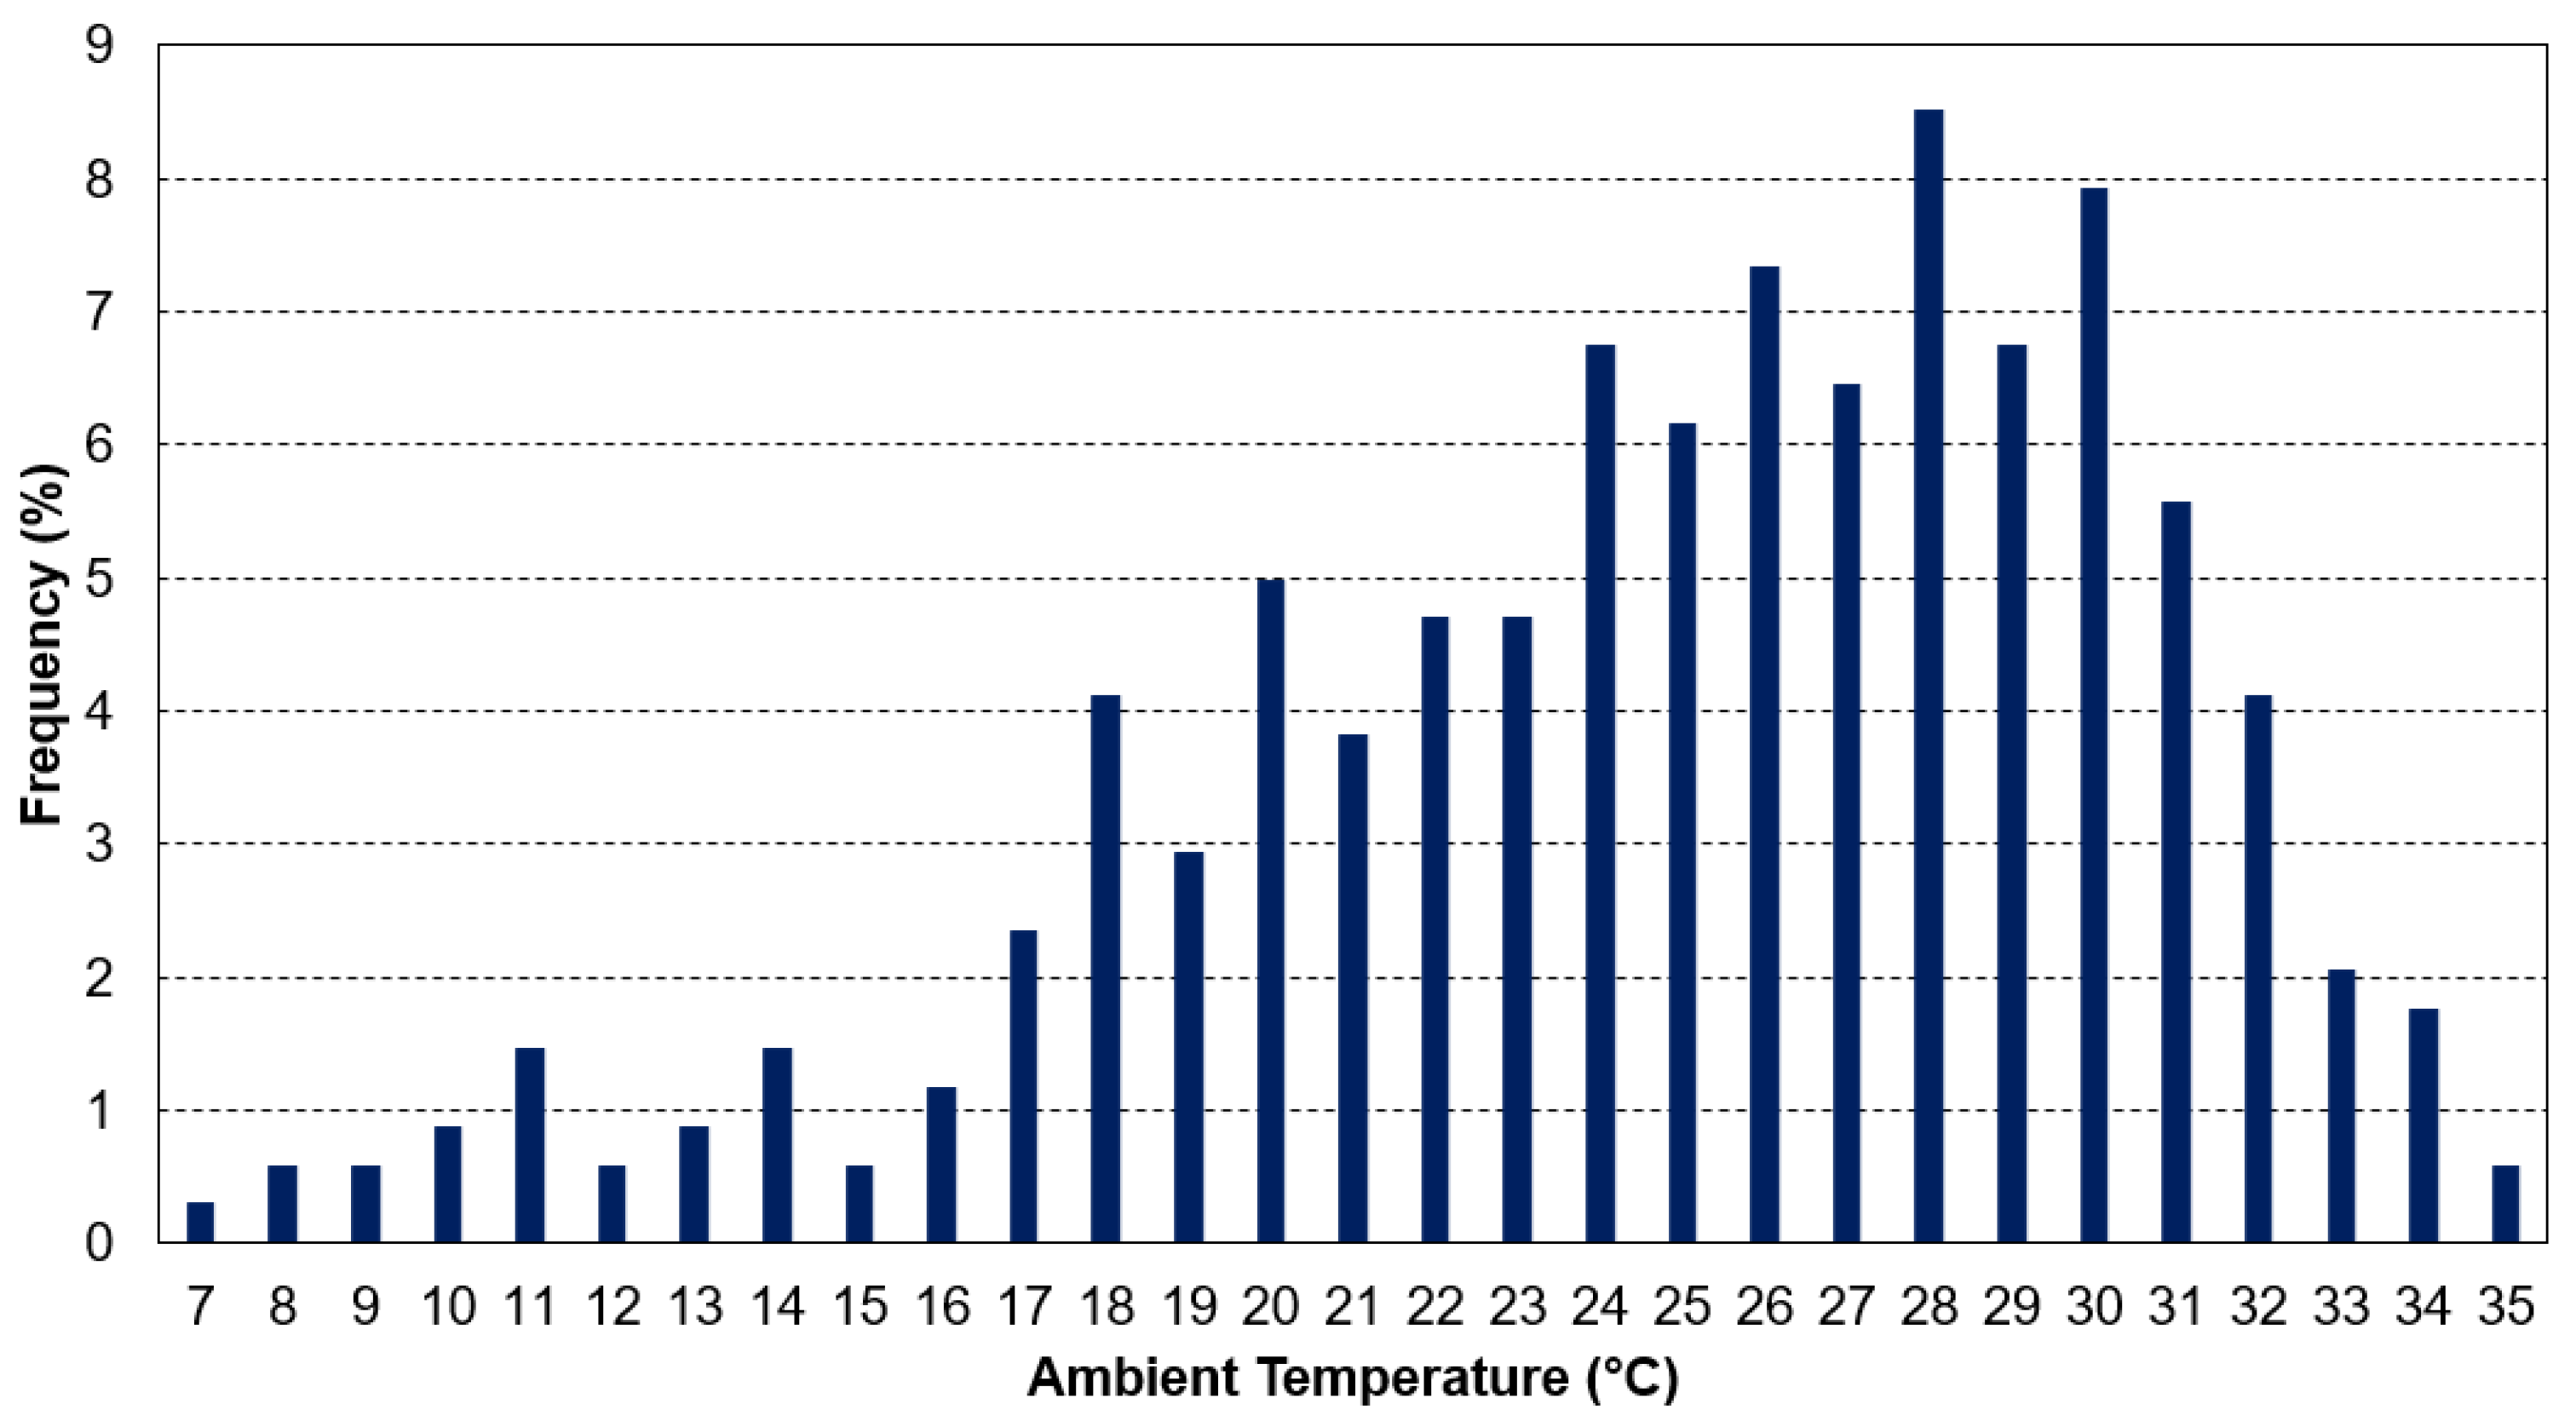
Figure 5 illustrates the histogram for temperature in the months of interest. As we are focused on the months without snowfall and from dawn to dusk, recorded temperatures lie between 15 and 35 °C. It is well known that ambient temperature has a significant effect on array temperature, which in turn affects PV performance, and the data collected in this work are used to quantify the effects of array efficiency and ambient temperatures.
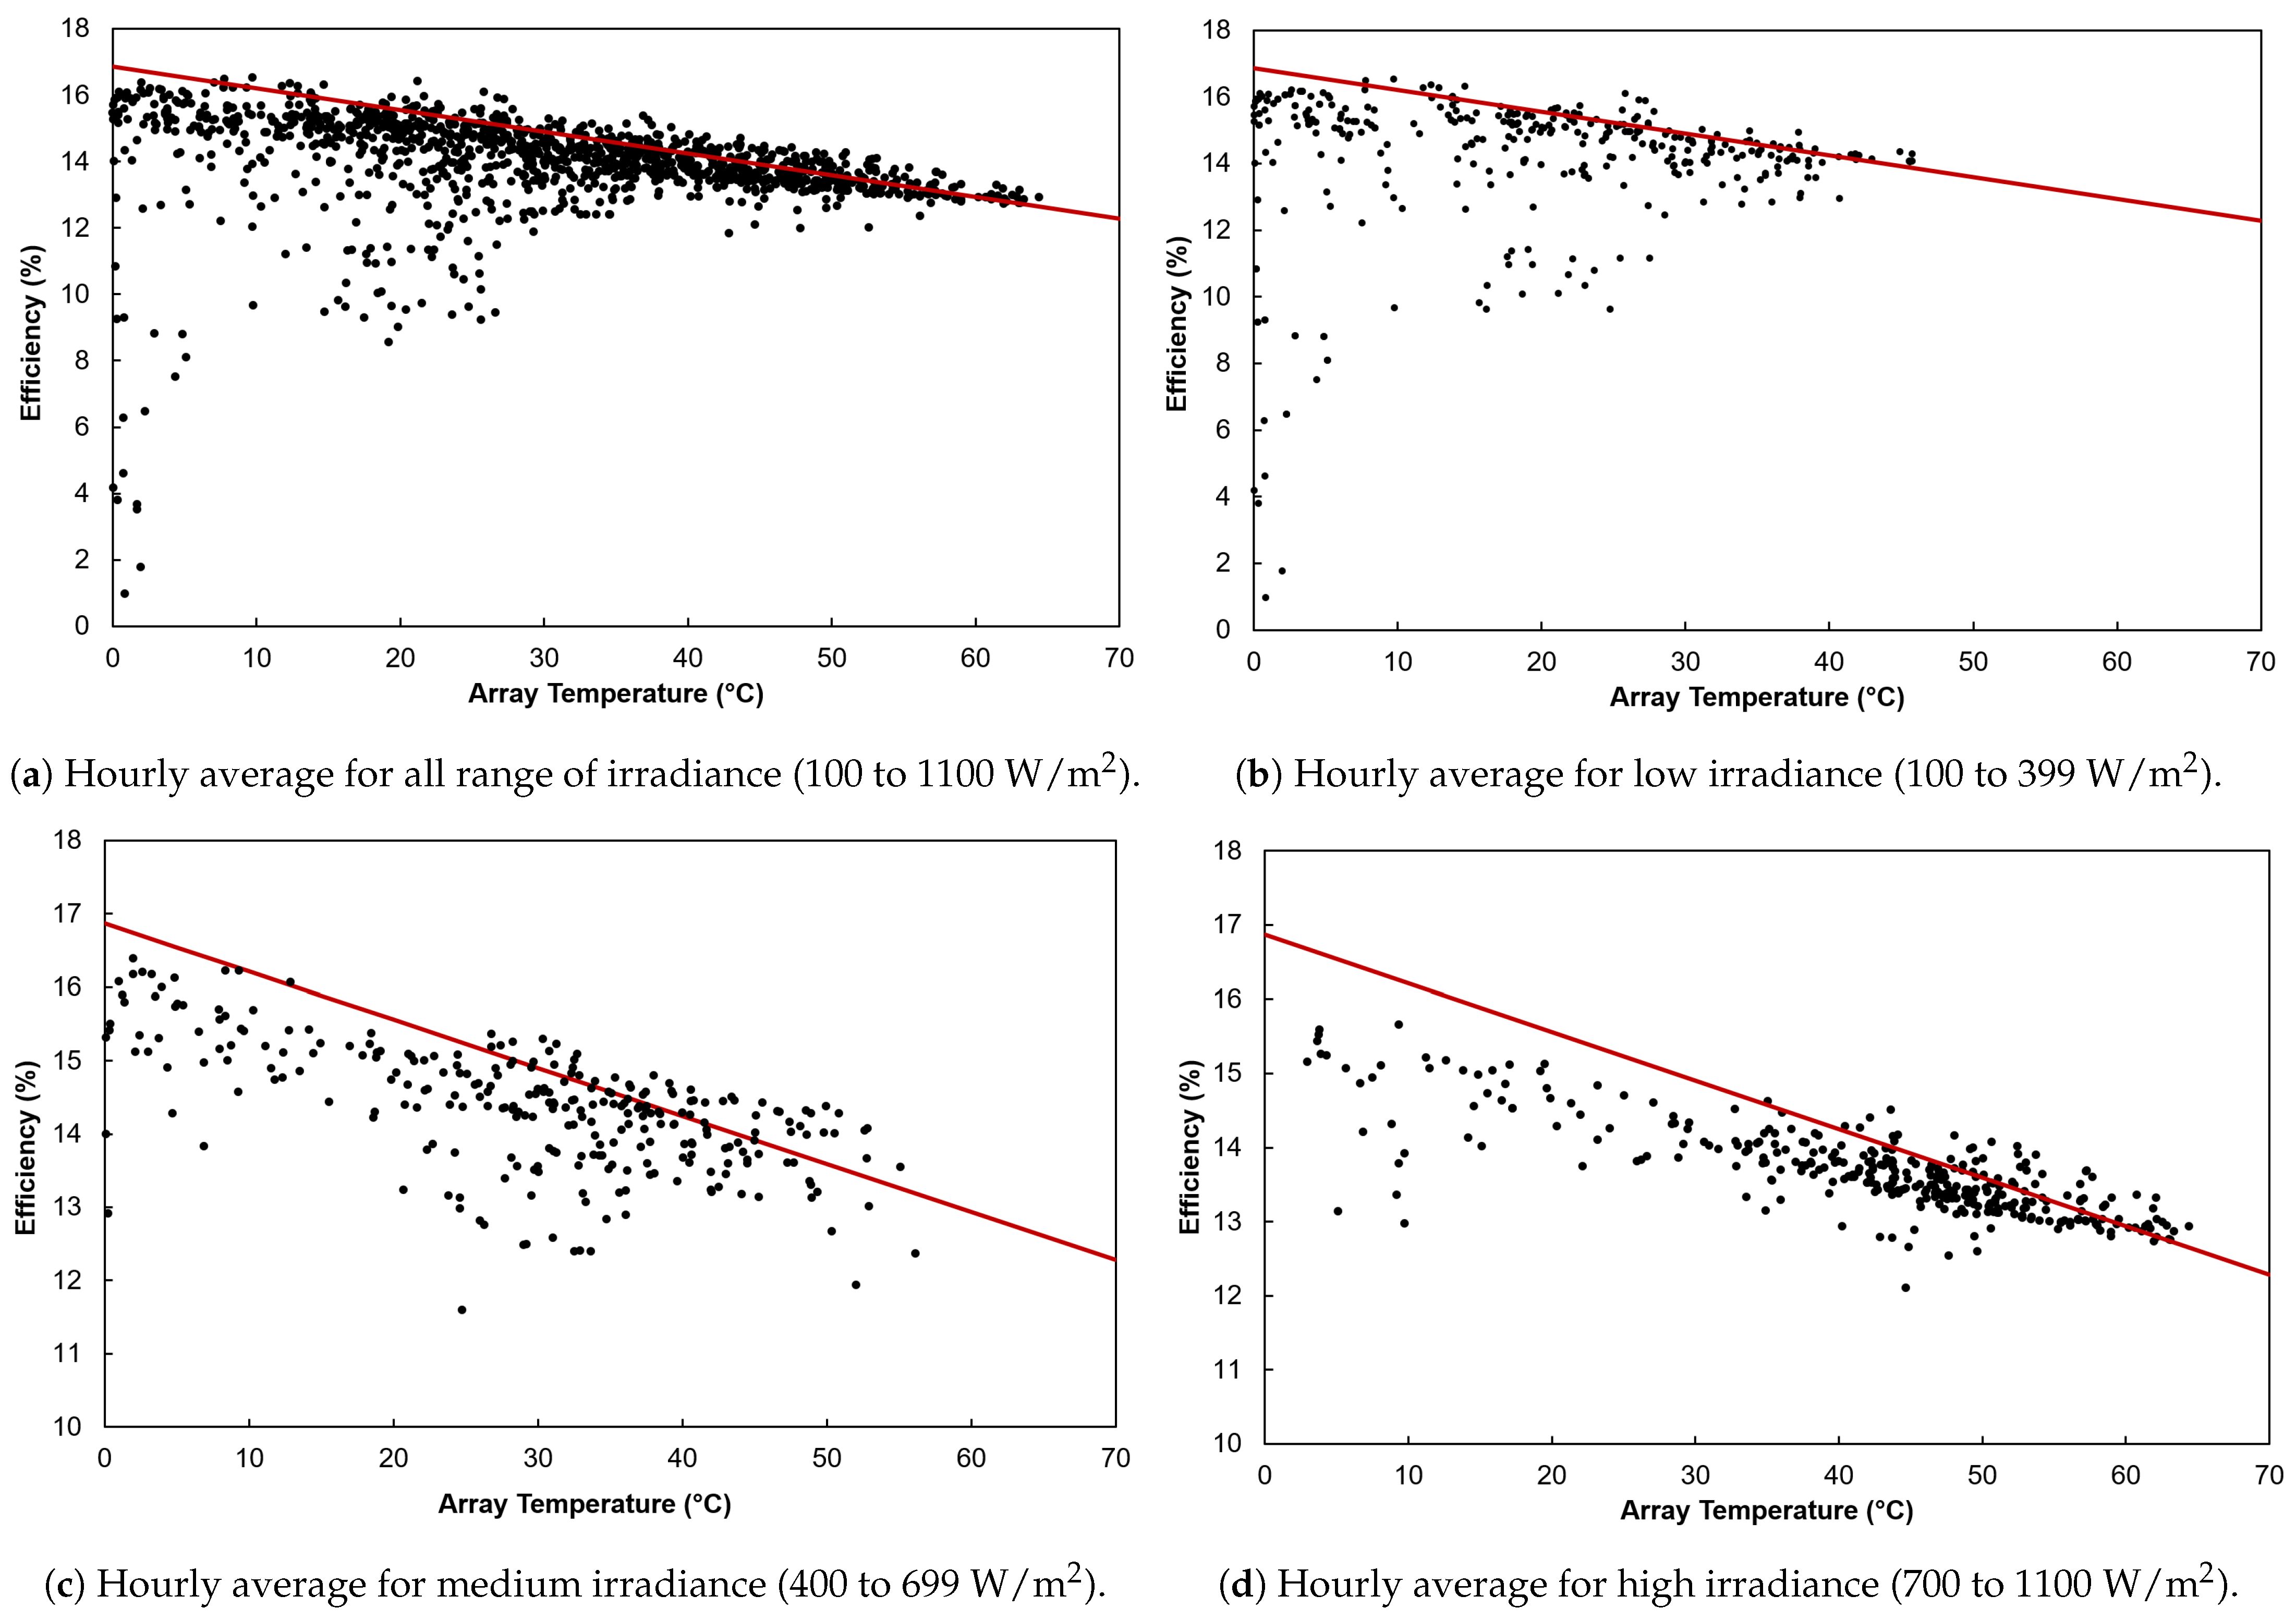
Figure 6 shows the electrical conversion efficiency vs. array temperature. Efficiency is determined using measured AC power outputs and plane of array irradiance. In controlled laboratory experiments, PV efficiency decreases linearly with temperature. Every point in Figure 6a shows the hourly average value for efficiency and temperature during the period of interest. There is a clear general trend that, as array temperature decreases, the efficiency increases. However, as the temperature drops below 10 °C, we noticed a significant drop in efficiency; this is due to weather events such as rain. We then divided the level of solar irradiance into three levels, low (Figure 6b, 100 to 399 W/m2), medium (Figure 6c, 400 to 699 W/m2), and high (Figure 6d, 700 to 1100 W/m2). This grouping allows us to isolate sunny weather in order to study the effects of wind on power production. In all three groupings, we observe near-linear trends between array temperature and efficiency. The red line is the efficiency line provided by the manufacturer, using an efficiency of 15.23% at an ambient temperature of 25 °C, using β = 0.43 %/°C. However, as shown in Figure 6d, efficiency reported by the manufacturer does not match closely with data measured in the field.
It is noteworthy that measuring AC output power encompasses a variety of system losses in addition to temperature effects that will reduce power output. These include AC and DC wiring resistive losses, power mismatch between modules and strings, inverter conversion efficiency loss from DC to AC (dependent on array operating power point), partial shading, dust accumulation, and reflection from the glass. Furthermore, DC to AC inverter conversion efficiency depends on the DC voltage and AC output power. Depending on light levels seen by the array, conversion efficiency losses will change. Under low-light conditions, conversion losses will be larger. However, since we are focused on higher solar irradiance levels, we expect a CEC (California Energy Commission) weighted efficiency of approximately 96%. Thus, the trends reported are expected to be consistent with a small offset due to conversion losses.
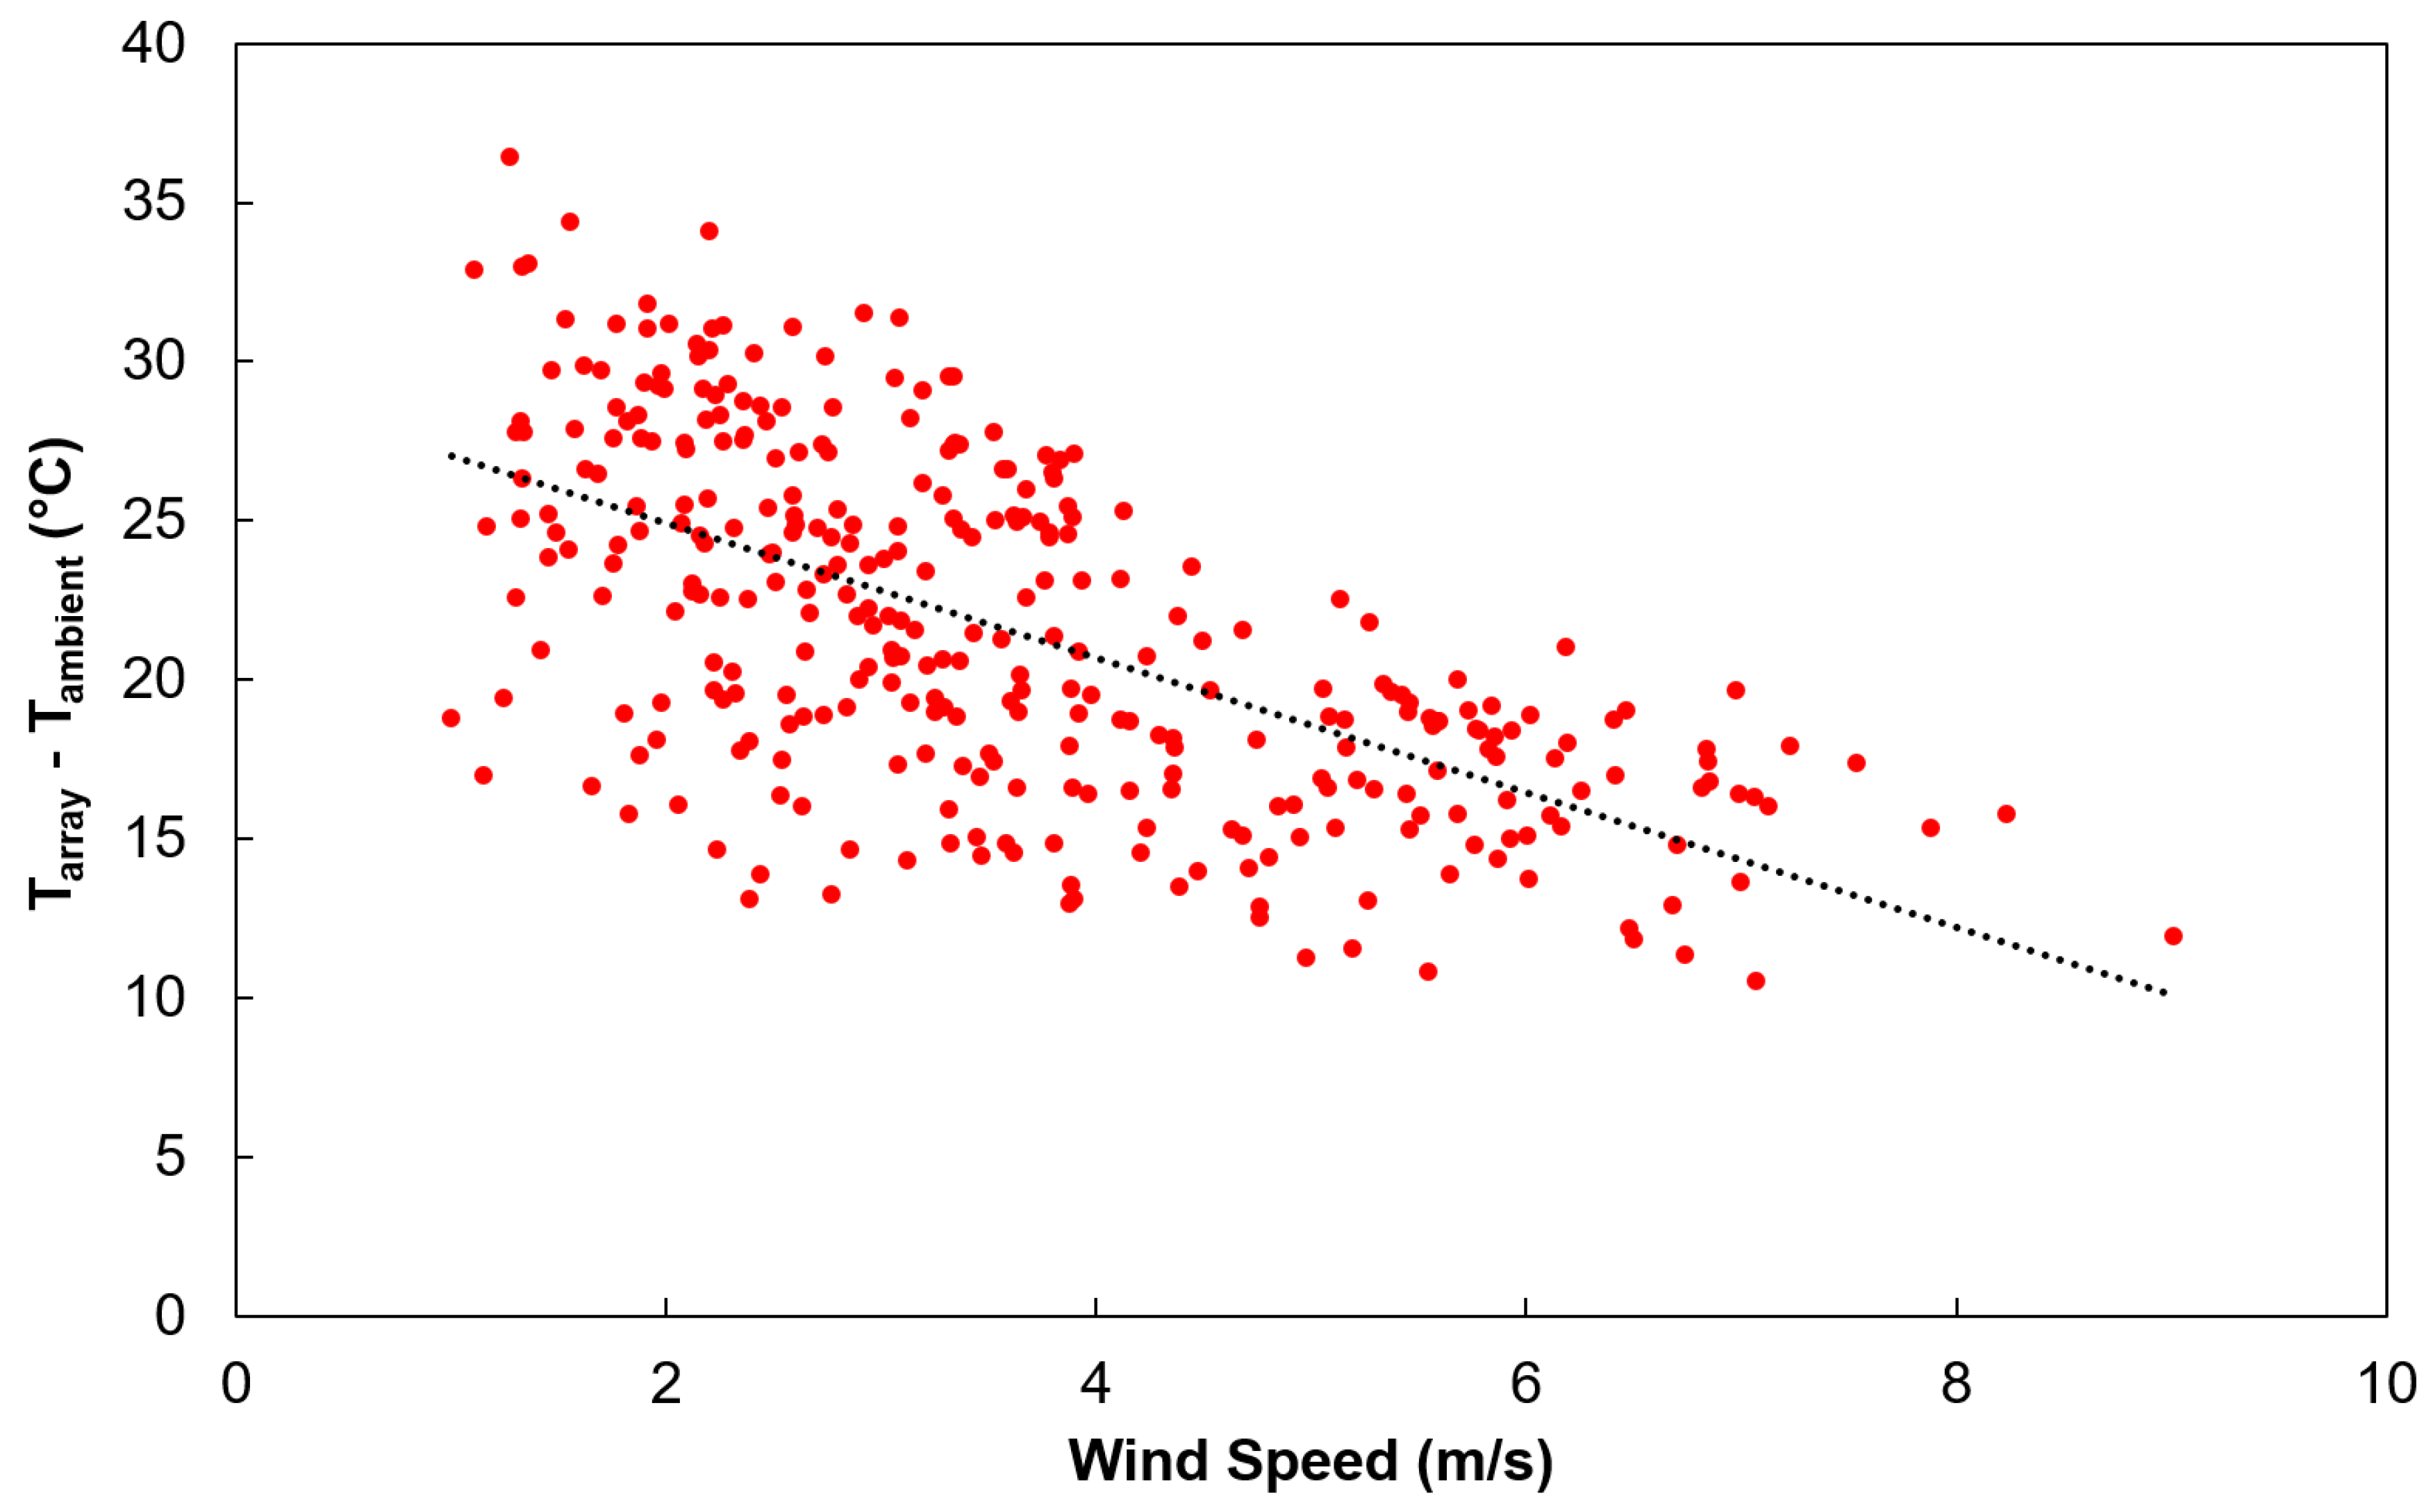
The temperature difference between array temperature and ambient has been reported as a function of wind speed, wind direction, solar irradiance, and ambient temperature [21]. Figure 7 presents the temperature difference between the array and ambient air as a function of wind speed. Furthermore, looking at the energy balance shown in Equation (2), the rate at which heat is lost to the environment is directly proportional to the temperature difference between the array temperature and ambient temperature. As wind velocity increases, the temperature difference decreases, somewhat linearly. It also illustrates the importance of air flow in producing a change in temperature difference, which will significantly affect array efficiency.
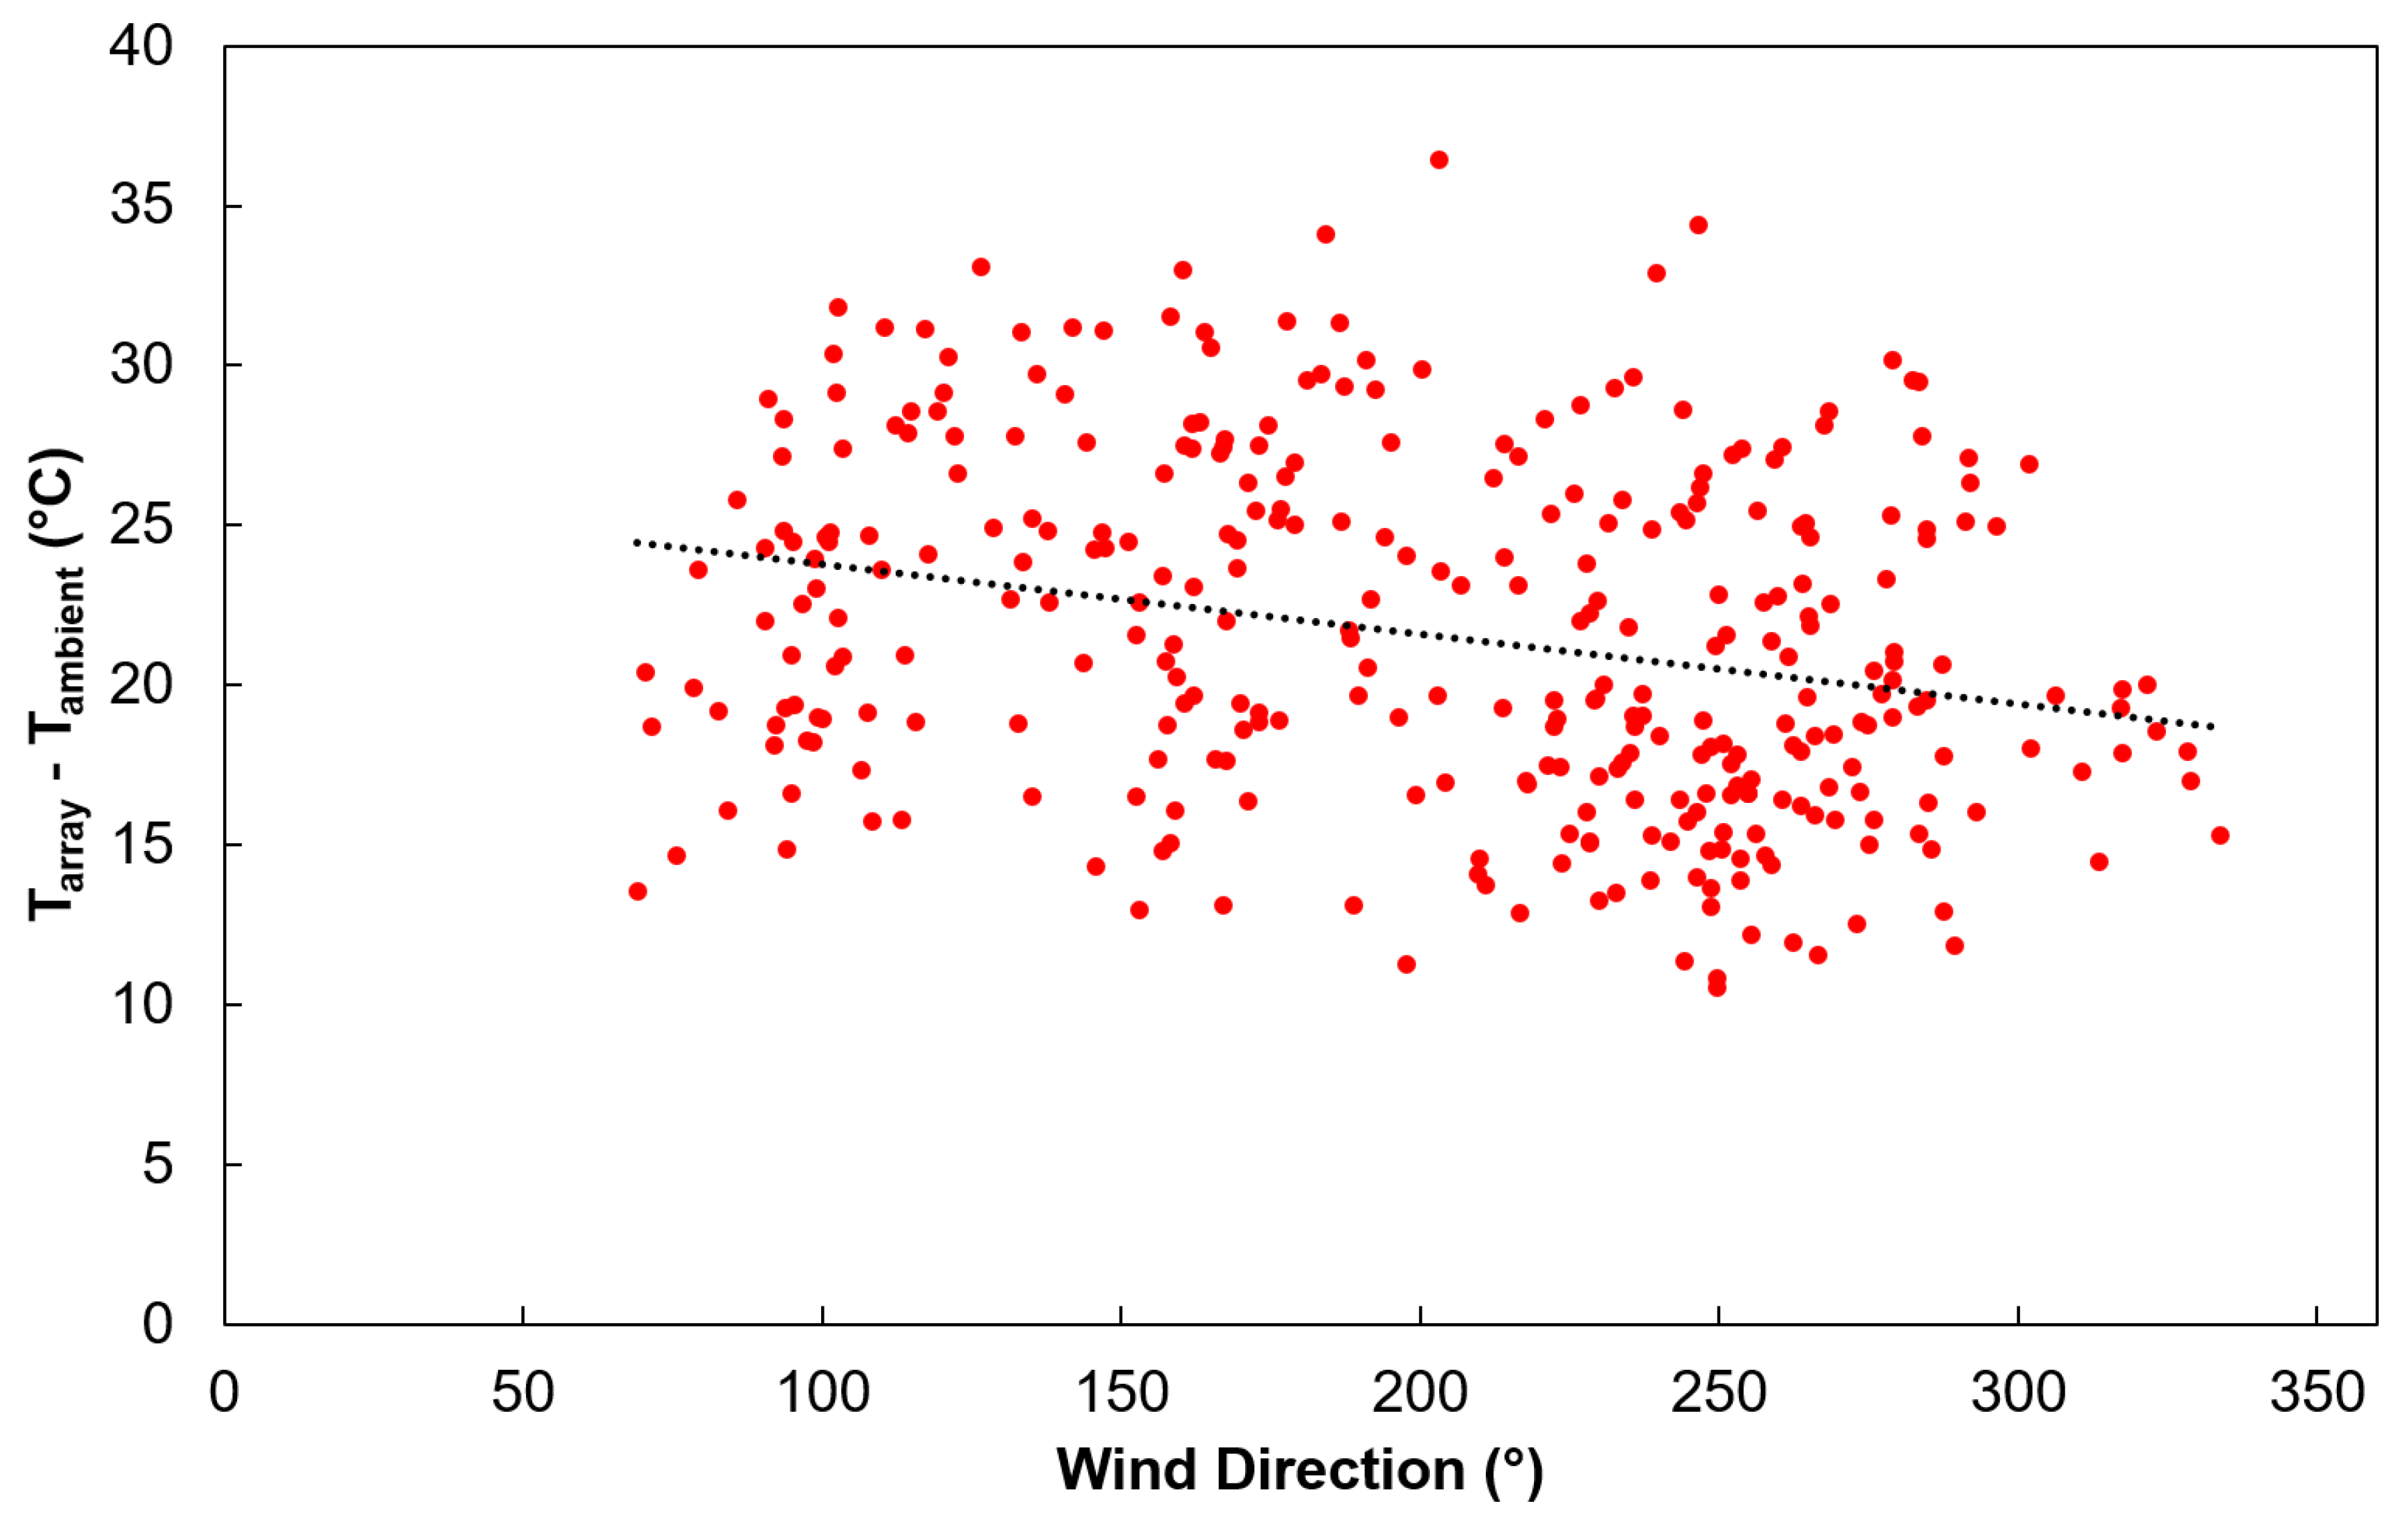
In addition to wind speed, wind direction has been shown in previous work [13,14,24] as an important variable of interest in PV cooling. We compiled experimental data and plotted array and ambient temperature difference with wind direction in Figure 8. It shows that for this case, wind direction does not significantly affect heat transfer and does not affect the overall performance of the array. Thus, it is a fair assumption to neglect wind direction in determining the thermal loss factor/heat transfer coefficient.
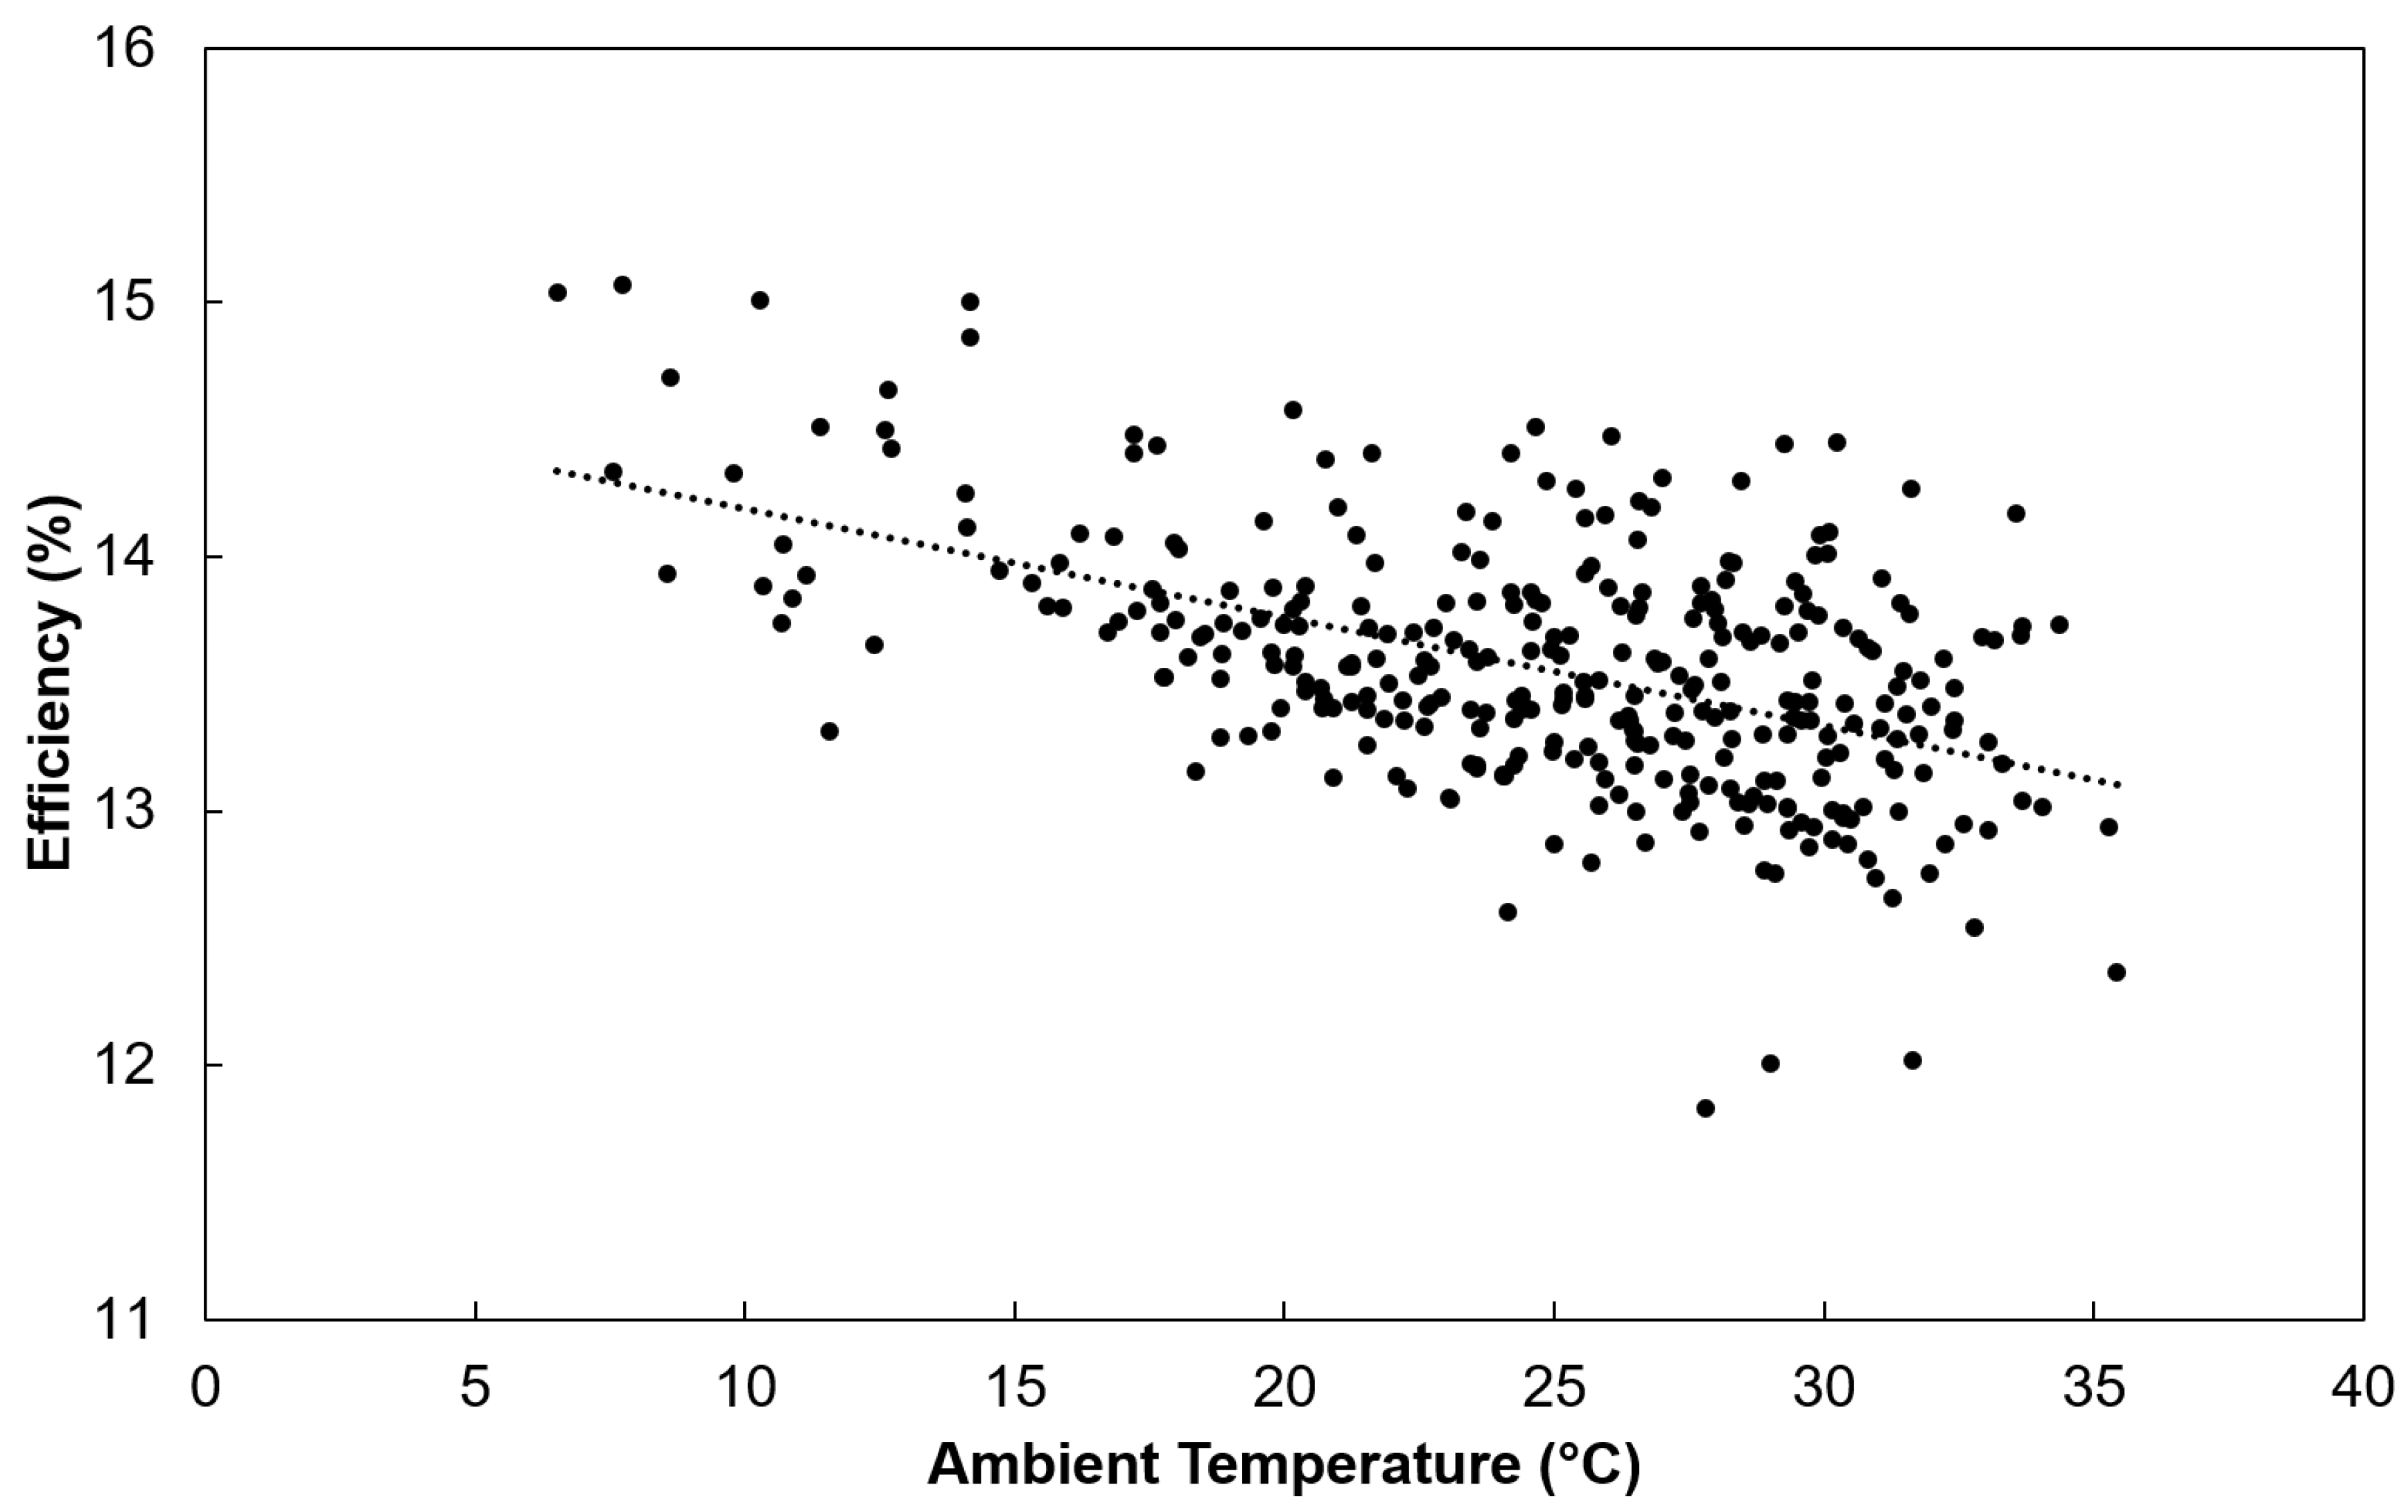
It is well known that ambient temperature has a significant effect on PV performance, and this is shown in Figure 9. As ambient temperature becomes warmer, the efficiency declines.
Figure 10 shows the relationship between electrical efficiency and ambient temperatures at wind speeds of 0, 3, 4, and 5 m/s. These speeds were chosen due to completeness of data, and these plots illustrate the variation in efficiency at ambient temperatures between 6 and 35 °C. We can clearly observe the dependence of PV efficiency with ambient temperature in all wind speeds, with increasing ambient temperature, leading to decreasing PV efficiency. At 0 m/s, the mean efficiency is between 13.2% and 14.1% in the range of 15 and 28 °C, or 0.09 %/°C. At 3 m/s, the mean efficiency lies between 12.7% and 14.3% in the range of 13 and 35 °C, or 0.07 %/°C. At 4 m/s, the mean efficiency lies between 13.5% and 14.7% in the range of 7 and 33 °C, or 0.046 %/°C. At 5 m/s, the mean efficiency lies between 13.4% and 14% in the range of 18 and 30 °C, or 0.05 %/°C. This means that, as wind speed increases, we observe that the average slope of efficiency and ambient temperature decreases. Additionally, when wind speed increases, the thermal loss factor/heat transfer coefficient increases, and the temperature difference between array and ambient decreases.
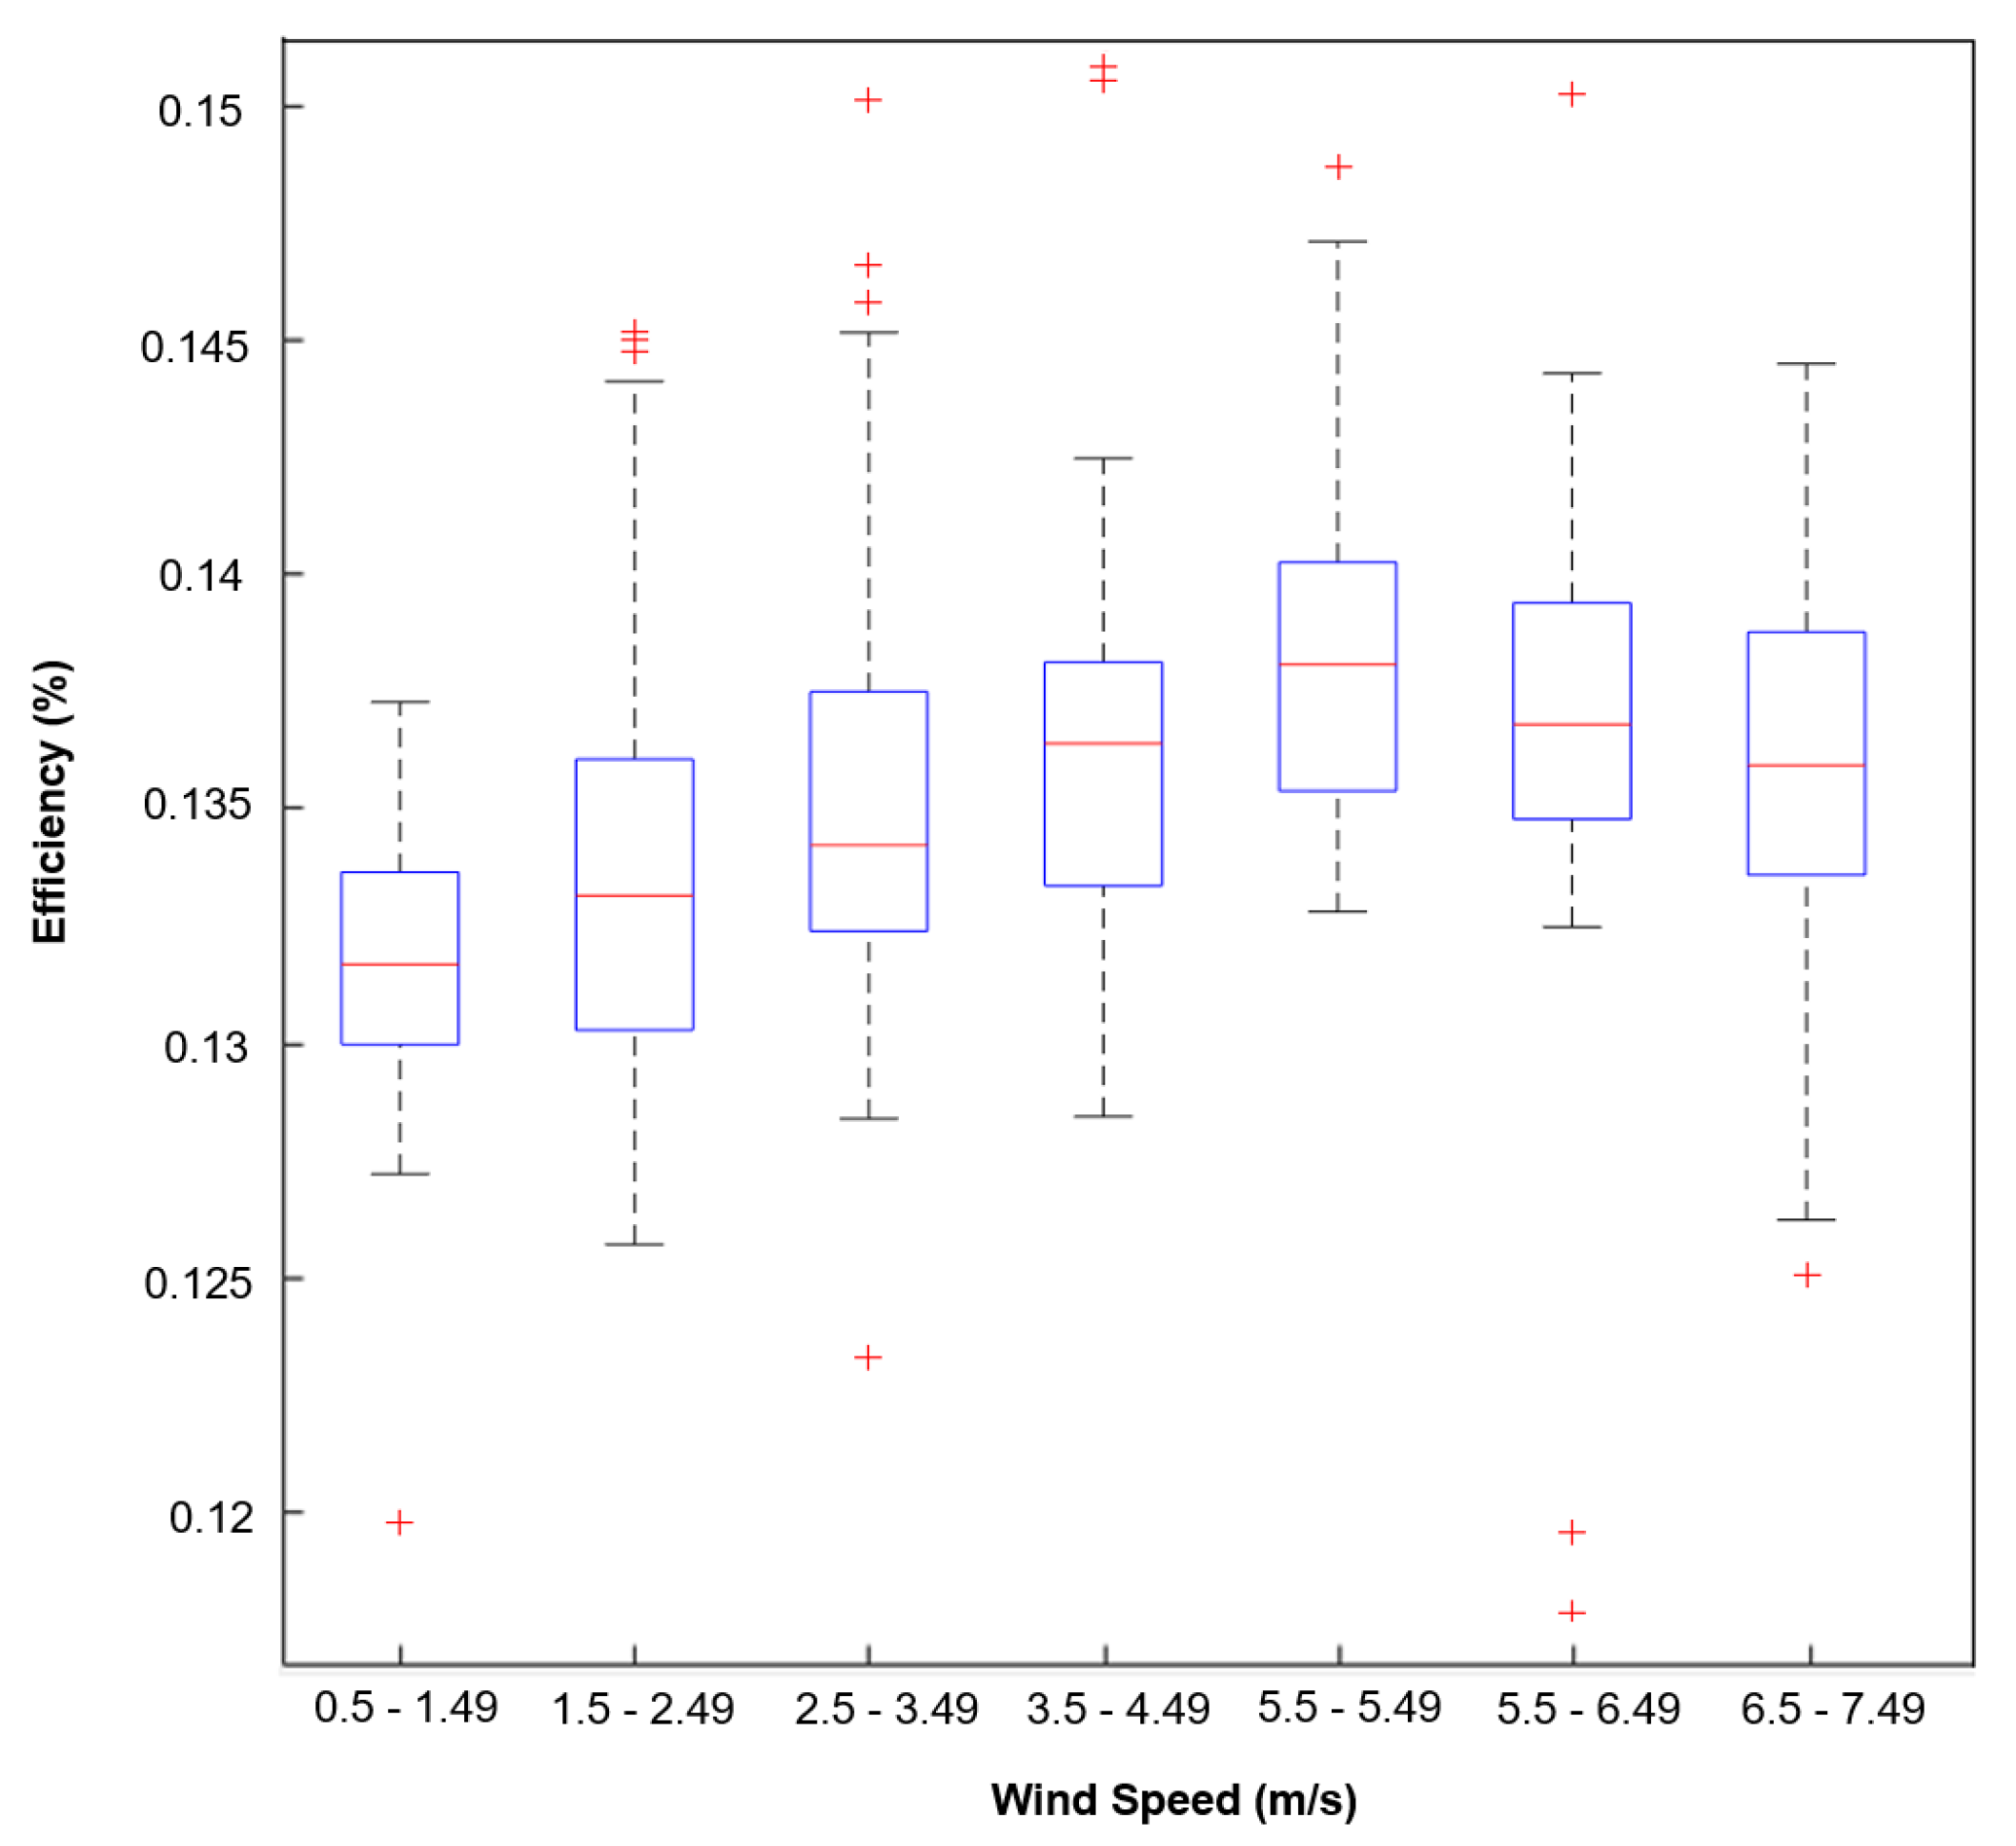
The PV efficiency data were also compiled and plotted against wind speed, shown in Figure 11 as a box plot. As velocity increases from <1.5 to 5.5 m/s, we see the mean efficiency increase from 13.2% to 13.8%, or approximately a 5% increase in relative efficiency. Thus, wind effects should be part of the design consideration. Based on these observations, it is important to note that interactions between building structures and wind can significantly affect the air flow. Thus, PV engineers should take these effects into account when selecting the location of PV array, similar to that of a small wind turbine site assessment. Onsite wind resource measurements should be conducted for a minimum of one year using anemometers, wind vanes, and temperature sensors that are mounted as close to the location where PV arrays will be placed [25,26].

5.2. CFD Results

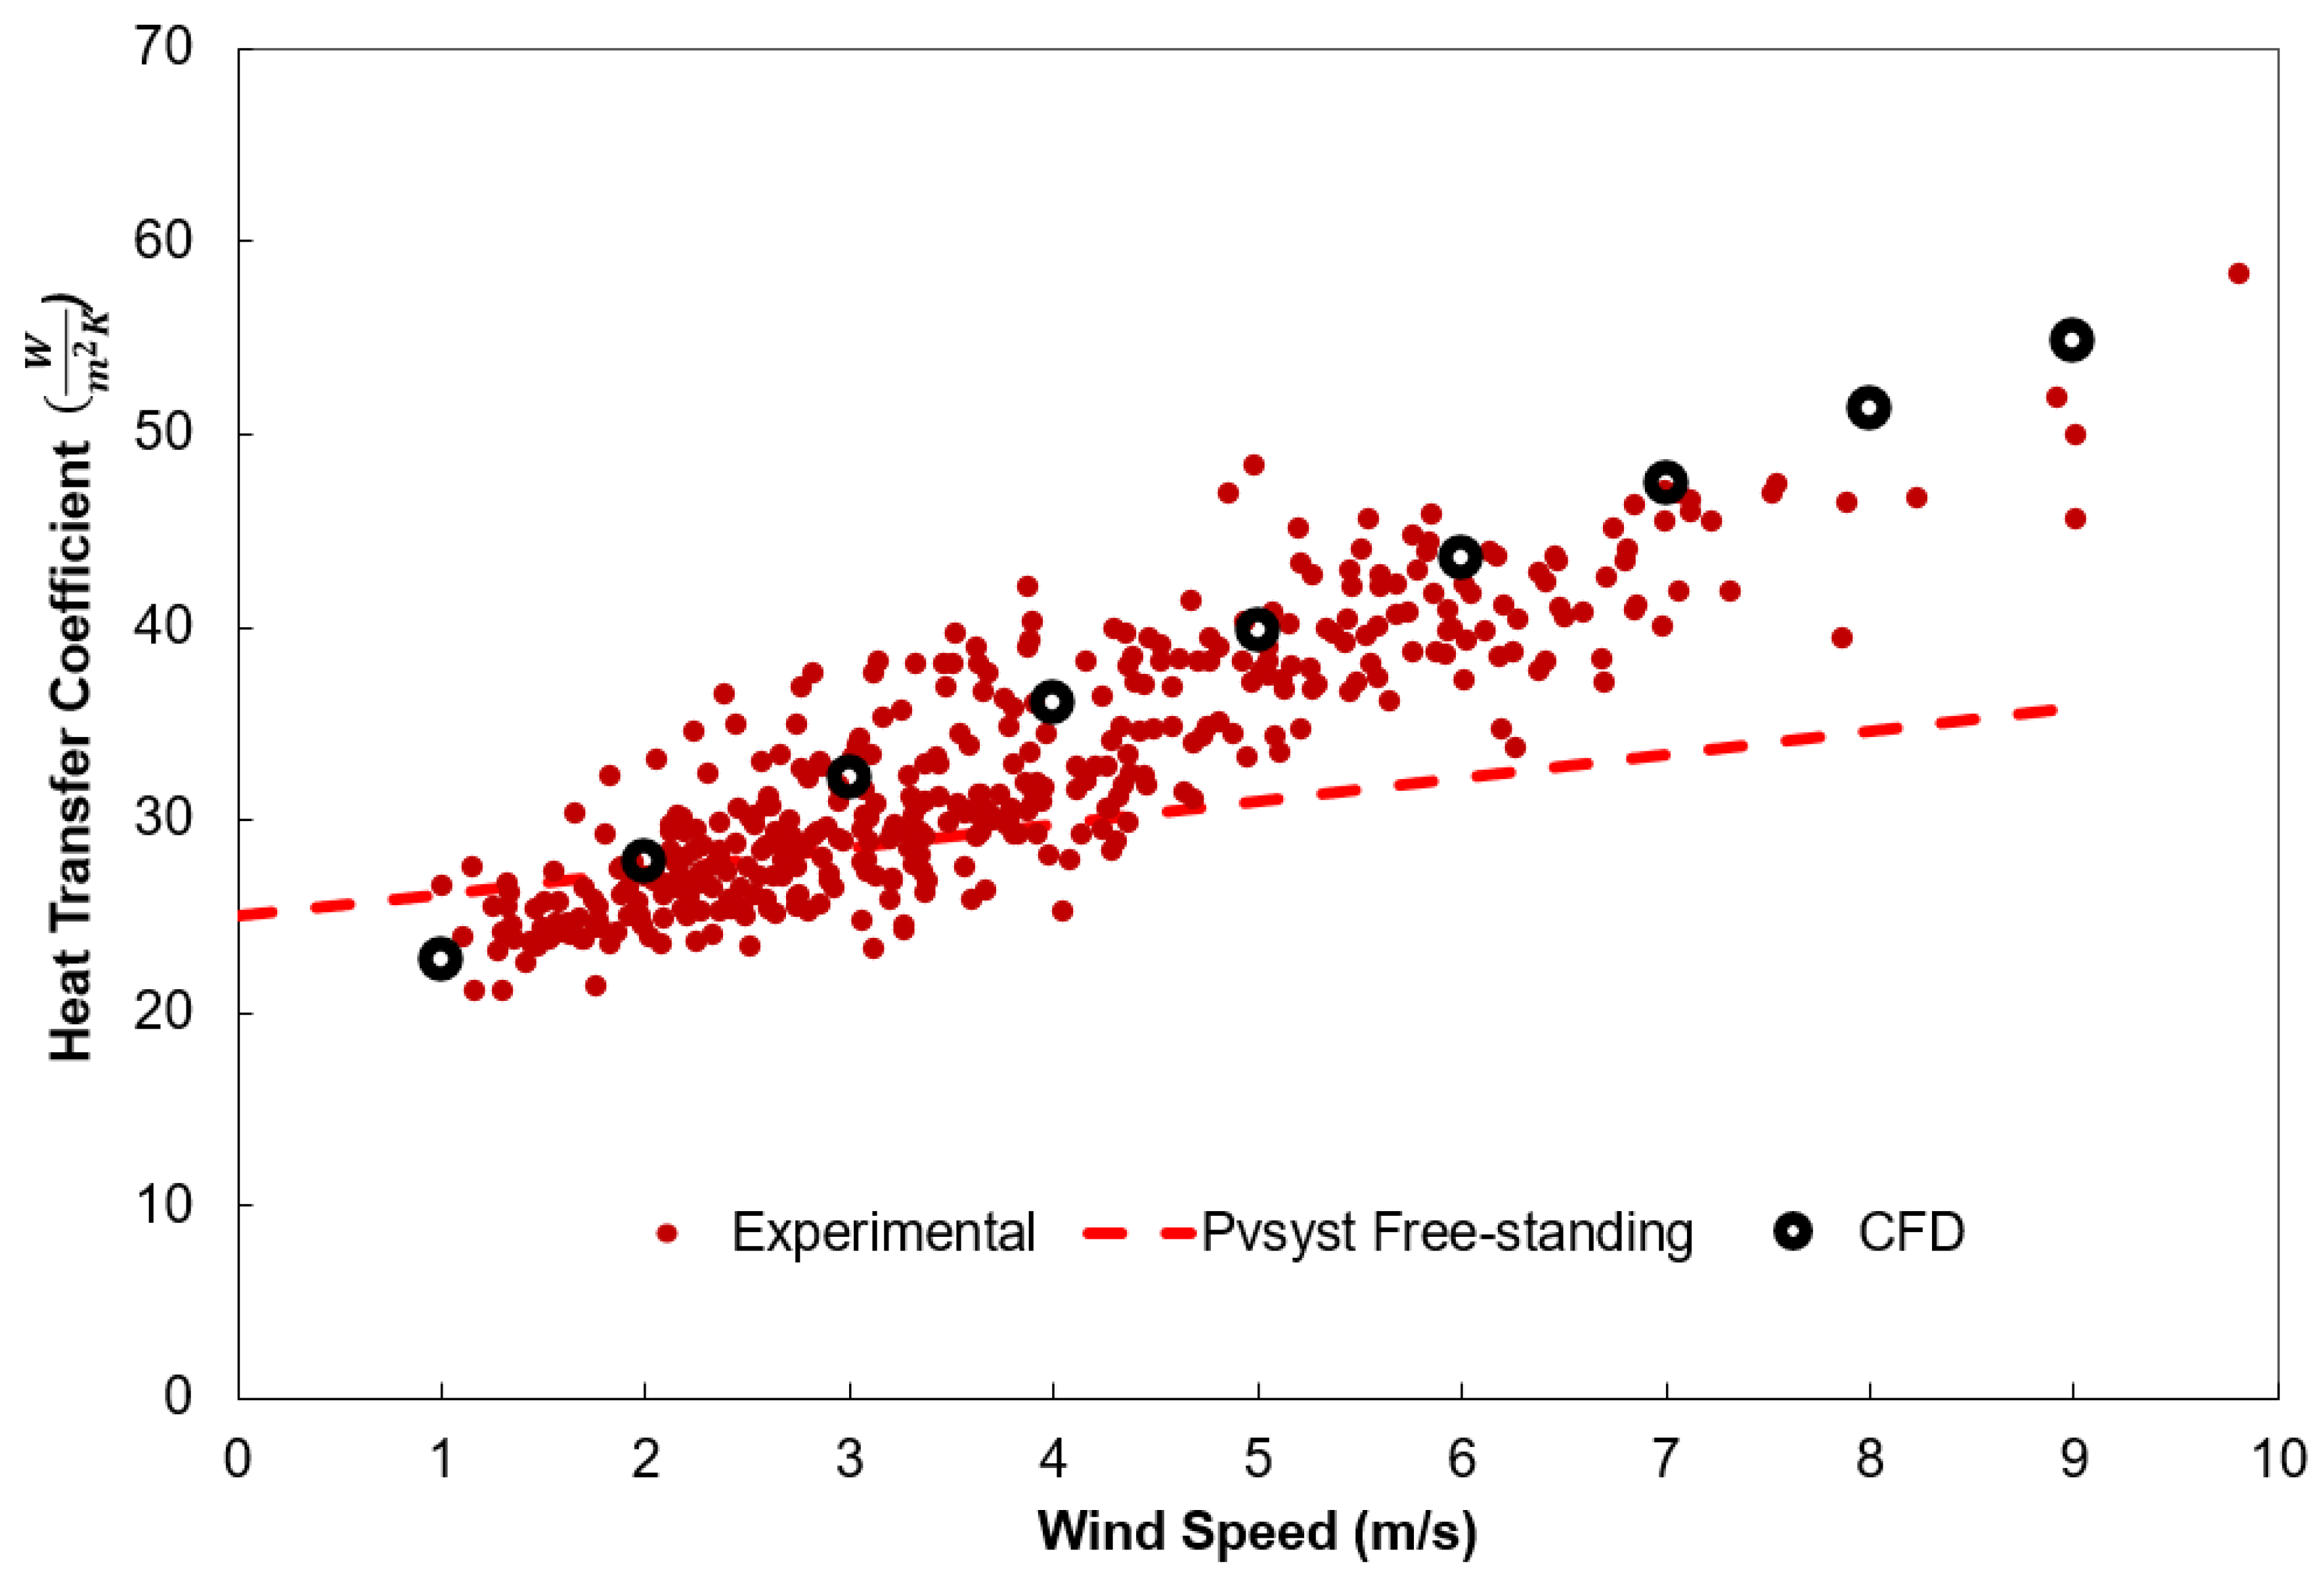
CFD simulations were conducted to study the influence of wind speed on thermal loss factor/heat transfer coefficient, temperature distribution, and modes of heat transfer. Figure 12 shows CFD simulation and experimental measurement of thermal loss factor/heat transfer coefficient as a function of wind speed for a heat flux of 800 W/m2. Heat transfer coefficients/thermal loss factors were calculated using Equation (2), where temperature and solar irradiance data were obtained from experiments. The efficiency values were calculated based on power production and solar irradiance. Simulations were also conducted for 600, 800, and 1100 W/m2; however, the results are very similar, so the data for 800 W/m2 were chosen to be presented in this work. The CFD and experimental results match closely with a similar trend. Their suggestion was that the heat transfer coefficient increases nearly linearly with wind speed, as assumed by the PVsyst model in Equation (3). However, the free-standing thermal loss factor values suggested from PVsyst, U c = 25 W/m2·K and U V = 1.2 W/m2·K/(m/s), do not produce comparable results with that of experimental and CFD simulations. However, it is interesting to note that at low wind speeds (<4 m/s), the suggested values from PVsyst do fall within the range seen in our experimental data. Based on our empirical results, we recommend a new range of values for U c and U v for free-standing PV, listed in Table 5.
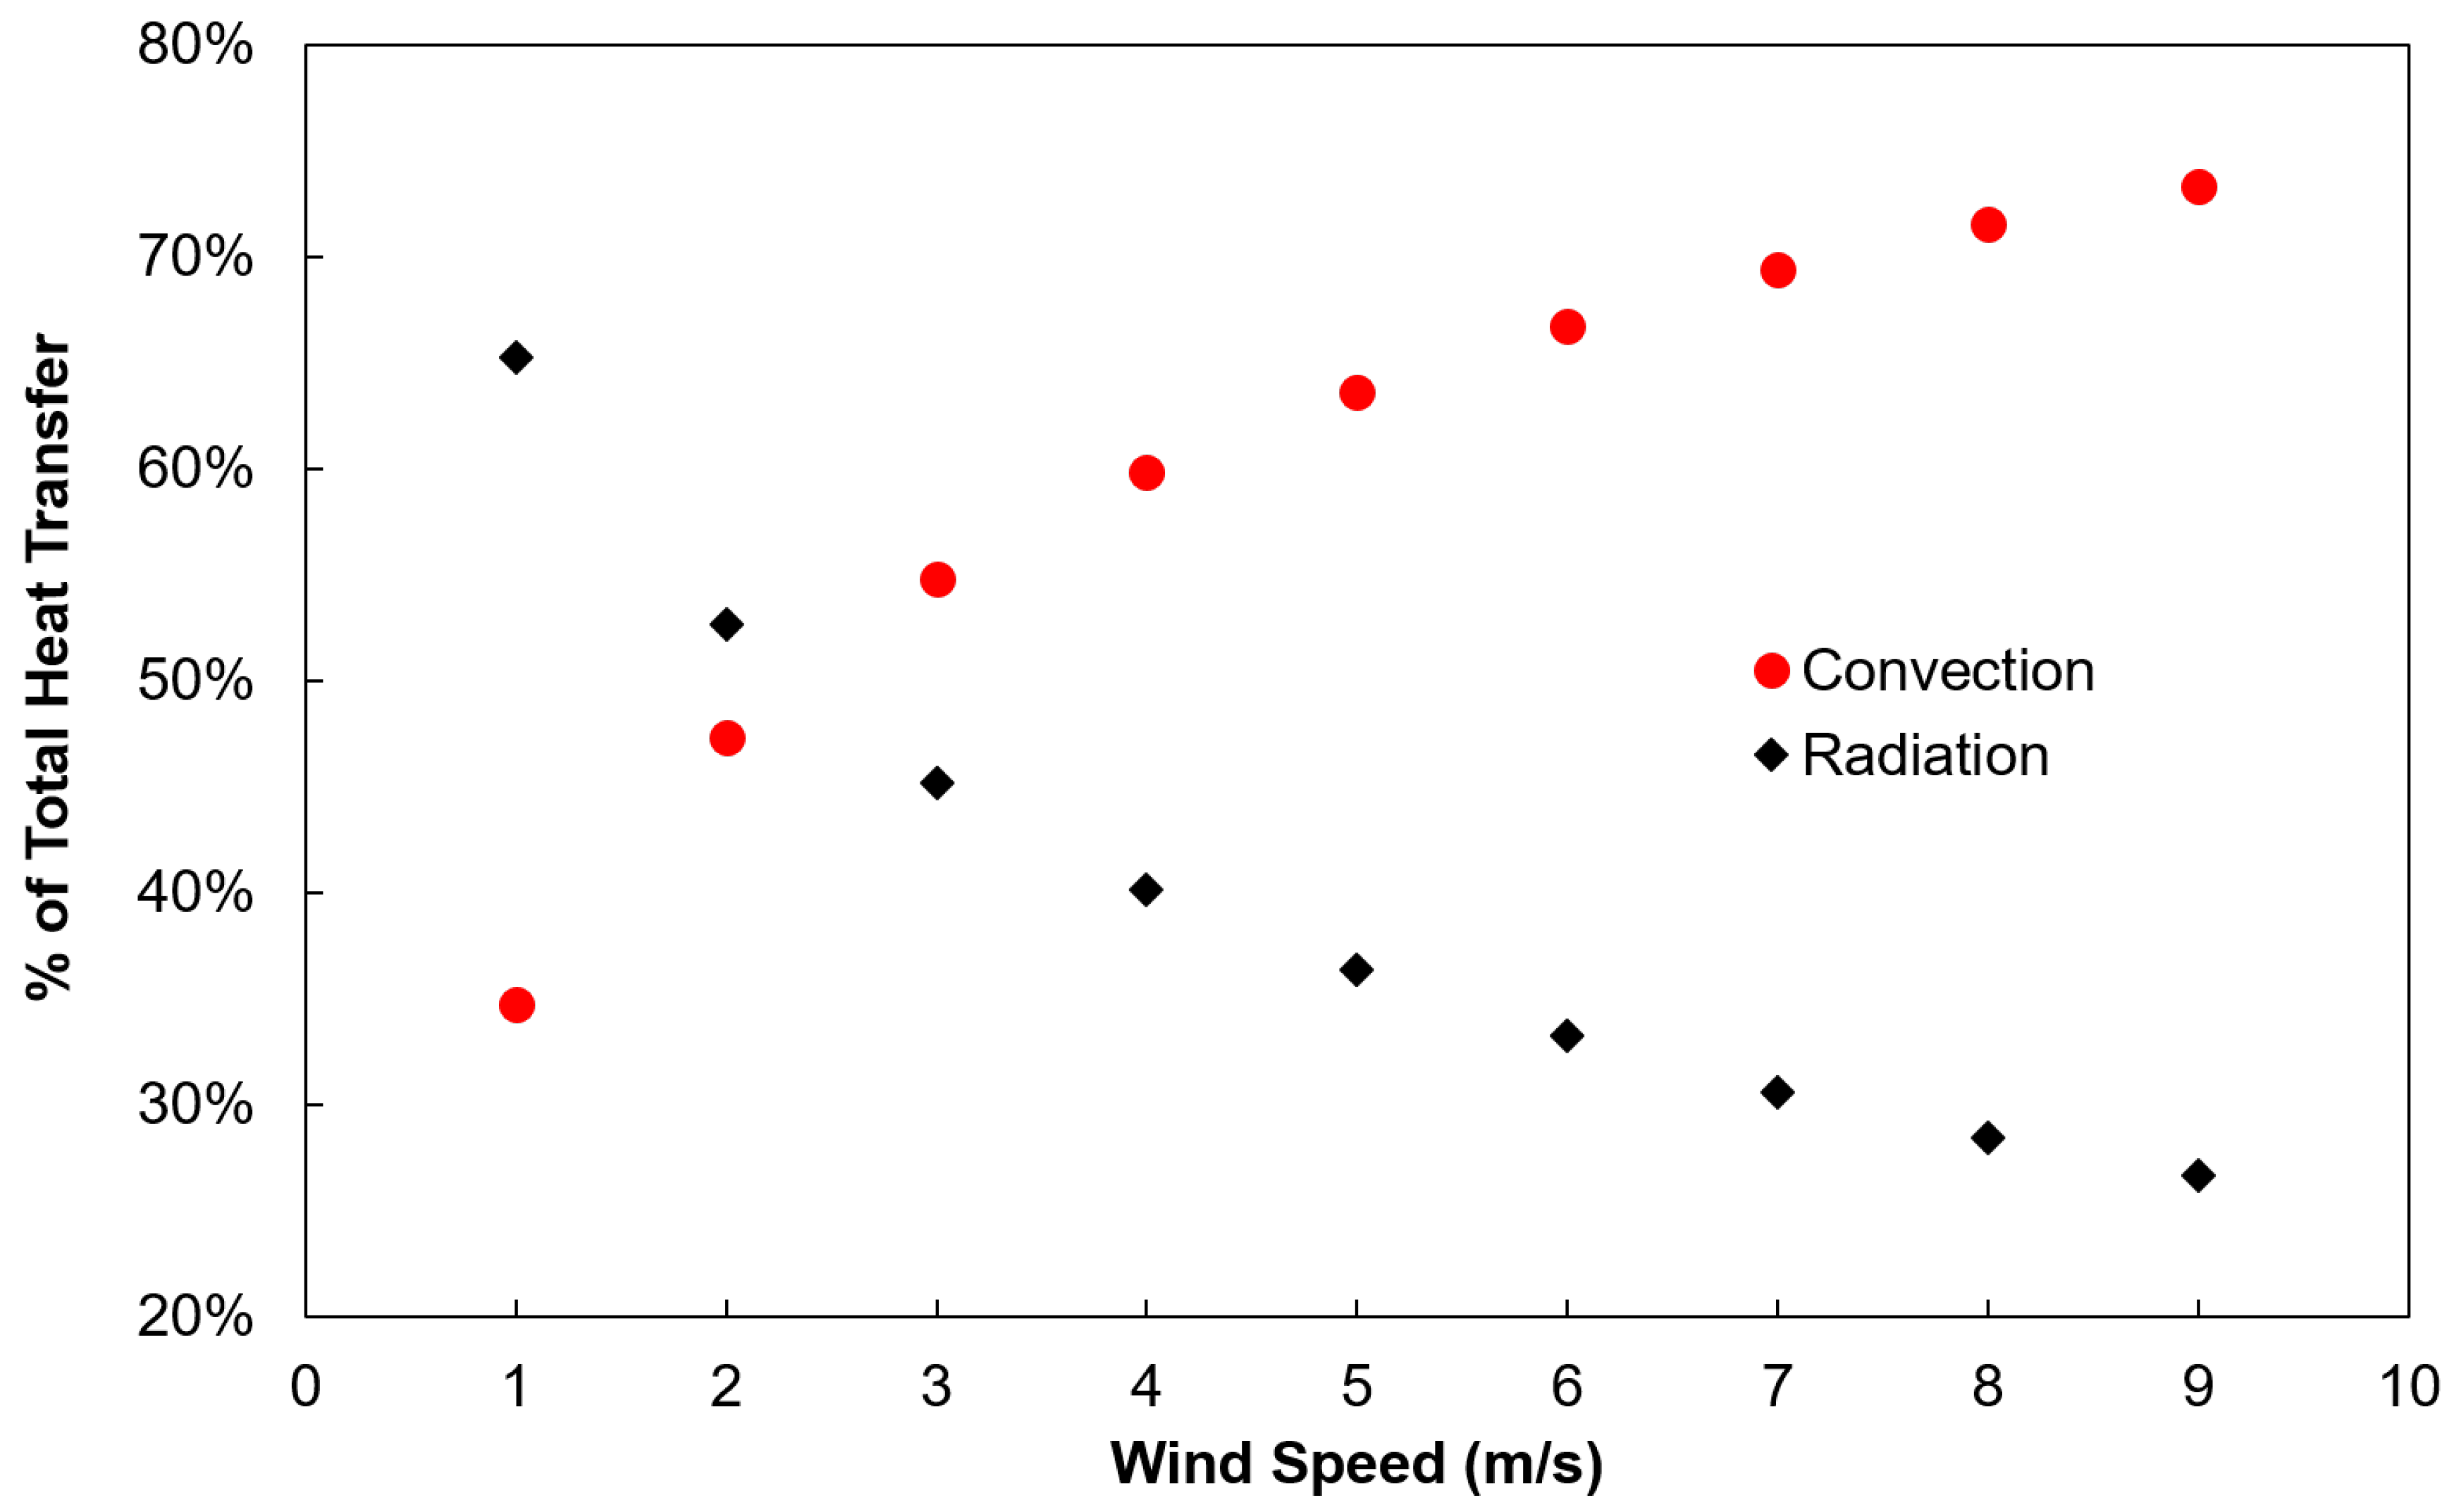
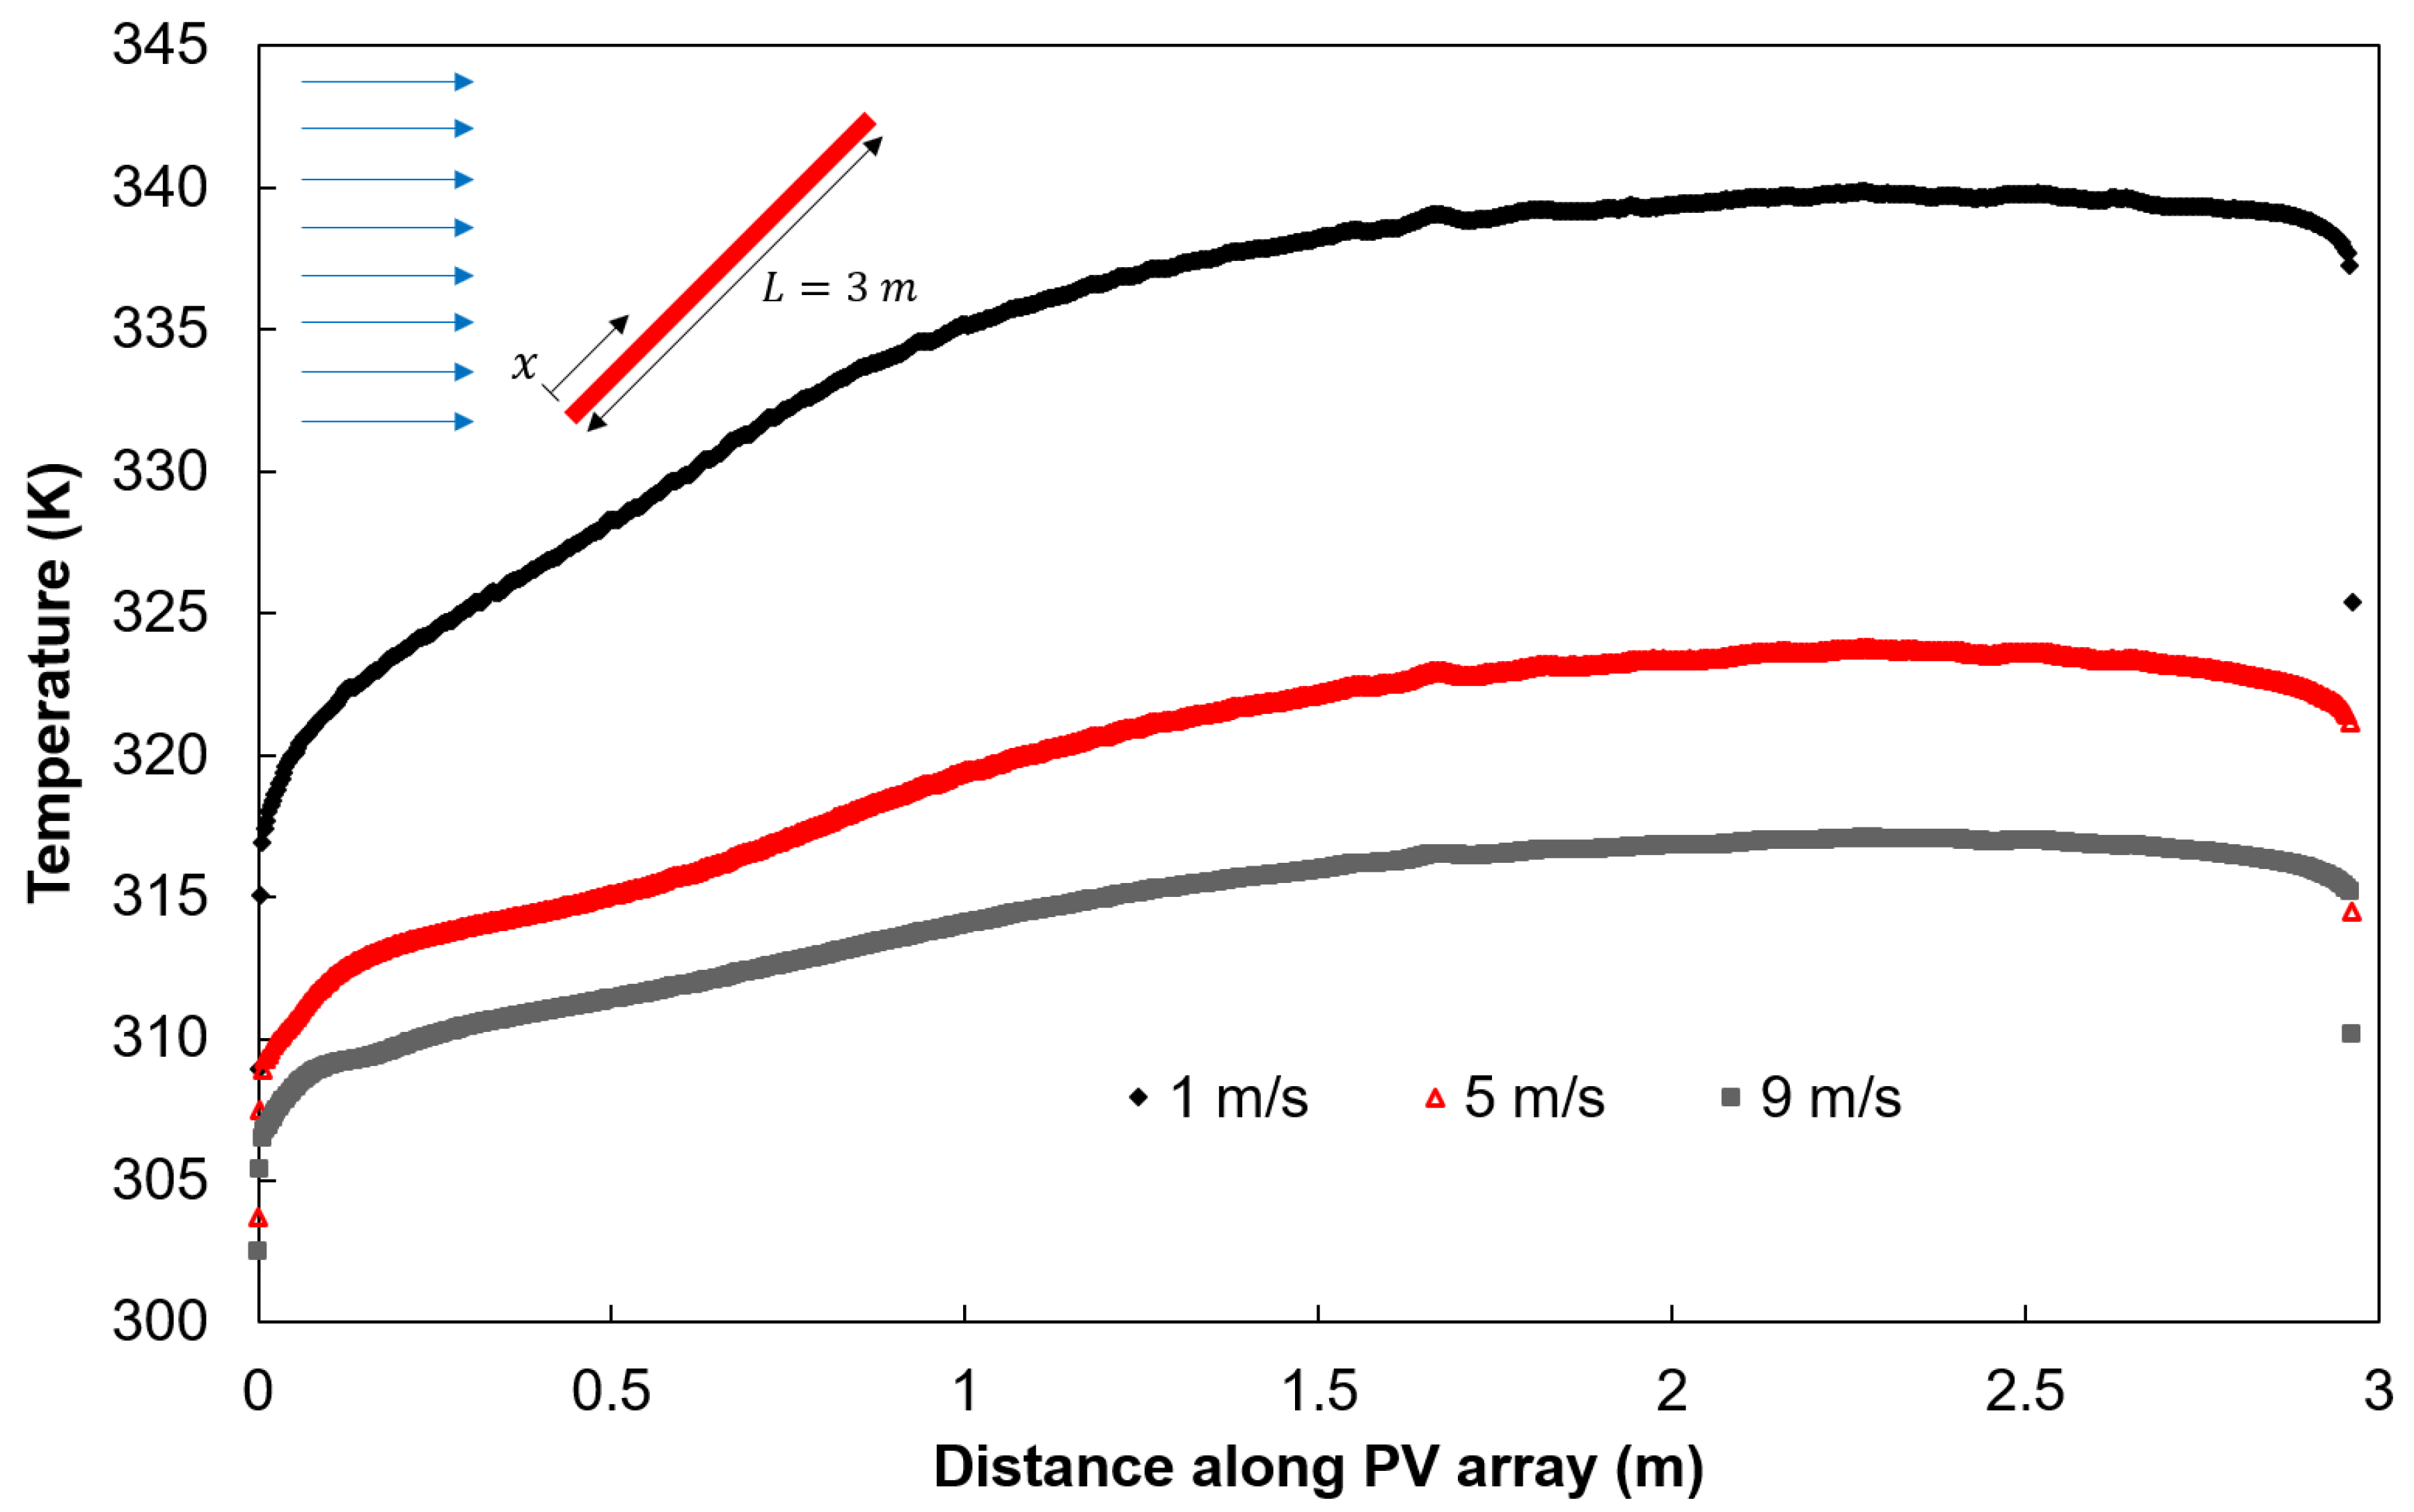
As wind speed increases, the relative importance of radiation and convective heat transfer also changes, as seen in Figure 13. At 1 m/s, convection only contributes to 35% of total heat transfer, while at 9 m/s, the share increases to approximately 75%. At greater than 3 m/s, the convective heat transfer process becomes the dominant mode. Furthermore, wind speed also significantly affects the temperature profile along the PV array. Looking at Figure 14, at a lower wind speed of 1 m/s, we see as much as a 25 °C difference in temperature in the array, while at higher winds, the temperature becomes more uniform. This thermal cycling can affect the longevity of the PV array [27,28].

6. Conclusions

The relationships between ambient temperature, wind speed, and wind direction on PV electrical output were analyzed in this work. Ambient and array temperatures, solar irradiance, wind speed, wind direction, and electrical output from a PV array mounted on top of an industrial building in Varennes, Quebec, were recorded from 2018 to 2019. The experimental results show that the PV array produced power at higher efficiency with lower surface and ambient temperatures. The findings also reveal that efficiency seems to increase linearly with increasing wind velocity; therefore, we conclude that wind velocity is an important parameter in estimating PV performance. Wind direction, however, appears to have little to no effect on array temperature in this case. CFD simulations were performed and showed that temperature along the array surface can vary significantly at lower wind speeds and that this variability decreases at higher wind speeds. Furthermore, the heat transfer contribution from convection becomes more important than radiation at wind speeds greater than 3 m/s, and radiation effects cannot be ignored. Finally, an empirical correlation of heat transfer coefficient/thermal loss factor has been developed and is valid between 1 to 9 m/s for all wind directions, at high solar irradiance of 700 to 1100 W/m2.

Author Contributions

Conceptualization, J.K. and C.B.-J.; Methodology, J.K. and L.G.; software, L.G. and K.P.; validation, J.K., L.G., A.F. and K.P.; formal analysis, L.G., A.F. and K.P.; investigation, C.B.-J., J.K., L.G., A.F. and K.P.; resources, C.B.-J.; data curation, L.G., A.F. and K.P.; writing—original draft preparation, C.B.-J., J.K., L.G., A.F. and K.P. writing—review and editing, C.B.-J., J.K., L.G., A.F. and K.P.; visualization, L.G., A.F. and K.P.; supervision, J.K., C.B.-J.; project administration, J.K.; funding acquisition, J.K. All authors have read and agreed to the published version of the manuscript.

Funding

This research was funded by the Center of Energy and Sustainability at California State University, Los Angeles, and the National Science Foundation under Award No. HRD-1547723.

Institutional Review Board Statement

Not applicable

Informed Consent Statement

Not applicable

Data Availability Statement

The data presented in this study are available on the request from the corresponding author.

Conflicts of Interest

The authors declare no conflict of interest.

Abbreviations

The following abbreviations are used in this manuscript:
CFDComputational fluid dynamics
PVPhotovoltaic

References

  1. Iakovidis, F.; Ting, D.S.K. Effect of Free Stream Turbulence on Air Cooling of a Surrogate PV Panel. In Proceedings of the ASME 2014 International Mechanical Engineering Congress and Exposition, Montreal, QC, Canada, 14–20 November 2014. [Google Scholar] [CrossRef]
  2. Jubayer, C.M.; Hangan, H. Numerical simulation of wind effects on a stand-alone ground mounted photovoltaic (PV) system. J. Wind Eng. Ind. Aerodyn. 2014, 134, 56–64. [Google Scholar] [CrossRef]
  3. Abiola-Ogedengbe, A. Experimental Investigation of Wind Effect on Solar Panels. Master’s Thesis, University of Western Ontario, London, ON, Canada, 2013. [Google Scholar]
  4. Mahboub, C.; Moummi, N.; Moummi, A.; Youcef-Ali, S. Effect of the angle of attack on the wind convection coefficient. Sol. Energy 2011, 85, 776–780. [Google Scholar] [CrossRef]
  5. Palyvos, J. A survey of wind convection coefficient correlations for building envelope energy systems’ modeling. Appl. Therm. Eng. 2008, 28, 801–808. [Google Scholar] [CrossRef]
  6. Sartori, E. Convection coefficient equations for forced air flow over flat surfaces. Sol. Energy 2006, 80, 1063–1071. [Google Scholar] [CrossRef]
  7. Loveday, D.; Taki, A. Convective heat transfer coefficients at a plane surface on a full-scale building facade. Int. J. Heat Mass Transf. 1996, 39, 1729–1742. [Google Scholar] [CrossRef]
  8. Test, F.; Lessmann, R.; Johary, A. Heat transfer during wind flow over rectangular bodies in the natural environment. J. Heat Transf. 1981, 103, 262–267. [Google Scholar] [CrossRef]
  9. McAdams, W.H.A. Heat Transmission; McGraw-Hill: New York, NY, USA, 1954. [Google Scholar]
  10. Sharples, S.; Charlesworth, P. Full-scale measurements of wind-induced convective heat transfer from a roof-mounted flat plate solar collector. Sol. Energy 1998, 62, 69–77. [Google Scholar] [CrossRef]
  11. Sparrow, E.M.; Ramsey, J.; Mass, E. Effect of finite width on heat transfer and fluid flow about an inclined rectangular plate. J. Heat Transf. 1979, 101, 199–204. [Google Scholar] [CrossRef]
  12. Onur, N. Forced convection heat transfer from a flat-plate model collector on roof of a model house. Wärme-Und StoffüBertrag. 1993, 28, 141–145. [Google Scholar] [CrossRef]
  13. Vasel, A.; Iakovidis, F. The effect of wind direction on the performance of solar PV plants. Energy Convers. Manag. 2017, 153, 455–461. [Google Scholar] [CrossRef]
  14. Wu, Y.Y.; Wu, S.Y.; Xiao, L. Numerical study on convection heat transfer from inclined PV panel under windy environment. Sol. Energy 2017, 149, 1–12. [Google Scholar] [CrossRef]
  15. Wu, S.Y.; Wu, Y.Y.; Xiao, L.; Yang, Z. Experimental study of natural convection heat transfer from a nonuniformly heated flat plate simulating PV panel. J. Mech. Sci. Technol. 2018, 32, 423–432. [Google Scholar] [CrossRef]
  16. Ghabuzyan, L.; Kuo, J.; Baldus-Jeursen, C. Quantifying the Effects of Convective Heat Transfer on Photovoltaic Performance and Optimal Tilt Angle. In ASME International Mechanical Engineering Congress and Exposition; American Society of Mechanical Engineers: Portland, OR, USA, 2020. [Google Scholar]
  17. Ogundimu, E.; Akinlabi, E.; Mgbemene, C. Maximizing The Output Power Harvest of a Pv Panel: A Critical Review. J. Phys. Conf. Ser. IOP Publ. 2019, 1378, 032054. [Google Scholar] [CrossRef]
  18. Bhattacharya, T.; Chakraborty, A.K.; Pal, K. Effects of ambient temperature and wind speed on performance of monocrystalline solar photovoltaic module in Tripura, India. J. Sol. Energy 2014, 2014, 817078. [Google Scholar] [CrossRef] [Green Version]
  19. Ma, T.; Zhao, J.; Li, Z. Mathematical modelling and sensitivity analysis of solar photovoltaic panel integrated with phase change material. Appl. Energy 2018, 228, 1147–1158. [Google Scholar] [CrossRef]
  20. Goverde, H.; Goossens, D.; Govaerts, J.; Catthoor, F.; Baert, K.; Poortmans, J.; Driesen, J. Spatial and temporal analysis of wind effects on PV modules: Consequences for electrical power evaluation. Sol. Energy 2017, 147, 292–299. [Google Scholar] [CrossRef]
  21. Prilliman, M.; Stein, J.S.; Riley, D.; Tamizhmani, G. Transient Weighted Moving-Average Model of Photovoltaic Module Back-Surface Temperature. In Proceedings of the 2020 47th IEEE Photovoltaic Specialists Conference (PVSC), Calgary, OR, Canada, 15 June–21 August 2020. [Google Scholar]
  22. Coskun, C.; Toygar, U.; Sarpdag, O.; Oktay, Z. Sensitivity analysis of implicit correlations for photovoltaic module temperature: A review. J. Clean. Prod. 2017, 164, 1474–1485. [Google Scholar] [CrossRef]
  23. PVsyst 7 Help: Array Thermal Losses. 2019. Available online: https://www.pvsyst.com/help/index.html?thermal_loss.htm (accessed on 23 December 2020).
  24. Oliphant, M. Measurement of wind speed distributions across a solar collector. Sol. Energy 1980, 24, 403–405. [Google Scholar] [CrossRef]
  25. Olsen, T.; Preus, R. Small Wind Site Assessment Guidelines; Technical Report; National Renewable Energy Lab. (NREL): Golden, CO, USA, 2015.
  26. Fields, J.; Oteri, F.; Preus, R.; Baring-Gould, I. Deployment of Wind Turbines in the Built Environment: Risks, Lessons, and Recommended Practices; Technical Report; National Renewable Energy Lab. (NREL): Golden, CO, USA, 2016. [CrossRef] [Green Version]
  27. McMahon, T. Accelerated testing and failure of thin-film PV modules. Prog. Photovolt. Res. Appl. 2004, 12, 235–248. [Google Scholar] [CrossRef]
  28. Lee, Y.; Tay, A.A. Finite element thermal stress analysis of a solar photovoltaic module. In Proceedings of the 2011 37th IEEE Photovoltaic Specialists Conference, Seattle, WA, USA, 19–24 June 2011; pp. 3179–3184. [Google Scholar] [CrossRef]
Figure 1. PV array setup at CanmetENERGY in Varennes.
Applsci 11 01460 g001
Figure 2. CFD domain.
Applsci 11 01460 g002
Figure 3. Mesh (Mesh 3) used in this work.
Applsci 11 01460 g003
Figure 4. Wind speed histogram.
Applsci 11 01460 g004
Figure 5. Ambient temperature histogram.
Applsci 11 01460 g005
Figure 6. Efficiency vs. array temperature at different wind speeds. The red line is the theoretical efficiency line provided by the manufacturer using Equation (1).
Applsci 11 01460 g006
Figure 7. Wind speed vs. temperature difference between ambient and array.
Applsci 11 01460 g007
Figure 8. Wind speed vs. temperature difference between ambient and array.
Applsci 11 01460 g008
Figure 9. Relationship between PV array efficiency and ambient temperature.
Applsci 11 01460 g009
Figure 10. Efficiency vs. temperature at different wind speeds.
Applsci 11 01460 g010
Figure 11. Array efficiency at different wind speeds.
Applsci 11 01460 g011
Figure 12. Thermal loss factor from experimental and CFD simulations with varying wind speeds and solar irradiance.
Applsci 11 01460 g012
Figure 13. Contribution of radiative and convective heat transfer as a percentage of total heat transfer at various wind speeds.
Applsci 11 01460 g013
Figure 14. Temperature along the length of PV array at different wind speeds.
Applsci 11 01460 g014
Table 1. Reported PV flat plate heat transfer coefficient ( h ) and Nusselt number correlations. V is wind speed in m/s.
CorrelationReference
h = 5.74 V 0.8 L 0.2 Sartori [6]
h = 16.21 V 0.452 Loveday and Taki [7]
h = 8.55 + 2.56 V Test et al. [8]
h = 5.7 + 3.8 V Goswami et al. [9]
h = 8.7 + 9.4 V Sharples et al. [10]
N u = 0.86 R e 0.5 P r 1 / 3 Sparrow [11]
N u = 1.067 R e 0.466 P r 1 / 3 Onur [12]
Table 2. Properties of the PV array.
Parameter NameSymbolValue
Reference Efficiency η r e f 15.23%
Reference Temperature T r e f 25 °C
Absorptivity α 0.9
Temperature Coefficient β −0.43%/°C
Table 3. Reported Equipment Error and Sampling information.
EquipmentAccuracySample Rate
RM Young 2D Ultrasonic Anemometer±2%0.1 Hz
Dycor DT85 with CEM20 Datataker±0.5%0.1 Hz
Accuenergy Acuvim II Smartmeter±0.2%0.1 Hz
Kipp & Zonen CMP10 Pyronometer±1.5%0.1 Hz
Kipp & Zonen CMP22 Pyronometer±1.5%0.1 Hz
Omega SA1XL Thermocouple±0.7 °C0.1 Hz
Table 4. Mesh sensitivity analysis at wind speed of 7 m/s and solar irradiance of 800 W/m2.
MeshNumber of CellsHeat Transfer Coefficient (W/m2·K)
Mesh 1176,40949.12
Mesh 2319,31147.53
Mesh 3383,59947.47
Mesh 4627,83047.48
Table 5. Reported values for U c and U v considering no wind dependency (NWD) and wind dependent (WD).
Free-StandingFully Insulated BacksideLarge SystemFree-StandingCurrent
(NWD)(NWD)(NWD)(WD)(WD)
U c (W/m2·K)2915292515–25
U v (W/m2·K/(m/s))0001.23.5
Publisher’s Note: MDPI stays neutral with regard to jurisdictional claims in published maps and institutional affiliations.