Featured Application
This work has direct applications to COVID-19 diagnosis.
Abstract
Diagnosis aid systems that use image analysis are currently very useful due to the large workload of health professionals involved in making diagnoses. In recent years, Convolutional Neural Networks (CNNs) have been used to help in these tasks. For this reason, multiple studies that analyze the detection precision for several diseases have been developed. However, many of these works distinguish between only two classes: healthy and with a specific disease. Based on this premise, in this work, we try to answer the questions: When training an image classification system with only two classes (healthy and sick), does this system extract the specific features of this disease, or does it only obtain the features that differentiate it from a healthy patient? Trying to answer these questions, we analyze the particular case of COVID-19 detection. Many works that classify this disease using X-ray images have been published; some of them use two classes (with and without COVID-19), while others include more classes (pneumonia, SARS, influenza, etc.). In this work, we carry out several classification studies with two classes, using test images that do not belong to those classes, in order to try to answer the previous questions. The first studies indicate problems in these two-class systems when using a third class as a test, being classified inconsistently. Deeper studies show that deep learning systems trained with two classes do not correctly extract the characteristics of pathologies, but rather differentiate the classes based on the physical characteristics of the images. After the discussion, we conclude that these two-class trained deep learning systems are not valid if there are other diseases that cause similar symptoms.
1. Introduction
Advances in imaging technology and computer science have greatly enhanced the interpretation of medical images and contributed to early diagnosis.
The typical architecture of a Computer-Aided Diagnosis (CAD) system includes image pre-processing, the definition of the region(s) of interest, feature extraction and selection, and classification. Currently, Deep Learning (DL) is probably the most widely used technology to implement this type of system. This technology requires large training datasets, and the data have to be correctly labeled in order to learn the relevant patterns [1,2]. This data-intensive nature of DL and the necessity of labels has produced models that usually do not generalize well when there is a distribution shift between training and evaluation data [3].
When focusing on the study of respiratory infectious diseases that affect lungs (mainly pneumonia), different types can be found based on the information provided by X-ray pulmonary images. In addition, these problems can be produced by bacteria, viruses, or fungi.
Thus, if the system trained by pulmonary X-ray images classifies between healthy patients and patients with a disease that leads to pneumonia, it is logical to think that the system would focus on detecting lung problems. Thus, it would not be correct to say that the developed system provides an accurate result for that particular disease.
In the particular case that concerns us, how is COVID-19 pneumonia different from regular pneumonia? The symptoms of COVID-19 pneumonia can be similar to other types of viral pneumonia. Because of this, it can be difficult to know what is causing this condition without getting tested for COVID-19 or other respiratory infections.
Research is underway to determine how COVID-19 pneumonia differs from other types of pneumonia. Information from these studies can potentially aid in the diagnosis and in expanding our understanding of how SARS-CoV-2 affects lungs [4].
That study used Computerized Tomography (CT) scans and laboratory tests to compare the clinical features of COVID-19 pneumonia with other types of pneumonia. The researchers found that people with COVID-19 pneumonia were more likely to have:
- Pneumonia that affects both lungs instead of just one (bilateral pneumonia).
- Lungs that had a characteristic “ground glass” appearance on CT scans.
- Abnormalities in some laboratory tests, particularly those that were evaluated.
However, we are talking about probabilities, not exact rules. Thus, using lung X-ray images, a patient with COVID-19 can be erroneously classified as a patient with any other type of disease that causes similar damages to lungs.
Considering the above-mentioned diagnosis aid systems, the availability of multiple Chest X-Ray (CXR) datasets and the advances in the field of deep learning have facilitated the development of techniques for automatic image interpretation [5]. These techniques have been recently applied to COVID-19 detection in CXR images, e.g., [6,7,8,9,10]. In general, these papers used widely different datasets with different domains and distributions. As an example, Reference [6] used 184 COVID-19 images and 5000 non-COVID-19 images coming from 13 different categories. As a second example, Reference [8] used 358 CXR images from 266 COVID-19 patient cases, 8066 with no pneumonia (i.e., normal) and 5538 with non-COVID-19 pneumonia. As a further example, Reference [7] distinguished only between COVID-19 and tuberculosis. In general, we can find tools that distinguish between several classes (e.g., COVID-19, non-COVID-19 pneumonia, and healthy) or binary systems.
As the first step, we need to study the various datasets and works related to this topic. However, due to the extensiveness of these studies, they are included in the next section.
Thus, generalizing this problem, it is important to study whether the classification systems based on only two classes (healthy or sick) behave correctly.
The main problem with binary systems is that some of them do not try to cover the spectrum of all possible cases that can be found on real CXR and consider only the characteristics that distinguish the two analyzed classes.
A priori, and according to current studies, if the disease whose images are used to train the DL system has very characteristic features that distinguish it from any other disease, it is feasible to think about this possibility. However, if the classifier is trained with images that focus on symptoms generated by that disease and that may appear in other cases (not being exclusive to the trained disease), it is fair to think that the system could make errors if it is tested with images of patients with other diseases with similar symptoms not included in the training dataset.
Thus, in this work, we ask the question: Does the use of two classes in disease classification systems based on convolutional networks correctly extract the characteristics that distinguish that disease, or, on the contrary, does it only extract the characteristics that differentiate a healthy patient from another with the specific disease?
In the rest of the paper, we deal with the real-world problem of diagnosis aids originally trained with a specific domain and distribution and later used in a more realistic situation.
To try to answer these questions, in this work, various studies are carried out in which DL systems for lung diseases’ classification are trained. In these studies, exclusively two-class training is carried out, and images from another untrained class is used to test the system. Of course, diseases that share symptoms of pneumonia are used in order to observe the behavior of the trained systems.
In addition, considering the current global situation and focusing this study on a topic that is now very relevant, in this work, we focus on the application case of COVID-19 detection. In this way, we consider three main classes: healthy, pneumonia, and COVID-19. For this study, we train DL two-class classification systems that distinguish between:
- Healthy patients and COVID-19 patients; using pneumonia patients as the test case.
- Healthy patients and patients with pneumonia; using COVID-19 patients as the test case.
- Patients with pneumonia and patients with COVID; using healthy patients as the test case.
The rest of the paper is divided as follows: First, in the Materials and Methods Section, the different datasets and published works are detailed, as well as the analysis methodology used to test the different systems. Next, the results obtained after training and testing the different systems are detailed and explained in the Results and Discussion Sections. Finally, conclusions are presented.
2. Materials and Methods
In this section, the theories detailed above are focused on some of the most relevant works currently published about COVID-19 detection using medical images. To achieve this goal, first, we present the current publicly available datasets. Next, we summarize a significant subset of the published works, considering the datasets used by each one. This paper does not pretend to be a review of the existing papers on CXR-based COVID-19 diagnosis aids; thus, we include a subset of the available papers that is wide enough to demonstrate our theories. Finally, we detail the methodology used to demonstrate the theories presented in the Introduction about the goodness of COVID-19 detection systems based on convolutional neural networks with only two classification classes.
2.1. Works and Datasets
First, a study of the different publicly accessible datasets was carried out. It should be noted that, on some occasions, the datasets collected to prepare a work are not published, and therefore, we cannot evaluate them to corroborate their content. However, thanks to the published articles, we can indicate their most relevant characteristics. The results of this study are shown in Table 1.

Table 1.
Dataset summary. 1 Percentage of COVID-19 positive images. 2 Calculated from the number of classes in the dataset.
As can be observed in the datasets shown in Table 1, some of them only provide information about two classes: COVID-19 positive and COVID-19 negative. Due to this fact, on some occasions, the election of using a 2-class classification system in some works depends on the dataset used. Moreover, some datasets combine images from other COVID-19 datasets (like COVIDx-CRX, which includes some images from other datasets of the previous table), and finally, in some cases, other classic pneumonia datasets are used to complete the dataset itself.
However, as can be observed in Table 2, the most widely used dataset is COVID-chestXray, which does provide information on more than two classes. This dataset uses its own images and distinguishes between several illnesses that attack lungs and produce different types of pneumonia; thus, this is the most complete dataset. Furthermore, as can be observed in the last two columns of Table 1 (and based on the explanation included in the caption), this dataset is the most balanced among the studied datasets that distinguish between more than two classes.
Table 2.
Deep Learning based CXR and CCT COVID-19 classification works.
Other important points shown in Table 2 are described next:
- All the works used Deep Learning (DL) as the mechanism to detect COVID-19 positives. However, four of them used a variant based on transfer learning, obtaining a Deep Transfer Learning (DTL) system.
- Sixty-six-point-seven percent of the works detailed only classified between COVID-19 positive or COVID-19 negative.
- ResNet is the most used CNN model. It is important to mention that other works like [9] used very simple and computationally very light training models (such as pretrained VGG16), but despite this, very promising results were obtained.
After presenting the most widely used datasets and some of the most relevant works, the methodology used in this work to test the quality of the COVID-19 classification systems that only use two classes is described.
2.2. Study Approach
In this subsection, the dataset used for this work and the system’s architecture are detailed. First, the dataset is presented.
2.2.1. Dataset Used
To carry out our study, a combination of the COVID-chestXray [11] (only CT images) and COVIDx-CXR [8] datasets using three classes (COVID-19, pneumonia, healthy) is used. After this combination, the obtained dataset is almost perfectly balanced (≈33.3% for each class). Although it contains images registered by different acquisition technologies and different dispositions of the patient’s torso during registration, there is a very high imbalance, and the most abundant are those obtained by X-ray generators and with the torso exposed from the front so that the two lungs can be seen in the same image. Therefore, to achieve a sufficiently homogeneous sample for our study, only images with these characteristics were used. By performing this filter, bias was limited, and a better interpretation of the results could be obtained; however, the total number of images for each class was significantly reduced.
In this study, we trained three different models for a binary classification problem, considering only two of the three classes in the dataset for each training experiment. To verify that the model is effective for the corresponding classification problem, the dataset was split for training and validation using the hold-out technique, that is a subset was randomly selected for the training of the models, and the remaining subset was used to assess the model performance. Thus, a subset with 80% of the dataset samples was used for training, while the remaining 20% subset was used for evaluation. Table 3 shows the distribution.
Table 3.
Dataset distribution for each subset.
Once the dataset has been described, the next step (and the most important one) in our study is to check the behavior of each binary model when it receives samples from the class for which it has not been trained. For this reason, in this second phase of the study, all samples of the excluded class were used as the test subset for the respective binary model. This explanation is detailed further in the next subsection.
2.2.2. Processing Architecture
In this work, the VGG16 architecture [28] was used as the backbone. The weights used are those resulting from a pre-training with the ImageNet dataset [29]. An average-pooling layer was added next, whose results were flattened and transmitted to a dense layer of 64 nodes and, finally, a last inference layer. Only these last added layers were trained with the previously described dataset. The architecture was implemented using TensorFlow with Keras.
Additionally, dataset pre-processing was applied before the training process. The images stored in the initial dataset contained lung X-ray images of healthy patients, patients with pneumonia, and COVID-19 positives. However, some samples of the COVID-19 positive cases were not obtained with the same acquisition parameters. Moreover, in order to work with a subset of images with similar features, a histogram equalization was applied as a pre-processing step.
As explained above, using the TensorFlow framework with Keras, a VGG16 architecture was combined with a final inference layer to train the classification systems. In this study, three binary classification models were trained. These models were:
- H-P model: A first model trained only with Healthy (H) and Pneumonia (P) samples.
- H-C model: A model trained with Healthy (H) and COVID-19 positive (C) samples.
- P-C model: A model trained with Pneumonia (P) and COVID-19 positive (C) samples.
Once the system architecture and the dataset used to obtain the classification mechanism have been specified, the procedure used in this study to analyze the trained models must be assessed.
2.2.3. Performance Assessment
The final purpose of our study is to know the vulnerabilities that a trained and evaluated model may have for a case of binary classification of lung pathology. For this purpose, the following two study phases are proposed:
- Classic model test: A conventional training and evaluation are carried out. This is used to evaluate the samples of the classes for which the model has been trained. It is evaluated through the use of metrics and the analysis of the confusion matrix.The metrics considered consist of accuracy, precision, recall, and f1-score.where in this case, . The term refers to the number of samples with class c that were classified correctly as c. The term means the set of samples with a different class of c that were classified as c by the model. refers to the set of samples with class c that were classified as other different class. indicates the number of samples with a class other than c that were not classified as c.
- Extended class test: The quality of the model for extracting real features is evaluated with the samples of the class not used during the training of each model. In this test, the model can behave in two different ways:
- −
- Valid model: The classifier would be valid if it is able to classify the samples with the more similar class of the two considered (depending on the third class used).
- −
- Invalid model: it would not be valid if the model makes a balanced distribution of the samples or if the samples are classified randomly.
If the model is considered as invalid, it means that the model is not capable of extracting real features from the classes, but it only distinguishes differences between both of them. That is why in this phase, the distribution of the samples classified by the models are analyzed. Additionally, the performance results that each model would achieve when faced with a homogeneous sample of the three considered classes are shown. As the models have been designed to solve binary classification problems, in order to correctly interpret the results, we must combine the samples of two classes and assume a new classification problem, which will depend on the combination performed. The combinations and the resulting classification problems are displayed in the Results Section.
For the case of a valid model, the expected results for each trained model are detailed next:
- H-P model: The testing class will be COVID-19. In this case, as COVID-19 patients present more severe symptoms of pneumonia than patients diagnosed with another type of pneumonia, a valid model should be capable of classifying COVID-19 patients in the pneumonia class.
- H-C model: The testing class will be pneumonia. In this case, if the system detects lung problems, pneumonia patients should not be classified as healthy.
- P-C model: The testing class will be healthy. In this case, if the system distinguishes the severity of lung damage, healthy patients should be classified in the pneumonia class.
After presenting the methodology used to test the theories discussed in the Introduction, the results are detailed in the next section.
3. Results
This section is divided into two subsections. In the first one, the classical model verification is presented; and in the second one, the extended class test is performed.
3.1. Classical Model Verification
Each binary class is trained, and the results obtained from the previously defined metrics are detailed in Table 4. These results are obtained after testing the system with 20% of the samples of the same classes used for the training.
Table 4.
Results for metrics.
These results are presented next with normalized confusion matrices (see Figure 1) and ROC curves (see Figure 2).
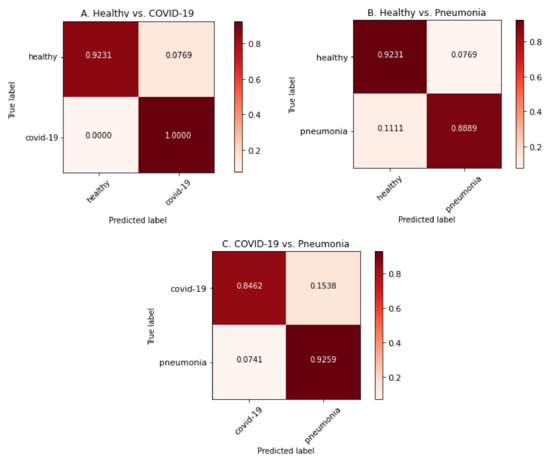
Figure 1.
Confusion matrices for each model by using image samples for which it has been trained.
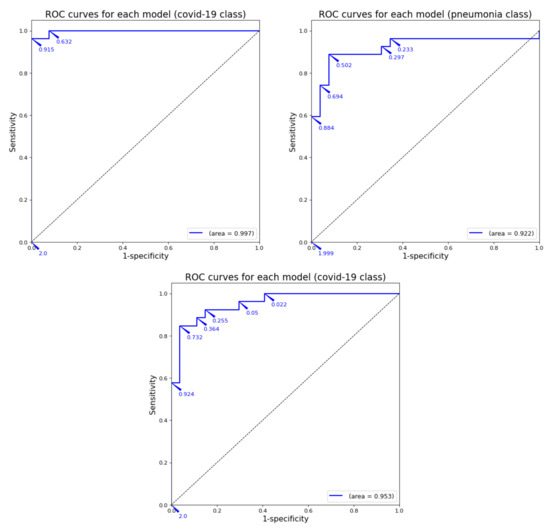
Figure 2.
ROC curve for each model by using image samples for which it has been trained.
As can be observed in the previous tables and graphs, the classification systems that only use two classes obtain high performance results. Furthermore, the binary system trained only with healthy and COVID-19 images obtains a 96% accuracy (better that almost all the binary systems presented in Table 2). The only work with binary classification that obtained better results was the one by Ahoja et al. [19]; however, in that work, the DL model was much more complex that the one used for this training.
3.2. Extended Class Test
As detailed before, in this subsection, images from the non-trained class to test each binary system are used. Summarizing, the class used for testing is:
- H-P model: the testing class will be COVID-19.
- H-C model: the testing class will be pneumonia.
- P-C model: the testing class will be healthy.
Results obtained after testing each system with the third class are shown in Table 5. These results are not presented using confusion matrices and/or ROC curves as the results obtained would not be correct because there are no true positive classifications, and that value is essential to calculate the metrics involved in such representations.
Table 5.
Classification results obtained with the non-trained class for each binary model.
As can be observed in Table 5, each model behaves differently. However, these results are analyzed in the Discussion Section with a medical approach in order to know if the trained model is medically valid or not depending on the results obtained after testing each model with the third class.
Another point of view used to study the quality of DL systems with external classes that have not been used during the training process is to calculate the pseudo confusion matrices (a technique applied in other works like [30,31,32]). This technique consists of assuming that the images of the new class correspond to some of the original classes. In this way, the system is trained with images of all classes, but only classifies among the original classes. In the case of binary systems (such as those studied in this work), two different situations can be obtained for each model consisting of integrating the images of the new class into the two existing classes. If such a study is carried out, the classification results should be able to clarify whether the resulting system is valid or not based on the results of the pseudo confusion matrices.
Thus, with this approach, six different systems have to be considered:
- H-P model—Case 1: COVID-19 images are included in the healthy class, in order to obtain a system that classifies between pneumonia positive and pneumonia negative.
- H-C model—Case 2: COVID-19 images are included in the pneumonia class in order to obtain a system that classifies between healthy and ill.
- P-C model—Case 1: Pneumonia images are included in the healthy class in order to obtain a system that classifies between COVID-19 positive and COVID-19 negative.
- H-P model—Case 2: Pneumonia images are included in the COVID-19 class in order to obtain a system that classifies between healthy and ill.
- H-C model—Case 1: Healthy images are included in the COVID-19 class in order to obtain a system that classifies between pneumonia positive and pneumonia negative.
- P-C model—Case 2: Healthy images are included in the pneumonia class in order to obtain a system that classifies between COVID-19 positive and COVID-19 negative.
The pseudo confusion matrices are presented in Figure 3: the three classes are used with each binary model (rows), including the non-trained class inside another one to resemble real situations (columns).
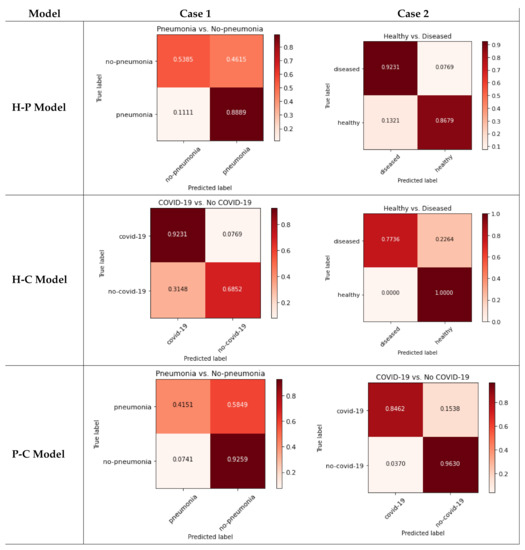
Figure 3.
Pseudo confusion matrices for each model.
As can be seen in Figure 3, each case behaves differently (even within the same model). Each case is analyzed in the Discussion Section.
4. Discussion
The first results presented in Table 4 and detailed in Figure 1 and Figure 2 demonstrate that the DL model used for this work has acceptable results, and the previous works that obtained worse results will probably not behave as well as our system in the next test (using images from a third class not included in the training).
From a medical point of view, the main difference between the three classes involved in this study should focus on alveoli inflammation. In that case, patients classified as healthy should not have any inflammation; patients with COVID-19 should have severe bilateral pneumonia (due to severe alveoli inflammation in both lungs); and patients with other pneumonia should have unilateral inflammation or mild bilateral inflammation (as detailed in [9]). Analyzing each case independently, we can observe:
- [Case 1] H-P model: The system received COVID-19 images for testing. In this case, as healthy patients do not have any alveoli inflammation, a valid DL system should classify all the images as pneumonia. In fact, before the COVID-19 pandemic started, the first cases detected with severe alveoli inflammation in both lungs were classified by specialists as pneumonia.Regarding the results obtained, seventy-one-point-nine-seven percent of the cases are classified as pneumonia, but twenty-eight-point-zero-three percent are classified as healthy. Those results show a too large error for a difference so easily appreciable by a specialist; that is why those results obtained for the H-P model are considered not medically valid.
- [Case 2] H-C model: The system received pneumonia images for testing. This is the most interesting model, as many works presented in the bibliography (see Table 2) used this classification between healthy and COVID-19 patients. However, there have been many deceased patients whose damages provoked pneumonia symptoms. Therefore, a valid DL system should extract the characteristics regarding the alveoli inflammation of the images, and according to that, all images that present some alveoli inflammation should be classified as COVID-19. This may seem unrealistic, but for these DL works, the world itself is divided only into two classes: healthy and COVID-19. Therefore, for these systems, there are no other pneumonia cases beyond COVID-19 patients. That is why, if the meta-characteristics are extracted correctly during the training process, every image with alveoli inflammation should be classified as COVID-19.When focusing on the results obtained in Table 5, the system behavior seems random: half of the images are classified as healthy and the other half as COVID-19. These results seem to indicate that the system does not extract the correct characteristics from the classes involved, and each pneumonia image is classified randomly as healthy or COVID-19, which seems to be a big mistake due to the clear medical differences between those classes. Therefore, according to this, the model should not be considered as medically valid.
- [Case 3] P-C model: In this last model, the system received healthy images for testing. The system itself may not seem useful because no healthy patients were taken onto account. However, in using a medical approach, the pneumonia symptoms can be easily detected by specialist; so, this first division between ill and healthy can be done by doctors. With ill patients, using a system that distinguish between mild and severe pneumonia (produced by COVID-19) can be useful for diagnosis purposes. Even so, no published works used this model because the results obtained (as observed in Table 4) were lower than H-C models because of the differences between both classes. Regarding this model, if the characteristics’ extraction is performed correctly, a healthy patient should be classified in the pneumonia class as the lung damage is much lower that COVID-19 patients. Therefore, if the world is divided between pneumonia and COVID-19 classes, the healthy images are much more similar to pneumonia than COVID-19.Focusing on the results obtained in Table 5 and according to the previous explanation, the system seems to behave correctly: 96.21% of the healthy images are classified as pneumonia. Therefore, in this case, the model seems to be medically valid.
From a medical utility point of view in the case of COVID-19 patient classification, the H-P model does not make much sense. However, the H-C and P-C models do have practical utility: the first model could help to distinguish between healthy and sick patients and the second one to distinguish classic pneumonia from another severe pneumonia caused by COVID-19. Regarding those models, according to the previous explanation, the second one has been tested to be medically useful even if there is no healthy class trained in the system. However, the most useful binary classifier is potentially the H-C model (healthy vs. COVID-19), and this can be observed in the publications presented in Table 2.
Deeply analyzing the pseudo-confusion matrices presented in the Results Section, we can observe:
- H-P Model—Case 1 (Figure 3, top-left): As can be observed, many of the non-pneumonia images are classified as pneumonia (more than 46%), so the case of mixing healthy and COVID-19 classes is not medically valid.
- H-C Model—Case 2 (Figure 3, top-right): The system presents more than 13% of false positives when classifying healthy patients. Joining the COVID-19 and pneumonia classes produces acceptable results for distinguishing between sick and healthy patients, but the results show almost 8% false negative results for the diseased class. However, as detailed before, the H-P model is not useful to distinguish COVID-19 patients.
- P-C Model—Case 1 (Figure 3, middle-left): the integration of the pneumonia class with the healthy class may seem the most logical and easy election due to its use in previous works. For this case, the system obtains more than 31% of false positives for the COVID-19 class, so the results are not acceptable.
- H-P Model—Case 2 (Figure 3, middle-right): Using pneumonia images with COVID-19 may not seem very useful for COVID-19 detection, but in this case, there is 100% of healthy detection. However, there are more than 22% false negatives for diseased.
- H-C Model—Case 1 (Figure 3, bottom-left): For this case, joining the healthy and COVID-19 classes produces more than 92% of true positives for non-pneumonia, but the pneumonia class obtains almost 60% of false negatives. The results are not acceptable.
- P-C Model—Case 2 (Figure 3, bottom-right): Finally, the integration of healthy images with the pneumonia class improves the previous results. However, there is more than 15% of false negatives for the COVID-19 class, which is very dangerous for pandemic spread.
Moreover, after analyzing the results of the pseudo confusion matrices, we can conclude that none of the models presented in the Results section satisfies the requirements of the classifier with guarantees. There are only two cases that obtain acceptable results: Case 2 of the H-P model, but this system does not make sense for the detection of COVID-19; and Case 2 of the P-C model. However, for the latter case, the high rate of false negatives when detecting COVID-19 patients is very dangerous. Furthermore, for the model most widely used for binary classifiers in previous works (H-C model), the results are not acceptable at all, as it obtains results below 70% for some classes.
Thus, after presenting the analytical results, we want to finish this work going back to the Introduction and trying to answer the questions initially posed: Does the use of two classes in disease classification systems based on convolutional networks correctly extract the characteristics that distinguish that disease, or, on the contrary, does it only extract the characteristics that differentiate a healthy patient from another with the disease?
Furthermore, the following question should be added to those already presented above: If the DL system does not correctly extract the characteristics, what is it extracting?
We try to solve these questions in the next subsection.
Answering the Questions
Previously, various DL binary classifiers based on the detection of lung associated pathologies have been tested. For this purpose, they have been tested in extreme conditions where an external class not used in the training phase has been used as a test class.
However, this third class is related to the problem that each model has tried to solve; so, eventually in real life, images from this class may be used as inputs in the developed systems (even accidentally). Furthermore, if a new pathology that causes lung injuries appears in the future, it is important to know how the current systems would act.
The purpose of this study is to try to understand the feature extraction phase of a convolutional DL system. If the trained system correctly extracts the most relevant features from the images (as a perfect system should do), the main feature would be the lung damage present in each image. If this is the case, when testing a new class, the system should classify these images as the already trained class whose lung damage most closely resemble the new class.
According to the results obtained in the previous subsection, we can affirm that the binary systems tested with X-ray images for the detection of lung associated pathologies do not act according to a system that has correctly extracted the relevant characteristics of the images. This affirmation means that, in those cases, these systems would not work correctly with the inclusion of an untrained third class. Therefore, the feature extraction process was not done adequately for those models.
Thus, the questions initially presented can be answered thanks to these results:
- Does the use of two classes in disease classification systems based on convolutional networks correctly extract the characteristics that distinguish that disease?No, it does not. According to the previous results obtained after testing several cases and combinations of binary classifiers for lung damage detection, we demonstrate that the behavior of the models trained with images of untrained classes is not correct and does not behave as if the characteristics of the trained classes had been correctly extracted.
- Does it only extract the characteristics that differentiate a healthy patient from another with the disease?It seems it does, although we cannot affirm this categorically. The operation of the training process of DL systems and the good classification results initially obtained for each binary model for its training classes allow us to affirm with relative security that the system only focuses on detecting the differences between the classes used during the training process.
In this way, the two unknowns that initially arise in this work have been answered. However, according to the obtained results, a new question that we try to answer below appears. If the binary systems studied above do not extract the relevant features from the images used to train them, what features are they extracting during training? Can these be known?
Leaving aside temporarily the topic discussed above about lung damage, if we extend this question to a generic DL system that classifies grayscale images, it is logical to think that the distinction between the different classes that it is classifying could be related to the gray levels of the images involved in the training. Thus, we carry out a preliminary study about the gray levels of the images involved in the previously trained models: healthy, pneumonia, and COVID-19.
First, we randomly select an image from each class, apply the pre-processing (in the same way as carried out before training), and calculate its histogram. The obtained results are shown in Figure 4.
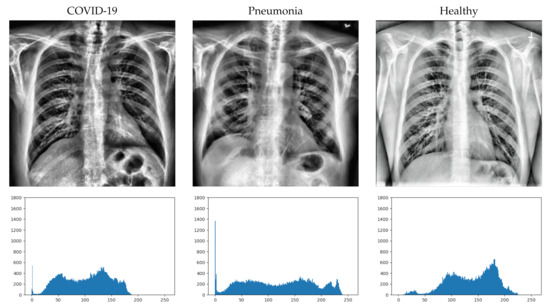
Figure 4.
Image example from each class (after pre-processing) with its histograms.
At first sight, it is not easy to detect the differences in the X-ray images in some cases. Greater inflammation of the alveoli can be seen in the image with COVID-10, but it is difficult to distinguish it from the inflammation that can be seen in the image with pneumonia. However, if we look at the histograms of the images (bottom of Figure 4), we can more clearly distinguish some differences between them. For the displayed images, the COVID-19 image has a higher concentration of dark areas, while the healthy image has a higher concentration of light areas. In the case of pneumonia, it can be seen that the curve of the histogram is flatter, so that it has a more regular concentration than the other two cases.
Even so, we cannot extract the characteristics from three images obtained randomly from the classes. It is true that there are clear differences in the histograms and that they could help in the classification of the DL system, but this does not answer why they are classified incorrectly if the differences are as clearly appreciable as those observed in the figure.
In order to more clearly detect the characteristics of each class, a similar study must be carried out with all the images in the dataset. To achieve this goal, as we know that the relevant information could be concentrated in the histograms, the mean histograms of each class are calculated. These mean histograms show the mean of the occurrences of each value on the grayscale for each class and are presented in Figure 5.
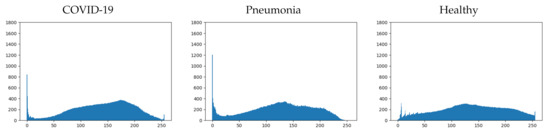
Figure 5.
Mean histogram for each class.
If we analyze more deeply the mean histograms, we can observe some characteristics that clearly distinguish each class:
- COVID-19: This first class presents four important characteristics that can be easily appreciated (see Figure 5-left). They are detailed next:
- −
- Pronounced peak of blacks.
- −
- Maximum concentration, between 150 and 200, with a local peak in the middle of the range.
- −
- Low concentration of whites.
- −
- Small end peak in whites.
- Healthy: This second class presents four important characteristics as well (see Figure 5-right). They are detailed next:
- −
- Low concentration of blacks.
- −
- Maximum concentration, between 100 and 150, with a local peak in the middle of the range.
- −
- Higher concentration of whites.
- −
- Small end peak in whites.
- Pneumonia: This final class presents other characteristics that are similar to the ones detailed for the other two classes (see Figure 5-middle). They are detailed next:
- −
- Pronounced peak of blacks; similar to the COVID-19 class, but larger.
- −
- Maximum concentration, between 100 and 150, with a local peak in the middle of the range; exactly the same as the healthy class.
- −
- Higher concentration of whites than the COVID-19 class, but lower than the healthy class.
- −
- No end peak in whites.
It can be seen that there are shared characteristics between classes. The two classes that have the most differences are COVID-19 and healthy (as might be expected), while the pneumonia class presents similar characteristics to the other two classes. Depending on which characteristics are taken into account by the trained model, it will resemble one or another class.
Summarizing and generalizing the observed characteristics, we can distinguish:
- Characteristic 1 (Ch1): Blacks’ peak.
- Characteristic 2 (Ch2): Whites’ peak.
- Characteristic 3 (Ch3): Black values’ concentration.
- Characteristic 4 (Ch4): White values’ concentration.
- Characteristic 5 (Ch5): Maximum concentration range.
Thus, it would be interesting to study the consequences of these characteristics in the previously described models. Initially, a qualitative study is carried out on the possible characteristics used for each model, and based on these, we justify the results obtained in the various trained systems. According to the results shown in Table 5, where the class not included in the training was used as a test set, we can make the following observations:
- H-P model: The characteristics that easily distinguish these classes are Ch1, Ch2, Ch3, and Ch4. We can theorize that these characteristics rule the classification result.Therefore, introducing the COVID-19 class as a test, we can observe that it matches the characteristics Ch1 and Ch3 with the pneumonia class and characteristics Ch2 and Ch4 with the healthy class. Even so, as the mean Ch1peak is much higher than the mean Ch2 peak, it is reasonable to think that for this reason, there are a few more samples of this class that are classified as pneumonia than as healthy (almost 72%). Moreover, it is important to note that, as the characteristic that best distinguishes the COVID-19 class from the pneumonia class (Ch5) is not used in the H-P model as it is not relevant (similar values), this is another reason why it is more similar to the pneumonia class.
- H-C model: The characteristics that easily distinguish these classes are Ch1, Ch3, Ch4, and Ch5. We can theorize that these characteristics rule the classification result.Using the Pneumonia class as a test, it has similarities in characteristics Ch1 and Ch3 with the COVID-19 class and has similarities in characteristics Ch4 and Ch5 with the healthy class. Although the peak that can be observed in blacks (Ch1) concentrates a large number of pixels and this more closely resembles the COVID-19 class, the maximum concentration range of values (Ch5) is practically identical to that of the healthy class. Therefore, this may be the reason why the occurrences of this class are divided equally between the other two during the test phase.
- P-C model: The characteristics that easily distinguish these classes are Ch2, Ch4, and Ch5. We can theorize that these characteristics rule the classification result.Including the healthy class as a test, we can observe that it would resemble the COVID-19 class in the Ch2 characteristic, but it would resemble the pneumonia class in the Ch4 and Ch5 characteristics. Due to this, as the characteristics Ch4 and Ch5 have much greater weight than the characteristic Ch2 and, in addition, they concentrate most of the pixels, it is coherent that the results obtained more than 96% of classification as pneumonia.
With the study of the histograms and the characteristics that can be distinguished from them, the results obtained in the first tests of this work (where the third untrained class is used as the test) are coherent, and therefore, it seems that the convolutional DL binary classification systems use the histogram of the image to extract the characteristics.
However, before stating this conclusion more strongly, we will carry out a more in-depth study applying these same characteristics to the different systems trained in the second part of the Results Section, where the third class is included as part of one of the two initial ones in each model. In this way, we obtain six systems for which we carry out a detailed analysis like the previous one.
- H-P model—Case 1: Almost all the characteristics that easily distinguish the pneumonia class have opposite values in the other two that compose the mixed class (COVID-19 and healthy). The only characteristic that differentiates both from pneumonia is Ch2 (white’s peak); however, in the whites’ concentration (Ch4), there are also significant differences between the images of COVID-19 and those of healthy patients. Due to these large differences between the two sets that compose the mixed class, the classification results are very low (reaching over 50% for the combined class detection).
- H-P model—Case 2: For this case, there is a clearly remarkable characteristic of the healthy class with respect to the mixed class (COVID-19 and pneumonia), which is Ch1 (blacks’ peak). Thanks to this, the results obtained improve significantly, although there is a worrying percentage of samples that are erroneously classified as belonging to the mixed class, presumably due to the range of the higher concentration of values (Ch5) that coincides between the healthy class and the pneumonia images.
- H-C model—Case 1: Mixing the images of pneumonia with those of healthy patients causes the COVID-19 class to be classified quite acceptably (around 92%), presumably due to the range of the maximum concentration of values (Ch5). However, for the mixed class, the results are very bad since several important characteristics have very different values between the images of pneumonia and those of healthy patients, such as Ch1 (which is similar between pneumonia and COVID-19) and Ch2 (which is similar between healthy and COVID-19).
- H-C model—Case 2: If we mix the pneumonia images with those of COVID-19, the classification of healthy patients reaches 100% due to the concentration of whites (Ch4) and the absence of the peak of blacks (Ch1), which clearly distinguishes the histograms. However, regarding the precision when classifying the mixed class, the percentage is significantly reduced due to the differences between the images with COVID-19 and pneumonia, presumably produced by the maximum concentration range of values (Ch5).
- P-C model—Case 1: If the images of healthy patients are mixed with those of COVID-19, we obtain a high percentage of classification for patients without pneumonia. In this case, the only characteristic that could justify these results is Ch2, although for Ch1, the black peak is much more significant than that which can be observed for the COVID-19 class. On the other hand, the pneumonia classification obtained very bad results (less than 42%) because, as has been verified, the pneumonia class shares many values of the characteristics extracted with the other classes.
- P-C model—Case 2: Finally, combining the images of healthy patients with those of pneumonia, a high classification result can be observed for the mixed class since the pneumonia images share the Ch4 and Ch5 characteristics with the images of healthy patients, with the Ch5 characteristics being the most relevant due to the values’ concentration. On the other hand, the results for the classification of the COVID-19 class are acceptable (but not excellent), with more than 15% failures due to the similarities in the Ch1 and Ch3 characteristics with the pneumonia images.
After this qualitative analysis, we can affirm that the theory initially indicated about the use of the gray level concentration values to extract characteristics is feasible. Although we cannot certify with total certainty that the characteristics indicated are all used and that the explanations provided are complete, the intention of this study was not to make a classification based on a decision tree, but to make the reader doubt about the correct feature extraction performed by convolutional DL binary image classification systems.
Due to all the presented results and the previous explanations, we can certify that the feature extraction carried out by a binary DL convolutional system is not related to the characteristics that are usually identified by the medical specialist, but rather has its origin in the numerical characteristics of the images.
Although there are cases in which the classification of a disease is a binary task (for example, whether or not the patient has cancer), there are other cases (such as the one we present in this work) where the possible outcomes are not binary. Especially when looking at disease symptoms (such as damage to lungs), it is important to understand that there are multiple diseases that can cause them, and therefore, working with a binary classification system may not be realistic or correct. For the results to be useful for specialists, the trained systems have to be as close as possible to reality, distinguishing between all the possible classes that the classification problem may have. This would be the only way to make sure that the trained system is useful.
5. Conclusions
In this work, the quality of the convolutional DL binary image classification systems is tested. For this purpose, this study is focused on the application of the detection of COVID-19 based on lung X-ray images.
After an exhaustive analysis of the currently available datasets and works carried out on this topic, the training and testing of various DL binary systems based on the COVID-19, pneumonia, and healthy classes was performed. The third class was used as a testing set in order to study the response of the different models and understand if the characteristics extracted by these systems are relevant.
Next, the third class was integrated into one of the two used to train each model, obtaining six different cases that were independently and thoroughly analyzed.
The results show that convolutional DL binary systems do not correctly extract the characteristics of the classes involved, but only use those aspects that differentiate one class from the other. Extending these conclusions and in order to deeply test this theory, a study was performed that includes the histograms of the three studied classes and a manual extraction of characteristics, in order to be able to elaborate a system capable of distinguishing manually between the classes involved like a decision tree does. The extracted characteristics were tested with the results obtained previously being able, in most cases, to justify clearly all the values obtained. In this way, this work is able to raise doubts about the correct extraction of characteristics performed by a convolutional DL binary image classification system.
Therefore, according to those final tests, it can be stated that a binary system probably extracts characteristics from the grayscale values of the images, not the characteristics that a medical specialist would take into account in order to differentiate those classes.
Generalizing those results and focusing our attention on the implications of this work: in the cases when the disease classification is not a binary task (for example, the patient has or does not have cancer), the trained systems based on detecting disease symptoms (like the one studied in this work) must include all the possible classes that the classification problem may have; that is, all possible diseases that cause similar symptoms should be included. Only if all the possible classes involved in a classification system are taken into account, we can conclude that the system resembles reality, and therefore, it is a valid tool for use by medical specialists.
It is important to note that the lung images used in the detailed works (and in this work as well) are combined from different datasets; so, as a future work, we need to study if using images collected by different instruments intervenes in the classification results.
Author Contributions
Conceptualization: L.M.-S.; methodology: M.D.-M. and A.C.; software: L.M.-S., F.L.-P. and J.C.-M.; validation: M.D.-M. and A.C.; formal analysis: M.D.-M. and A.C.; investigation: L.M.-S., F.L.-P., J.C.-M., M.D.-M. and A.C.; writing: L.M.-S., F.L.-P., J.C.-M., M.D.-M. and A.C.; supervision: M.D.-M. and A.C. All authors read and agreed to the published version of the manuscript.
Funding
This research was partially funded by the FEDER research project MSF-PHIA (US-1263715) from Junta de Andalucía; and by the Telefónica Chair “Intelligence in Network” from Universidad de Sevilla.
Institutional Review Board Statement
Not applicable.
Informed Consent Statement
Not applicable.
Acknowledgments
We want to thank the FEDER project MSF-PHIA and the Telefonica Chair “Intelligence in Network” for the funding, but also the Research Group “TEP-108: Robotics and Computer Technology” from Universidad de Sevilla (Spain) for the using its resources.
Conflicts of Interest
The authors declare no conflict of interest.
Abbreviations
The following abbreviations are used in this manuscript:
| SARS-CoV | Severe Acute Respiratory Syndrome Coronavirus |
| COVID-19 | Coronavirus Disease 2019 |
| RT-PCR | Reverse Transcription Polymerase Chain Reaction |
| CAD | Computer-Aided Diagnosis |
| BAL | Bronchoalveolar Lavage |
| MR | Magnetic Resonance |
| CT | Computerized Tomography |
| CXR | Chest X-ray |
| VGG16 | Visual Geometry Group 16 |
| DL | Deep Learning |
| DTL | Deep Transfer Learning |
| ROC | Receiver Operating Characteristic |
| AUC | Area Under Curve |
References
- Civit-Masot, J.; Luna-Perejon, F.; Vicente-Diaz, S.; Corral, J.M.R.; Civit, A. TPU Cloud-Based Generalized U-Net for Eye Fundus Image Segmentation. IEEE Access 2019, 7, 142379–142387. [Google Scholar] [CrossRef]
- Luna-Perejón, F.; Domínguez-Morales, M.J.; Civit-Balcells, A. Wearable fall detector using recurrent neural networks. Sensors 2019, 19, 4885. [Google Scholar] [CrossRef]
- Wang, Q.; Michau, G.; Fink, O. Missing-class-robust domain adaptation by unilateral alignment. IEEE Trans. Ind. Electron. 2020, 68, 663–671. [Google Scholar] [CrossRef]
- Zhao, D.; Yao, F.; Wang, L.; Zheng, L.; Gao, Y.; Ye, J.; Guo, F.; Zhao, H.; Gao, R. A comparative study on the clinical features of COVID-19 pneumonia to other pneumonias. Clin. Infect. Dis. 2020, 71, 756–761. [Google Scholar] [CrossRef]
- Lenga, M.; Schulz, H.; Saalbach, A. Continual learning for domain adaptation in chest x-ray classification. arXiv 2020, arXiv:2001.05922. [Google Scholar]
- Minaee, S.; Kafieh, R.; Sonka, M.; Yazdani, S.; Soufi, G.J. Deep-covid: Predicting COVID-19 from chest X-ray images using deep transfer learning. arXiv 2020, arXiv:2004.09363. [Google Scholar] [CrossRef]
- Yoo, S.H.; Geng, H.; Chiu, T.L.; Yu, S.K.; Cho, D.C.; Heo, J.; Choi, M.S.; Choi, I.H.; Cung Van, C.; Nhung, N.V.; et al. Deep learning-based decision-tree classifier for COVID-19 diagnosis from chest X-ray imaging. Front. Med. 2020, 7, 427. [Google Scholar] [CrossRef]
- Wang, L.; Lin, Z.Q.; Wong, A. COVID-Net: A tailored deep convolutional neural network design for detection of COVID-19 cases from chest X-ray images. Sci. Rep. 2020, 10, 19549. [Google Scholar] [CrossRef]
- Civit-Masot, J.; Luna-Perejón, F.; Domínguez Morales, M.; Civit, A. Deep learning system for COVID-19 diagnosis aid using X-ray pulmonary images. Appl. Sci. 2020, 10, 4640. [Google Scholar] [CrossRef]
- Jain, G.; Mittal, D.; Thakur, D.; Mittal, M.K. A deep learning approach to detect Covid-19 coronavirus with X-Ray images. Biocybern. Biomed. Eng. 2020, 40, 1391–1405. [Google Scholar] [CrossRef] [PubMed]
- Cohen, J.P.; Morrison, P.; Dao, L. COVID-19 image data collection. arXiv 2020, arXiv:2003.11597. [Google Scholar]
- Cohen, J.P.; Morrison, P.; Dao, L.; Roth, K.; Duong, T.Q.; Ghassemi, M. COVID-19 Image Data Collection: Prospective Predictions Are the Future. arXiv 2020, arXiv:2006.11988. [Google Scholar]
- de la Iglesia Vayá, M.; Saborit, J.M.; Montell, J.A.; Pertusa, A.; Bustos, A.; Cazorla, M.; Galant, J.; Barber, X.; Orozco-Beltrán, D.; García-García, F.; et al. BIMCV COVID-19+: A large annotated dataset of RX and CT images from COVID-19 patients. arXiv 2020, arXiv:2006.01174. [Google Scholar]
- Gunraj, H.; Wang, L.; Wong, A. COVIDNet-CT: A Tailored Deep Convolutional Neural Network Design for Detection of COVID-19 Cases from Chest CT Images. Front. Med. 2020. [Google Scholar] [CrossRef] [PubMed]
- Zhao, J.; Zhang, Y.; He, X.; Xie, P. COVID-CT-Dataset: A CT scan dataset about COVID-19. arXiv 2020, arXiv:2003.13865. [Google Scholar]
- Wu, Y.H.; Gao, S.H.; Mei, J.; Xu, J.; Fan, D.P.; Zhao, C.W.; Cheng, M.M. JCS: An explainable COVID-19 diagnosis system by joint classification and segmentation. arXiv 2020, arXiv:2004.07054. [Google Scholar]
- Khalifa, N.E.M.; Taha, M.H.N.; Hassanien, A.E.; Taha, S.H.N. The Detection of COVID-19 in CT Medical Images: A Deep Learning Approach. In Big Data Analytics and Artificial Intelligence against COVID-19: Innovation Vision and Approach; Springer: Berlin/Heidelberg, Germany, 2020; pp. 73–90. [Google Scholar]
- Singh, D.; Kumar, V.; Kaur, M. Classification of COVID-19 patients from chest CT images using multi-objective differential evolution–based convolutional neural networks. Eur. J. Clin. Microbiol. Infect. Dis. 2020, 39, 1379–1389. [Google Scholar] [CrossRef]
- Ahuja, S.; Panigrahi, B.K.; Dey, N.; Rajinikanth, V.; Gandhi, T.K. Deep transfer learning-based automated detection of COVID-19 from lung CT scan slices. Appl. Intell. 2021, 51, 571–585. [Google Scholar] [CrossRef]
- Albahli, S. A Deep Neural Network to Distinguish COVID-19 from other Chest Diseases using X-ray Images. Curr. Med. Imaging 2020. [Google Scholar] [CrossRef]
- Panwar, H.; Gupta, P.; Siddiqui, M.K.; Morales-Menendez, R.; Bhardwaj, P.; Singh, V. A deep learning and grad-CAM based color visualization approach for fast detection of COVID-19 cases using chest X-ray and CT-Scan images. Chaos Solitons Fractals 2020, 140, 110190. [Google Scholar] [CrossRef]
- Duran-Lopez, L.; Dominguez-Morales, J.P.; Corral-Jaime, J.; Vicente-Diaz, S.; Linares-Barranco, A. COVID-XNet: A custom deep learning system to diagnose and locate COVID-19 in chest X-ray images. Appl. Sci. 2020, 10, 5683. [Google Scholar] [CrossRef]
- Bahel, V.; Pillai, S. Detection of COVID-19 Using Chest Radiographs with Intelligent Deployment Architecture. In Big Data Analytics and Artificial Intelligence against COVID-19: Innovation Vision and Approach; Springer: Berlin/Heidelberg, Germany, 2020; pp. 117–130. [Google Scholar]
- Sethy, P.K.; Behera, S.K. Detection of coronavirus disease (COVID-19) based on deep features. Preprints 2020, 121, 103792. [Google Scholar]
- Ozturk, T.; Talo, M.; Yildirim, E.A.; Baloglu, U.B.; Yildirim, O.; Acharya, U.R. Automated detection of COVID-19 cases using deep neural networks with X-ray images. Comput. Biol. Med. 2020, 121, 103792. [Google Scholar] [CrossRef] [PubMed]
- Apostolopoulos, I.D.; Mpesiana, T.A. Covid-19: Automatic detection from x-ray images utilizing transfer learning with convolutional neural networks. Phys. Eng. Sci. Med. 2020, 43, 635–640. [Google Scholar] [CrossRef]
- Hira, S.; Bai, A.; Hira, S. An automatic approach based on CNN architecture to detect Covid-19 disease from chest X-ray images. Appl. Intell. 2020, 1–26. [Google Scholar] [CrossRef]
- Simonyan, K.; Zisserman, A. Very deep convolutional networks for large-scale image recognition. arXiv 2014, arXiv:1409.1556. [Google Scholar]
- Russakovsky, O.; Deng, J.; Su, H.; Krause, J.; Satheesh, S.; Ma, S.; Huang, Z.; Karpathy, A.; Khosla, A.; Bernstein, M.; et al. ImageNet Large Scale Visual Recognition Challenge. Int. J. Comput. Vis. (IJCV) 2015, 115, 211–252. [Google Scholar] [CrossRef]
- Das, M.; Farmer, J.; Gallagher, A.; Loui, A. Event-based location matching for consumer image collections. In Proceedings of the 2008 International Conference on Content-Based Image and Video Retrieval, Niagara Falls, ON, Canada, 7–9 July 2008; pp. 339–348. [Google Scholar]
- Loui, A.C.; Das, M. Matching of Complex Scenes Based on Constrained Clustering. In Proceedings of the AAAI Fall Symposium: Multimedia Information Extraction, Arlington, TX, USA, 7–9 November 2008; Volume 8, p. 5. [Google Scholar]
- Oses, N.; Legarretaetxebarria, A.; Quartulli, M.; García, I.; Serrano, M. Determining input variable ranges in Industry 4.0: A heuristic for estimating the domain of a real-valued function or trained regression model given an output range. arXiv 2019, arXiv:1904.02655. [Google Scholar]
Publisher’s Note: MDPI stays neutral with regard to jurisdictional claims in published maps and institutional affiliations. |
© 2021 by the authors. Licensee MDPI, Basel, Switzerland. This article is an open access article distributed under the terms and conditions of the Creative Commons Attribution (CC BY) license (http://creativecommons.org/licenses/by/4.0/).