Article

Optimal Renovation Strategies through Life-Cycle Analysis in a Pilot Building Located in a Mild Mediterranean Climate

by
José Manuel Salmerón Lissen
1,*,
Cristina Isabel Jareño Escudero
2,
Francisco José Sánchez de la Flor
3,
Miriam Navarro Escudero
2,
Theoni Karlessi
4 and
Margarita-Niki Assimakopoulos
4
1
Escuela Superior de Ingenieros, Camino de los Descubrimientos s/n, Departamento de Ingeniería Energética, Grupo de Termotecnia, Universidad de Sevilla, 41092 Sevilla, Spain
2
Instituto Valenciano de la Edificación, Tres Forques, 98, 46018 Valencia, Spain
3
Escuela Superior de Ingeniería, Departamento de Máquinas y Motores Térmicos, Universidad de Cádiz, C/Chile 1, 11002 Cádiz, Spain
4
Department of Physics, National and Kapodistrian University of Athens, GR-157 84 Zografou, Athens, Greece
*
Author to whom correspondence should be addressed.
Appl. Sci. 2021, 11(4), 1423; https://doi.org/10.3390/app11041423
Submission received: 30 December 2020 / Revised: 28 January 2021 / Accepted: 1 February 2021 / Published: 4 February 2021
(This article belongs to the Special Issue Energy Storage in Buildings and Building Facilities)

Abstract

:
The 2030 climate and energy framework includes EU-wide targets and policy objectives for the period 2021–2030 of (1) at least 55% cuts in greenhouse gas emissions (from 1990 levels); (2) at least 32% share for renewable energy; and (3) at least 32.5% improvement in energy efficiency. In this context, the methodology of the cost-optimal level from the life-cycle cost approach has been applied to calculate the cost of renovating the existing building stock in Europe. The aim of this research is to analyze a pilot building using the cost-optimal methodology to determine the renovation measures that lead to the lowest life-cycle cost during the estimated economic life of the building. The case under study is an apartment building located in a mild Mediterranean climate (Castellon, SP). A package of 12 optimal solutions has been obtained to show the importance of the choice of the elements and systems for renovating building envelopes and how energy and economic aspects influence this choice. Simulations have shown that these packages of optimal solutions (different configurations for the building envelope, thermal bridges, airtightness and ventilation, and domestic hot water production systems) can provide savings in the primary energy consumption of up to 60%.

1. Introduction

The proportion of the global energy consumed by the existing building stock has risen from 20% to 40% since 2008 [1], partially influenced by global climate change [2]. For this reason, institutions such as The International Energy Agency have highlighted the need for significant increases in the number of existing buildings being renovated [3,4].
In this context, some studies already state that “the highest potential for energy reduction through building renovation lies in specific residential typologies, apartment buildings and single-family homes” [5], while others show that it is possible to reduce greenhouse gas emissions by approximate 40% by deploying the technology already available in the market [6]. Therefore, buildings are considered one of the strategic sectors for reducing greenhouse gas emission to the 2030 target of values 55% below those in 1990, for improving energy efficiency to 32.5% and reaching the 32% share of renewable energy as a part of the European Green Deal [7].
In projects involving the in-depth renovation of buildings, especially those aiming to meet nearly zero energy (nZEBs) requirements, cost–benefit analysis should be accurately developed [8]. These analysis methods include the net present value (NPV), investment cost (IC), payback (PB) or life cycle cost (LCC) as key indexes. However, most of the stakeholders involved in building renovation projects do not have the skills or qualifications to do so correctly [9]. To this end, the HAPPEN project has developed a specific Mediterranean zero energy buildings (MediZEBs) approach [10], aimed at fostering the renovation of existing residential buildings. This holistic approach is based on the following project pillars:
  • Engagement and training: targets final users (owners and inhabitants) through knowledge transfer and behavioural upgrades, as well as building professionals, entrepreneurs, workers, and policy makers.
  • Optimal solutions: an extensive optimization project based on LCC analysis of the renovated buildings has been performed to compose cost-optimal packages of solutions (POSs) to be applied to different residential typologies according to a one-stop-shop and a step-by-step intervention logic.
  • Finance and Regulations: regards the testing of available innovative financial solutions (e.g., guarantee and solidarity funds, credit transfer mechanisms, etc.) and the development of the HAPPEN financial solution, fully integrated with the POS.
The study presented in this paper is based on the requirements already stated in the EPBD [11] from the EU where, applying cost optimality and LCC of the most optimized energy renovation measures becomes mandatory (articles 5, 7, 9). Moreover, in annex III of said directive, the methodology framework to identify the cost optimal level of energy performance is explained. The instructions described there are illustrated through the case of a pilot building located in Castellon de la Plana (Spain), the main results and conclusions of which are presented below.

State of the Art

Corrado and Ballarini [12] illustrate the Italian pilot action in the IEE-EPISCOPE project [13], focusing on the analysis of energy refurbishment trends of the Piedmont region residential building stock. Three realistic scenarios are investigated by the authors. The first one considers the annual current refurbishment trend and the most common energy efficiency renovation measures. The second scenario applies the measures resulting from a cost-optimal analysis. The third scenario considers the mean annual refurbished floor area necessary to meet the climate protection targets. The main conclusion reached is the need to perform major refurbishments, rather than tighten the requirements.
The main differences with the methodology proposed in this paper are:
  • It was performed for one region, studying the most typical kind of building.
  • The type of refurbishment measures and thermal performance parameters of the elements of the envelope and systems are always an input for the model and as a consequence they are not calculated following a cost-optimal methodology, although one scenario is called “cost-optimal analysis”.
In this paper we will analyze the renovation measures of a pilot building under the scope of a cost-optimal methodology in order to determine the best energy-saving solutions following the recommendations of the Directive 2010/31/EC [11] and the amending EPBD 2018/844/EU [14].
In this sense, the present study is similar to that of other authors who have focused their research on pilot buildings studies, which will be analysed below, highlighting the updates of the present paper.
Wralsen et al. [15] performed an LCC analysis to determine the optimal renovation of a pilot apartment building in Norway. The authors performed an inventory analysis in a similar way to this study, although they do not show the renovation alternatives. As an innovation, the present paper presents the different renovation measures that were considered for the sake of clarity and comprehensibility.
Guardigli et al. [16] show a cost-optimal analysis following the suggestions by the EPBD recast EU directive. Three pilot apartment buildings in Italy were considered. In the LCC methodology assessed by the authors, the alternatives and the optimal renovation measures selected were not explicitly shown in terms of their thermal parameters (U-values of envelope elements) and thermal systems or equipment were not considered. Global alternatives to interventions and results in terms of payback period, net present value and global cost are shown in a very similar way to the Packages of Optimal Solutions in the present study.
Brambilla et al. [17] analysed the renovation of a pilot office building in a warm climate following an LCA methodology. The main difference with the present study is that the building was for office use rather than residential. Nevertheless, the methodology and the main points of interest for the renovation are the same. In this sense, Brambilla et al. considered 10 different measures for the renovation of the external walls and the effect of thermal bridges in the roof and window joints. The present paper differentiates because it also presents the alternatives considered for roofs, floors, windows, ventilation system and other thermal bridges.
Fotopoulou et al. [18] showed how the renovation of an existing apartment building in Bologna (Italy) affected its energy performance and indoor temperatures. The study focused mainly on improvements to the façade, which comprised adding insulation and other features (winter gardens, sunspaces, and buffer zones). Ventilation, infiltration and the different U-values of glazing units are considered. The renovation of thermal bridges, roofs, slabs/floor, or active air conditioning systems were out of the scope of the study. This, together with the absence of a LCC calculation, an economic approach and the fact that only one apartment was simulated constitute the main differences with the present work.
Salvalai et al. [19] illustrated the Italian pilot action of the Envelope Approach to improve Sustainability and Energy Efficiency in existing multi-storey multi owner residential buildings (EASEE) project, focusing on the analysis of energy refurbishment trends of the Lombardy region residential building stock. The paper focuses on precast multilayer panel outer solutions that basically add insulation to the outdoor façades without decreasing the useful surface of the building. On the contrary that in the present paper, the authors did not consider the renovation of other elements of the envelope; thus, the main difference with this article is that the renovation solutions were not selected following a cost–benefit analysis. Finally, the renovation solution was installed in a pilot apartment building in Milan, thereby assessing its effects on energy saving.
After analyzing the current state of the art, we can determine the main novelties proposed in this paper:
-
LCC approach showing the different alternatives for the renovation.
-
Renovation measures comprising of façades, windows, roofs, slabs, ventilation system, infiltration improvement, thermal bridges, and domestic hot water production.
-
The price of the renovation measures was taken from a national official database of construction which includes the installation costs.
-
Identification of the cost optimal combination of measures that minimize the LCC over a 30 year period for a pilot building in a given climate.
-
Definition of a package of optimal solutions that are remarkably close to the optimum set of renovation measures that could be used for similar buildings in the same climate region.

2. Methods

This study focuses on minimizing the LCC of a building by applying a set of renovation measures. Special attention has been paid to the use of LCC because its influence on the life of an asset is widely accepted as a good indicator of the relationship between the environmental quality and investment cost of renovation work.
Thus, the optimization process that has been followed to identify the cost-optimal renovation seeks to improve the environmental quality and reduce the energy consumption of existing buildings. The proposed methodology optimizes the performance of the building’s envelope and its domestic hot water (DHW) and ventilation systems taking into account not only energy savings but also the investment and operating costs. This methodology has been used in studies such as those by the BPIE [20], Brandao et al. [21], Becchio et al. [22], and offers a comprehensive analysis of the environmental impacts, while also providing quantitative results, taking into account the costs of the building over a 30-year period [23]. The necessary calculations are presented in detail in the following sub-sections.
A total of 381,204 possible combinations could be obtained from the interactions between the different improvement measures described for each component of the envelope (nine walls, eight roofs, five slabs, seven windows, seven external doors, three thermal bridges, three airtightness, three ventilation, two night ventilation and two DHW systems). The calculation of each of these cases using the described thermal simulation engine would take 3.8 min in a computer 8 GB RAM and a 2.4 GHz i7 Processor. Therefore, calculating all the combinations would take 24,131.5 h. Since this calculation time was excessive, a method was used based on the Monte Carlo approach for discriminating and progressively obtaining the best solutions. Basically, this method consisted of calculating in each iteration the square root of the total number of cases, in this case 650 simulations. After these calculations were made, the most promising renovation measures were selected and the worst discarded following the methodology described by Sánchez and Salmeron in [24]. In the next iteration, the aleatory combinations of the best measures were calculated. After five iterations, a total of 2441 combinations were calculated, taking a total computation time of 155 h. The results are shown in Section 4.

2.1. LCC Calculation

The LCC was calculated as the sum of the investment costs plus the operating and maintenance costs during a certain period of time, economically updated to the present moment following Equation (2). In the calculations performed for the present paper, the cost of CO2 emissions produced during the years of the building’s operation were neglected because it was not relevant when compared to other terms, and it had no influence on the optimal solution selection process provided that they were null in all the cases taken into consideration. This assumption was made due to the uncertainty associated with discount rates and the price of fuel as follows:
L C C [ ]   =   Investment [ ] + i = 1 30 ( C o n s u m p t i o n Y e a r   i H e a t i n g [ yr ] + C o n s u m p t i o n Y e a r   i C o o l i n g [ yr ] + C o n s u m p t i o n Y e a r   i D H W [ yr ] + M a i n t e n a n c e Y e a r   i [ yr ] ) * A n n u i t y [ y r ]
where,
A n n u i t y [ yr ]   =   1 ( 1 + k 1 / 100 ) 30 k 1 / 100
where k1 is the current interest rate as defined in Section 2.3.2.
Heating, or cooling, energy consumption was calculated as the ratio between the heating, or cooling, energy needs and the respective seasonal coefficient of performance of the default system. These coefficients were obtained from the Spanish technical building code [25] and have been detailed in Table A1.
In this paper the calculation period was fixed to 30 years following the recommendations of the European commission delegated regulation [23].
The yearly maintenance cost of the DHW system has been considered equal to a 2% of its initial investment.

2.2. Energy Consumption Calculation

Simulations were performed by using the mandatory calculation software for the fulfilment of the Spanish Building Regulation and Energy Certification procedure [26]. It complied with the BESTEST of the IEA [27] and calculated the building energy needs dynamically on an hourly basis.
The required information to run the initial energy calculations was gathered through on-site visits and blueprints, defining both geometric and construction parameters as explained in Section 3. The real plan layout has been reported in the model section, and following this layout different thermal zones were created in the pilot building.
The U values of the façade, roof and slabs were calculated considering their thermal conductivity and thickness; the U values for windows and doors were obtained from catalogues; and the values for ventilation and airtightness were calculated or estimated from data of catalogues.

2.2.1. Thermal Zoning

The inside of the building was divided into thermal zones meeting the spatial needs of specific user’s activities. It is important to bear in mind that, the greater the number of thermal zones, the longer the calculation time. Thus, thermal zoning is a compromise between accuracy and time.
By dividing the building into zones, it was possible to associate an activity program to each of them, as well as defining the occupation schedule, the systems and appliances operation and the internal loads, which represented a source of thermal energy and contribute to reducing the heating energy needs. Figure 1 shows the mean values for the internal loads at each hour of the day:
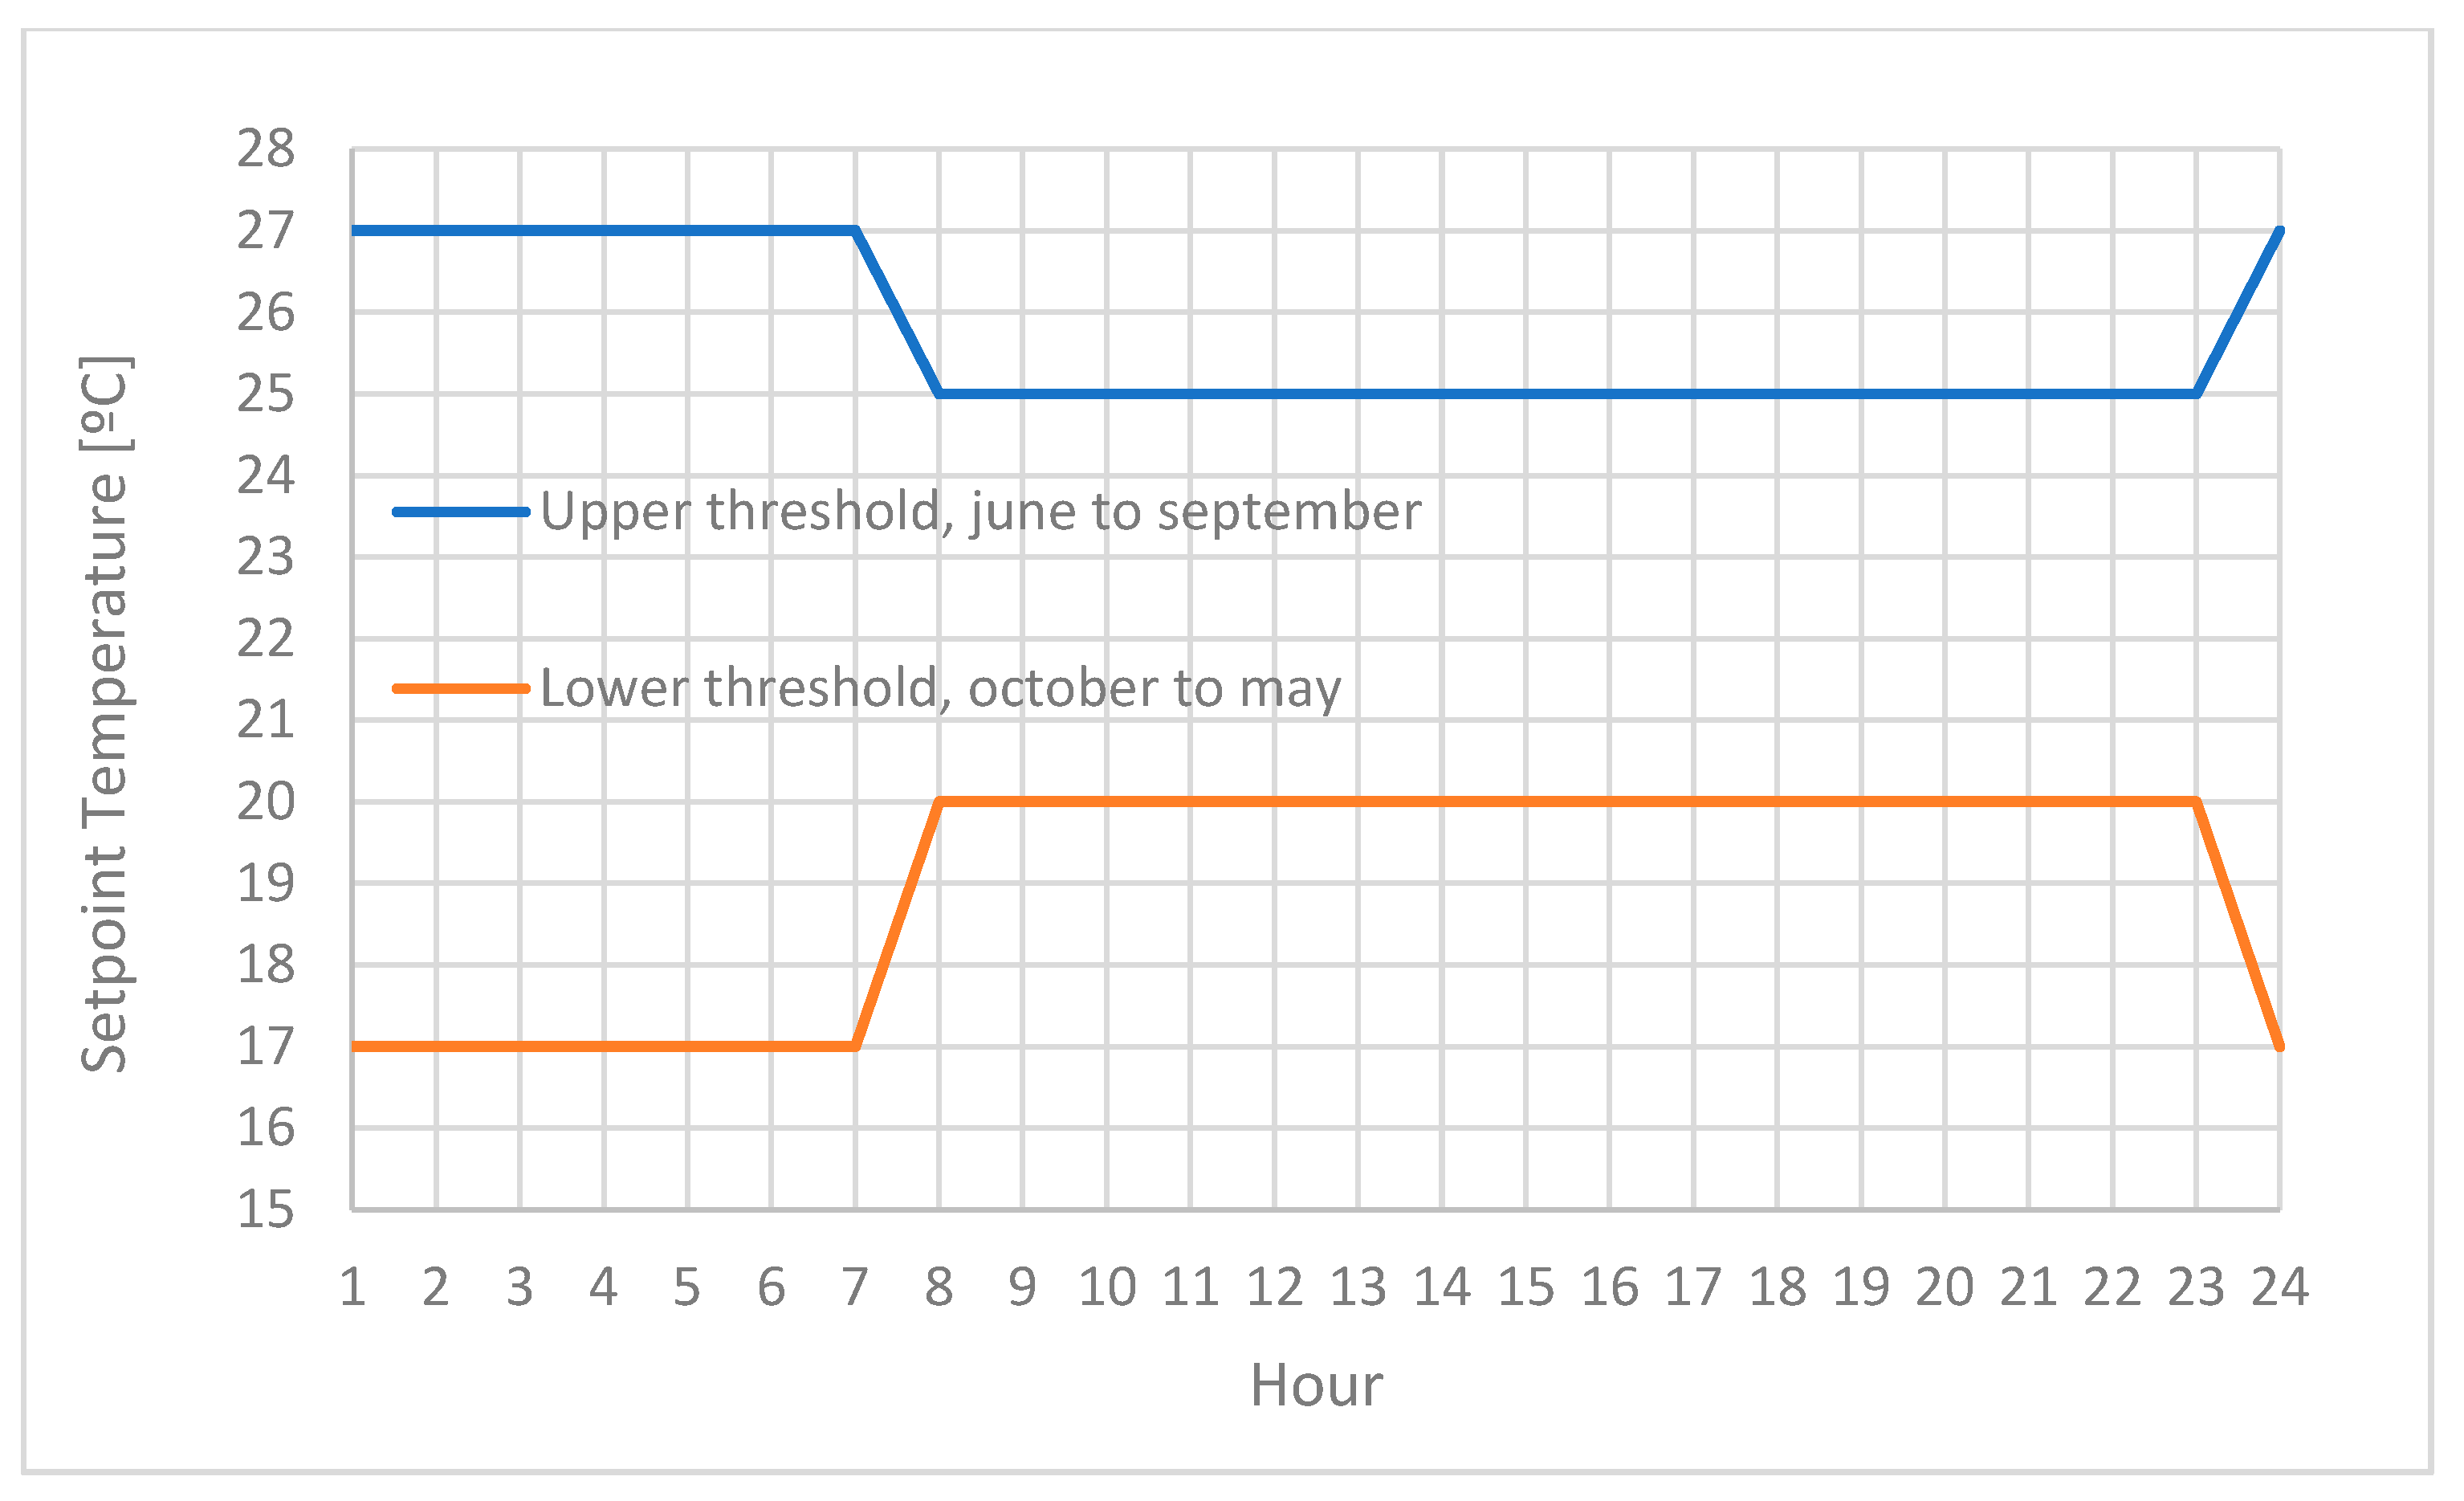
The systems operation and their setpoint temperatures follow the schedule indicated below (Figure 2):
The operation pattern and internal loads were fixed parameters in all the simulations belonging to the same set. In order to analyze a different user’s behaviour two sets of simulations were performed: in the first set previous schedules were used, while in the second one the set point temperatures were fixed at 17 °C in winter and 27 °C in summer for the whole day.
The pilot building was divided into 20 thermal zones, corresponding to four rooms per storey and one room per orientation. This choice allowed us to evaluate the influence of solar radiation, different orientations and temperature gaps between each zone. Envelope walls and internal partitions to neighbouring apartments were considered adiabatic, which is a realistic condition, especially for a case study like this, where neighbouring buildings had similar occupation profiles, systems, and equipment.
The first-floor slab above the retail spaces on the ground floor was considered the bottom limit of the pilot building envelope due to the non-residential activities taking place in the car park and retail areas.

2.2.2. Thermal Bridges

Thermal bridges were considered by the software tool as elements that contributed to thermal heat losses or gains in steady state. Thus, the simulation software added to the hourly heat flux a quasi-steady state value calculated as the product of the linear thermal transmittance of the thermal bridges by their length and by the difference of temperature between indoor and outdoor air.

2.2.3. Ventilation and Infiltration

The air change rate (ACH) in existing buildings is generally given by natural ventilation and infiltration from windows. While international standards generally provide for a minimum ACH value of 0.5 vol/h to ensure adequate indoor air quality in living areas, the Spanish standard for existing buildings defines a calculation method that requires both the ventilation flow rate and the airtightness at 50 Pa (n50). With these two values, the software tool evaluates the air change rate as a function of the wind velocity following the UNE EN 15242:2007 [28]. In Section 3, the ventilation and airtightness values for the building before the intervention, and for the improvement measures to be considered are described in detail.

2.3. Energy Costs/Economic Parameters

2.3.1. Energy Costs

The energy cost for heating was 0.08 €/kWh, obtained for natural gas from [29]. The electricity cost was 0.25 €/kWh, and this was the value used for the cooling energy cost [30] as the cooling system was a heat pump.

2.3.2. Interest Rate, Discount Rate

The interest rate (k) was assumed to be 3.5% and inflation (i) equal to 2% following the suggestions by the delegated regulation [21]. Thus, the current interest rate (k1) was 1.47%, calculated as follows:
k 1   =   k i 1 + i / 100

2.4. Definition of Package of Optimal Solutions

The package of optimal solutions (POS) is defined as the whole set of solutions near to the optimal point with the minimum life cycle cost. To this end, the solutions with a LCC up to 5% higher than the minimum were be determined. Then, the solutions with an increase of 5% of Primary Energy Consumption with regards to the optimal point were determined. Among these solutions, 12 were selected as the representative of the POS. Some studies use different tolerance percentages, but this research determined that selecting 5% of the set of solutions was a wide enough sample, getting 12 sets of solutions that define the POS. In the case of the primary energy consumption, solutions with lower values compared to the optimal were avoided because in that zone the LCC dramatically rose.
In this way, it was possible to define a package of optimal solutions that were around the optimal set and, thus, an equivalent result was obtained without sticking exclusively to a numerical solution. It was possible not to limit the renovation of the building to a unique set of measures, and to increase the flexibility and the degree of decision on behalf of the architect or engineer involved in the process.
This type of packages in the form of tables has already been reported by Guardigli et al. [16] with the main difference that in latter study the different solutions to renovate the buildings have not been detailed and related to the different solutions proposed, but only the results are shown. In this case, it is considered a novel contribution of this article consisting of the complete documentation and description of all combinations of the optimal measures.

3. Case Study: Apartment Building MedZEB Renovation

3.1. Apartment Building

This section presents the current state of an apartment building by describing its structure, envelope and building systems specifications.
The building, which has been studied and simulated in detail, is located in an area of urban expansion in the City of Castellon de la Plana (Spain). This area is characterized by a high-density urbanism dating back to the 1970’s and 1980’s.
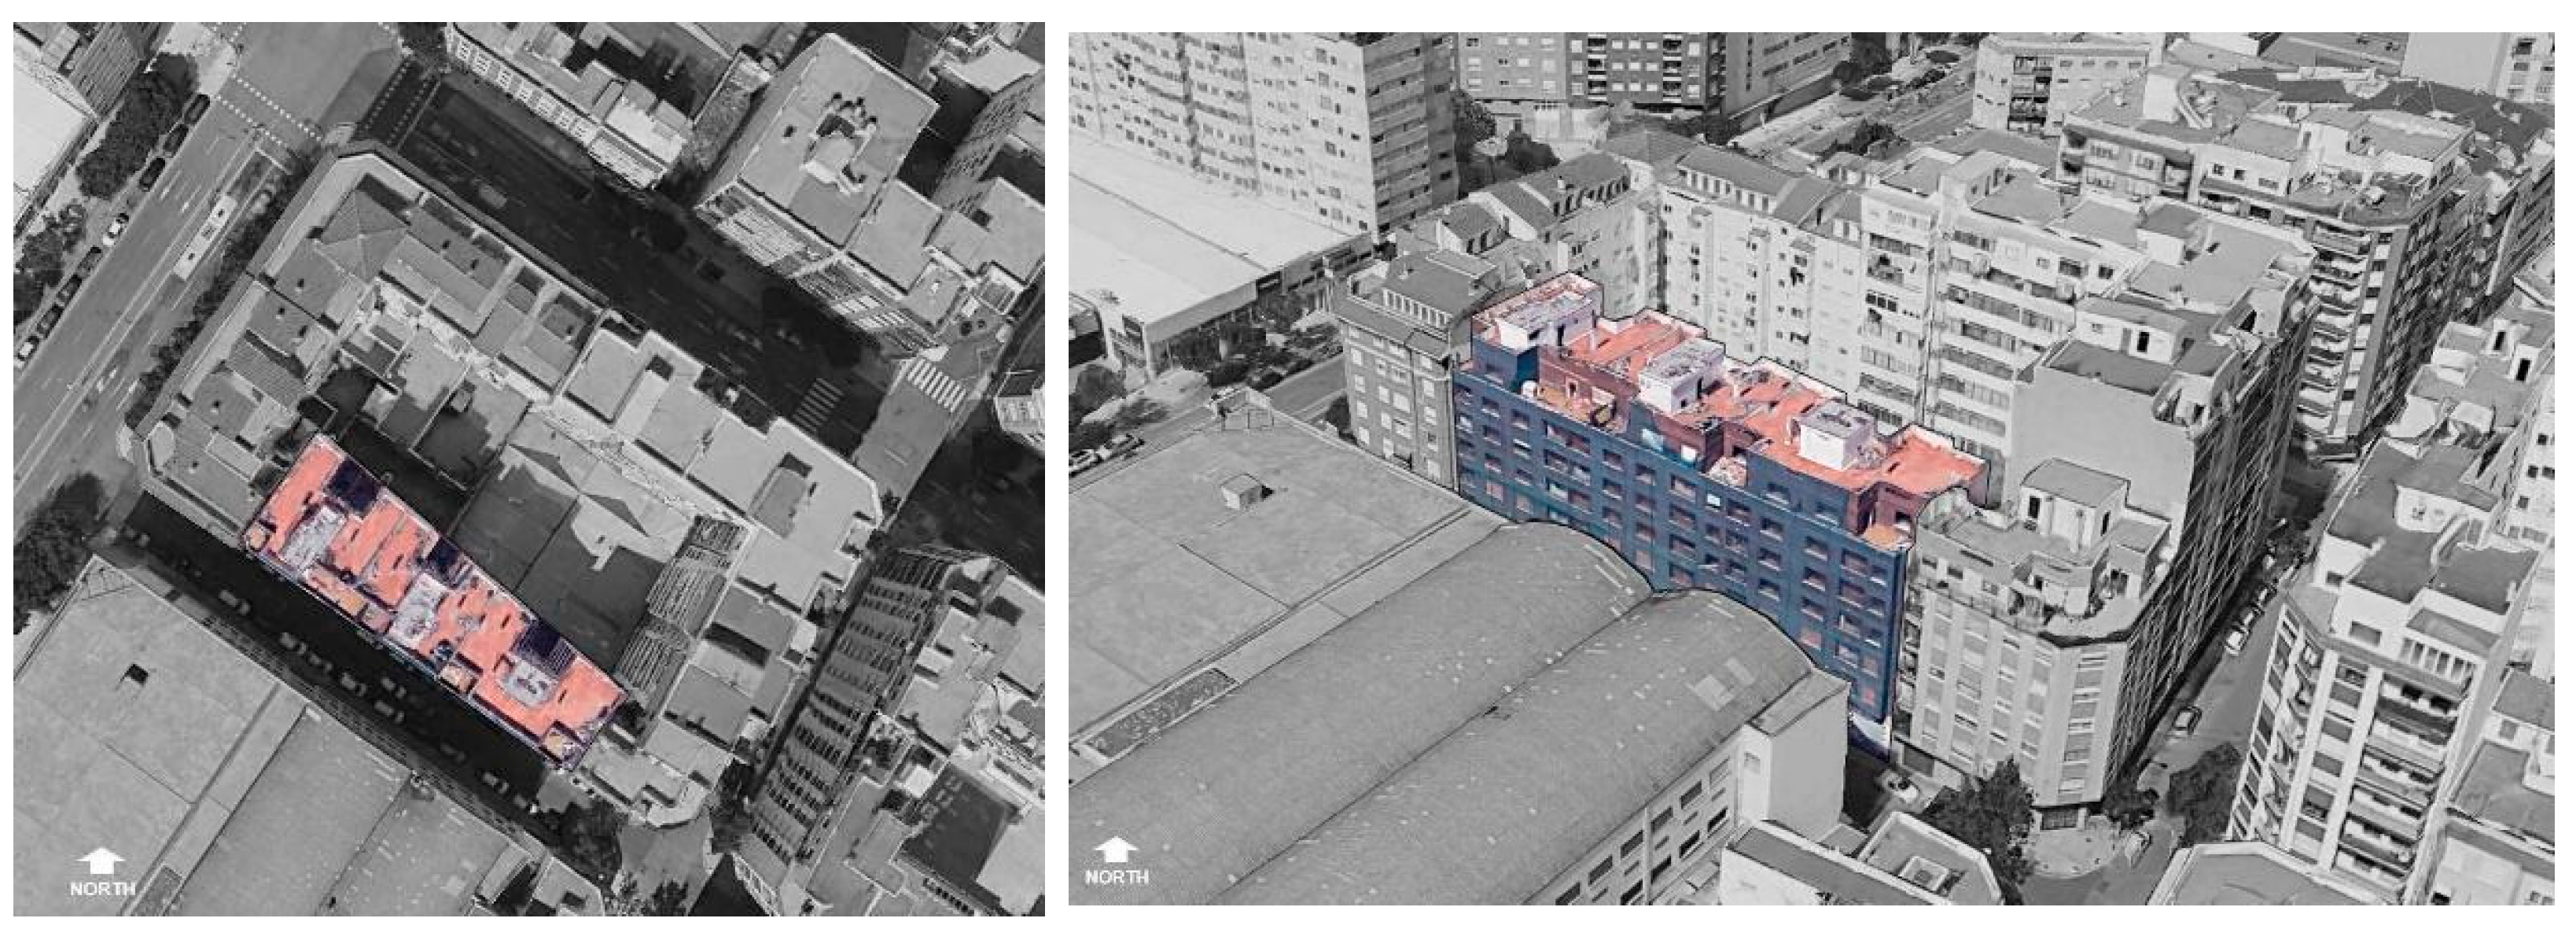
The case study (Figure 3) is an apartment building built in 1979. In its current configuration, the building has seven floors above ground level and a basement, with a total built area of 3698.14 m2. It has a trapezoidal floor plan, covers a total length of 48.2 m in the southwest façade (front elevation), and 48.6 m in the northeast (back elevation), while the envelope wall facing southeast measures 16.7 m and the one facing northwest 12 m (Figure 4).
The envelope for the front and back elevations is a non-insulated exposed-brick system with an air cavity and an internal brick-lined wall rendered with plaster. The internal partitions are made of hollow brick rendered with plaster on both sides. The roofing system is standard for the buildings of this period, namely a non-insulated, non-ventilated roof finished with ceramic tiles and waterproofed with bituminous membranes. The windows and other façade openings have steel or aluminium frames and single glazing with very low levels of airtightness and thermal performance. Therefore, roof and façades have no insulation and, even if thermal bridges represent a high part of the thermal losses, the building envelope itself (including the openings with single glazing) represents an important part of the thermal losses too.
The whole building is supported by a reinforced concrete structure. Internally, its layout is divided into three entrance halls, two of which give access to 12 residential units, and the other one to 11. In the basement there is a shared parking lot connecting the three blocks and the ground floor has space for five retail units. This kind of apartment building has no heating, cooling or mechanical ventilation systems. The domestic hot water is provided by natural gas/butane boilers.
The climate of Castellon could be described by a winter severity climatic index of 1.24, and a summer severity climatic index of 0.62 according to the methodology proposed by Sánchez et al. [32] and Salmeron et al. [33].
The building components considered to estimate the present building’s energy performance are the envelope (facades, roof, ground floor slabs), thermal bridges, airtightness, and ventilation air flow rates, as well as the internal partitions, glazing system, heating, cooling, domestic hot water production and ventilation system. Their main geometrical and thermal properties are gathered in Table A1 in Appendix A. Key issues identified prior to the renovation were significant thermal bridging situations, high heating and cooling demand and a general need for maintenance. These factors opened a window of opportunity for upgrading to a higher quality/performance level instead of renovating to the original situation [34,35]. Indeed, the objective of the HAPPEN project is to trigger energy savings of 60%.
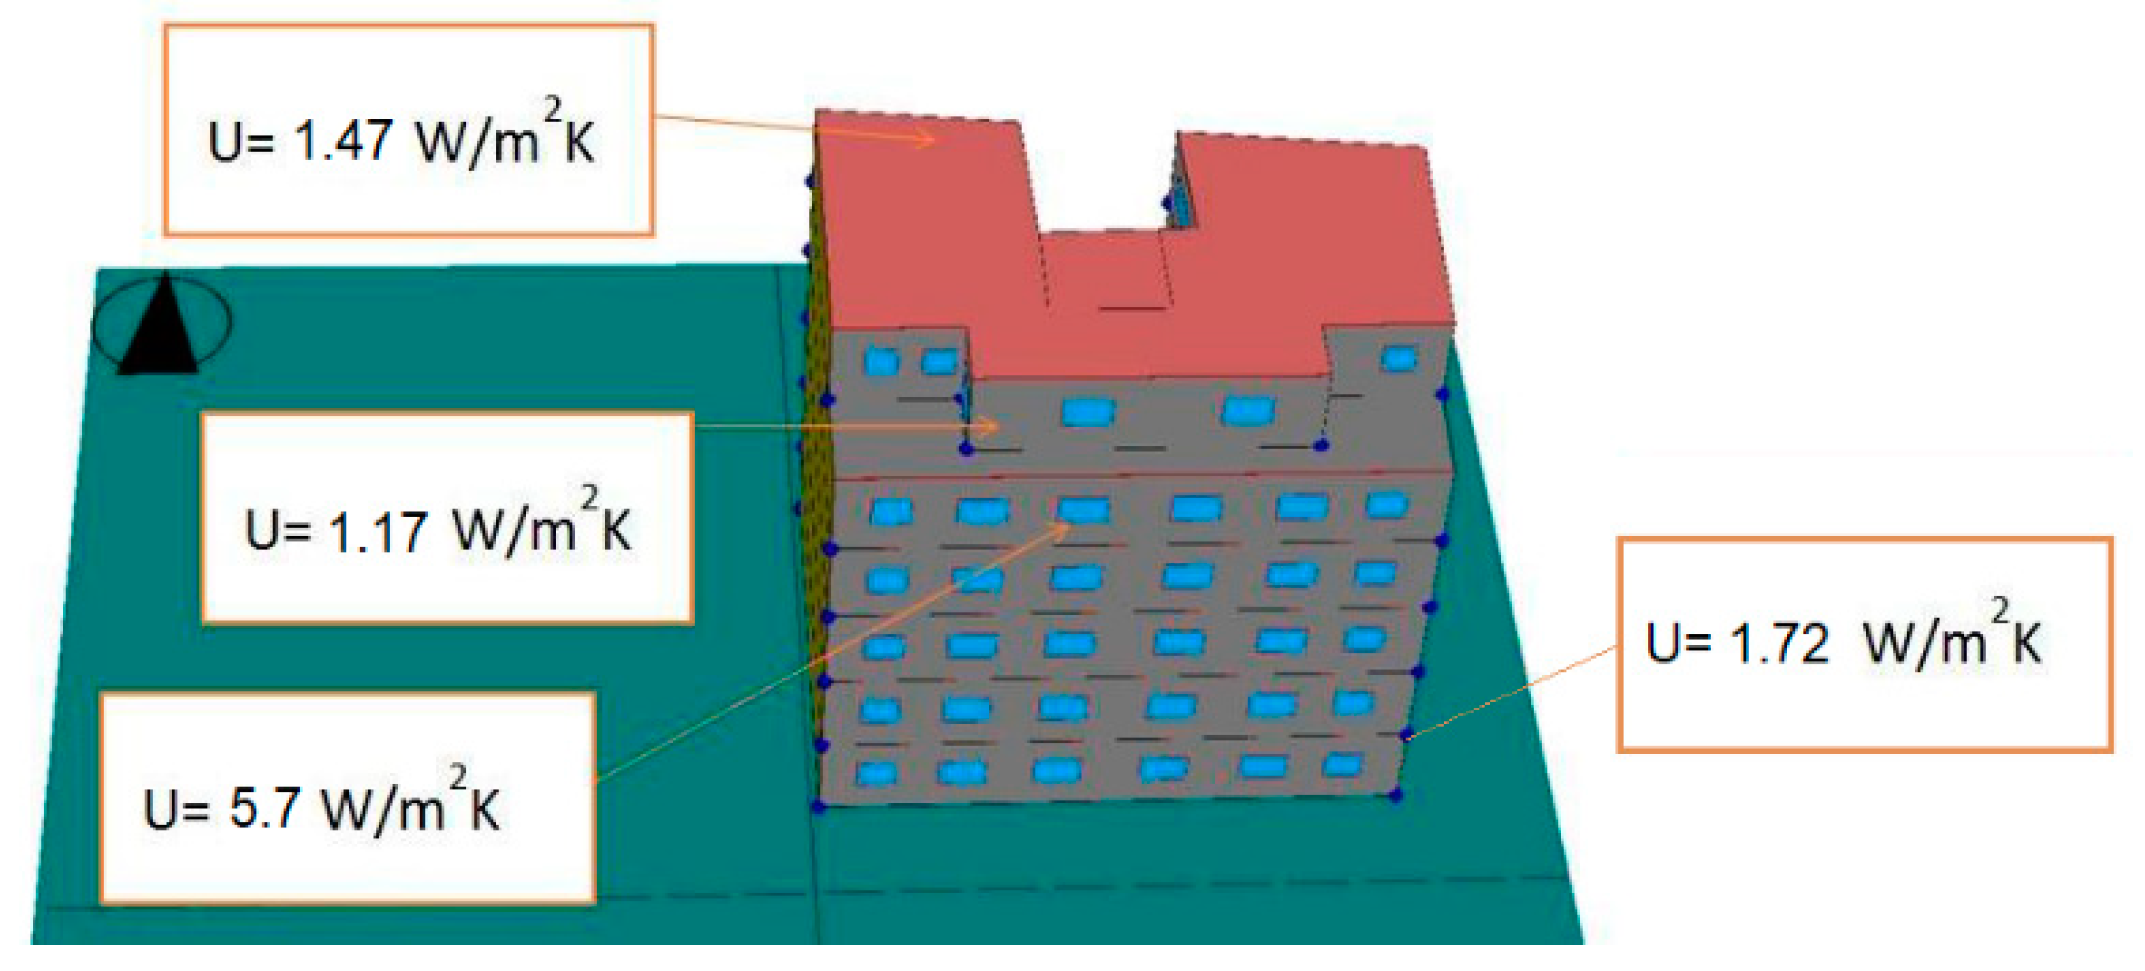
In this case, the building envelope is characterized by (i) one type of opaque exterior walls, referred to as the façade, which also includes its openings; and (ii) two different types of horizontal elements, the external one referred to as the roof, and the one referred to as the slab, which separates the retail units on the ground floor from the apartments on the first floor. Six slabs creating the different levels are added to determine the thermal zones and enclosures in the energy simulation (Figure 5).
The openings have been poorly maintained and are composed of single-glazed units with aluminium frames without a thermal bridge break system or low emissive coatings. A total of 22% of the north façade is glazed and 15.33% of the south.
The retail spaces distributed on the ground floor are not considered in this renovation study as they are not going to be renovated. The owner of the building is different to the owners of the retail spaces, so the slab between the ground floor and the first floor is the one considered for the thermal envelope of the building.
In conclusion, the building was built without considering limits on thermal bridges or their impact on internal comfort or energy efficiency. Once improved, the joints between walls and slabs, the contour of the openings (windows to wall joints), and the joints between walls and roof will reduce the linear thermal transmittance values.
By using a specific energy simulation software that calculated the building energy needs and consumptions dynamically on an hourly basis, the energy use of the building was obtained. Table 1 summarizes the main results. The software tool has been described in detail in Section 2.2 of this paper.

3.2. Renovation Measures

It is quite evident that the combination of all the design alternatives for the renovation of the building is theoretically infinite. However, it is also true that the building components market offers a finite set of renovation alternatives and decision-makers do not tend to stray from commonly-used solutions. Therefore, if the initial data are correctly inserted, identifying a fair number of feasible technical solutions does not take long [16].
Many different renovation measures are considered in this study and are presented in Appendix A, from Table A2, Table A3, Table A4 and Table A5. The building’s renovation project had started to be drafted when the research started. Therefore, it was a great opportunity and the architect who was drafting the project was consulted and, the different set of renovation measures, that were considered, fitted to the market possibilities; the existing building possibilities; the project budget availability; and, the need to get 60% of energy savings.
The main goal is to increase the thermal performance of the envelope by increasing thermal mass, adding insulation layers on the exterior, improving thermal bridges and airtightness, replacing external doors and windows, and installing new DHW production and ventilation systems. To perform the different calculations for evaluating the LCC and energy performance, the existing condition of the envelope, openings and building systems have been considered. Therefore, each section includes the pre-renovation characteristics of the building.
Regarding the technical solutions that shape the different sections, the national cost databases commonly used in Spain have been used [36]. In this database it is possible to establish a specific solution by its specifications [37], relating them to their estimated construction costs. Moreover, each section has a finite number of solutions due to the criteria followed to select them: costs, construction material adaptability, most common skills and qualifications of the contractors in this region, building constraints, and the energy and performance level to be achieved after renovation. Therefore, it is essential to take into account the socio-economic context of each renovation project when choosing the optimal solutions.
In the following sections, renovation solutions for the façade, roof, slabs, openings and systems are described:

3.2.1. Envelope Elements

To improve the thermal performance of the façade, nine types of façade walls were considered, maintaining in the evaluation procedure the existing façade (Table A2). As mentioned above and shown in Table A1 in Appendix A, the current building façade composition consists of an external layer made of exposed thick brick, an air cavity, hollow brick lining and plaster render on the interior face. The construction system does not have thermal insulation, so different solutions involving adding thermal insulation and replacing the internal brick layer by plasterboards or different types of bricks and different types of air chambers were evaluated.
To enhance the thermal performance of the envelope, seven types of window systems and seven external doors were considered (Table A3). They are all aluminium or PVC framed and double or triple-glazed, in addition to having thermal break elements and different levels of low-emissivity coatings and solar control systems. Depending on their location, these could be double folding leaf windows or sliding doors.
A total of eight types of flat roofing solutions for private and common areas were studied (Table A4). The main consideration is that the existing slab has been kept and the upper layers have been replaced to include thermal insulation.
To evaluate the LCC and thermal performance of the internal slabs that separate the ground floor from the first floor and the different storeys, five options were considered (Table A5). As it is part of the building´s envelope, the renovation measure considered is to add thermal insulation to the slab soffit in different ways.

3.2.2. Thermal Bridges

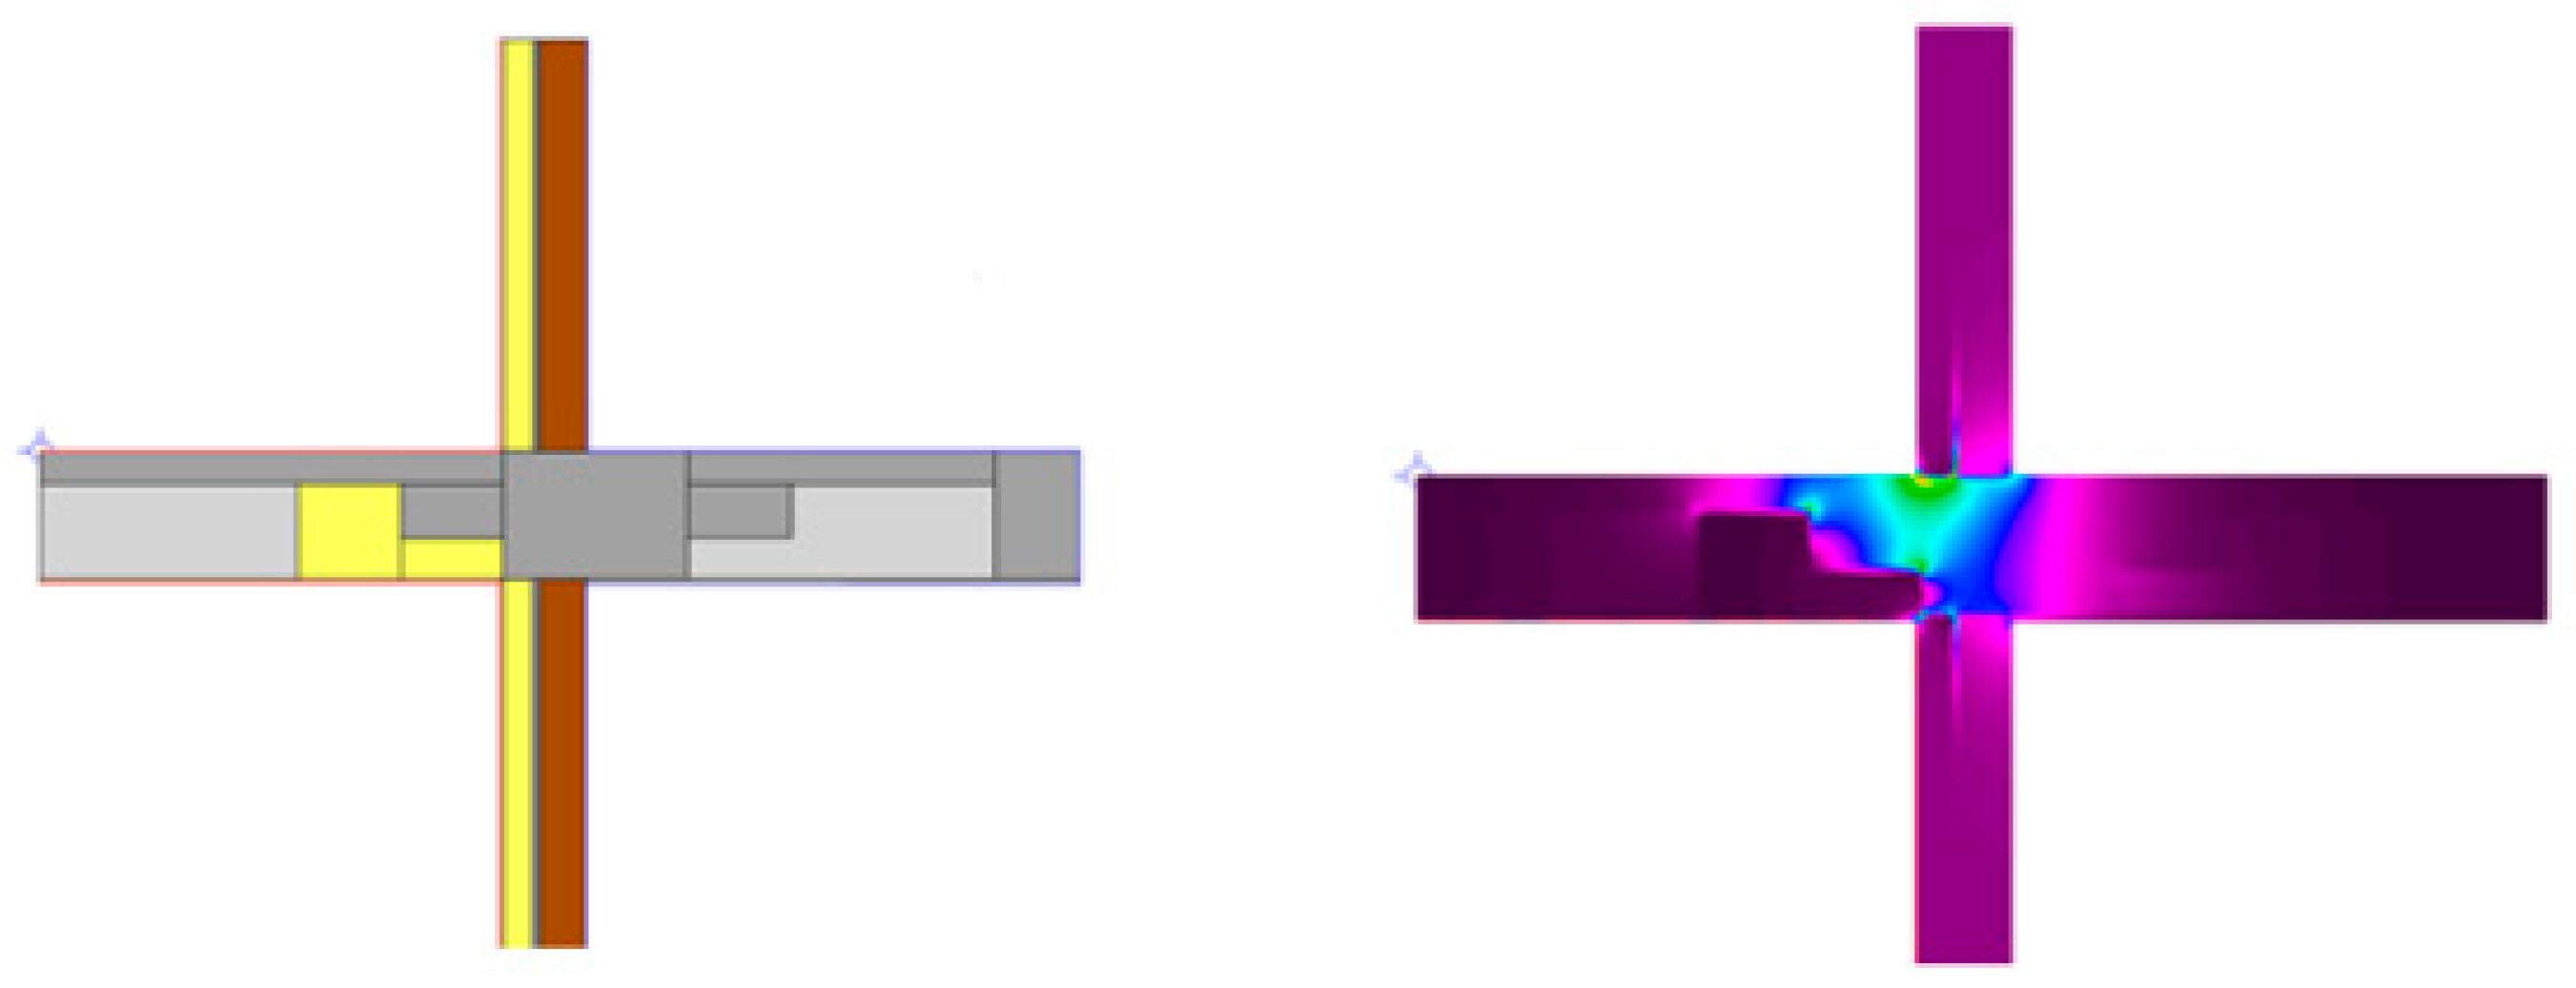
Several options were analyzed to adapt as far as possible the renovation measures to the building construction characteristics. The weakest point, from a thermal performance point of view, is the joint between the vertical elements of the envelope and the balcony cantilevers on every floor. The most balanced (cost–thermal performance) solution consists of injecting PUR into the internal hollow concrete blocks that shape the under-slab soffit.
Figure 6 shows the areas (in yellow) where the PUR insulation replaced one and a half hollow concrete blocks of the slab, and the heat flux gradient calculated with Therm © for this type of thermal bridge. The resulting linear thermal transmittance is 0.84 W/mK.
For calculation purposes, this linear thermal transmittance coefficient value was used independently of other renovation measures that may interact with the thermal and energy performance of the building in those specific areas.
The thermal bridges around the openings were improved with PUR and vapour barriers. Table 2 summarizes the renovation measures for thermal bridges, their correspondent thermal parameter and cost.

3.2.3. Ventilation and Infiltration Solutions

Two types of ventilation systems were considered for this renovation project. The first one was a mechanical system that provided 0.5 ACH using an exhaust fan and self-regulated vents located in the façade. The second option, also mechanically driven, consisted of a heat recovery unit and inlet and exhaust fans. The equivalent air change rate of this system was 0.3 ACH. The term equivalent means that this 0.3 ACH was the air flow which entered the building at the outdoor temperature. Table 3 summarizes the renovation measures corresponding to the ventilation system, their level of air changes per hour and cost.
In addition, a night ventilation system was analyzed and included in the evaluation of the renovation measures to be implemented in the building. It consisted of a mechanical exhaust fan used on summer nights that mixed colder outdoor air with indoor air to regulate the temperature and comfort of each apartment. The air flow allowed the air in each apartment to be renewed 10 times per hour, and the cost of this system was 150 € per apartment.
Regarding the air infiltration, improving the window contours using expansive foam and indoor and outdoor sealing tape was considered to increase the airtightness. Using this renovation measure the airtightness could be quantified with the n50 value. Table 4 shows the proposed renovation measures and their corresponding infiltration rate.

3.2.4. Domestic Hot Water Production Systems

A centralized aerothermal system, consisting in a centralized heat pump unit, was evaluated as an option to produce the domestic hot water with a high level of renewable energy, quantified as 50%. The price of this system is 67,314 € for the whole building.

3.2.5. Cooling and Heating Systems

These systems were not considered since the project budget did not allow it.

4. Results and Discussion

For the pilot building (case study) described in Section 3.1, a set of different building renovation alternatives were considered, as described in Section 3.2. Following the methodology explained in Section 2.1 and Section 2.2, the LCC and the corresponding primary energy consumption of several combinations of building renovation measures were assessed. The results of these calculations are reported in the following sections.

4.1. General Application of the Methodology and Obtaining the Optimal Solution Package

The following graphs shows the result of the combinations assessed:
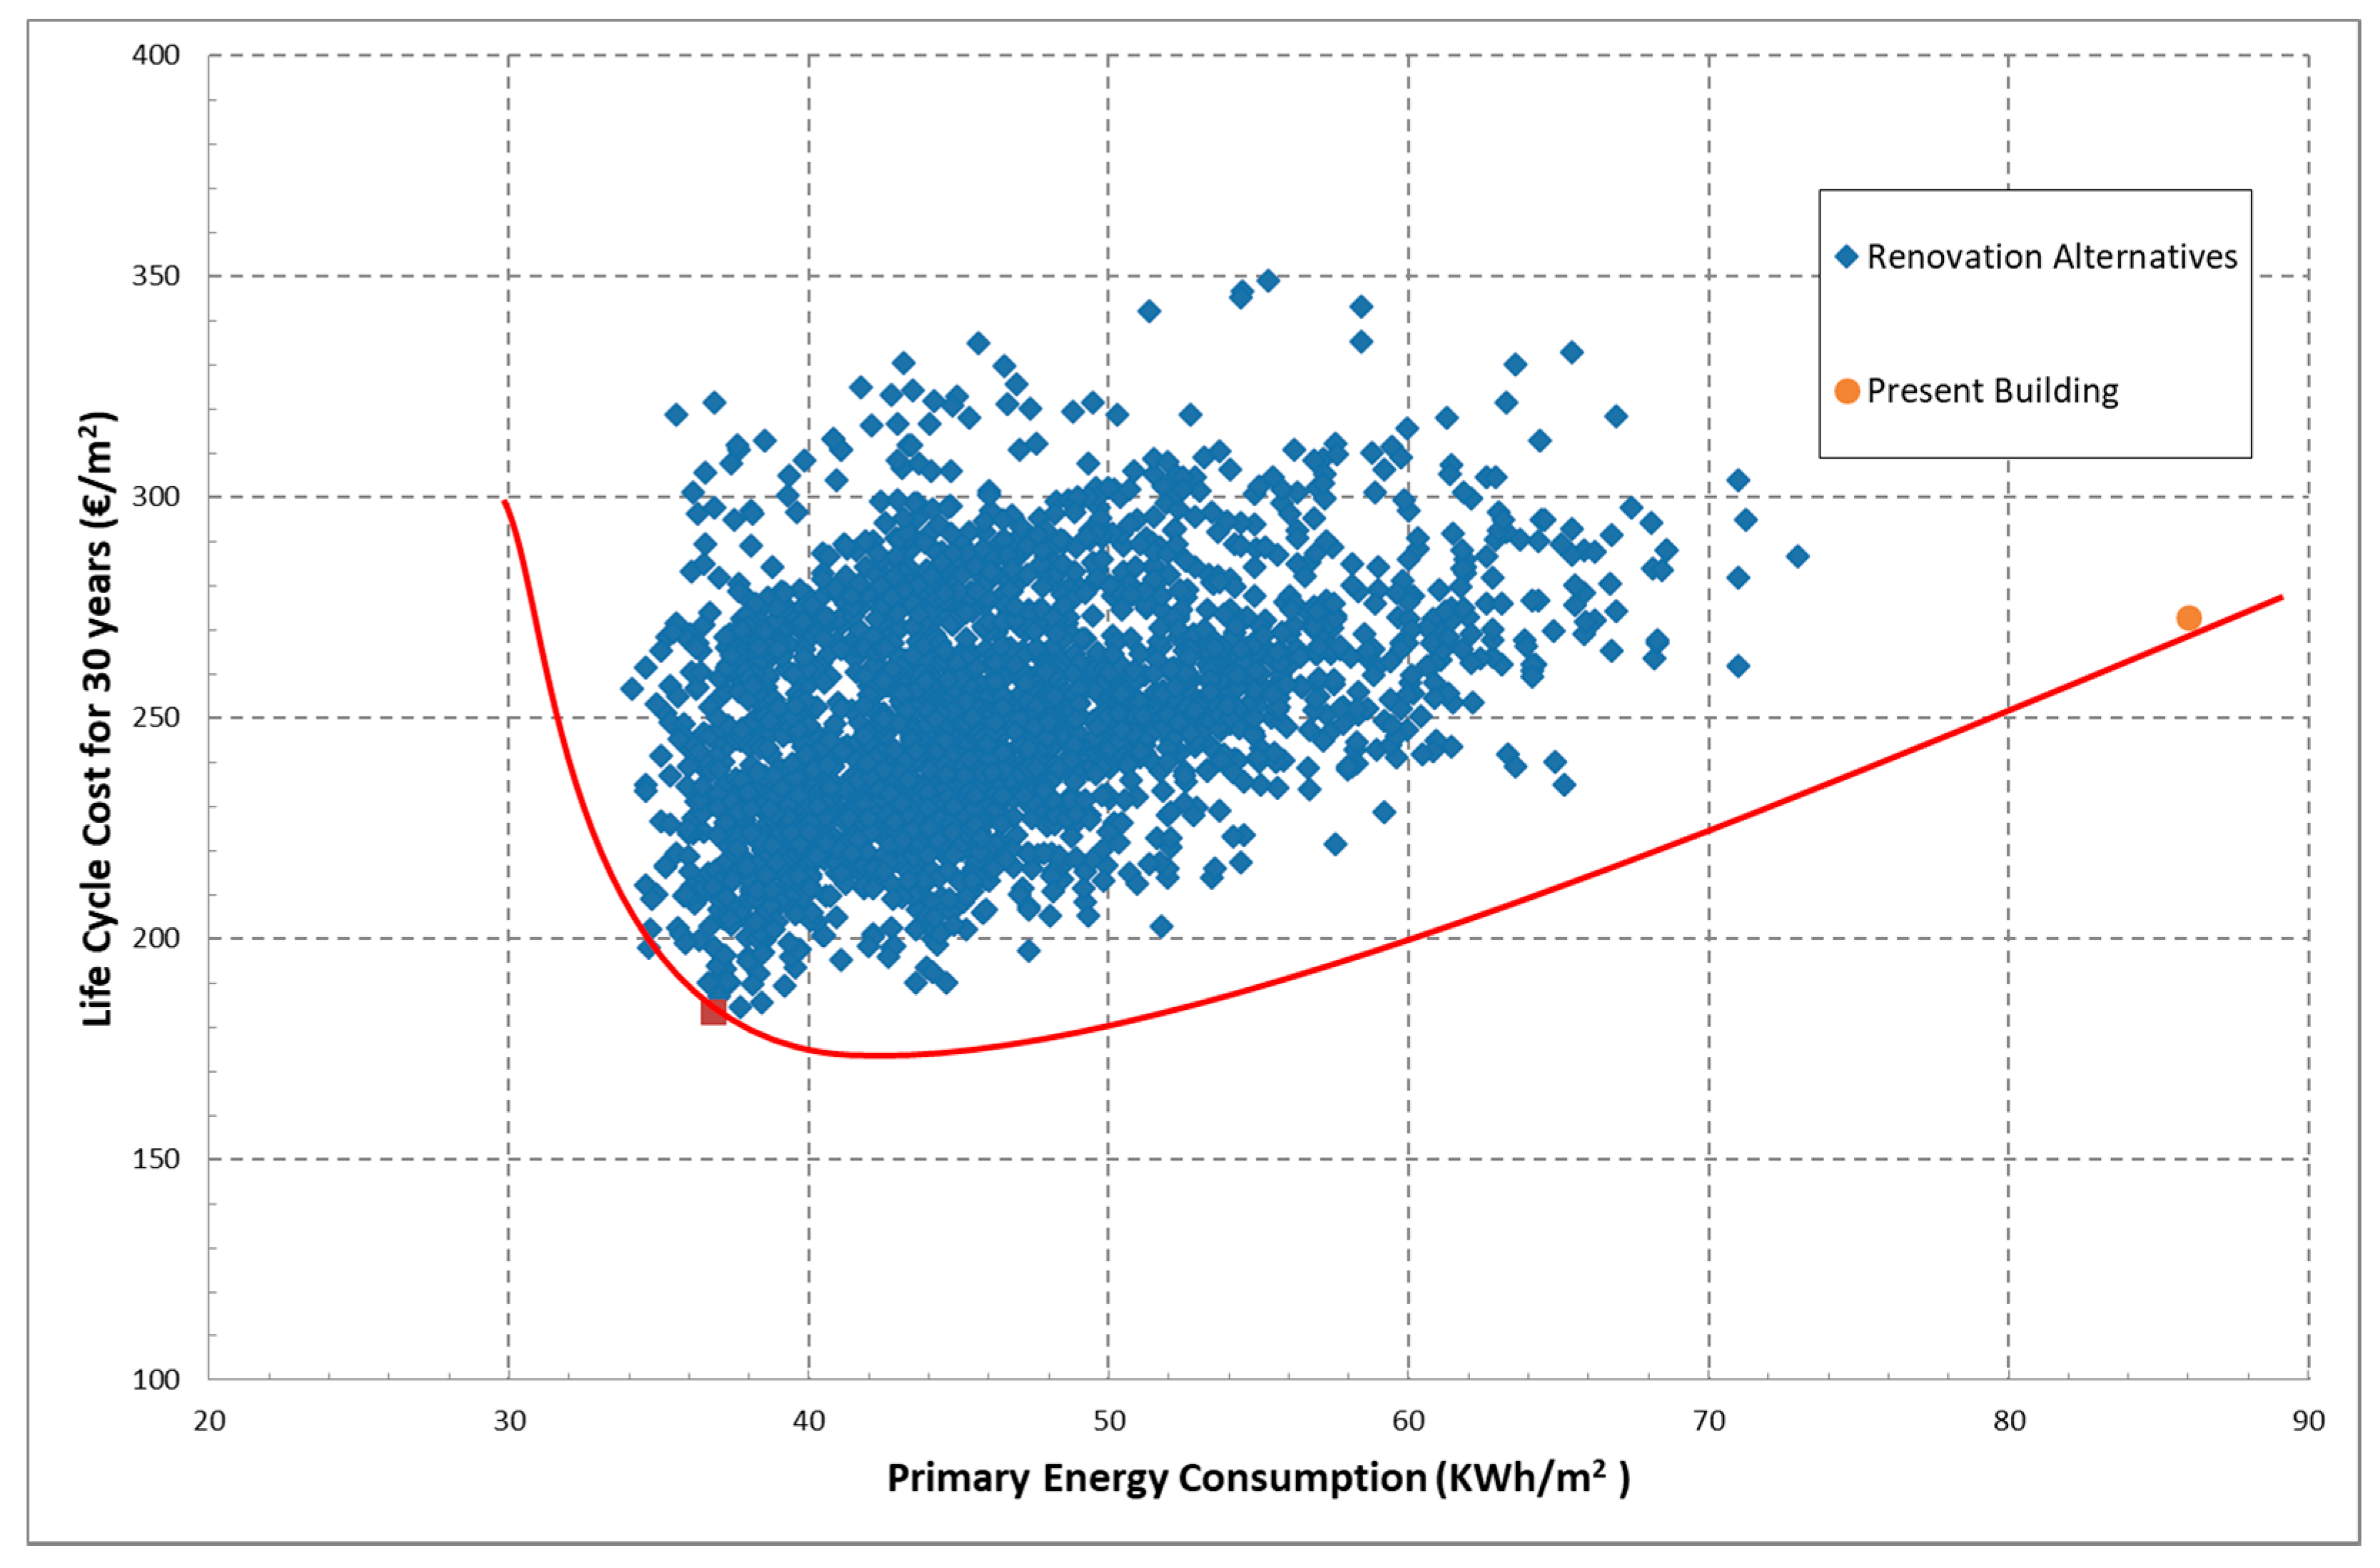
Each of the points on the figure represents the possible combination of renovation measures that can be applied to renovate the building (set of renovation measures). Therefore, each point represents the status of the building after renovation. Finally, a set of renovation measures was selected for the renovation of the building, specifically the red dot at the right on the “pareto front” in Figure 7. This pareto front is the curve that represents the locus of points with the minimum LCC achievable with the defined set of renovation measures for each primary energy consumption value. This minimum LCC was reached with a specific combination of the renovation measures.
It is important to highlight that the vertical reference lines in Figure 7 contain the points at which the primary energy consumption was the same but the LCC was different. In practice, they represent different combinations of measures where the building would have the same primary energy consumption but a different LCC. It is noteworthy that the LCC could vary by up to 67% for two situations with the same primary energy consumption, meaning that the investment costs plus the operating and maintenance costs may have been 1.67 times higher in one building than in another whose renovation measures were selected with a lower LCC, and, therefore, with a better criterion. Since the primary energy consumption was the same, the operating energy cost was approximately the same, except for the different prices for different energy sources, and this implies that the fundamental difference was in the cost of the renovation measures, in other words the initial investment costs. In short, if the set of renovation measures were not properly chosen, the investment costs to renovate a building could have been 1.67 times higher than another set of renovation measures that provided similar results. This is what the HAPPEN project aims to prevent, particularly with this case study, given that this could be one of the obstacles to the energy renovation of buildings. A high investment cost can, as shown, be the result of the incorrect choice of a set of renovation measures for a building.
Other point of view is that several variants in fact had the same cost, but very different primary energy consumption. Thus, the election of the variant with the lowest primary energy would mean that the building was environmentally-friendlier than the others. If the LCC of the renovated building was better than that of the original, it might be a win-win situation for both the users and the environment.
Table 5 summarizes the different packages of optimal solutions for the pilot building. The code in each cell corresponds to the number given in the tables of the appendix or Section 3.2 for the description of different renovation measures collected in the list. For instance, a 7 in the façade solution corresponds to the solution with this code in Table A2 in Appendix A.
As mentioned, the goal of this study is to find the combination of renovation measures with the best balance in terms of LCC and its impact on energy savings. Table 5 shows the 12 selected packages of renovation measures, and the optimal combination, this is the one that minimized the LCC, has been highlighted in green. The façade, roof, windows, doors, slabs, thermal bridges, ventilation, airtightness, night ventilation and DHW are the areas considered in this evaluation study as the ones that can guarantee that the building is upgraded to NZEB condition.
The most common solution for façades was an ETIC system, solution number 7, which guaranteed the continuous insulation of the vertical elements of the envelope, keeping under control the thermal bridges caused by the slab edges on each story. In addition, this solution provided an optimal situation of the thermal mass inside the building, allowing for a high level of energy storage in the building structure.
The roof evaluation showed that green roofing (roof number 5) was an option to bear in mind when specifying solutions during the design process. There was a diverse range of very suitable solutions for this zone of the building. Even though green roofing did not appear in other packages, it was included in the optimal package due to its insulation characteristics and the benefits that it offered beyond thermal performance and LCC, such as decreases in albedo and heat island effects and the fact that it was a natural system for capturing CO2. Moreover, the relationship between its construction cost and thermal performance was better than other construction solutions manufactured with inert materials.
Due to the mildness of the climate, the thermal performance capacity of the windows could be lower than in colder regions. The optimal solution for windows was number 3, which is in the middle of the specifications table shown in the list.
The optimal solution to reduce thermal bridging was number 3. It was the most recurrent in all packages as the cost differences between the three options was trivial, but the thermal performance increased substantially when this option was used; it combined under-slab insulation with the thermal improvement of the opening contour.
In 10 solutions out of 12, ventilation was equal to the base rate (one air change per hour), although in most of these cases airtightness was improved to avoid an increase in the air infiltration rate. Thus, the amount invested in improving ventilation was used in other solutions that simulations showed to be more profitable in terms of life cycle cost, such as improving the thermal transmittance of the elements of the envelope. This was motivated by:
-
the mildness of the climate. In other locations with colder outdoor temperatures the solution could differ;
-
the price of the ventilation system in relation to the price of other renovation measures.
Regarding airtightness, the optimum solution was number 2, which only focused on solving air infiltration problems without incorporating any extra insulation layer into other elements.
A night ventilation system was implemented. Due to the climate conditions, it was only necessary to guarantee the air flow with an exhaust unit combined with air vents on windows, as in solution 2. This solution appeared 6 out of 12 times during the optimal solution calculations.
Table 6 summarizes the representative global values for each package of solutions. It is important to remember that the intervention area was 3698.14 m2 in every case, which was the total usable area of the pilot building:
The optimization process was replicated for different user behaviour as described in the methodology section. The POS obtained was exactly the same, which proves the consistency of the solutions and their independence from the user’s habits when operating the systems; the previous is valid for this building typology, climate, renovation costs and energy prices.

4.2. Optimal Solution for the Pilot Building

In the pilot building, the optimal solution that was finally chosen was the package number 1 out of the 12 in Table 6. This is detailed in Table 7.
Once the building has been renovated as shown in Table 7, the energy performance of the building is that shown in Table 8, where the building´s energy performance was compared before and after the renovation; applying the optimal solutions to renovate the building could be seen to result in energy savings of approximately 60%.

5. Conclusions

A POS has been obtained for a case study building located in a mild climate in the Med region of Spain. Primary energy savings for the POS are very high, between 53.8% and 57.2%, with a 30-year life cycle cost between 183.5 and 197.9 €/m2. The life cycle cost of the current building (275 €/m2 in its pre-renovation situation) has been reduced considerably, between 28% and 33%. Since the LCC includes the initial investment and the operating and maintenance costs, it can be said that all the measures of the POS are very interesting from an economic point of view.
The investment cost to implement the POS is between 42.6 €/m2 and 55.3 €/m2. These costs have been evaluated according to the prices reported in Section 3.2, obtained from the database of construction prices in the Valencian Community [36], the region where the pilot building is located. Thus, the validity of the results is circumscribed to the same building typology, climatic zone and cost of renovation measures and energy.
It should be noted that with the same initial investment, several renovation solutions can be found, many of which have a higher life cycle cost and energy consumption than those found in the POS.
Likewise, there are solutions with the same primary energy consumption as the optimal one but with a much higher initial investment. Specifically, there is one renovation alternative with an energy consumption of 36.87 kWh/m2, a 30-year LCC of 321.47 €/m2 and an initial investment of € 179.8/m2. Note that due to the optimization performed, the investment cost is reduced by 76.3%. In other words, the same result is achieved in terms of energy consumption, but with an investment 4.22 times lower.
Therefore, before renovating a building, it is necessary to be clear about the savings objectives to be achieved, the improvement measures available and their cost before deciding on the best combination. The combination of measures is more effective than the individualized application of each one and it is necessary to make calculations, or follow some indications, to optimize the intervention in terms of investment.
The optimal solution or the POS obtained can be compared with other previous studies, specifically with the study by Guardigli et al. [16]. Although the use of the buildings is different, remarkably similar values are observed in terms of payback period since the optimized measures have a cost proportional to the savings they provide. If the compare the POS of the pilot apartment building to the POS obtained for generic reference buildings, we observe that the latter lead very well towards the optimum, although it would be necessary in the long term to have more powerful tools or pre-calculated cases that allow engineers and architects to take a decision that optimizes the life cycle cost of the building and its systems.
In the future, more research should focus on step-by-step renovations because some users, especially private owners, do not carry out renovations in a single step. When a one-moment-in-time optimal renovation is split into different stages, it is very important to define which measures should be implemented in each step as this order has repercussions on the LCC, the payback and of course in the initial investment of that step.

Author Contributions

Conceptualization, J.M.S.L.; data curation, C.I.J.E. and M.N.E.; formal analysis, C.I.J.E.; investigation, J.M.S.L.; methodology, J.M.S.L. and F.J.S.d.l.F.; Supervision, T.K.; writing—original draft, J.M.S.L. and C.I.J.E.; writing—review & editing, F.J.S.d.l.F., T.K. and M.-N.A. All authors have read and agreed to the published version of the manuscript.

Funding

This research was funded by European Union’s Horizon 2020 research and innovation programme, grant agreement number 785072. It has been performed within the framework of the project HAPPEN-Holistic APproach and Platform for the deep renovation of the med residential built Environment. It reflects only the author’s view and that the Agency and the Commission are not responsible for any use that may be made of the information it contains.

Institutional Review Board Statement

Not applicable.

Data Availability Statement

Not applicable.

Acknowledgments

The authors are grateful for the support of EVha: Entitat Valenciana d´Habitatge i Sòl (Eng.: Valencian Entity of Housing and Land), and José Fco Zapater Colomer from ARG Arquitectos for the data and figures used in this research.

Conflicts of Interest

The authors declare no conflict of interest.

Appendix A. List of Renovation Measures

The following tables summarize the thermal and geometrical properties of the envelope of the building and the different systems of the building, whether they exist or not, in its current conditions. They include the description by an image of a cross section, each layer thickness and material, and the U-value when appropriate or other thermal property.
Table A1. Main thermal and geometrical properties of the present building envelope and systems.
Façade: Transmittance U = 1.17 W/m2·K
Applsci 11 01423 i001LayersMaterialsD (cm)
Ext.Exposed ceramic brick11.5
2Air chamber3
3Hollow ceramic brick7
Int.Plaster lining1
Roof: Transmittance U = 1.47 W/m2 K
Applsci 11 01423 i002LayersMaterialsD (cm)
Ext.Outdoor ceramic tiles2
2Gripping mortar1
3Waterproofing sheet layer0.3
4Horizontal ceramic brick base3
5Air chamber 22.5
6Existing slab25
Int. Gypsum plaster1
Slab: Internal slab between the ground floor and the first floor. Transmittance U = 1.72 W/m2·K
Applsci 11 01423 i003LayersMaterialsD (cm)
Int.Marble floor finish1
2Cement mortar1
3Reinforced concrete slab25
4Air cavity2
Ext.Plasterboard ceiling1
Windows: Transmittance U (W/m2 K) = 5.7
Description
Single-glazed units with aluminum frame system without thermal bridge break. The glazing solar factor is 0.85. Folding leaf opening system.
Balcony doors: Transmittance U (W/m2 K) = 5.7
Description
Single-glazed units with aluminum frame system without thermal bridge break. The glazing solar factor is 0.85. Sliding door opening system.
Thermal bridges 1: Joint between façade and slab at balcony. Linear thermal transmittance ᴪe (W/mK) = 1.003
Applsci 11 01423 i004Description
The initial values for the linear thermal transmittance were selected from the official documents of the Spanish Technical Building Code [38] except for the joints between façades and slabs because these were not present in the previous atlas. The initial value of this kind of thermal bridge was evaluated using the Therm© software tool. The figure on the left shows the heat flux gradient. The evaluated psi-value of the detail is 1.003 W/mK.
Ventilation system: air changes per hour, ACH = 1
TypeDescription
NaturalThe ventilation rate of the existing building currently relies only on natural ventilation from opening windows. Thus, for the assessment of the energy needs, the software tool considers the minimum air ventilation rate required by the building technical code, which in this building is 1 air change per hour (ACH).
Infiltration: n50 = 10
Description
The initial airtightness of the building was quantified by a n50 value of 8.5 which corresponds to the average value of the existing buildings in Spain [39].
Domestic hot water (DHW) system: η = 0.92
TypeDescription
Mixed gas boiler The domestic hot water system is based on a mixed gas boiler with a seasonal performance of 0.92.
Heating system
TypeDescription
Natural gas boilerDefault system from the Spanish technical building code [40]: natural gas heating system with a nominal performance of 0.92
Cooling system
TypeDescription
Centralized Heat pumpDefault system from the Spanish Building Regulations [40]: one centralized heat pump per dwelling with a nominal performance coefficient of 2.60.
The following tables summarize the solutions considered for the renovation of the façade. They include the description by means of a cross-sectional image, each layer thickness and material, U-value, and their price.
Table A2. Proposed Façade renovation measures.
FaçadeLayersMaterialsD
(cm)
U
(W/m2K)
Price (€/m2)
1/Existing building façade composition (description on Section 3.1 of this paper)84.35
2/
Applsci 11 01423 i005
Ext.layer
Layer 2
Layer 3
Layer 4
Int. layer
Exposed ceramic brick
Cement plaster
Air chamber
Rockwool insulation
Plasterboard lining
11.5
2
2
5
1.5
0.4685.67
3/
Applsci 11 01423 i006
Ext.layer
Layer 2
Layer 3
Layer 4
Int. layer
Cement plaster
hollow brick
Rockwool insulation
hollow brick
Plaster lining
1.5
11
5
9
1.5
0.3979.07
4/
Applsci 11 01423 i007
Ext.layer
Layer 2
Layer 3
Layer 4
Layer 5
Int. layer
Cement render
hollow brick
air cavity
Rockwool insulation
hollow brick
Plaster lining
1.5
11
5
5
7
1.5
0.3878.50
5/
Applsci 11 01423 i008
Ext.layer
Layer 2
Layer 3
Layer 4
Int. layer
Cement render
Solid brick
air cavity
Rockwool insulation
Plasterboard lining
1.5
19
2
5
1.5
0.465.57
6/
Applsci 11 01423 i009
Ext.layer
Layer 2
Layer 3
Int. layer
EPS insulation
Air cavity
Solid brick
Plaster lining
6
6
11.5
1.5
0.4876.18
7/
Applsci 11 01423 i010
Ext.layer
Layer 2
Layer 3
Int. layer
EPS insulation
Air cavity
XPS insulation
Plasterboard lining
6
6
4.8
1.5
0.3153.72
8/
Applsci 11 01423 i011
Ext.layer
Layer 2
Layer 3
Layer 4
Layer 5
Int. layer
Cement render
XPS insulation
Air cavity
Waterproofed Plasterboard
XPS insulation
Plasterboard lining
1
4.8
5
1.3
4.8
1.5
0.34125.61
9/
Applsci 11 01423 i012
Ext.layer
Layer 2
Layer 3
Layer 4
Layer 5
Layer 6
Int. layer
Mineral fiber Reinforced Plasterboard (PB)
EPS insulation
Mineral fiber Reinforced PB
Air cavity
Waterproofed Plasterboard
EPS insulation
Plasterboard lining
1
8
1
6
1.3
4.8
1.5
0.26144.68
Table A3. Proposed renovation measures for openings: windows and external doors.
Windows
SolutionGlazing & Frame SystemsD
(cm)
U
(W/m2K)
Price (€/m2)
1/Existing building façade composition (description on Section 3.1 of this paper)
2/Aluminium frame 2 folding leaves with thermal break system
Double glazing low emissive coating + solar protection 6/12/6 mm
U: 1.8 W/m2k
Luminous transmittance: 49%
G: 0.38
135 × 1202.25104.27
3/Aluminium frame 2 folding leaves with thermal break system and airtightness joint.
Double glazing guardian sun 6/12/6 mm
U: 2.8 W/m2k
Luminous transmittance: 42%
G: 0.49
135 × 1203.94122.20
4/Aluminium Monoblock frame 2 folding leaves with thermal break system, airtightness joint. Shutter.
Double glazing guardian sun 6/12/6-6 mm with acoustic film
U: 2.6 W/m2k
Luminous transmittance: 42%
G: 0.40
135 × 1202.9163.38
5/Aluminium monoblock frame 2 folding leaves with thermal break system, airtightness joint.
Double glazing green tinted guardian sun 6/12/6 mm with dehydrated air chamber
U: 2.8 W/m2k
Luminous transmittance: 61%
G: 0.59
135 × 1202.98114.86
6/Aluminium monoblock frame 2 folding leaves with thermal break system, airtightness joint.
Double glazing guardian sun 6/12/6 mm with dehydrated air chamber
U: 2.8 W/m2k
Luminous transmittance: 61%
G: 0.59
135 × 1203.1118.25
7/ PVC frame, 2 folding leaves, with thermal break system. No air tightening reinforce need.
Triple glazing of clear glass panels 8/16/6/16/8 with 2 air chambers argon filled.
U:0.60 W/m2k
G: 0.62
135 × 1200.61194.10
External Doors
SolutionGlazing & Frame SystemsD
(cm)
U (W/m2K)Price (€/m2)
1/Existing building façade composition (description on Section 3.1 of this paper)
2/Aluminium sliding door frame system 2 leaves with thermal break system, airtightness joint.
Double glazing low emissive coating 6/12/6 mm
U: 1.6 W/m2k
Luminous transmittance: 66%
G: 0.41
210 × 2202.97148.65
3/Aluminium sliding door frame system 2 leaves with thermal break system, airtightness joint.
Double glazing low emissive coating 6/12/6 mm
U: 2.09 W/m2k
Luminous transmittance: 66%
G: 0.3
210 × 2203.39133.21
4/Aluminium sliding door frame system 2 leaves with thermal break system, airtightness joint.
Double glazing low emissive coating 6/25/6 mm with internal blind system in the air chamber
U: 2.2 W/m2k
G: 0.6
210 × 2203.48581.50
5/Aluminium sliding door frame system 2 leaves with thermal break system, airtightness joint.
Double glazing low emissive coating 6/12/6 mm
U: 2.8 W/m2k
G: 0.70
210 × 2202.97143.32
6/Aluminium sliding door frame system 2 leaves with thermal break system, airtightness joint.
Double glazing guardian sun 6/12/6 mm with dehydrated air chamber
U: 2.6 W/m2k
Luminous transmittance: 61%
G: 0.22
210 × 2202.82190.43
7/PVC sliding door frame system, 2 leaves with thermal break system.
U: 0.60 W/m2k
Triple glazing of clear glass panels 6/16/6/16/6 with 2 air chambers.
G: 0.62
210 × 2200.61255.44
Table A4. Proposed renovation measures for roof components.
RoofLayersMaterialsD
(cm)
U
(W/m2K)
Price (€/m2)
1/Existing building façade composition (description on Section 3.1 of this paper)
2/Ext. layerEarth substrate180.2081.88
Layer 2Polyester resin1
Layer 3XPS insulation12
Layer 4Waterproofing layer2
Layer 5Cement mortar2
Layer 6Cellular concrete2
Layer 7Reinforced concrete slab25
3/Ext. layerEarth substrate180.1696.81
Layer 2Polyester resin1
Layer 3XPS insulation16
Layer 4Waterproofing layer2
Layer 5Cement mortar2
Layer 6Cellular concrete2
Layer 7Reinforced concrete slab25
4/Ext. layerEarth substrate180.2877.47
Layer 2Polyester resin1
Layer 3XPS insulation8
Layer 4Waterproofing layer2
Layer 5Cement mortar2
Layer 6Cellular concrete2
Layer 7Reinforced concrete slab25
5/Ext. layerEarth substrate180.5471.60
Layer 2Polyester resin1
Layer 3XPS insulation3
Layer 4Waterproofing layer2
Layer 5Cement mortar2
Layer 6Cellular concrete2
Layer 7Reinforced concrete slab25
6/Ext. layerRoof ceramic tile20.23121.62
Layer 2Cement mortar1
Layer 3Polyester Resin2
Layer 4Polypropylene 25% glass fibre0.5
Layer 5XPS insulation10.5
Layer 6Cement mortar1.5
Layer 7Cellular concrete2
Layer 8Reinforced concrete slab25
7/Ext. layerRoof ceramic tile20.60117.74
Layer 2Cement mortar1
Layer 3Polyester Resin2
Layer 4Polypropylene 25% glass fiber0.5
Layer 5MW insulation4
Layer 6Cement mortar2
Layer 7Cellular concrete2
Layer 8Reinforced concrete slab25
8/Ext. layerRoof ceramic tile10.24116.48
Layer 2Cement mortar2.5
Layer 3Polyester Resin0.5
Layer 4Waterproofing layer1
Layer 5Polypropylene 25% glass fiber0.5
Layer 6XPS insulation10
Layer 7Cement mortar2
Layer 8Air cavity5
Layer 9Reinforced concrete slab25
Layer 10Plasterboard ceiling1.5
Table A5. Proposed renovation Measures for slabs.
SlabLayersMaterialsD
(cm)
U
(W/m2K)
Price (€/m2)
1/Existing building façade composition (description on Section 3.1 of this paper)
2/Int. layerMarble floor finish40.3946.47
Layer 2Cement mortar1
Layer 3Mineral wool1
Layer 4Reinforced concrete slab25
Layer 5Air cavity5
Layer 6Mineral wool5
Layer 7Plasterboard ceiling1.5
3/Int. layerMarble floor finish40.7629.65
Layer 2Cement mortar1
Layer 3Mineral wool2
Layer 4Reinforced concrete slab25
Layer 5Air cavity3
Layer 6Plasterboard ceiling1.5
4/Int. layerMarble floor finish40.2645.93
Layer 2Cement mortar1
Layer 3Reinforced concrete slab 25
Layer 4Air cavity3
Layer 5Mineral wool10
Layer 6Plasterboard ceiling1.5
5/Int. layerMarble floor finish40.2157.77
Layer 2Cement mortar1
Layer 3Mineral wool 3
Layer 4Reinforced concrete slab25
Layer 5Air cavity3
Layer 6Mineral wool10
Layer 7Plasterboard ceiling1.5

Appendix B. Calculation of Infiltration Rate for the Airtightness Measures

The n50 value for the airtightness measures has been calculated using the next equation:
n 50 [ h 1 ]   =   ( C 0 · A 0 + C h · A h ) · ( 50 100 ) 0.667
where:
  • A0 is the surface of the opaque elements of the building envelope next to the outdoor, this is façade 1, façade 2 and roof and is equal to 2618.4 m2;
  • Ah is the surface of the glazed elements of the building envelope, this is 498.2 m2;
  • C0 is the permeability of the opaque elements of the building envelope at 100 Pa, this can be considered equal to 16 m3/hm2 or 29 m3/hm2 for new and existing buildings respectively [25];
  • Ch is the permeability of the semi-transparent elements at 100 Pa, this is 50 m3/hm2 for all the new windows and glazed external doors in the list of renovation measures.

References

  1. Pérez-Lombard, L.; Ortiz, J.; Pout, C. A review on buildings energy consumption information. Energy Build. 2008, 40, 394–398. [Google Scholar] [CrossRef]
  2. Santamouris, M.; Kolokotsa, D. Passive cooling dissipation techniques for buildings and other structures: The state of the art. Energy Build. 2013, 57, 74–94. [Google Scholar] [CrossRef]
  3. International Energy Agency. Technology Roadmap—Energy Efficient Building Envelopes; IEA: Paris, France, 2014. [Google Scholar]
  4. International Energy Agency. Energy Efficiency in Europe: Overview of Policies and Good Practices; IEA: Paris, France, 2014. [Google Scholar]
  5. Prognosesenteret, A.S. Potensial-og Barrierestudie: Energieffektivisering av Norske Boliger; Enova: Chicago, IL, USA, 2012. [Google Scholar]
  6. UNEP. Common Carbon Metric for Measuring Energy Use & Reporting Greenhouse Gas Emission from Buildings Operations; Sustainable Buildings & Climate Initiative: Paris, France, 2009. [Google Scholar]
  7. European Comission. Available online: https://ec.europa.eu/info/strategy/priorities-2019-2024/european-green-deal_en (accessed on 9 December 2020).
  8. Bragadin, M.; Boiardi, L.; Santoni, L. Global Cost Analysis for energy refurbishment of Social Housing. In de ISTEA 2014 Proceedings; Maggioli: Rimini, Italy, 2014. [Google Scholar]
  9. Kurnitski, J.; Allard, F.; Braham, D.; Goeders, G.; Heiselberg, P.; Jagemar, L.; Kosonen, R.; Lebrun, J.; Mazzarella, L.; Railio, J.; et al. How to define nearly net zero energy buildings nZEB—REHVA proposal for uniformed national implementation of EPBD recast. REHVA J. 2011, 48, 6–12. [Google Scholar]
  10. Padula, M.; Picenni, F.; Malvezzi, R.; Laghi, L.; Lissén, J.M.S.; de la Flor, F.J.S.; Mateo-Cecilia, C.; Soto-Francés, L.; Assimakopoulos, M.N.; Karlessi, T. MedZEB: A new holistic approach for the deep energy retrofitting of residential buildings. TECHNE 2018, SpecialSeries1, 127–133. [Google Scholar]
  11. European Parliament and Council. Directive 2010/31/EU of the European Parliament and of the Council of 19 May 2010 on the Energy Performance of Buildings (Recast); EU: Brussels, Belgium, 2010. [Google Scholar]
  12. Corrado, V.; Ballarini, I. Refurbishment trends of the residential building stock: Analysis of a regional pilot case in Italy. Energy Build. 2016, 132, 91–106. [Google Scholar] [CrossRef]
  13. IEE EPISCOPE Project. Available online: https://episcope.eu/iee-project/episcope/ (accessed on 9 December 2020).
  14. European Parliament and Council. Directive (EU) 2018/844 of the European Parliament and of the Council of 30 May 2018 Amending Directive 2010/31/EU on the Energy Performance of Buildings and Directive 2012/27/EU on Energy Efficiency; EU: Brussels, Belgium, 2018. [Google Scholar]
  15. Wrålsen, B.; O’Born, R.; Skaar, C. Life cycle assessment of an ambitious renovation of a Norwegian apartment building to nZEB standard. Energy Build. 2018, 177, 197–206. [Google Scholar] [CrossRef] [Green Version]
  16. Guardigli, L.; Bragadin, M.A.; Della Fornace, F.; Mazzoli, C.; Prati, D. Energy retrofit alternatives and cost-optimal analysis for large public housing stocks. Energy Build. 2018, 166, 48–59. [Google Scholar] [CrossRef]
  17. Brambilla, A.; Salvalai, G.; Imperadori, M.; Sesana, M.M. Nearly zero energy building renovation: From energy efficiency to environmental efficiency, a pilot case study. Energy Build. 2018, 166, 271–283. [Google Scholar] [CrossRef]
  18. Fotopoulou, A.; Semprini, G.; Cattani, E.; Schihin, Y.; Weyer, J.; Gulli, R.; Ferrante, A. Deep renovation in existing residential buildings through façade additions: A case study in a typical residential building of the 70s. Energy Build. 2018, 166, 258–270. [Google Scholar] [CrossRef]
  19. Salvalai, G.; Sesana, M.M.; Iannaccone, G. Deep renovation of multi-storey multi-owner existing residential buildings: A pilot case study in Italy. Energy Build. 2017, 148, 23–36. [Google Scholar] [CrossRef]
  20. BPIE. Cost optimality. Discussing methodology and challenges within the recast Energy Performance of Building Dir; BPIE: Brussels, Belgium, 2010. [Google Scholar]
  21. de Vasconcelos, A.B.; Pinheiro, M.D.; Manso, A.; Cabaço, A. EPBD cost-optimal methodology: Application to the thermal rehabilitation of the building envelope or a Portuguese residential building. Energy Build. 2016, 111, 12–25. [Google Scholar] [CrossRef]
  22. Becchio, C.; Dabbene, P.; Fabrizio, E.; Monetti, V.; Filippi, M. Cost optimality assessment of a single family house: Building and technical systems solutions for the nZEB target. Energy Build. 2015, 90, 173–187. [Google Scholar] [CrossRef]
  23. EUR-Lex. Access to European Union law. Available online: https://eur-lex.europa.eu/LexUriServ/LexUriServ.do?uri=OJ:L:2012:081:0018:0036:EN:PDF (accessed on 3 September 2020).
  24. Sánchez de la Flor, F.J.; Rodríguez Jara, E.Á.; Ruiz Pardo, Á.; Salmerón Lissén, J.M.; Kolokotroni, M. Kolokotroni. Energy-efficient envelope design for apartment blocks. Case study of a residential building in Spain. Appl. Sci. 2021, 11, 433. [Google Scholar]
  25. Ministerio de Fomento. Documento Básico HE Ahorro de Energía. 20 December 2019. Available online: https://www.codigotecnico.org/DocumentosCTE/AhorroEnergia.html (accessed on 19 August 2020).
  26. CTE. Código Técnico de la Edificación.HULC–Herramienta Unificada LIDER-CALENER. Available online: https://www.codigotecnico.org/Programas/HerramientaUnificadaLIDERCALENER.html (accessed on 31 January 2020).
  27. Neymark, J.; Judkoff, R.; Alexander, D.; Felsmann, C.; Strachan, P.; Wijsman, A. International Energy Agency Building Energy Simulation Test and Diagnostic Method (IEA BESTEST) Multi-Zone Non-Airflow In-Depth Diagnostic Cases: MZ320–MZ360; International Energy Agency: Paris, France, 2008. [Google Scholar]
  28. UNE. Normalización Española. Available online: https://www.une.org/encuentra-tu-norma/busca-tu-norma/norma?c=N0062614#:~:text=16798%2D7%3A2019-,Eficiencia%20energ%C3%A9tica%20de%20los%20edificios.,(M%C3%B3dulo%20M5%2D5) (accessed on 31 February 2020).
  29. Ministerio Para la Transición Ecológica y el reto Demográfico. Energía. El Petróleo. Precios y tarifas. Informes Mensuales. Available online: https://energia.gob.es/petroleo/Informes/InformesMensuales/Paginas/InformesMensuales.aspx (accessed on 9 January 2020).
  30. Eurostat. Electricity Price Statistics. Available online: https://ec.europa.eu/eurostat/statistics-explained/index.php/Electricity_price_statistics#Electricity_prices_for_household_consumers (accessed on 9 January 2020).
  31. Google Earth. Available online: https://www.google.com/intl/es/earth/ (accessed on 23 September 2020).
  32. De La Flor, F.J.S.; Domínguez, S.Á.; Félix, J.L.M.; Falcón, R.G. Climatic zoning and its application to Spanish building energy performance regulations. Energy Build. 2008, 40, 1984–1990. [Google Scholar] [CrossRef]
  33. Lissén, J.M.S.; Álvarez, S.; Molina, J.; Ruiz, A.; De La Flor, F.J.S. Tightening the energy consumptions of buildings depending on their typology and on Climate Severity Indexes. Energy Build. 2013, 58, 372–377. [Google Scholar] [CrossRef]
  34. SINTEF. Available online: https://www.sintefbok.no/book/download/961/vinfopubutgivelsersintef_notat_notessnotat_08nettsintef_notat_8pdf (accessed on 15 May 2020).
  35. Skaar, C.; Elvebakk, K.; Skeie, K. Klimafotspor fra byggematerialer ved ambisiøs oppgradering av boligblokker. SINTEF Akad. Forl. 2017. [Google Scholar]
  36. Instituto Valenciano de la Edificación. Visualizador de Bases de Datos. Base de Precios del IVE 2018. 2018. Available online: https://www.five.es/productos/herramientas-on-line/visualizador-2018/ (accessed on 1 December 2019).
  37. Instituto Valenciano de la Edificación. Catálogo de Elementos Constructivos v 04.00. Online Tool. 2020. Available online: https://www.five.es/productos/herramientas-on-line/visualizador-2019/ (accessed on 1 December 2019).
  38. Ministerio de Fomento. Documento de Apoyo al Documento Básico DB-HE Ahorro de Energía. DA DB-HE/3 Puentes Térmicos. January 2014. Available online: https://www.codigotecnico.org/pdf/Documentos/HE/DA-DB-HE-3_Puentes_termicos.pdf (accessed on 16 June 2020).
  39. Manuel, S.L.J.; José, S.D.L.F.F.; Servando, Á.D.; Luis, M.F.J. Analysis and Repercussions of the Updating of the Spanish Regulation Regarding Ventilation and Infiltration. Int. J. Vent. 2004, 11, 407–416. [Google Scholar] [CrossRef]
  40. Ministerio de Fomento. Documento Basico HE. Ahorro de Energía. Sección HE0 Limitación del Consumo Energético. 20 December 2019. Available online: https://www.codigotecnico.org/pdf/Documentos/HE/DccHE.pdf (accessed on 7 July 2020).
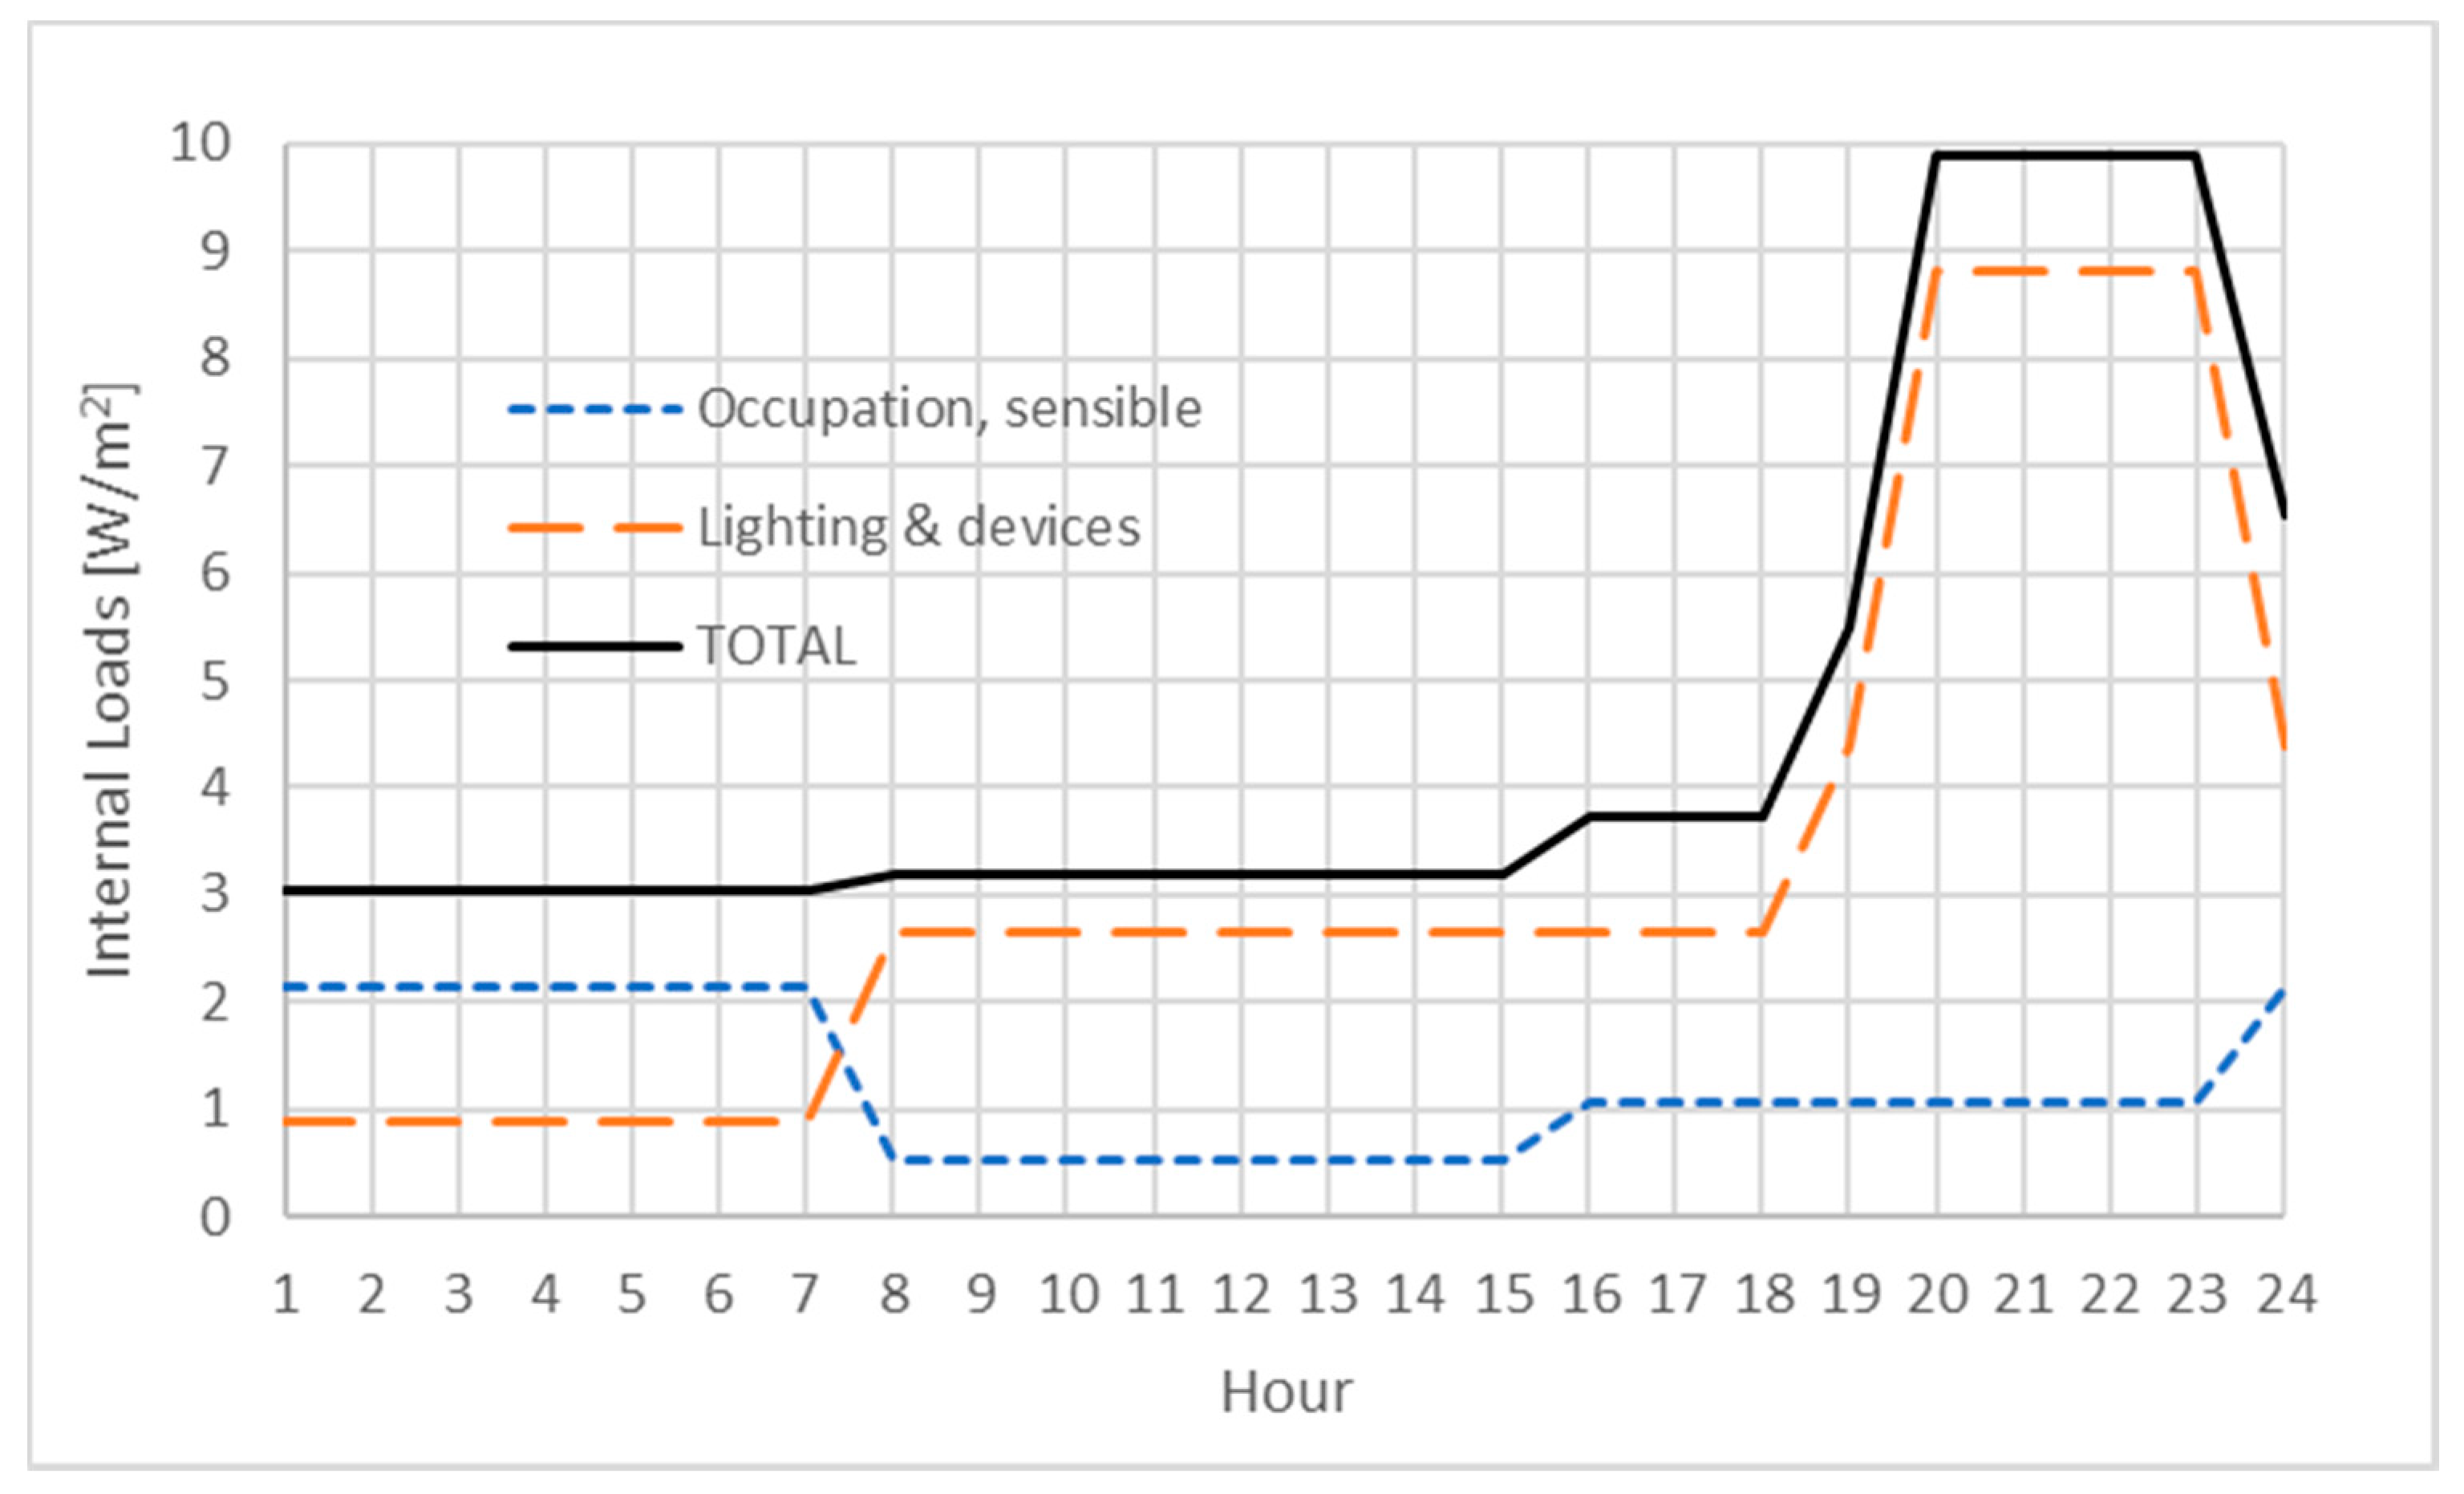
Figure 1. Internal loads level and their distribution at all hours of the day.
Applsci 11 01423 g001
Figure 2. Operation patterns of the conditioning systems and their set point temperatures.
Applsci 11 01423 g002
Figure 3. Panoramic view of the building—Main façade is oriented to the southwest according to urban plot. Source: [31].
Applsci 11 01423 g003
Figure 4. Main floor plan (left) and section (right) of the building in its current state.
Applsci 11 01423 g004
Figure 5. Energy modeling of one block of the building in its current state.
Applsci 11 01423 g005
Figure 6. Improvement of thermal bridges in façade 1. (Left): construction detail. (Right): calculated heat flux.
Applsci 11 01423 g006
Figure 7. Life cycle cost (LCC) vs. primary energy consumption for 2441 building renovation alternatives.
Applsci 11 01423 g007
Table 1. Current PE consumption of case study pilot building.
Energy UsePrimary Energy Consumption
(PET)
Kwh/m2y
Heating49.24
Cooling17
Domestic Hot Water (DHW)19.79
TOTAL86.03
Table 2. Proposed renovation measures for thermal bridges.
Thermal BridgesSystem & LocationLinear Thermal Transmittance ᴪe W/mKCost €/m
1/Existing building envelope composition (description on Section 3.1 of this paper)
2/Façade to slabs joints0.8406
3/Façade to slabs joints + openings contour0.7517
Table 3. Proposed renovation measures for the ventilation system.
VentilationSystemACHCost (€/dwelling)
1/Existing situation—Natural and thermal wind driven depending on window opening
2/Mechanical exhaust fan + self-regulated vents0.5564
3/Exhaust and inlet fans + heat recovery unit0.31364
Table 4. Proposed renovation measures for airtightness.
Air TightnessSystemInfiltration Rate
(h–1 @ 50 Pa)
Cost (€/linear m)
1/Existing building envelope composition (description on Section 3.1 of this paper)
2/Window contourn50 = 6.3
(see Appendix B)
60 € per linear meter of window perimeter
3/window contour+façade to slab jointn50 = 4.2
(see Appendix B)
60 € per linear meter of window perimeter and façades–slab joints
Table 5. Packages of Optimal Solutions (POSs).
PackageFaçadeRoofWindowDoorSlabThermal BridgeVentilationAirtightnessNight
Ventilation
DHW
17533331222
25277321212
34321321112
44351331222
53421331112
67651331222
75351332212
87243321222
97352321112
107431332112
115351321222
127743321222
Table 6. POS results.
No.Primary Energy Consumption
(kWh/m2·yr)
Primary Energy Consumption SavingsLCC 30 Years
(€/m2)
Final Energy Consumption
(kWh/m2·yr)
CO2 Emissions
(kg/m2·yr)
CO2 Emissions
Savings
Intervention Cost
(€/m2)
Savings/Year
(€/m2.yr)
Payback
(yr)
136.857.2%183.525.44.6356.2%42.64.639.19
236.857.2%197.924.74.7754.9%55.34.6911.78
337.057.0%191.225.64.6556.0%50.04.6110.84
437.057.0%193.725.04.7655.0%51.34.6711.00
537.356.6%190.325.94.7055.5%48.54.5810.59
637.756.2%184.425.14.9553.1%39.84.648.58
737.955.9%195.725.64.9353.4%51.34.5811.20
838.155.7%189.625.74.9653.1%44.94.579.82
938.355.5%192.025.65.0452.3%46.34.5810.12
1038.455.3%185.626.74.8853.8%41.74.489.31
1139.254.4%189.226.65.1251.6%42.64.469.55
1239.753.8%197.527.05.2050.8%49.94.4111.31
Table 7. Package of optimal solutions for the renovation project.
System/ElementRenovation MeasureThermal CharacteristicsInv. Cost
Facade7U = 0.31 W/m²·K53.72 €/m2
Roof5U = 0.54 W/m²·K71.6 €/m2
Windows3U = 2.8 W/m²·K; g = 0.49122.20 €/m2
Doors3U = 2.54 W/m²·K; g = 0.41
Slab3U = 0.76 W/m²·K29.65 €/m2
Thermal bridges3Improvement of windows contour and wall-slabs joints ψe = 0.751 W/mK7 €/l.m.
Ventilation11 ACH564 €/m2
Airtightness2n50 = 6.360 €/l.m.
Night ventilation210 ACH(night-time in summer)150 €/dwelling
DHW2Aerothermal67,314 €
Table 8. Pilot building before and after renovation primary energy (PE) consumption.
Energy UseBefore RenovationAfter Renovation
Primary Energy
(PET)
Kwh/m2y
Non-Renewable Primary Energy (PENR)
Kwh/m2y
Primary Energy
(PET)
Kwh/m2y
Non-Renewable Primary Energy (PENR)
Kwh/m2y
86.0386.0336.831.52
Heating49.2449.2413.7713.77
Cooling171712.4812.48
Domestic Hot Water (DHW)19.7919.7910.545.27
VentilationNatural thermal and wind driven + night ventilation system
Publisher’s Note: MDPI stays neutral with regard to jurisdictional claims in published maps and institutional affiliations.