Article

Development of a Safety Management System Tracking the Weight of Heavy Objects Carried by Construction Workers Using FSR Sensors

School of Architectural Engineering, Hongik University, Sejong 30016, Korea
*
Author to whom correspondence should be addressed.
Appl. Sci. 2021, 11(4), 1378; https://doi.org/10.3390/app11041378
Submission received: 6 December 2020 / Revised: 31 January 2021 / Accepted: 1 February 2021 / Published: 3 February 2021
(This article belongs to the Section Civil Engineering)

Abstract

:
It has been pointed out that the act of carrying a heavy object that exceeds a certain weight by a worker at a construction site is a major factor that puts physical burden on the worker’s musculoskeletal system. However, due to the nature of the construction site, where there are a large number of workers simultaneously working in an irregular space, it is difficult to figure out the weight of the object carried by the worker in real time or keep track of the worker who carries the excess weight. This paper proposes a prototype system to track the weight of heavy objects carried by construction workers by developing smart safety shoes with FSR (Force Sensitive Resistor) sensors. The system consists of smart safety shoes with sensors attached, a mobile device for collecting initial sensing data, and a web-based server computer for storing, preprocessing and analyzing such data. The effectiveness and accuracy of the weight tracking system was verified through the experiments where a weight was lifted by each experimenter from +0 kg to +20 kg in 5 kg increments. The results of the experiment were analyzed by a newly developed machine learning based model, which adopts effective classification algorithms such as decision tree, random forest, gradient boosting algorithm (GBM), and light GBM. The average accuracy classifying the weight by each classification algorithm showed similar, but high accuracy in the following order: random forest (90.9%), light GBM (90.5%), decision tree (90.3%), and GBM (89%). Overall, the proposed weight tracking system has a significant 90.2% average accuracy in classifying how much weight each experimenter carries.

1. Introduction

1.1. Research Background and Object

Musculoskeletal disorders are health disorders that occur due to factors such as improper posture, repetitive movements, or excessive use of force. It refers to diseases that appear in the nerve muscles of the arms, legs, neck, lower back and their surrounding body tissues [1,2,3]. According to Ode Hengel’s report, more than half of the workers in the construction industry are now exposed to musculoskeletal disorders, which leads to a reduction in the workers’ capacity and willingness to maximize productivity [4]. When the Korea Occupational Safety and Health Agency survey evaluated the exposure to risk factors in the construction industry, the results revealed that the work of handling heavy objects was the biggest risk factor. In particular, the process of lifting or transporting heavy objects accounted for 62.1% of the risk exposure [5].
In response, the Ministry of Employment and Labor in Korea issued a “notification on the scope of work burdened by the musculoskeletal system and the method of investigating harmful factors” to encourage efforts to find new methods of prevention. The standard to calculate the burden on the musculoskeletal system is determined by the number of times the worker lifts the heavy object and the weight of the heavy object [6]. However, given the nature of the construction industry being carried out on a job site by a large number of workers simultaneously, it is difficult and inefficient for a site manager to monitor each worker individually and check the weight or number of transports each of them carry [7].
In this study, in order to effectively solve these problems, we developed smart safety shoes with FSR (Force Sensitive Resistor) fiber sensors attached to the standard shoes always worn by construction site workers. The main purpose of this prototype system is to determine whether a construction worker lifts more than a specific weight. This is to induce construction workers not to carry more than the specified weight and ensure their safety. The suitability of this system was verified through experiments. The verification experiment was carried out on the assumption that the experimenters wearing a smart safety shoe with an FSR sensor and an Arduino Nano attached were carrying heavy objects that would sequentially increase in weight from +0 kg to +20 kg. The sensing information measured through the experiment was collected and stored through the developed system, and further analysis was performed for system verification. The first analysis of the sensing data was performed through scatter plots and a regression analysis to determine the propensity of the data, but due to a sensitive sensing data attribute, the weight estimate was relatively low, at an average accuracy of 46.4%. Accordingly, the secondary analysis was performed with an analysis model developed using valid machine learning (ML) classification algorithms, such as decision tree, random forest, GBM, and light GBM, programmed in Python, all of which were used to track the weight of the heavy objects carried by construction workers. The results show that the estimated weight of the heavy objects carried by construction workers have a relatively high average accuracy of 90.2%, verifying the suitability and applicability of the developed system.

1.2. Research Scope and Methodology

The scope of this study is to develop prototype smart sensing safety shoes with FSR sensors to effectively distinguish whether a construction site worker is carrying a heavy object that can burden the worker’s musculoskeletal system. In addition, a mobile app was developed to primarily store pressure strength data measured from a total of seven channels of fiber pressure sensors attached to the left and right insoles of the smart sensing safety shoes that then transmits them to a web-based DB (Database). Depending on how the worker lifts the object, pressure may not be applied evenly to both feet. Therefore, the sensing data values measured from the seven FSR sensors may not be completely uniform. However, the sum of the pressure transmitted to both feet can be seen as a direct reflection of the weight of the object. Therefore, in this study, rather than using each sensor value, we mainly use the sum of the sensor values to determine the weight of the heavy object. Finally, a machine-learning-based sensing data analysis model created by Python was developed to track how much weight a construction worker lifted while wearing the smart sensing safety shoes.
In order to verify the effectiveness of the smart sensing safety shoes (shoe size: 275–280 mm) developed in this study, an experiment was conducted on five healthy adult males between the ages of 25 to 36 under the assumption that construction site workers carry heavy objects. The experiment was carried out in such a way that collected pressure change data measured by the FSR sensors when a construction worker was standing without weight (body weight +0 kg) and when the worker was standing with additional weight (increased up to 20 kg in 5 kg increments (+)).
The collected data was analyzed to determine the correlation between the sensing data and the weight of the object held by the construction worker through the primary analysis of a scatter diagram (scatter plot) and linear regression. However, due to the nature of sensitive sensing data, it was found that the R2 value for explaining the degree of estimating the weight of a heavy object appears relatively low due to the distribution of the wide data value. In order to solve this problem, the second analysis of the experiment was carried out through the development of an analysis model applying ML (machine learning) classification algorithms. The results show that it is possible to obtain higher accuracy in estimating the weight of the package carried by the construction worker.

2. Materials and Methods

2.1. Trends and Limitations of Existing Musculoskeletal Burden Work Prevention Methods

Figuring out risk factors for musculoskeletal disorders of construction site workers, and doing research to prevent and improve conditions are being conducted in a wide variety of forms. Previously, methods to prevent major harmful factors of musculoskeletal disorders of construction workers were identified by statistical methods through direct observation, questionnaires, and expert interviews. The scope of musculoskeletal burden work was identified, and then the systematic method of investigating harmful factors was established and improved [1,5,6,8].
In recent years, with the rapid development of Internet of Things technology, the development and expansion of various types of smart sensors are being actively used in various fields such as smart healthcare and industrial sites [9]. In particular, the possibility of collecting, constructing, analyzing, and utilizing big data according to a given purpose through data collected from such smart sensors is gradually expanding [10]. For example, in order to recognize the awkward posture of construction workers that can affect the musculoskeletal disorders of construction workers in the short or long term, it has been suggested that a supervised motion sensor decomposition with a multi-classification algorithm can improve the shortcomings of the existing motion capturing system [11]. The focus of this study was to develop a method for quickly and accurately distinguishing specific postures of construction workers. In addition, a musculoskeletal burdened work measurement device using acceleration sensors (accelerometers) has been developed and presented to improve the working posture and work efficiency of construction workers [12]. The purpose of this study was also to analyze the motions that generate labor load on the wrists, elbows and shoulders of construction workers using accelerometer sensors. However, there are few attempts and efforts to monitor early on, by sensing the weight of a heavy object carried by a construction worker, which is one of the major causes of musculoskeletal disorders in construction workers. Payal (2017) proposed an electronic insole system using FSR sensors to monitor pressure wirelessly [13]. This system showed the possibility for measuring the foot pressure distribution to detect the abnormalities of patients. The experimental results in this study showed that the resistance values of the FSR sensor (kilo-ohm) decreased with the weight applied to the sensor. However, this experiment was not measured by a person wearing shoes with an FSR sensor insole. Instead, the experiment was performed through mechanical pressure on the FSR sensor using a dead weight pressure gauge on a laboratory table, which sets a practical limitation.

2.2. Classification Algorithms for Big Data Analysis Using ML

2.2.1. Decision Tree

Decision tree is an analysis method that performs classification and prediction by plotting decision rules in a tree structure. It has both characteristics of exploration and modeling. It breaks down the population of interest into smaller and smaller unitary subgroups by specific target variables [14]. This method has the advantage of being able to understand and explain the process more easily than neural networks or discriminant analysis methods, since the process of classification or prediction is expressed by the induction rules in the form of a tree structure [15].
Decision tree is a hierarchical model composed of decision rules that classify various variables into homogeneous regions, as well as an algorithm widely used for both classification and regression problems [16,17,18]. The decision tree model consists of nodes, and the separation step from the root node to the end is known as depth. The end node refers to a node in which each branch is not separated by splitting criterion, stopping rule, pruning, etc. In general, the analysis process of the decision tree model is performed through the processes of the decision tree formation, pruning, validity evaluation, analysis and prediction.
During pruning, the decision tree learns in the direction of minimizing impurity (or maximizing purity). The entropy, which is a numerical measure of impurity, is given by the following Equation (1). High entropy means high impurity, with a maximum value of 1. On the other hand, low entropy means low impurity where the minimum value becomes 0.
e = i = 0 n p i log p i
p ( c i ) : the probability/percentage of class i in a node; n: the number of classes.
When dividing the branches of a tree, the amount by which the entropy decreases is based on a feature of the data at a node, and can be known through the information gain as shown in Equation (2). The first-order classification is performed when the feature with the highest IG (Information Gain) value is placed at the top of the decision tree. Thereafter, classification is performed repeatedly for each classified subgroup until the entropy becomes 0.
I G ( S , F ) =   e ( S ) f F | S f | | S | e ( S f )
S: the whole set of events; F: feature, f: feature attribute; Sf: set of events with the f attribute; |X|: size of set X (number of elements); e(X): the entropy of the set of events named X.
The decision tree is advantageous in some ways because it is easy to visualize the trained model and it is not affected by the scale of the data. Thus, a pre-processing process is unnecessary. However, due to the tendency of over-fitting to the training data, the generalization performance is degraded [19]. Random forest is a model that compensates for the shortcomings of such decision trees, and it solves the over-fitting problem by creating a final model using multiple decision trees and the ability to predict missing values [20,21,22,23].

2.2.2. Random Forest

Random Forest is “a collection or ensemble of Classification and Regression Trees (CART) trained on datasets of the same size as a training set, also known as bootstrap, created from a random resampling on the training set itself [24].” The ensemble is a technique that creates a more powerful final prediction model by creating several prediction models using given data and then combining these prediction models into one. The ensemble technique, which ultimately aims to achieve better performance, is in the spotlight within the field of prediction [25]. The formula used in the case of classification analysis is as shown in Equation (3).
p ( c | v ) =   1 T t = 1 T p t ( c | v )
p ( c ) : probability mass function for each class; T: number of trees (the size of forest); v: vector (the points of data); c: set of full classes
There are a wide variety of ways to implement this ensemble method, but the most commonly encountered algorithms are bagging and boosting. Bagging recovers and extracts certain information from the data to create several sub data sets, applies a model to calculate each predicted value, and finally averages such values to create a final predicted value. Boosting updates the model while continuing to modify the original data. That is, after constructing the first model, the model is modified by updating the residual, not the dependent variable Y.
Random forest corresponds to an algorithm using the bagging method. Meanwhile, gradient boosting, light gradient boosting, AdaBoosting, etc., uses a boosting algorithm. In this study, some of these algorithms are selected and applied to yield results that can then be compared.

2.2.3. GBM (Gradient Boosting Algorithm)

Frideman (2001) proposed a method that uses a gradient descent algorithm as a boosting method to encompass classification and regression. In other words, for a given loss function and weak prediction model, a model that can minimize the loss function is found, and the resulting variable is initialized with an equation that can best predict the result. Thereafter, the slope or residual is calculated, and a model suitable for the residual that can minimize the loss function is constructed. The obtained model is added to the previous model, and this process is repeated. Like this, gradient boosting is a generalization of a boosting algorithm, and it is a method of learning a model focusing on errors [26].
Gradient boosting (GBM), a method proposed by Friedman (2001), is one of the ensemble techniques that improves the accuracy of classification by synthesizing the predictions of multiple classifiers compared to a decision tree that uses a single classifier. Boosting is an iterative procedure used to change the distribution of data so that the basic classifier focuses on hard-to-classify data. Among them, gradient boosting (GBM) forms a final classifier by repeating the process of giving a high weight for the incorrectly classified observation value, but a low weight for the correctly classified observation value to the next observation by starting with the same weight for the observed data [27]. It approximates the function f, which is as shown in Equation (4), based on a linear combination of weak learners h. It is optimized in a greedy manner by selecting parameter θ j and weight α j of a weak learner iteratively [28].
f ( x ) =   j = 1 M α j h j ( x ; θ j )
f   :   n   ; h   :   n   ; x   n : input vector; α j   : real-valued weight; M: the number of weak learners.
Gradient boosting is a widely used method, and it has excellent predictive power in binary data or continuous data. However, it has its own disadvantages, given that the parameters need to be adjusted well and the training time is long. In addition, due to the nature of the tree-based model, the predictive power tends to be poor in high-dimensional data retrieval [19].

2.2.4. LightGBM (Light Gradient Boosting Algorithm)

LightGBM is a decision tree-based model that uses a boosting method, and is an algorithm that uses both a method of reducing the number of training samples and a method of reducing the number of predictors to quickly and accurately learn large amounts of data. The GOSS (Gradient-based One-Side Sampling) technique is used to reduce the number of data, and the EFB (Exclusive Feature Bundling) technique is used to reduce the number of predictors for split point calculation [29].
Previous decision tree-based models used a method (level wise, depth first) in which nodes of the decision tree first traverse nodes close to the root node and grow horizontally. On the other hand, lightGBM uses a leaf segmentation method (leaf wise, best first) that divides and grows at the node with the greatest loss change, which quickly converges to the optimal performance and is mostly better. In addition, it is an algorithm that is widely used in the fields of big data and machine learning because it has the advantage of being able to quickly learn a large amount of data in parallel.

2.3. Configuration and Experiment of Weight Tracking System

2.3.1. Hardware/Software Configuration Diagram of Weight Tracking System by FSR Sensing

The system configuration diagram for tracking the weight of an object to be carried by a construction worker using smart safety shoes is shown in Figure 1. The developed system consists of smart safety shoes with sensors attached, a mobile device part for collecting sensing data, and a web-based server computer for storing, preprocessing and analyzing such sensing data.
The smart safety shoes consist of 7 pressure (FSR) sensors (manufacturer: Marveldex, model name: RA12P) on the left and right insoles, and Arduino Nano (manufacturer: SMG, model name: FT232RL) chips on each shoe. The Arduino Nano converts analog signals into digital signals through Analog-to-Digital Converter (its parameter is raw data which has only magnitude value) and transmits sensor values to mobile devices through Bluetooth (module, OEM, HC-06 (DIP) firmware v.3.0, SZH-EK105). The transmitted sensing data values are primarily stored through an APP developed on a mobile device (manufacturer: Samsung, model name: Galaxy S8) possessed by the construction worker. The stored data values of L1–L7 and R1–R7 are transmitted to and collected on the web-based DB along with the measured time through a wireless network or LTE network as shown in Figure 1. This transmitted data is used for analysis to estimate the weight of an object carried by construction workers.

2.3.2. Test Scenarios

Experiments to verify the effectiveness of the weight tracking system when a construction worker wearing smart sensing safety shoes transports heavy objects were carried out as shown in Table 1. First, the data measured by the FSR sensor were collected when the experimenters wearing the smart sensing safety shoes were pressurized by their own weight in the state that they are not holding any object (action status: (1) 1, +0 kg). The sensing data values measured at this time were used as reference data for classifying with the sensing data values measured by assuming that each experimenter carried the heavy object by increasing the weight by 5 kg each (action status: (2)–(5), +5 kg–+20 kg).
The basic information of the experimenters and the number of data sets for each experimenter collected through this experiment are as shown in Table 2. The sensing data values measured in this way were saved as CVS files, and then they were reorganized, using Pandas in the Python Library [30], into a database effective for classifying the weight of heavy objects carried by construction workers.

2.4. Analysis Methods Applied

To understand the analysis methods of the experimental results described in the next following Section 2.4.1 and Section 2.4.2, it is necessary to first understand the variables included in one data set mentioned in Table 2. The types of variables included in one data set and their definitions are described in Table 3 as follows:
The raw data values obtained from a total of 14 FSR sensors (L: ch1–7, R: ch1–7) attached to the left and right insoles of safety shoes have only magnitude values. The sum of the left raw data values is SumRawL, and the sum of the right raw data values is SumRawR. SumRaw is the sum of these two values. LSUM, RSUM, and ASUM are the data values converted into voltage values of SumRawL, SumrawR, and SumRaw, respectively, for the analysis.

2.4.1. Statistical Analysis

The first analysis of the experimental results was performed statistically by analyzing the scatter plots to visually check the distribution of FSR sensing data (ASUM) collected for the actual weight each experimenter is holding (load). Also, the R2 values of a univariate multiple linear regression was calculated to determine the correlation between the sensing data values (LSUM, RSUM, ASUM) and the differential weights. However, the correlation between the variables was found to be somewhat low because of the wide variation characteristics of sensitive sensing data values. Therefore, a machine-learning-based analysis method has been developed to increase the accuracy in classifying how much weight is carried by construction workers wearing smart safety shoes.

2.4.2. Machine Learning (ML) Analysis Using Classification Algorithms

To complement the statistical analysis results, which are insufficient in accuracy, the second analysis for the experiments was implemented by using a machine-learning-based analysis model developed by Python as shown in Figure 2. This analysis model adopts multiple classification analysis algorithms, which have been commonly used as of recent. It tested the accuracy of classification to distinguish how much weight each construction worker was lifting with the sum of the left and right FSR sensing values (LSUM, RSUM, ASUM) measured, when a construction worker wearing smart safety shoes was not holding a heavy object (body weight +0 kg) and holding a different heavy object (body weight +5kg–+20 kg).
The analysis model consists of two major processes. The first process provides the processes of pre-processing data so that raw data collected and transmitted from the FSR sensors are effective for ML analysis. The second process provides the processes of performing ML-based classification analysis. The data preprocessing process includes the processes of converting raw sensing values (magnitude) into the unit of voltage values, defining and labeling variables necessary for analysis, setting independent variables (LSUM, RSUM, ASUM) and dependent variables (load), and dividing the sensing data values into train set and test set by using scikit-learn [31].
The preprocessed data is subjected to a machine-learning-based classification analysis process by applying effective and useful classification analysis algorithms such as decision tree, random forest, GBM, and lightGBM. In the learning stage of this process, learning is performed through model selection and cross-validation by applying valid machine-learning algorithms. In the evaluation stage, the final model is selected, and finally, in the classification stage, the label is classified with new data, and the accuracy of the result is produced.
Through this process, the classifier accuracy of the ML analysis model adopting each classification algorithm is confirmed by comparing and analyzing the actual weight measurement data and the weight classification data of the analysis model. Basically, the weight classification accuracy reveals how accurately the analysis model fits each weight of the object carried by each experimenter.

3. Results

3.1. Scatter Plots and Linear Regression Analysis Results

Table 4 shows the sum of the measured FSR sensor values (ASUM) as a scatter plot where each experimenter (A–E) wearing smart safety shoes is not holding a heavy object (body weight+0kg) and when each is holding a different weight of heavy objects (body weight +5 kg, +10 kg, +15 kg, +20 kg). As shown in Table 4, when the weight of the heavy object increases for each experimenter, the sensor values tend to increase slightly, even though it cannot be said to appear clearly because of the wide distribution of sensing data values. The wide distribution of the sum of the sensor values (ASUM) measured by both smart safety shoes for each weight occurs due to the characteristics of sensing values having the potential to react sensitively, depending on the state of how the experimenter is wearing the smart safety shoes or the degree of grounding on the floor.
To analyze their correlation in more detail, a univariate multiple linear regression was performed as shown in Table 5. Herein, the independent variables were designated as the sum of sensing data values collected from both the left and right smart safety boots and the sum of all sensing data values (LSUM, RSUM, ASUM); the dependent variable was designated as the differential weights (body weight +0 kg, +5 kg, +10 kg, +15 kg, +20 kg). As a result, it was found that the R2 values for each experimenter were at the lowest level of 25%, the highest 69%, and the average level of 46%, indicating that the degree of explaining the correlation is somewhat low. The statistical analysis results imply that the accuracy is not very high in classifying how much weight is carried by construction workers wearing smart safety shoes.

3.2. Machine Learning (ML) Analysis Results Using Classification Algorithms

Figure 3 shows the accuracy of an ML-based classification analysis model developed by Python in this research. As described in Section 2.4.2, the accuracy means how accurately the classification model distinguishes the actual weight with FSR sensing data values when each experimenter wearing smart safety boots is not lifting weights (body weight itself) or additionally carrying weights of +5 kg, +10 kg, +15 kg, and +20 kg. In other words, the accuracy in this study refers to how well the model is able to classify different objects to its respective weight. For example, when the experimenter selects and holds one of 5, 10, 15, and 20 kg objects, the accuracy of the analysis model reflects the accuracy of matching the object to its weight.
As shown in Figure 3, the classification accuracy applying the four classification algorithms shows a generally similar trend. In the case of experimenters B and D, the accuracy of correctly classifying the weight of heavy objects is relatively higher than that of experimenters A, C, and E. The accuracy of experimenters B and D’s weight estimation is at least 94.0% and at most 95.2%. On the other hand, experimenters A, C, and E show analysis results of at least 83.7% and at most 90.0%. This refers to the level of accuracy that can be monitored through the developed model when the construction workers lift the weight above the guidelines of Ministry of Employment and Labor in Korea. Specifically, the accuracy of the model applying the random forest algorithm is slightly higher than that of applying other classification algorithms.

4. Discussion

4.1. Discussion on the Experimental Results

The results of the first analysis for the experiments using univariate multiple linear regression found that the correlation between the differential measured weights (experimenter’s weight + heavy object weight: 5–20kg) and the corresponding sensing values (only ASUM data were used) were insufficient because the degree to which the independent variable explains the dependent variable is somewhat low. As shown in Table 4, the R2 values of experimenter E and experimenter C were relatively low at 24.5% and 29.3%, respectively, and the R2 value of experimenter A was 42.2%, which almost approaches the total average of 46.4%. On the other hand, the R2 values of experimenter D and experimenter B were relatively higher at 69.3% and 66.9%, respectively. As shown in the scatter plots in Table 3, the reason why the regression results are not so clearly explained is due to the wide and overlapping distribution of sensor ASUM values measured for each weight. This can be said to be a result of various factors, such as the behavioral characteristics of each experimenter, their posture, shoe size, as well as the grounding status of the sensor-attached insole, all of which affect sensitive sensor values. Therefore, an effective analysis method is required to monitor the actual weight lifted by construction workers using the FSR sensing data. First, we tested the analysis method adopting logistic and linear regression classification algorithms that are conventionally used. The test results are shown in Table 6. The accuracy of classifying weight by logistic regression analysis (77.1%) was found to be somewhat higher than that of weight classification by linear regression analysis (46.5%). However, it was confirmed that the accuracy of the analysis using these two classification algorithms was not satisfactory enough to distinguish the actual weight of the object carried by the experimenter after analyzing the FSR sensing data values.
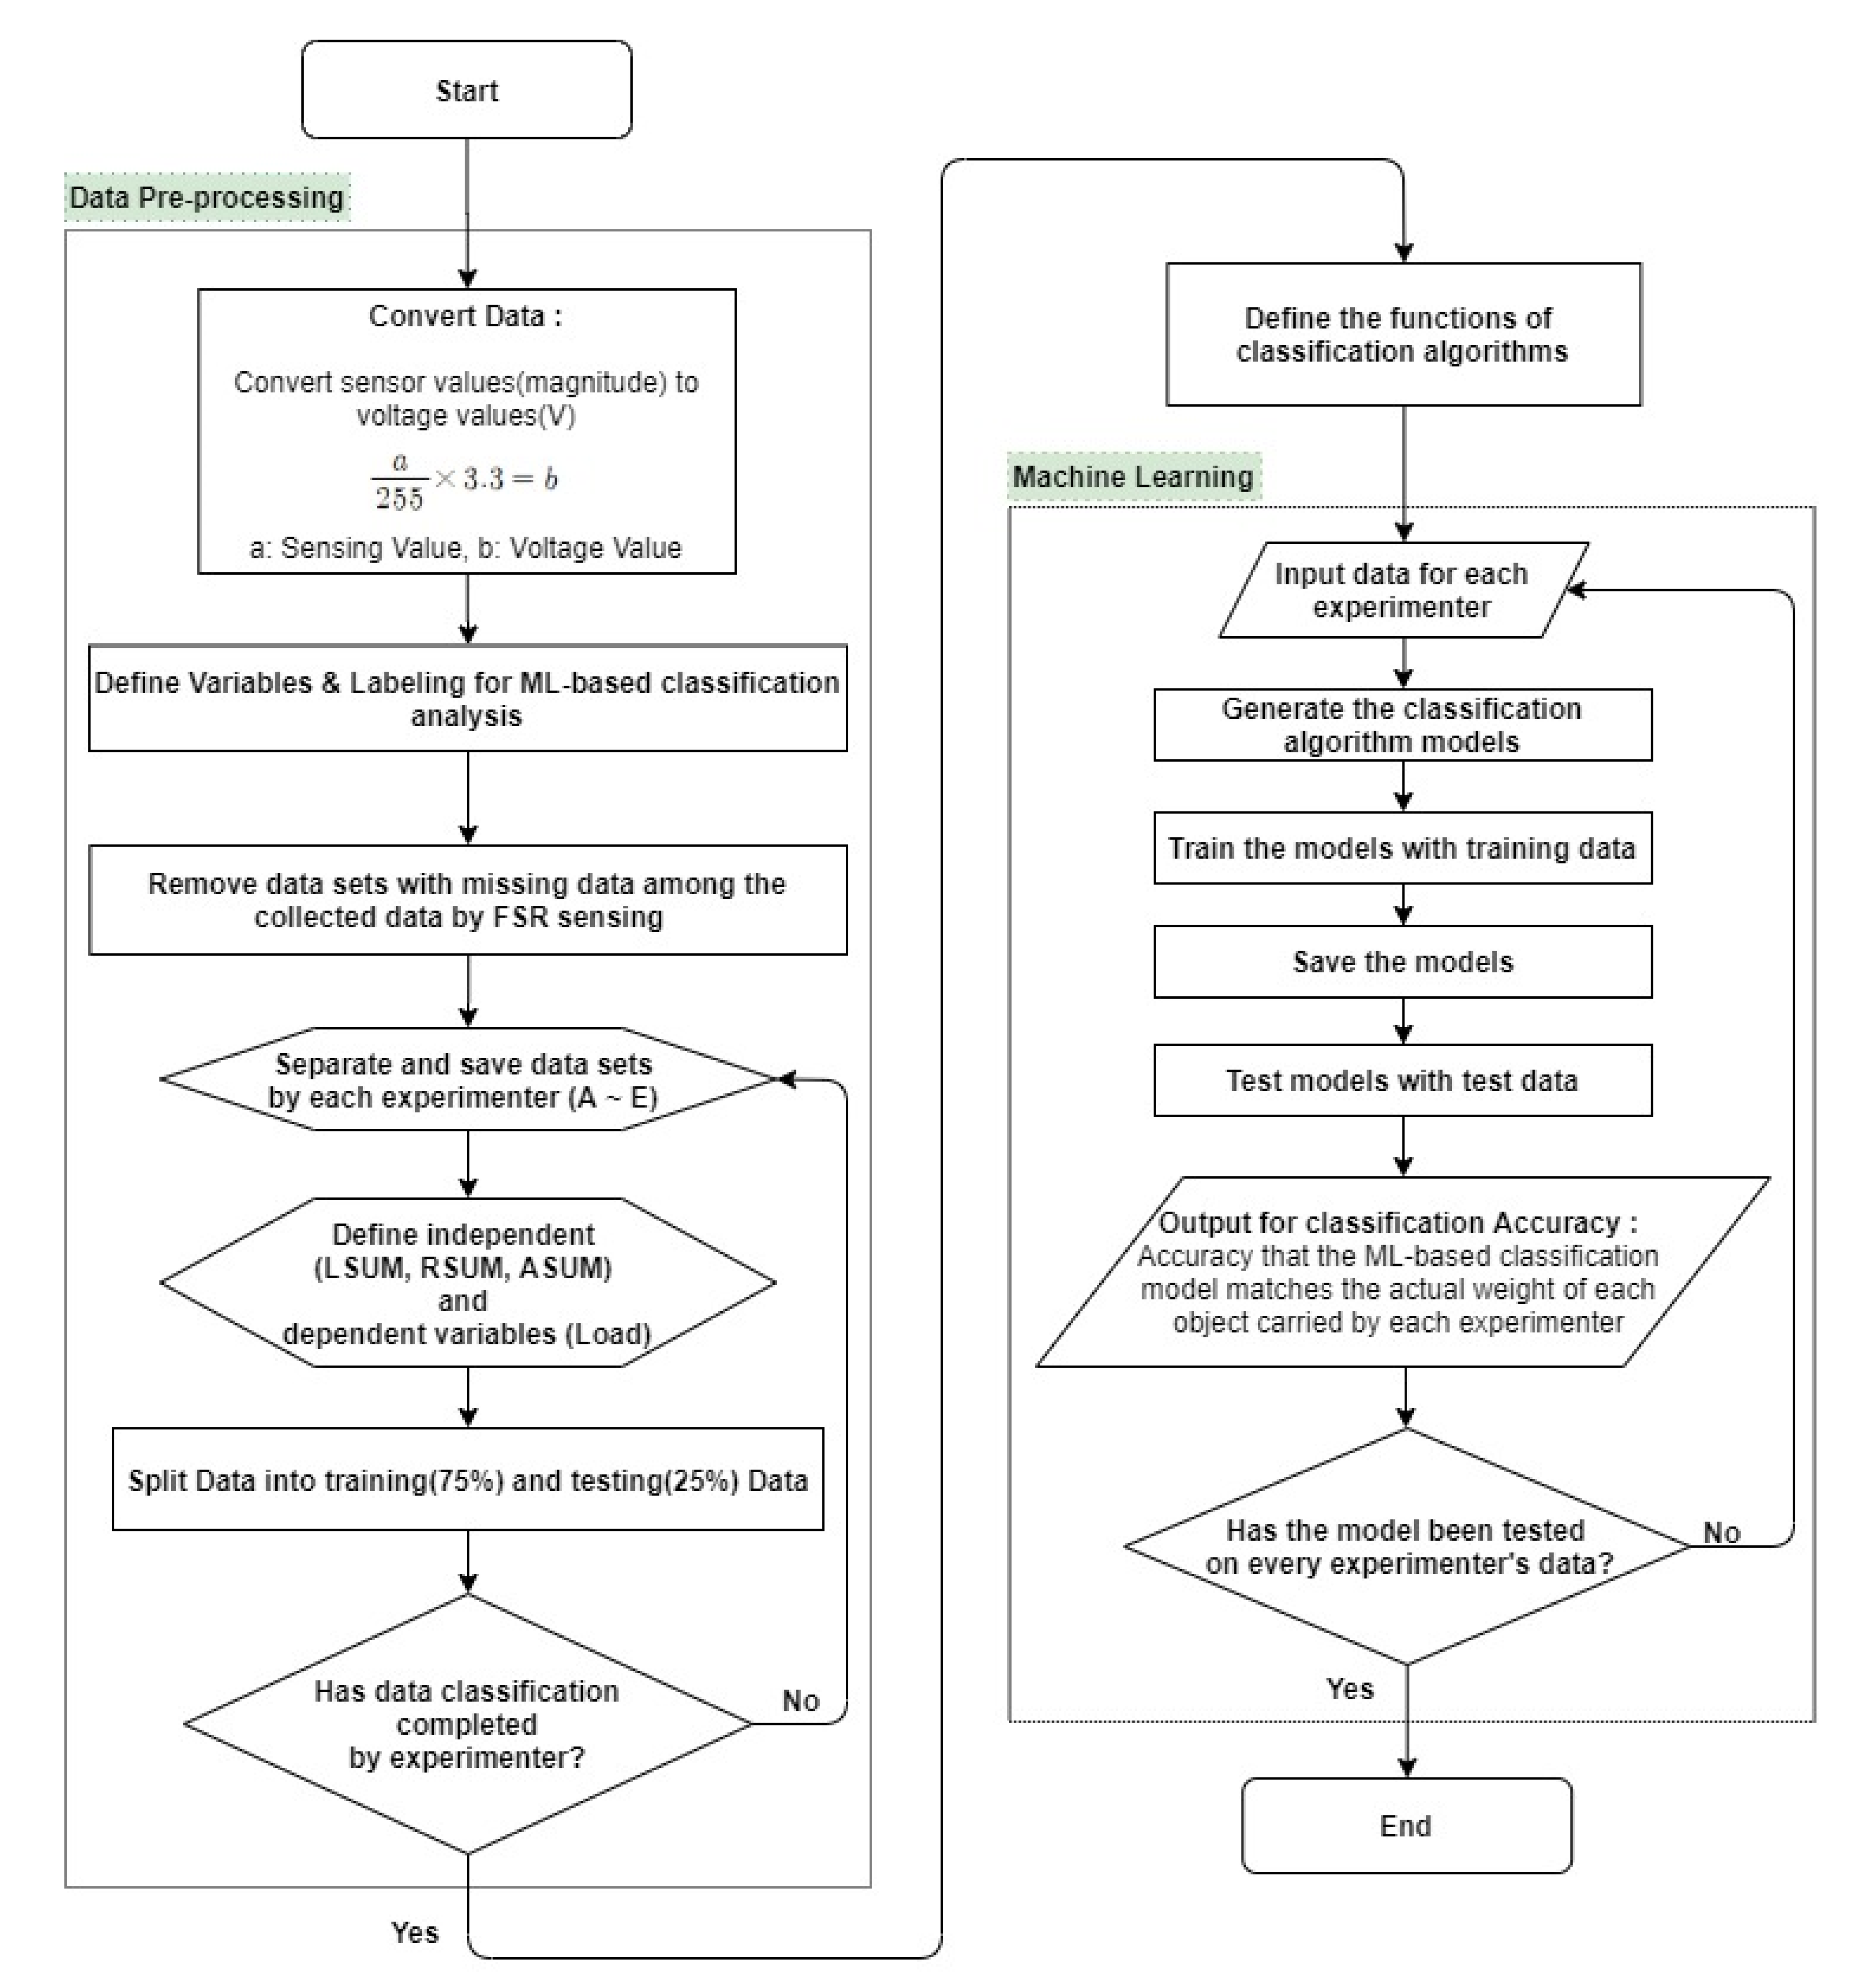
Therefore, this research study has developed a ML-based classification analysis model using Python. This model has been tested and developed by adopting the widely used classification algorithms, which includes decision tree, random forest, GBM, and light GBM. The accuracy of the test results using the ML-based analysis model is as shown in 
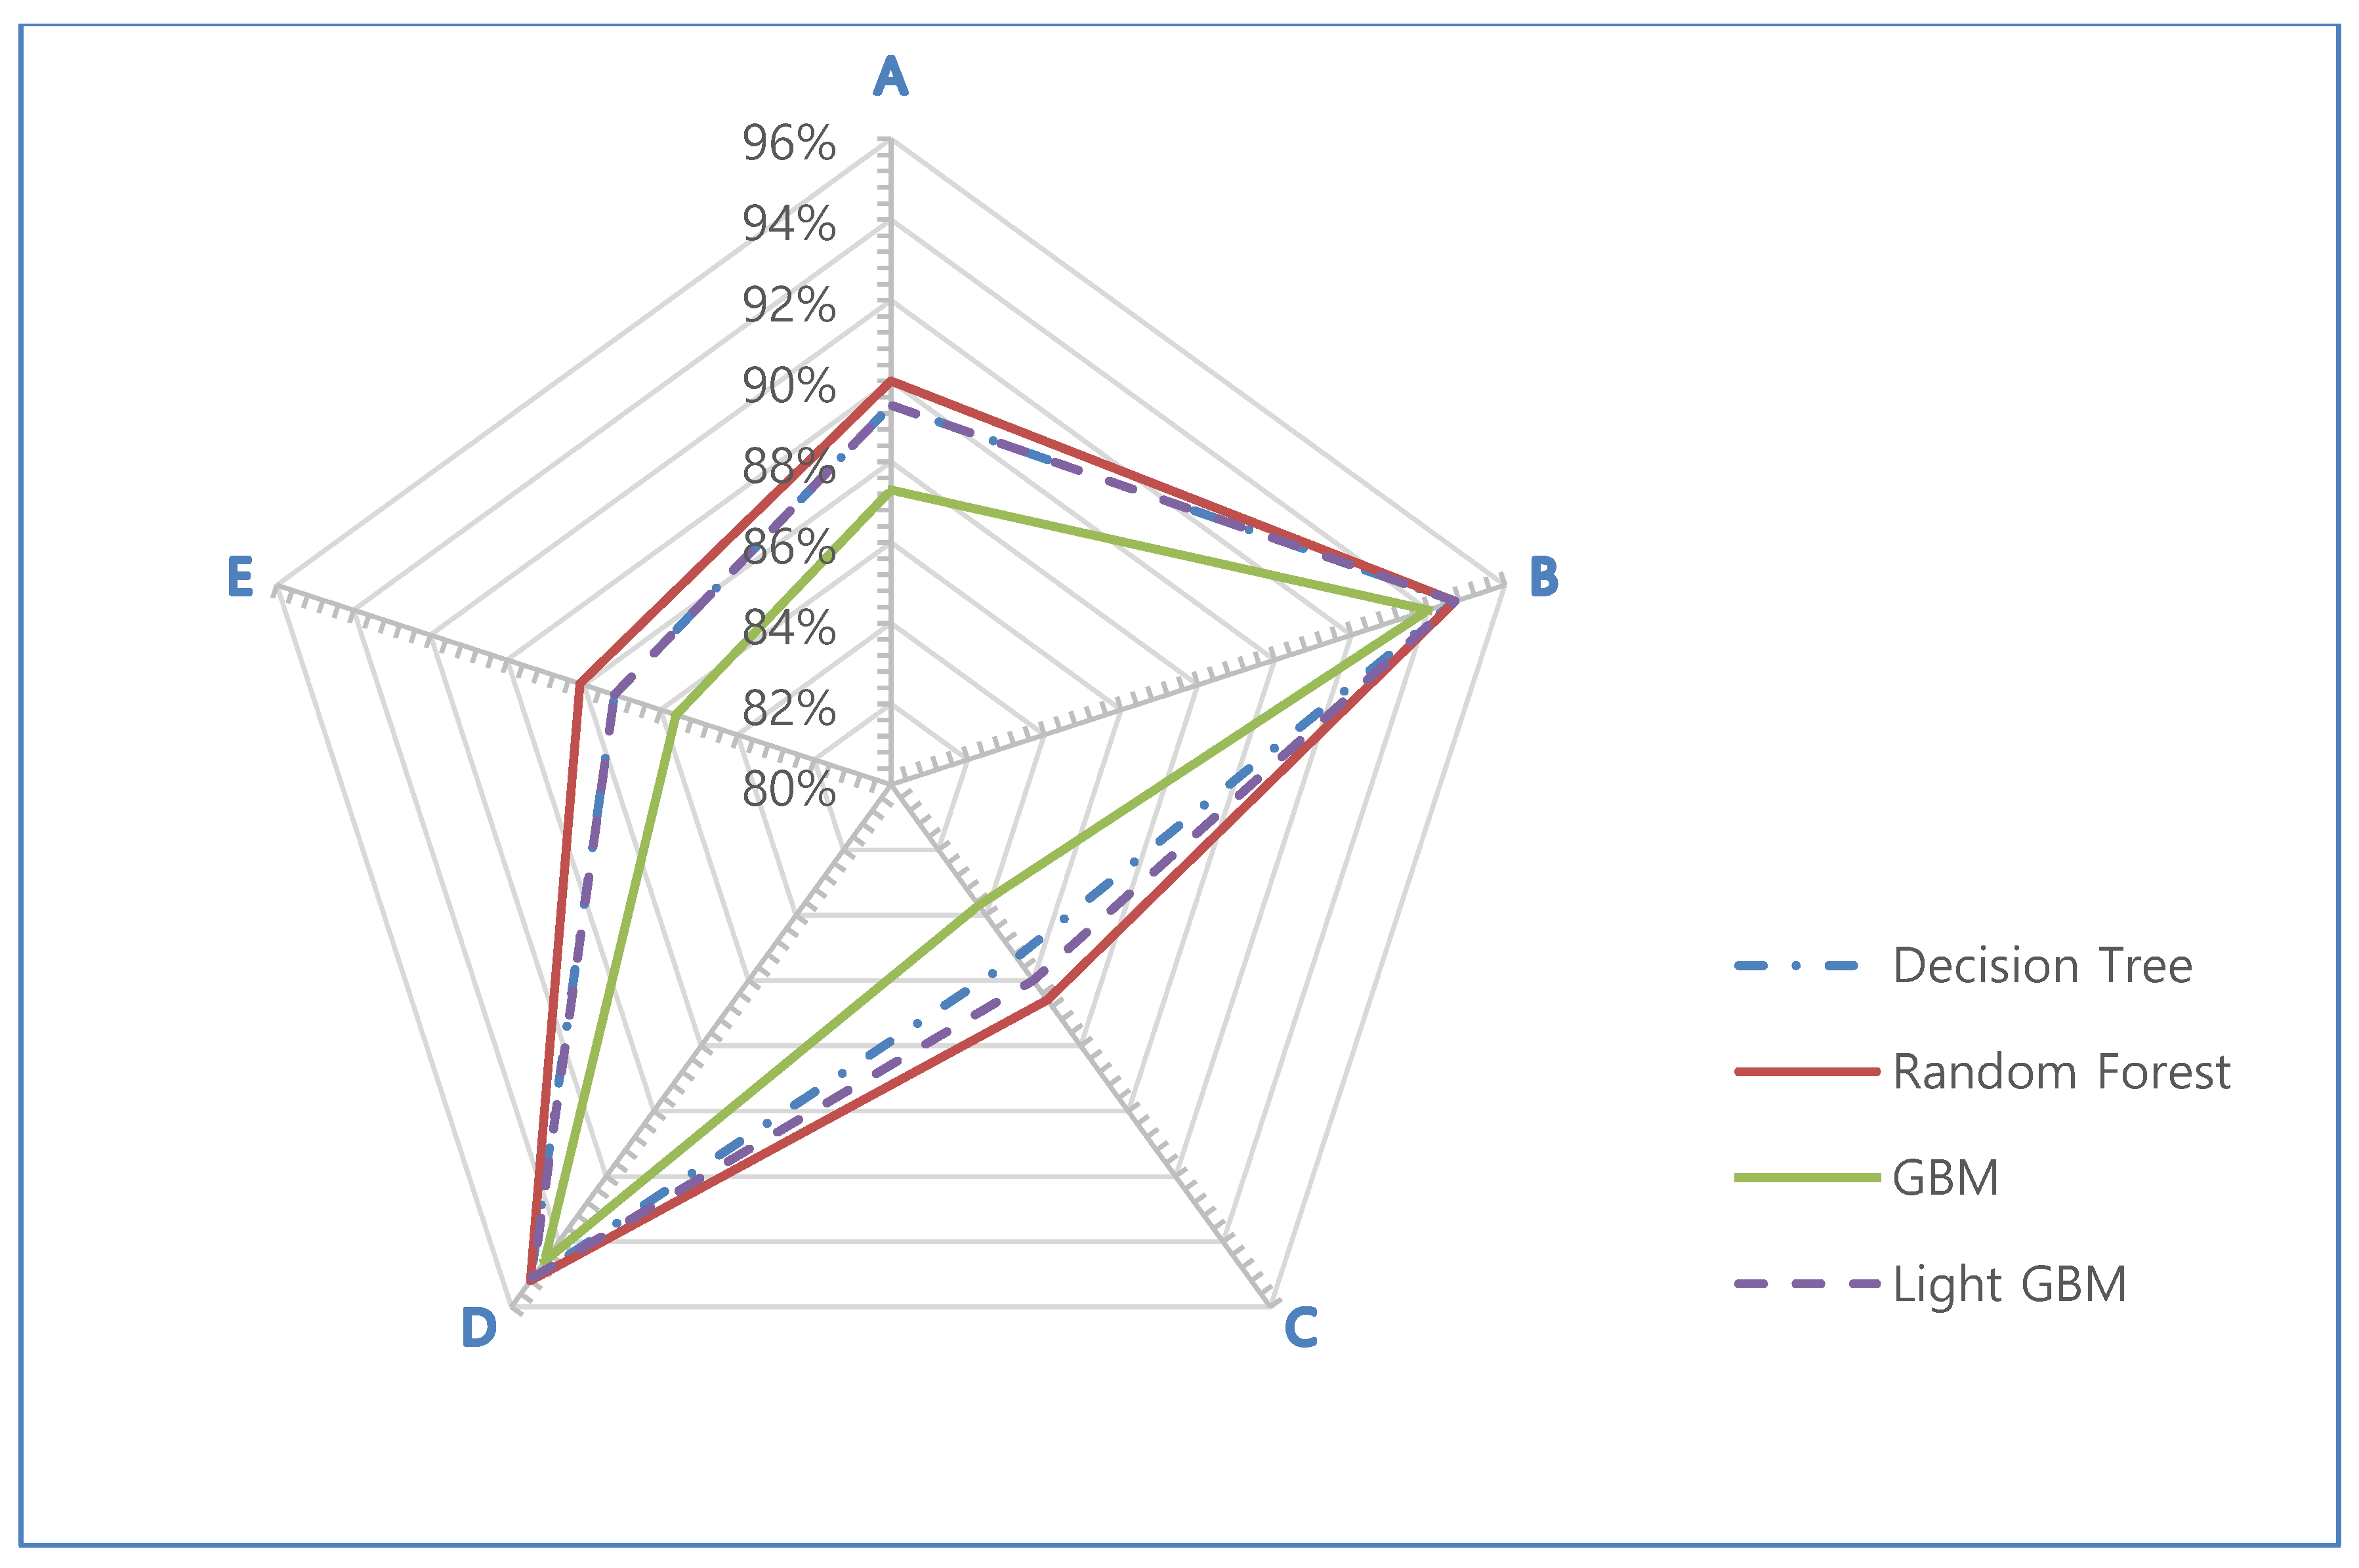
Table 7. In the case of experimenter C, who showed relatively low accuracy in weight estimation compared to the other experimenters, the average accuracy of estimation of applying the four classification algorithms was about 85.4%, and the average accuracy of experimenters B and D, which showed relatively high estimation accuracy, was 94.5% and 95.0%, respectively. In the case of experimenters A and E, who both showed medium accuracy, they had an average estimation accuracy of 89.0% and 87.0%, respectively. Therefore, the weight estimation accuracy according to all experimenters was confirmed to have an average of 90.2%, which corresponds to a relatively high and meaningful level of accuracy.
In addition, when looking at the classification accuracy of the weight lifted by each experimenter by each classification algorithm, the accuracy of the GBM classification algorithm for experimenter C is the lowest at 83.7%. On the other hand, it is found that the accuracy by decision tree and random forest for experimenter D is the highest at 95.2%. The average accuracy classifying the weight by each classification algorithm showed similar, but high accuracy in the following order as an experimental result: random forest (90.9%), light GBM (90.5%), decision tree (90.3%), and GBM (89%). This means that the developed ML-based analysis model can classify the actual weight of the object held by the experimenter with an average accuracy of 90% or more.
As described in 
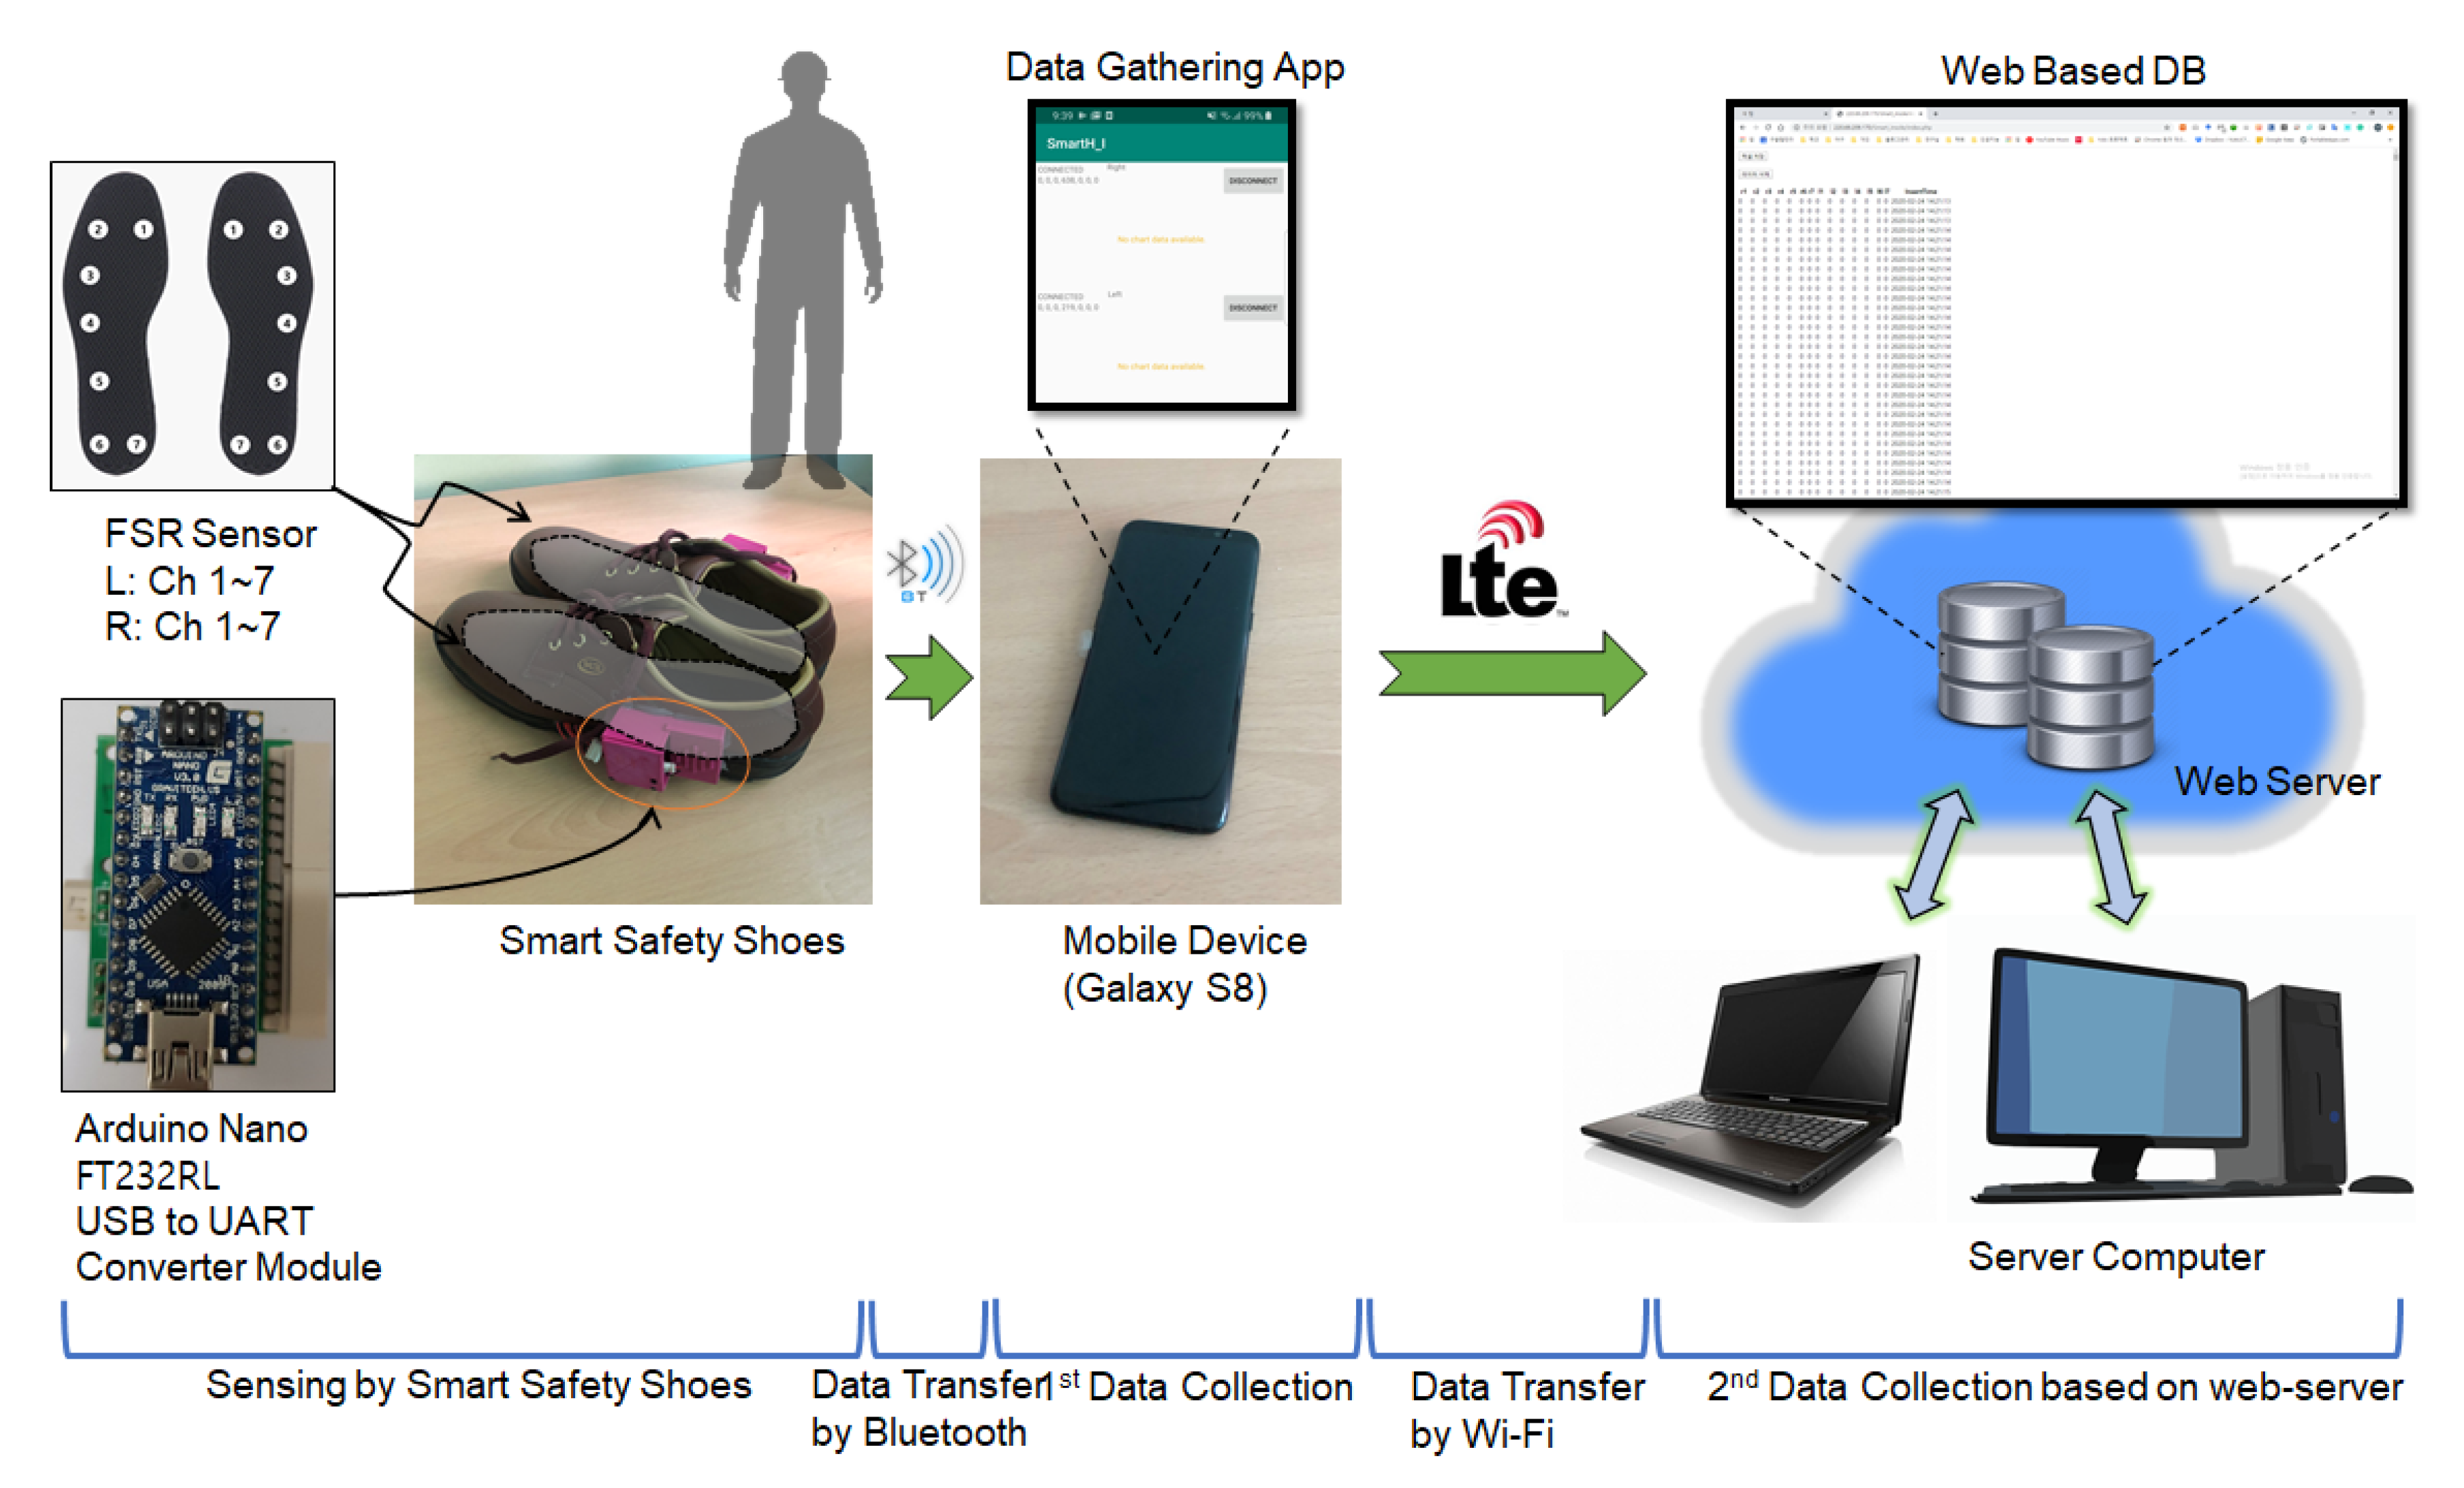
Section 2.3.2, this table shows the results of analysis with the sum of sensor values (LSUM, RSUM, ASUM) among the FSR sensing data measured when the experimenter is standing with a heavy object. This is the result of the experiments considering that it is common for construction workers to lift heavy objects with one or both hands while standing with their feet on the floor for a while. Of course, in some cases, pressure may not be applied evenly to both feet. Therefore, the data values measured from the left and right FSR sensors attached to both insoles may not be uniform. However, the sum of the pressure delivered to both feet can be said to be a result of direct reflection of the weight of the heavy object. Therefore, it is more reasonable to use the sum of pressure sensor values (LSUM, RSUM, or ASUM) obtained from the FSR sensors attached to both insoles to distinguish the weight the experimenter is holding.
However, it is effective to use the 14 channels of FSR sensing data values obtained from safety shoes in order to distinguish a moment when a construction worker lifts or unloads a heavy object from other moving actions. Table 8 shows the results of classification analysis with four ML-based classification algorithms for distinguishing between the experimenter’s standing and moving act. In this analysis, all data obtained by the 14 channels of FSR sensors were utilized, since the purpose of the analysis is to classify the movement act of an experimenter from the standing act while lifting a heavy object. As shown in Table 8, it is found that random forest has the highest accuracy, at 99%, among ML-based classification algorithms for distinguishing when an experimenter is moving and when the experimenter is standing still. It can be seen that the remaining classification algorithms also show high accuracy of over 97% on average. The result shows that it is not a problem for the algorithm to distinguish when a construction worker is lifting a heavy object.

4.2. Research Limitations and Further Studies

The result of this study shows only a prototype system that tracks the weight of heavy objects carried by construction workers using safety shoes with FSR sensors. The main scope of this study focuses mainly on determining whether construction workers lift heavy objects above the safety guidelines. In order to practically apply this system to construction sites, several limiting factors of this study should be improved through future studies from at least the following points of view. First, further research is needed on the durability of the sensor, the durability of the battery, and the convenience of wearing safety shoes under various construction work environments in order to practically use the safety shoes with FSR sensor. Second, continuous research efforts are needed to improve the accuracy of the weight tracking system. For this, experiments and analyzes need to be conducted under more diverse conditions, such as the different physical conditions of the construction workers, the grounding condition of the shoes, the use of other types of sensors, etc. Third, the experiment scenario adopted in this research was limited to 20 kg because the physical safety of the experimenter was considered. However, it may be necessary to keep analyzing the impact of various weights over 20 kg to see what those results can add to the study. Recently, the introduction of IT/ICT application technology has been newly attempted at construction sites, but the reality is that it is still insufficient. Therefore, this research result is expected to be one of the efforts to overcome this.

5. Conclusions

In this study, we developed smart safety shoes with a conductive fiber sensor (FSR sensor) that can track pressure strength. It has been verified through several experiments whether it is possible to track the weight of a heavy object in order to prevent excess burden on the musculoskeletal system when a construction worker lifts a heavy object on a construction job site. To this end, we developed a prototype weight tracking system consisting of smart safety shoes with FSR sensors, a mobile application for primary data collection, and a ML-based classification model based on a server computer for data storage and analysis.
To verify this prototype weight tracking system developed in this study, five experimenters with different weights wearing smart safety shoes conducted an experiment in which a weight was lifted from +0 kg to +20 kg in 5 kg increments. Through this, analysis and verification were performed to verify how accurately the system classifies the weight carried by each experimenter. It was found that the average weight estimation accuracy for each classification algorithm showed similar results: random forest (90.9%), light GBM (90.5%), decision tree (90.3%), and GBM (89%). Altogether, the weight tracking system showed a meaningful level of 90.2% of the overall average accuracy in determining how much weight each experimenter carries.
This means that when a construction worker lifts a heavy object at a construction site, its weight can be tracked with a fairly high accuracy in real time without direct supervision. Therefore, the results of this study are expected to be utilized as a basic study for the development of a system to prevent and manage the degree of impact on the body musculoskeletal burden work that can occur in the process of carrying out transport work by construction workers at the construction job site.

Author Contributions

Conceptualization, S.H.L., J.S.; Data curation, J.S.; Methodology, S.H.L., J.S.; Validation, J.S.; Writing—original draft, S.H.L.; Writing—review & editing, J.S. All authors have read and agreed to the published version of the manuscript.

Funding

This research was supported by Basic Science Research Program through the National Research Foundation of Korea (NRF) funded by the Ministry of Education (NO.2017R1A2B1011776).

Conflicts of Interest

The authors declare no conflict of interest.

References

  1. Boschman, J.S.; van der Molen, H.F.; Sluiter, J.K.; Frings-Dresen, M.H. Occupational; demands and health effects for bricklayers and construction supervisors: A systematic review. Am. J. Ind. Med. 2011, 54, 55–57. [Google Scholar] [CrossRef] [PubMed]
  2. Holmstrom, E.; Engholm, G. Musculoskeletal disorders in relation to age and occupation in Swedish construction workers. Am. J. Ind. Med. 2003, 44, 771–778. [Google Scholar] [CrossRef] [PubMed]
  3. Kim, K.T.; Kim, C.H. Development of a method to measure musculoskeletal load for construction workers. J. Koreans Inst. Build. Constr. 2011, 11, 73–75. [Google Scholar]
  4. Oude Hengel, K.M.; Blatter, B.M.; Geuskens, G.A.; Koppes, L.L.; Bongers, P.M. Factors associated with a abillity and willingness to continue working until the age of 65 in construction workers. Int. Arch. Occup. Environ. Health 2011, 85, 783–790. [Google Scholar] [CrossRef] [PubMed]
  5. Korea Occupational Safety and Health Agency. Characteristics of Musculoskeletal Diseases and Risk Factors Exposure to Construction Workers; Korea Ministry of Employment and Labor: Seoul, Korea, 2009.
  6. Ministry of Labor. Announcement on the Scope of Musculoskeletal Burden Work and Methods of Investigation of Harmful Factors (Effective Date: 2020. 1. 16.); Ministry of Labor Notice No. 2020-12 (Partial Revision); Ministry of Labor: Sejong, Korea, 2020.
  7. Kim, S.H.; Lee, S.H. Classifying Workers Behavior Based upon 3-Axis Accelerometer Sensor for Measuring Working Time. In Proceedings of the KICEM Annual Conference, Seoul, Korea, 9–10 November 2018; Volume 17, pp. 31–32. [Google Scholar]
  8. Julitta, S.B.; Henk, F.M.; Judith, K.S.; Monique, H.F. Musculoskeletal disorders among construction workers: A one-year follow-up study. BMC Musculoskelet. Dis. 2012, 13, 1–9. [Google Scholar] [CrossRef] [Green Version]
  9. Milon, I.; Ashikur, R.; Rashedul, I. Development of Smart Healthcare Monitoring System in IoT Environment. SN Comput. Sci. 2020, 1, 1–11. [Google Scholar] [CrossRef]
  10. Plageras, A.P.; Psannis, K.E.; Stergiou, C.; Wang, H.; Gupta, B.B. Efficient IoT-based sensor BIG Data collection–processing and analysis in smart buildings. Future Gener. Comput. Syst. 2018, 82, 349–357. [Google Scholar] [CrossRef]
  11. Jiayu, C.; Jun, Q.; Changbum, A. Construction worker’s awkward posture recognition through supervised motion tensor decomposition. Autom. Constr. 2017, 77, 67–81. [Google Scholar]
  12. Kim, K.T. Development of an Apparatus to Measure Musculoskeletal Load for Construction Workers Using Accelerometers. J. Archit. Inst. Korea 2012, 28, 167–174. [Google Scholar]
  13. Payal, S.M.; Atul, K.J.; Swati, P.M. IoT based monitoring of foot pressure using FSR sensor. In Proceedings of the International Conference on Communication and Signal Processing (ICCSP), Chennai, India, 6–8 April 2017. [Google Scholar] [CrossRef]
  14. Cho, Y.R.; Kim, Y.C.; Shin, Y.S. Prediction Model of Construction Safety Accidents using Decision Tree Technique. JKIBC 2017, 17, 295–303. [Google Scholar]
  15. Song, Y.S.; Cho, Y.C.; Seo, Y.S.; Ahn, S.R. Development and its application of computer program for slope hazards prediction using decision tree model. J. Korean Soc. Civ. Eng. 2009, 29, 59–69. [Google Scholar]
  16. Myles, A.J.; Feudale, R.N.; Liu, Y.; Woody, N.A.; Brown, S.D. An instruction to decision tree modeling. J. Chemom. 2004, 18, 275–285. [Google Scholar] [CrossRef]
  17. Wu, X.; Kumar, V.; Quinlan, J.R.; Ghosh, J.; Yang, Q.; Motoda, H.; MacLachlan, G.J.; Ng, A.; Liu, B.; Yu, P.S.; et al. Top 10 algorithms in datamining. Knowl. Inf. Syst. 2008, 14, 1–37. [Google Scholar] [CrossRef] [Green Version]
  18. Cho, J.H.; Krurup, P.U. Decision tree approach for classification and dimensionality reduction of electronic nose data. Sens. Actuators Chem. 2011, 160, 542–548. [Google Scholar] [CrossRef]
  19. Muller, A.; Guido, S. Introduction to Machine Learning with Python: A Guide for Data Scientists; O’Reilly Media Inc.: Sebastopol, CA, USA, 2016. [Google Scholar]
  20. Dudoit, S.; Fridlyand, J.; Speed, T.P. Comparison of discrimination methods for the classification of tumors using gene expression data. J. Am. Stat. Assoc. 2002, 97, 77–87. [Google Scholar] [CrossRef] [Green Version]
  21. Hamza, M.; Larocque, D. An empirical comparison of ensemble methods based on classification trees. J. Stat. Comput. Simul. 2005, 75, 629–643. [Google Scholar] [CrossRef]
  22. Watts, J.D.; Lawrence, R.L.; Miller, P.R.; Montagne, C. Monitoring of cropland practices for carbon sequestration purposes in north central Montana by Landsat remote sensing. Remote Sens. Environ. 2009, 113, 843–1852. [Google Scholar] [CrossRef]
  23. Na, X.; Zhang, S.; Li, X.; Yu, H.; Liu, C. Improved land cover mapping using random forests combined with landsat thematic mapper imagery and ancillary geographic data. Photogramm. Eng. Remote Sens. 2010, 76, 833–840. [Google Scholar] [CrossRef]
  24. Alessia, S.; Antonio, C.; Aldo, Q. Random Forest Algorithm for the Classification of Neuroimaging Data in Alzheimer’s Disease: A Systematic Review. Front. Aging Neurosci. 2017, 9, 329. [Google Scholar]
  25. Schapire, R.E. Theoretical Views of Boosting. In Proceedings of the Symposium Held at the 4th European Conference, EuroCOLT on Computational Learning Theory, Nordkirchen, Germany, 29–31 March 1999; pp. 1–10. [Google Scholar]
  26. Friedman, J.H. Greedy function approximation: A gradient boosting machine. Ann. Stat. 2001, 29, 1189–1232. [Google Scholar] [CrossRef]
  27. Jung, J.H.; Min, D.K. The study of foreign exchange trading revenue model using decision tree and gradient boosting. Korean Data Inf. Sci. Soc. 2013, 24, 161–170. [Google Scholar]
  28. Son, J.; Jung, I.; Park, K.; Han, B. Tracking—By—Segmentation with Online Gradient Boosting Decision Tree. In Proceedings of the IEEE International Conference on Computer Vision (ICCV), Santiago, Chile, 7–13 December 2015; pp. 3056–3064. [Google Scholar]
  29. Guolin, K.; Qi, M.; Thomas, F.; Taifeng, W.; Wei, C.; Weidong, M.; Qiwei, Y.; Tie-yan, L. Lightgbm: A highly efficient gradient boosting decision tree. In Proceedings of the Advances in Neural Information Processing System 30, Long Beach, CA, USA, 4–9 December 2017; pp. 3149–3157. [Google Scholar]
  30. McKinney, W. Ver. 0.25.3. Available online: https://github.com/pandas-dev/pandas (accessed on 28 December 2020).
  31. Cournapeau, D. Ver. 0.21.0. Available online: https://github.com/scikit-learn/scikit-learn (accessed on 28 December 2020).
Figure 1. The Configuration diagram of smart safety boots system.
Applsci 11 01378 g001
Figure 2. An analysis model using Machine Learning (ML). LSUM: Conversion value of SumRawL to voltage; RSUM: conversion value of SumRawR to voltage; ASUM: sum of LSUM and RSUM.
Applsci 11 01378 g002
Figure 3. The accuracy of ML-analysis model developed for distinguishing the actual weights by classification algorithms.
Applsci 11 01378 g003
Table 1. Heavy object transport experiment for weight estimation.
Test ScenariosClass
Applsci 11 01378 i001 Applsci 11 01378 i002 Applsci 11 01378 i003 Applsci 11 01378 i004 Applsci 11 01378 i005
Action Status(1) Standing without load(2) Standing with load(3) Standing with load(4) Standing with load(5) Standing with load
WeightBody Weight +0 kgBody Weight +5 kgBody Weight +10 kgBody Weight +15 kgBody Weight +20 kg
Table 2. The basic information of experimenter and the number of collected data sets.
ExperimenterBody WeightNumber of Data Sets
A67 kg97,589
B70 kg96,873
C70 kg99,090
D78 kg99,083
E83 kg99,033
Total491,668
Table 3. Definition of variables included in one data set.
VariableDefinitionUnit of Measure
L1–L7Raw data measured from FSR sensors attached to the left insole (L: Channel 1–7) Magnitude
R1–R7Raw data measured from FSR sensors attached to the right insole (R: Channel 1–7)Magnitude
SumRawLThe total value from L1 to L7 Magnitude
SumRawRThe total value from R1 to R7Magnitude
SumRawSum of SumRawL and SumRawRMagnitude
LSUMConversion value of SumRawL to voltageVoltage
RSUMConversion value of SumRawR to voltageVoltage
ASUMSum of LSUM and RSUMVoltage
LoadThe actual weight of the object each experimenter is holdingKg
Table 4. Scatter diagrams between the ASUM and Load by each experimenter.
A-DataB-DataC-Data
Applsci 11 01378 i006 Applsci 11 01378 i007 Applsci 11 01378 i008
D-DataE-Data
Applsci 11 01378 i009 Applsci 11 01378 i010
Table 6. The average of weight classification accuracy by using logistic and linear regression classifiers.
Classification AlgorithmsABCDEAverage
Logistic Regression65.0%89.3%68.0%91.1%72.0%77.1%
Linear Regression42.4%66.6%29.1%69.4%24.9%46.5%
Table 7. The average of weight classification accuracy of the developed ML-based analysis model.
Classification AlgorithmsABCDEAverage
Decision Tree89.4%94.7%85.3%95.2%87.2%90.3%
Random Forest90.0%94.7%86.6%95.2%88.1%90.9%
GBM87.3%94.0%83.7%94.6%85.6%89.0%
Light GBM89.4%94.7%86.0%95.1%87.2%90.5%
Average89.0%94.5%85.4%95.0%87.0%90.2%
Table 8. The average classification accuracy between the standing and moving acts by the ML-based analysis model.
ABCDEAverage
Decision Tree0.99880.98770.97430.97360.97180.9812
Random Forest0.99970.99500.98810.98790.98750.9916
GBM0.99350.95960.88540.93210.87090.9283
Light GBM0.99930.98870.95330.96550.93920.9692
Average0.99780.98280.95030.96480.94240.9676
Table 5. Analysis of univariate multiple linear regression.
ExperimenterABCDEAverage
R2-values0.42210.66910.29260.69320.24470.4644
Publisher’s Note: MDPI stays neutral with regard to jurisdictional claims in published maps and institutional affiliations.

