FULE—Functionality, Usability, Look-and-Feel and Evaluation Novel User-Centered Product Design Methodology—Illustrated in the Case of an Autonomous Medical Device


Abstract
1. Introduction
2. Background
2.1. Medical Device Design
2.2. What is Good Design?
2.3. Design Importance
2.4. Summary
3. Aim
4. Study Structure
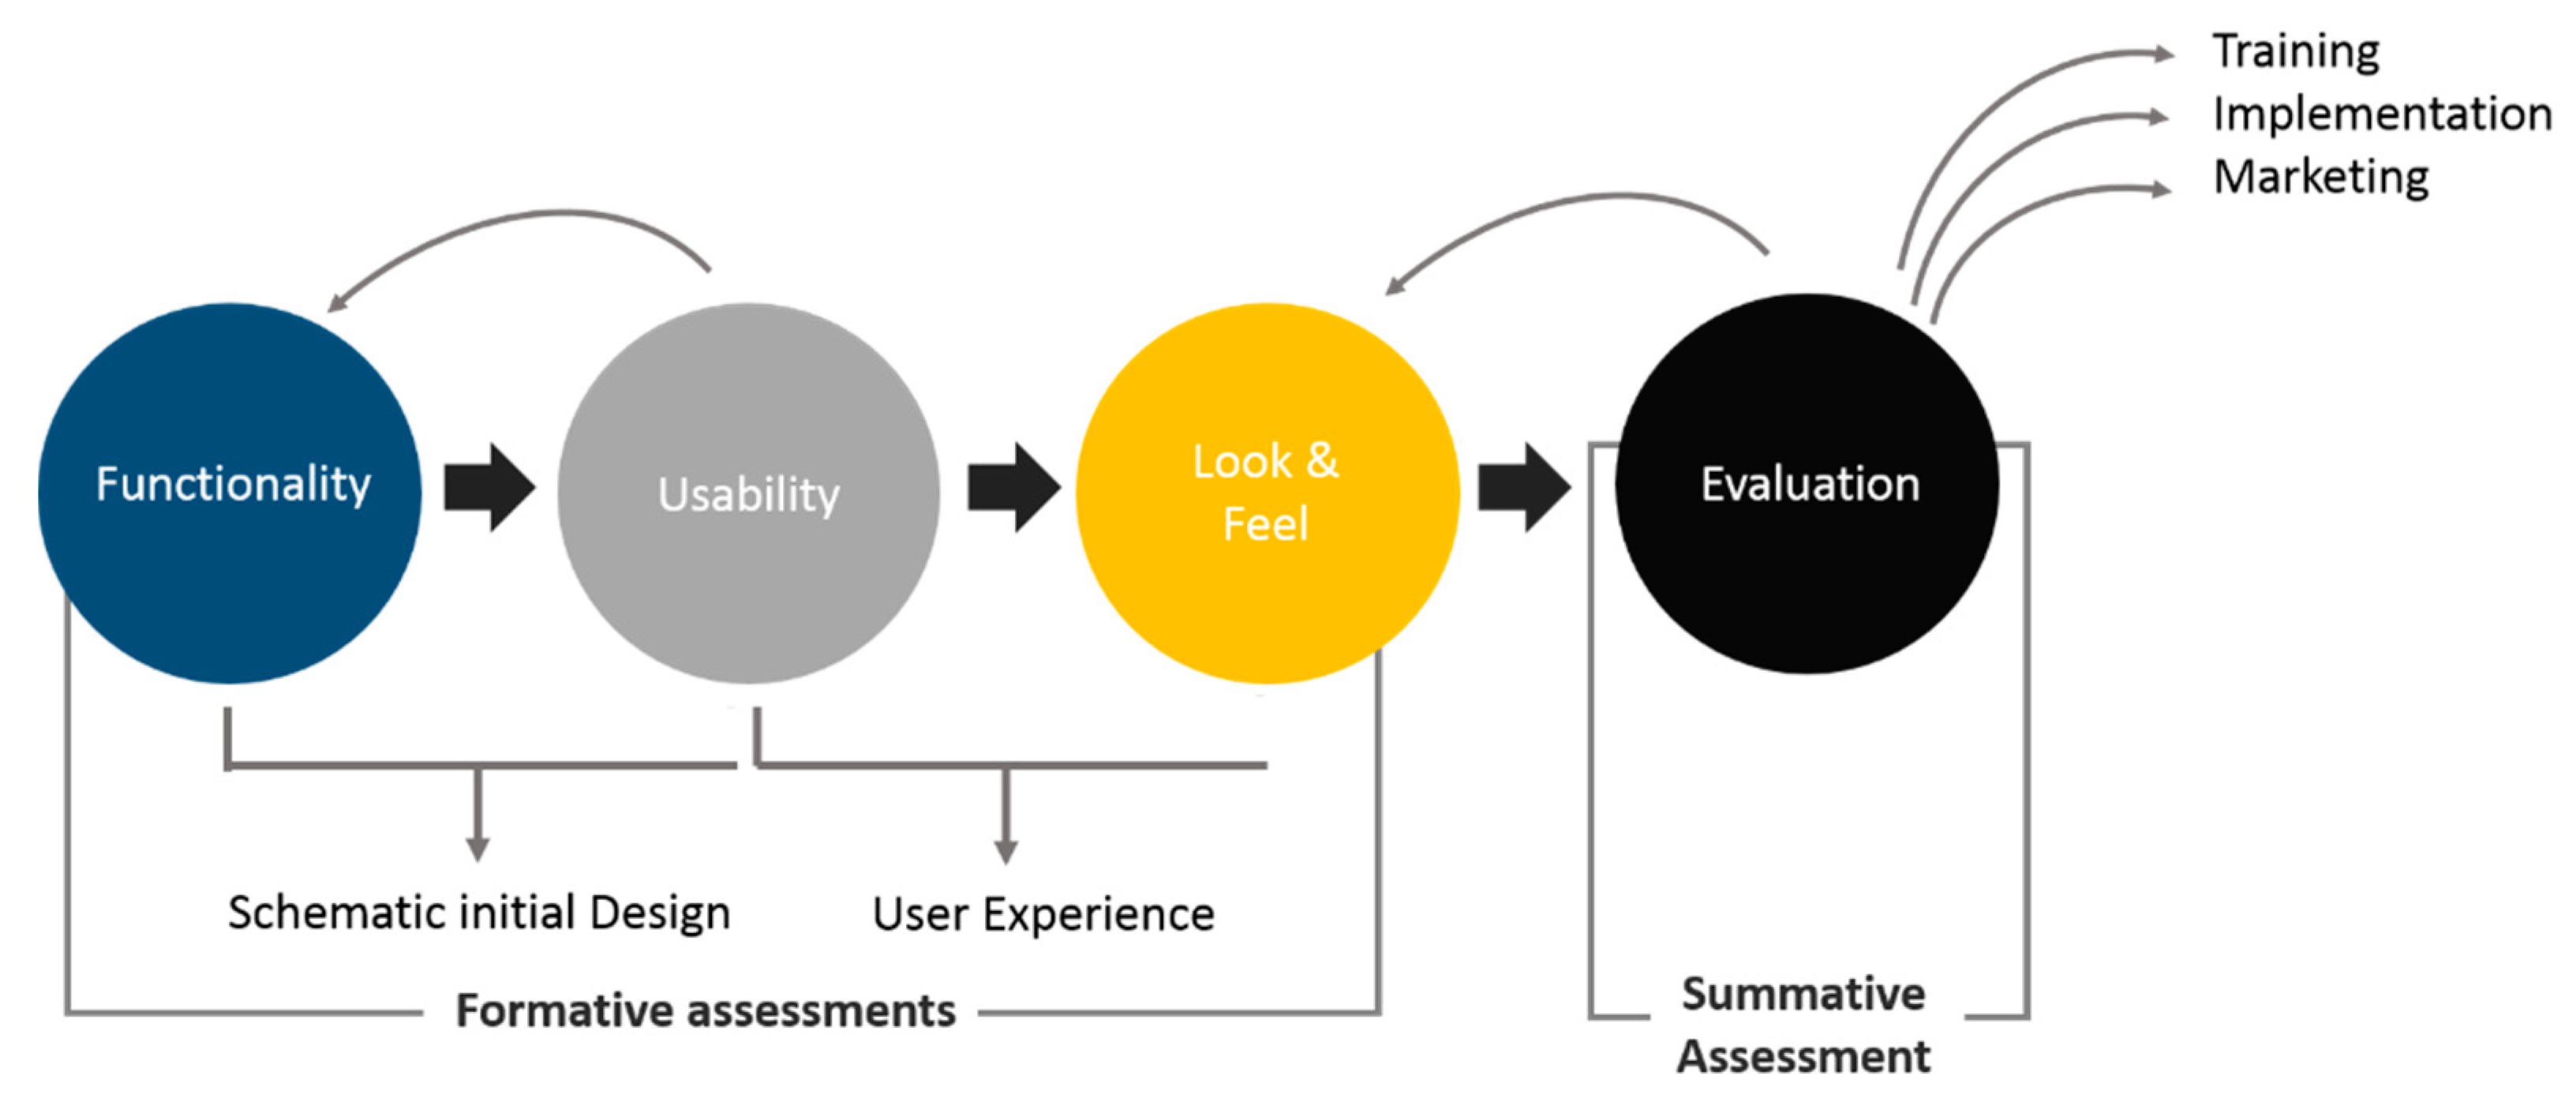
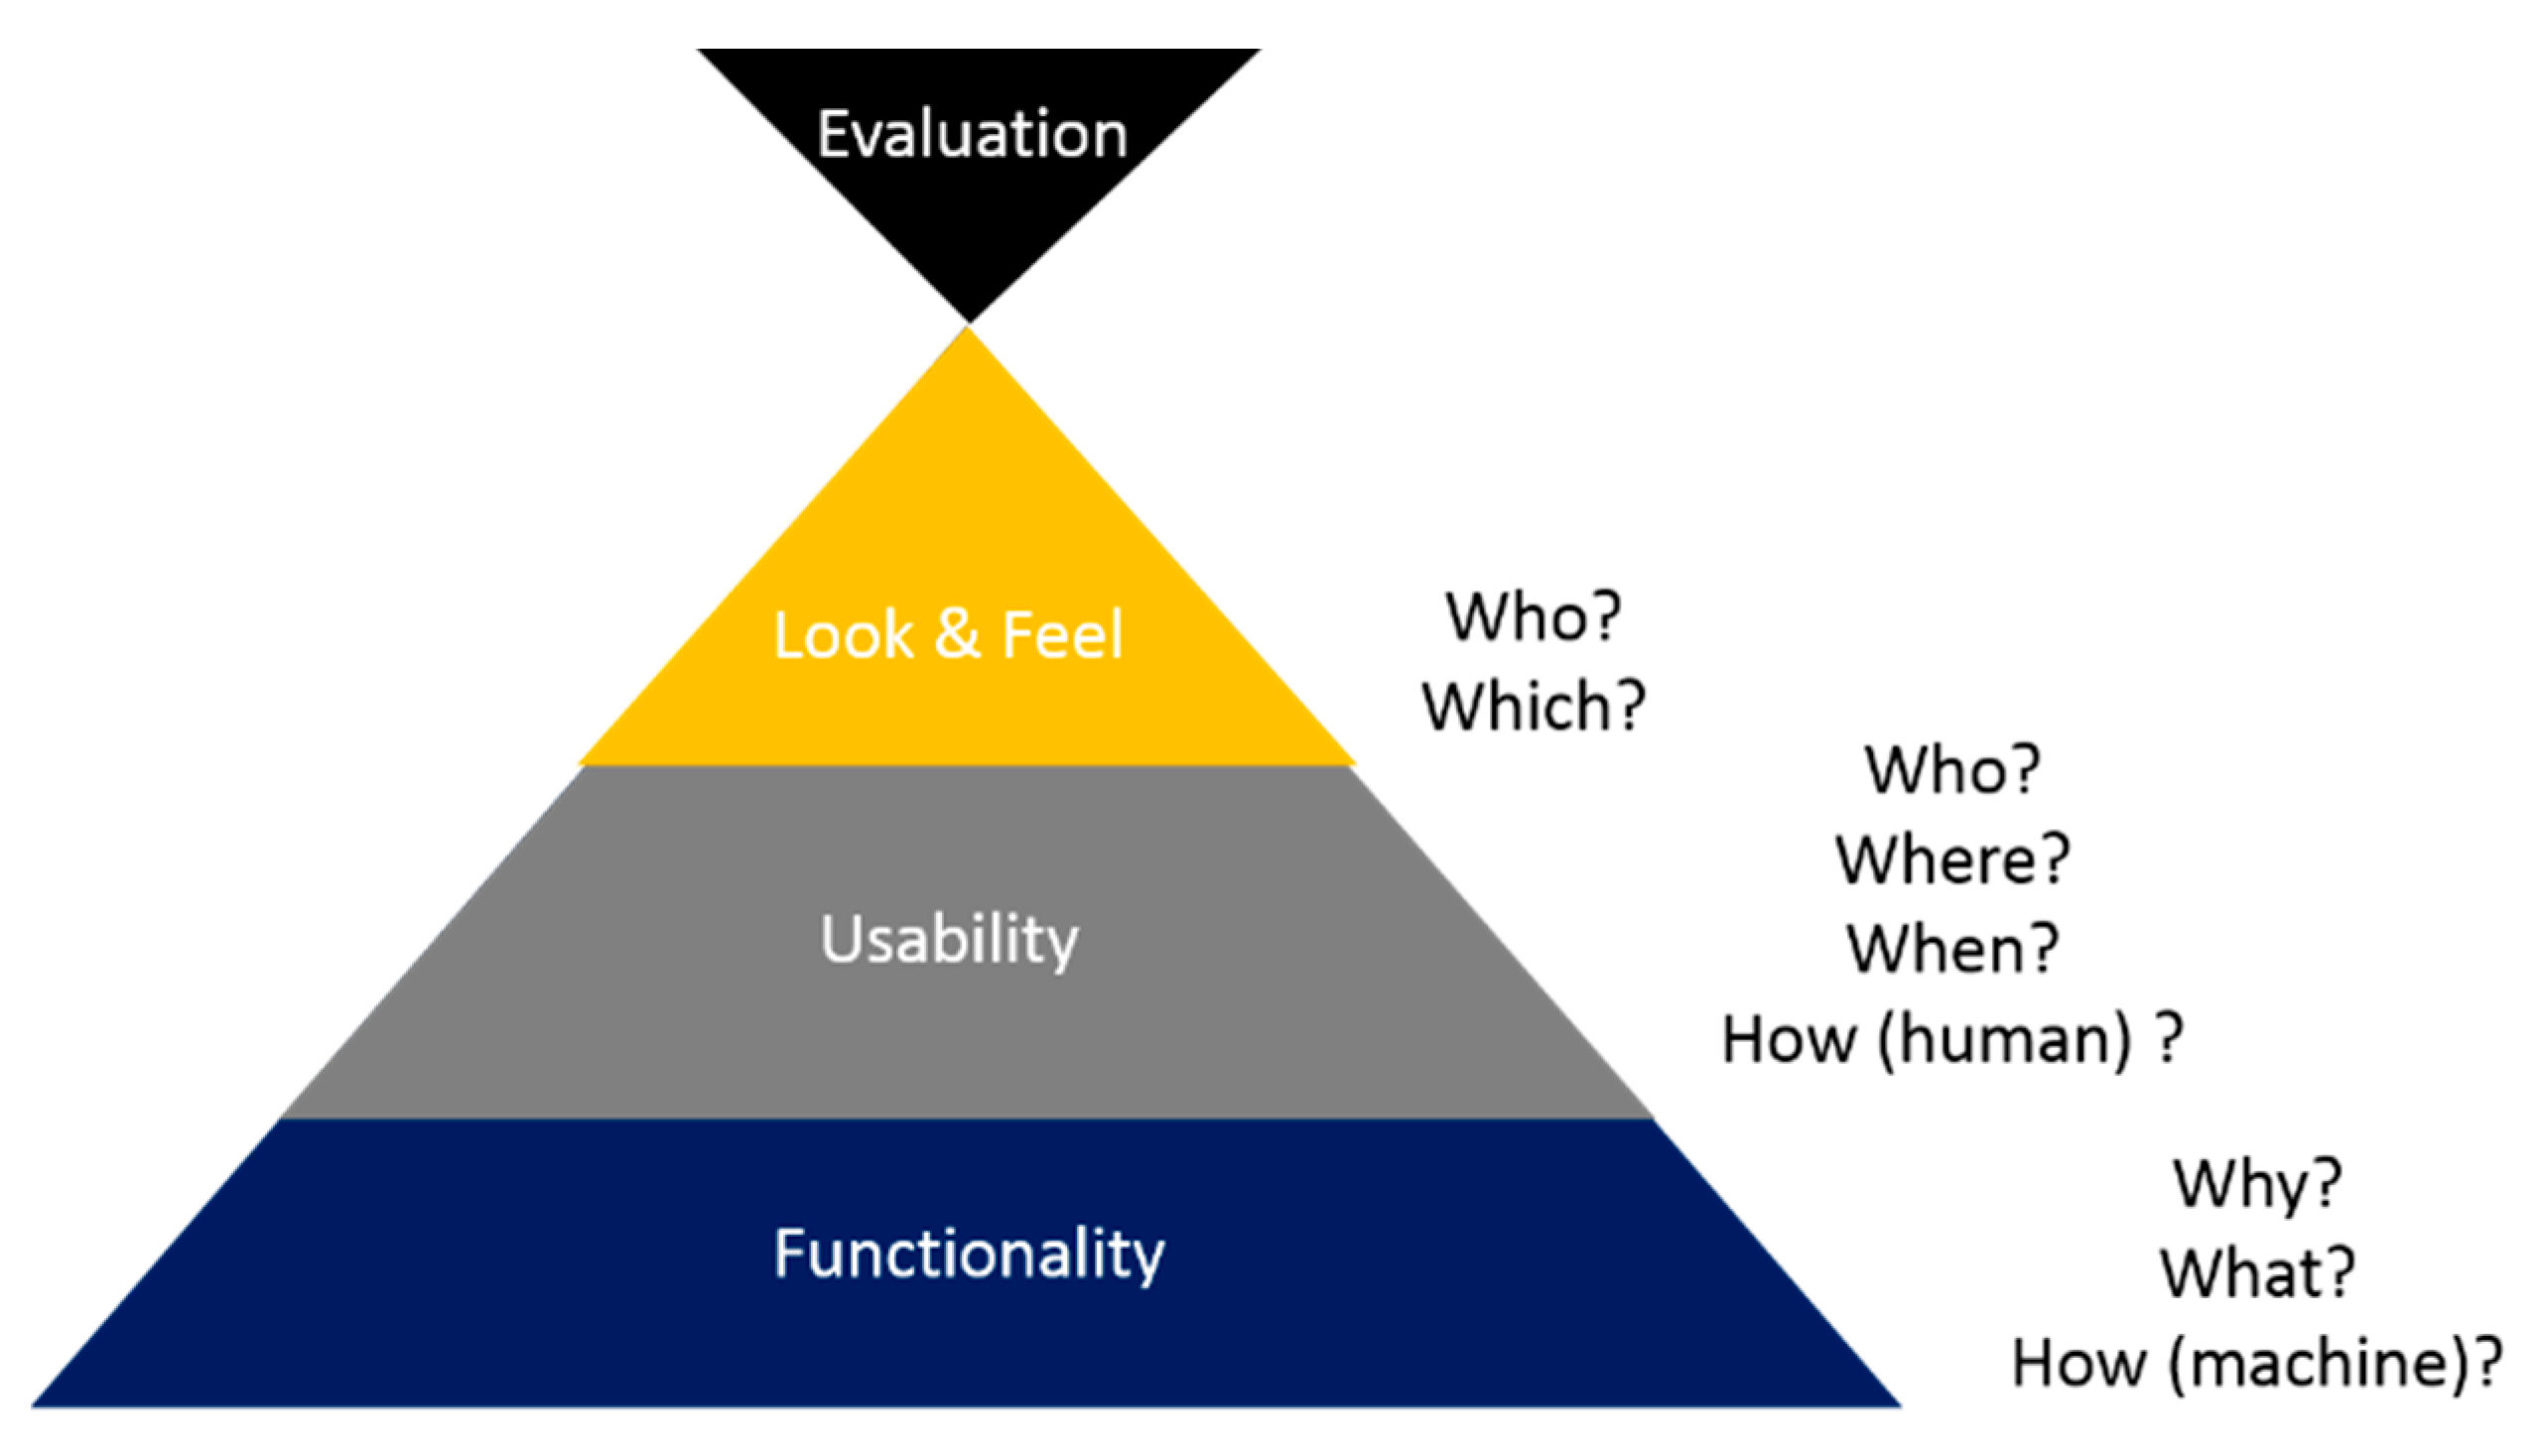
5. FULE Methodology
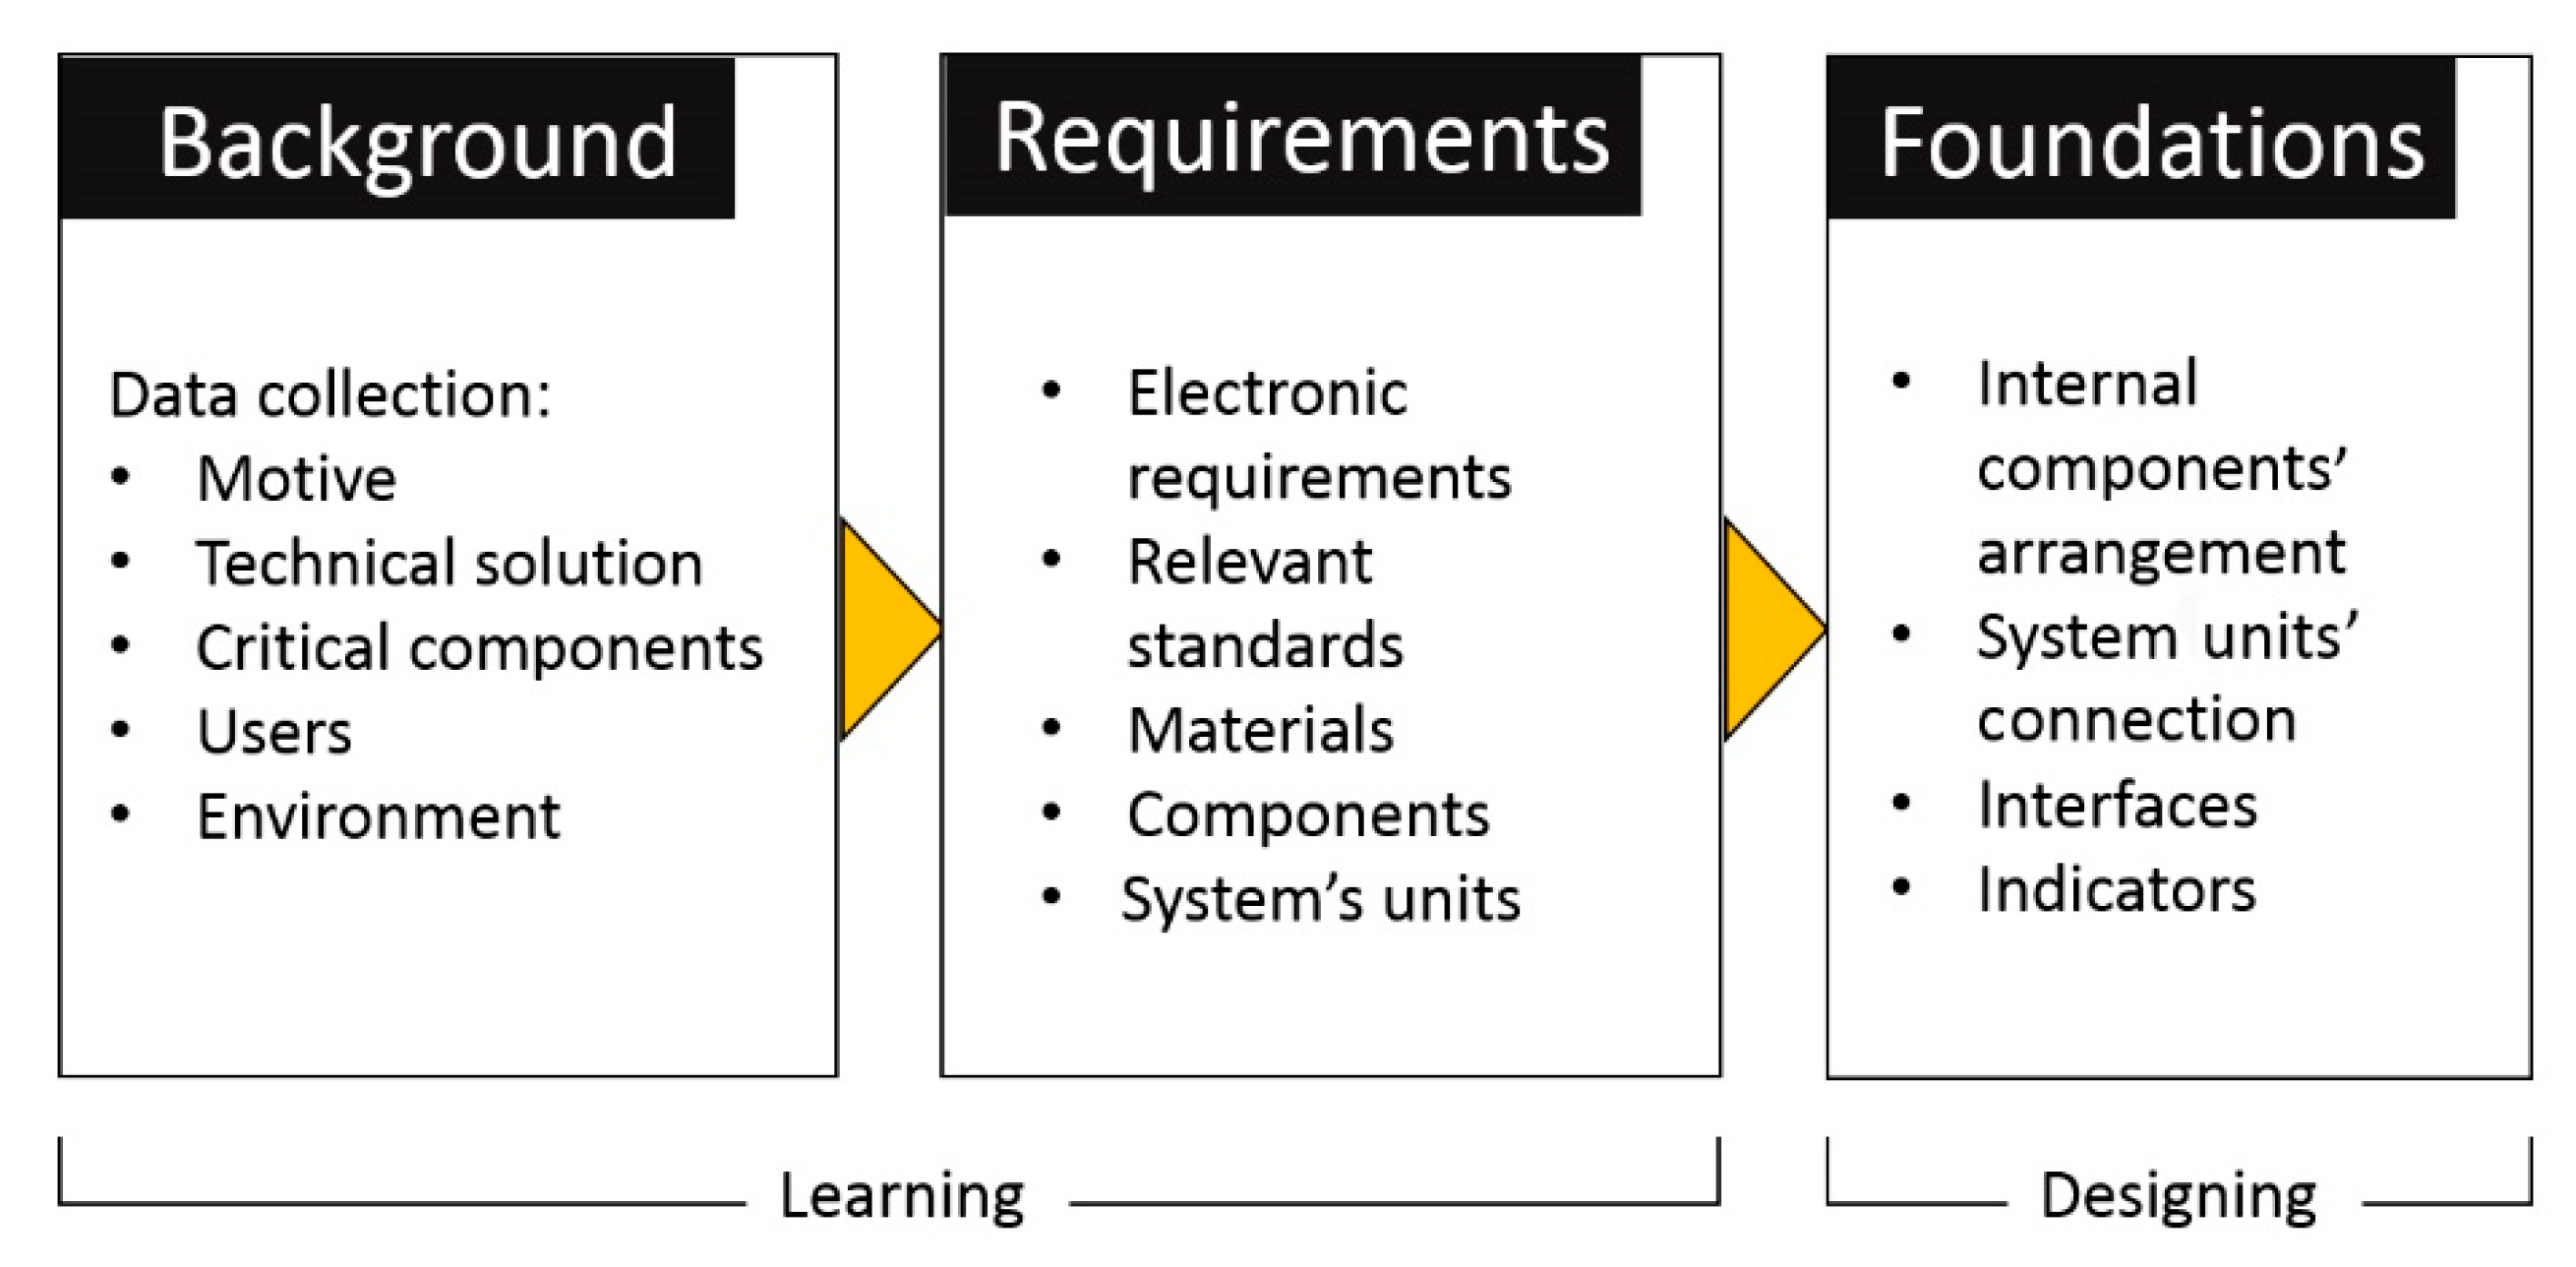
5.1. Phase 1: Functionality
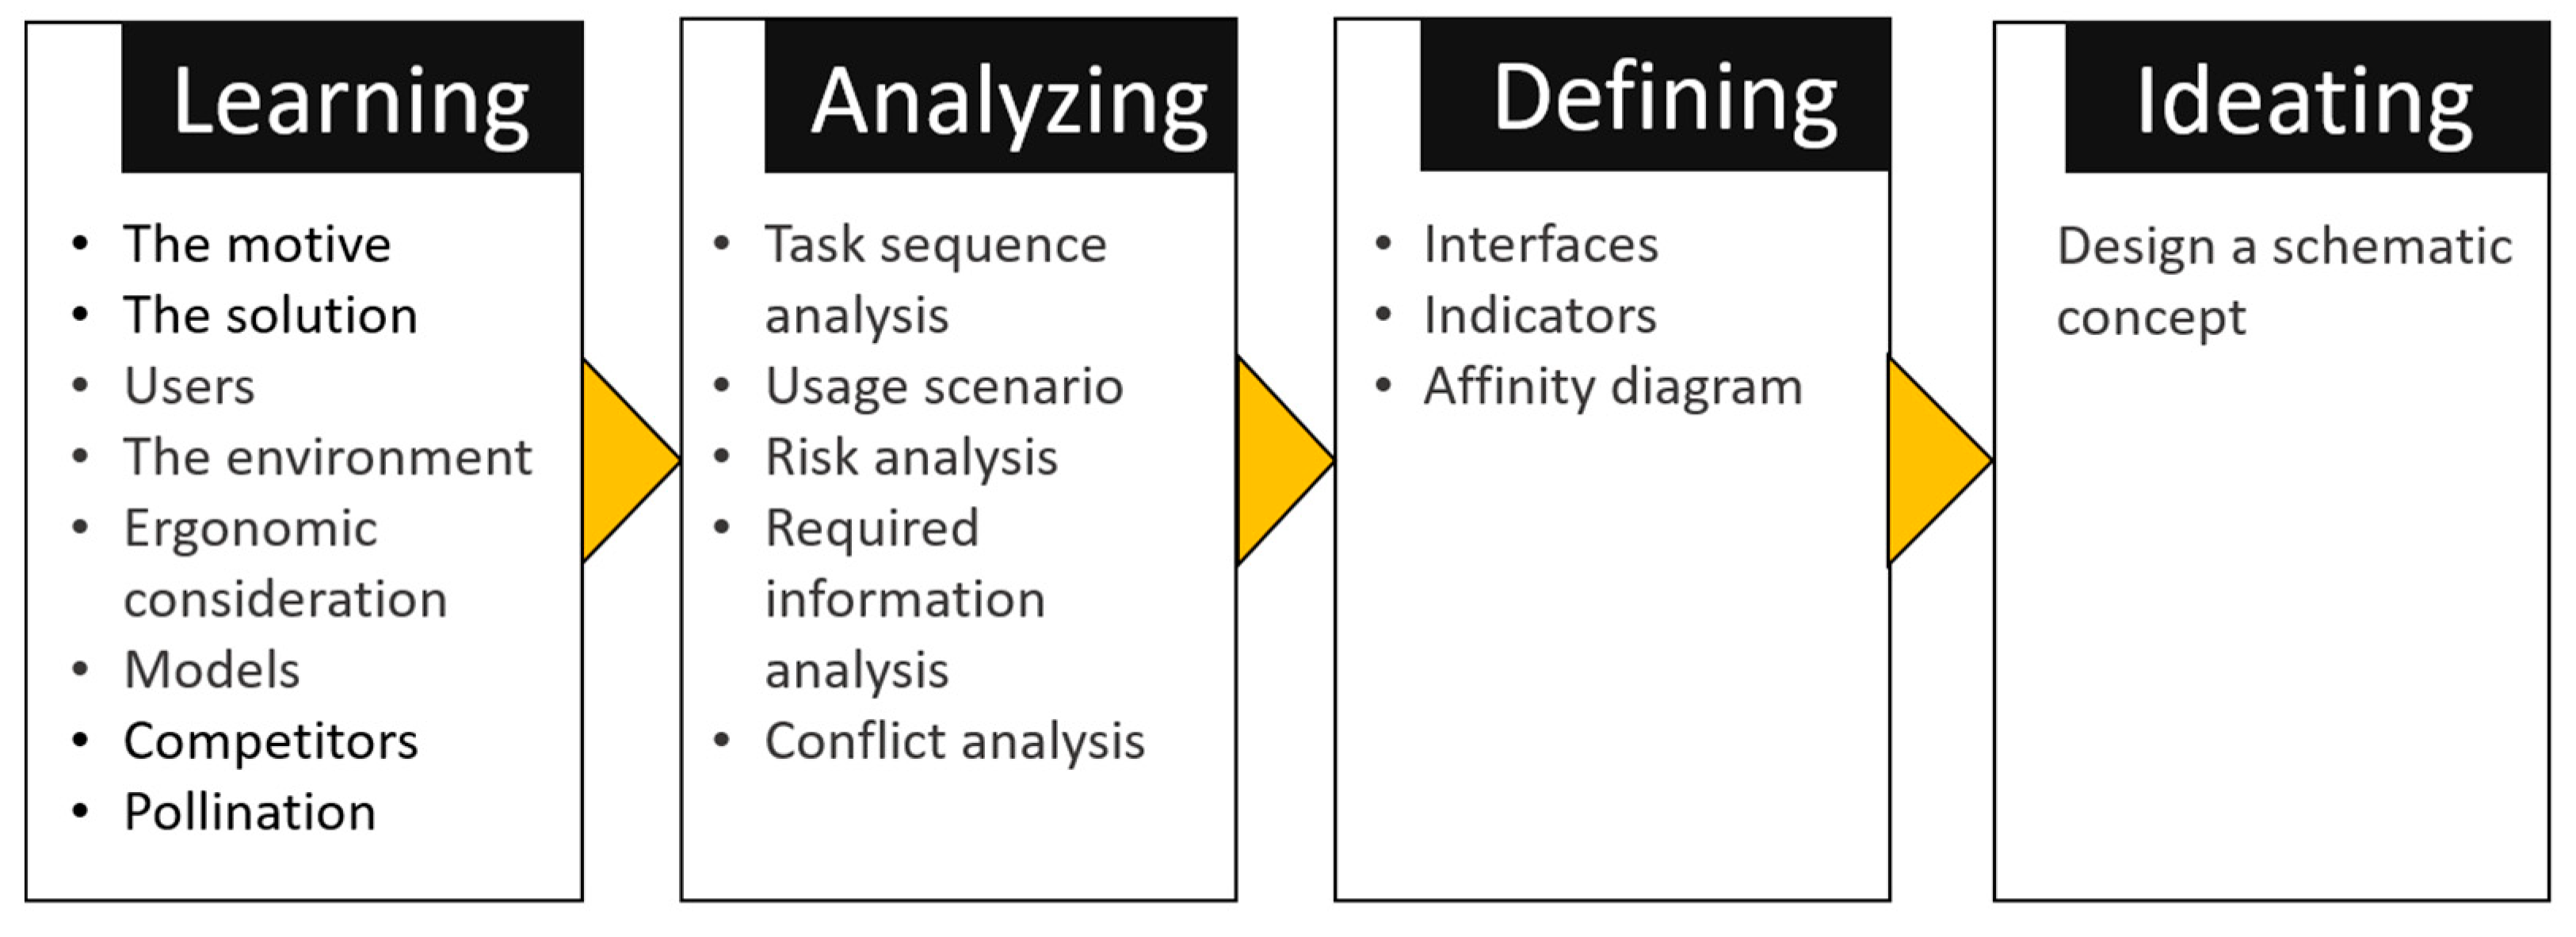
5.2. Phase 2: Usability
5.3. Phase 3: Look-and-Feel
5.4. Phase 4: Evaluation
6. Case Study
6.1. Case study—Functionality
6.1.1. The Motivation
6.1.2. The Solution
6.2. Case Study—Literature Review
6.2.1. Autonomous Systems
6.2.2. User Trust
6.2.3. Summary
6.3. Case study—Usability
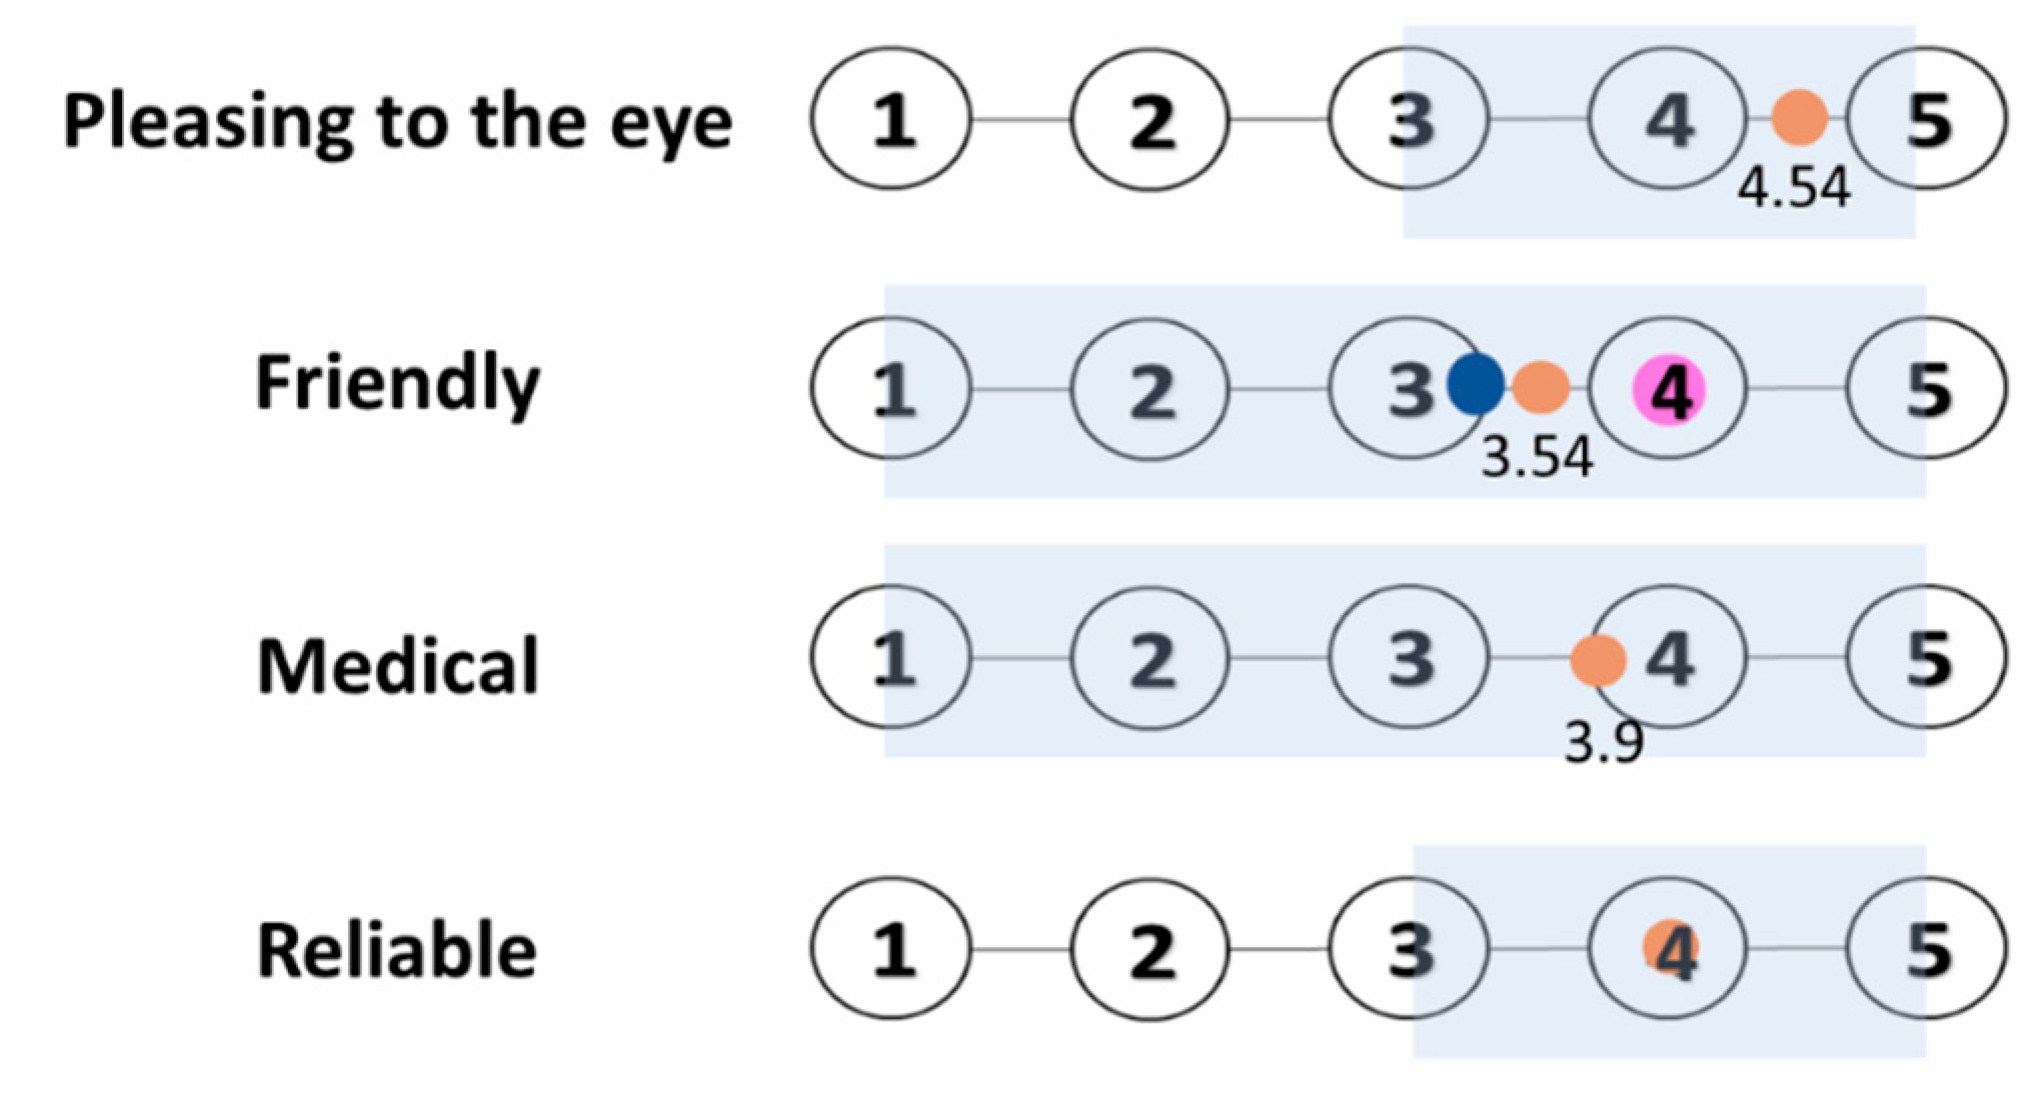
6.4. Case Study—Look-and-Feel
6.5. The Final Product
6.6. Case Study—Evaluation
6.7. Data Gathering
7. Discussion
8. Conclusions
Author Contributions
Funding
Institutional Review Board Statement
Informed Consent Statement
Data Availability Statement
Conflicts of Interest
References
- Frizziero, L.; Donnici, G.; Dhaimini, K.; Liverani, A.; Caligiana, G. Advanced design applied to an original multi-purpose ventilator achievable by additive manufacturing. Appl. Sci. 2018, 8, 2635. [Google Scholar] [CrossRef]
- Blessing, L.T.; Chakrabarti, A. DRM: A Design Research Methodology; Springer: London, UK, 2009; pp. 13–42. [Google Scholar]
- Altshuller, G.; Altov, H. And Suddenly the Inventor Appeared: TRIZ, the Theory of Inventive Problem Solving; Technical Innovation Center, Inc.: Worcester, MA, USA, 1996. [Google Scholar]
- Petersson, A.M.; Lundberg, J. Developing an ideation method to be used in cross-functional inter-organizational teams by means of action design research. Res. Eng. Des. 2018, 29, 433–457. [Google Scholar] [CrossRef]
- Shai, O.; Reich, Y. Infused design. i. theory. Res. Eng. Des. 2004, 15, 93–107. [Google Scholar] [CrossRef]
- Sawyer, D.; Aziz, K.J.; Backinger, C.L.; Beers, E.T.; Lowery, A.; Sykes, S.M.; Trautman, K.A. Do It by Design: An Introduction to Human Factors in Medical Devices; US Department of Health and Human Services, Public Health Service, Food and Drug Administration, Center for Devices and Radiological Health: SilverSpring, MD, USA, 1996.
- Benedek, J.; Miner, T. Measuring desirability: New methods for evaluating desirability in a usability lab setting. Proc. Usability Prof. Assoc. 2002, 2003, 57. [Google Scholar]
- Dávila-Vilchis, J.M.; Ávila Vilchis, J.C.; Vilchis-González, A.H. Design methodology for soft wearable devices—The MOSAR case. Appl. Sci. 2019, 9, 4727. [Google Scholar] [CrossRef]
- Wilson, N.; Thomson, A.; Riches, P. Development and presentation of the first design process model for sports equipment design. Res. Eng. Des. 2017, 28, 495–509. [Google Scholar] [CrossRef]
- Fiorineschi, L.; Frillici, F.S.; Rotini, F. Challenging COVID-19 with creativity: Supporting design space exploration for emergency ventilators. Appl. Sci. 2020, 10, 4955. [Google Scholar] [CrossRef]
- Bunce, P.; Gould, P. From lean to agile manufacturing. In Proceedings of the IEE Colloquium on Agile Manufacturing (Digest No. 1997/386), Cranfield, UK, 27 November 1997. [Google Scholar]
- Salomé, L. Supporting the Workflow of Nurses at the ICU: Designing the Interface of an ICU Dashboard. Master’s Thesis, Delft University of Technology, Delft, The Netherlands, 2018. [Google Scholar]
- Hoonakker, P.; Carayon, P.; Gurses, A.P.; Brown, R.; Khunlertkit, A.; McGuire, K.; Walker, J.M. Measuring workload of ICU nurses with a questionnaire survey: The NASA Task Load Index (TLX). IIE Trans. Healthc. Syst. Eng. 2011, 1, 131–143. [Google Scholar] [CrossRef]
- Tuch, A.N.; Presslaber, E.E.; Stöcklin, M.; Opwis, K.; Bargas-Avila, J.A. The role of visual complexity and prototypicality regarding first impression of websites: Working towards understanding aesthetic judgments. Int. J. Hum. Comput. Stud. Int. J. Man-Mach. Stud. 2012, 70, 794–811. [Google Scholar] [CrossRef]
- Conway, C.M.; Pelet, J.E.; Papadopoulou, P.; Limayem, M. Coloring in the Lines: Using Color to Change the Perception of Quality in E-Commerce Sites; Thirty First International Conference on Information Systems: St. Louis, MO, USA, 2010; p. 224. [Google Scholar]
- Salanitri, D.; Hare, C.; Borsci, S.; Lawson, G.; Sharples, S.; Waterfield, B. Relationship between trust and usability in virtual environments: An on-going study. In International Conference on Human-Computer Interaction; Springer: Cham, Switzerland, 2015; pp. 49–59. [Google Scholar]
- Fiorineschi, L.; Rissone, P.; Rotini, F. Modularization vs. innovation. Int. J. Innov. Sci. 2014, 6, 29–42. [Google Scholar] [CrossRef]
- Kortstra, J.R. Designing for the user. Med. Device Technol. 1995, 6, 22–26. [Google Scholar] [PubMed]
- Fairbanks, R.J.; Wears, R.L. Hazards with medical devices: The role of design. Ann. Emerg. Med. 2008, 52, 519–521. [Google Scholar] [CrossRef] [PubMed]
- Norman, D. The Design of Everyday Things: Revised and Expanded Edition; Basic Books: Doubleday, NY, USA, 2013; p. 241. [Google Scholar]
- Medical Device Reporting (MDR): How to Report Medical Device Problems. Available online: https://www.fda.gov/medical-devices/medical-device-safety/medical-device-reporting-mdr-how-report-medical-device-problems (accessed on 1 December 2020).
- Harris, J.S. New product profile chart. Chem. Eng. News 1961, 39, 110–118. [Google Scholar] [CrossRef]
- Kotler, P.; Rath, G.A. Design: A powerful but neglected strategic tool. J. Bus. Strategy 1984, 5, 16. [Google Scholar] [CrossRef]
- Kotler, P. Marketing Insights from A to Z: 80 Concepts Every Manager Needs to Know; John Wiley & Sons: Hoboken, NJ, USA, 2003. [Google Scholar]
- Hertenstein, J.H.; Platt, M.B.; Veryzer, R.W. The impact of industrial design effectiveness on corporate financial performance. J. Prod. Innov. Manag. 2005, 22, 3–21. [Google Scholar] [CrossRef]
- Dahl, D.W.; Chattopadhyay, A.; Gorn, G.J. The use of visual mental imagery in new product design. J. Mark. Res. 1999, 36, 18–28. [Google Scholar] [CrossRef]
- Srinivasan, V.; Lovejoy, W.S.; Beach, D. Integrated product design for marketability and manufacturing. J. Mark. Res. 1997, 34, 154–163. [Google Scholar] [CrossRef]
- Desmet, P.; Hekkert, P. Framework of product experience. Int. J. Des. 2007, 1, 57–66. [Google Scholar]
- Mata, M.P.; Ahmed-Kristensen, S.; Brockhoff, P.B.; Yanagisawa, H. Investigating the influence of product perception and geometric features. Res. Eng. Des. 2017, 28, 357–379. [Google Scholar] [CrossRef]
- Reich, Y. A model of aesthetic judgment in design. Artif. Intell. Eng. 1993, 8, 141–153. [Google Scholar] [CrossRef]
- Efrati, S.; Deutsch, I.; Gurman, G.M. Endotracheal tube cuff-small important part of a big issue. J. Clin. Monit. Comput. 2012, 26, 53–60. [Google Scholar] [CrossRef] [PubMed]
- Luckraz, H.; Manga, N.; Senanayake, E.L.; Abdelaziz, M.; Gopal, S.; Charman, S.C.; Giri, R.; Oppong, R.; Andronis, L. Cost of treating ventilator-associated pneumonia post cardiac surgery in the National Health Service: Results from a propensity-matched cohort study. J. Intensive Care Soc. 2018, 19, 94–100. [Google Scholar] [CrossRef]
- Bitan, Y.; Patterson, E. Unique challenges in user interface design for medical devices that use predictive algorithms. Proc. Int. Symp. Hum. Factors Ergon. Healthc. 2020, 9, 265–266. [Google Scholar] [CrossRef]
- Frey, C.B.; Osborne, M. The Future of Employment: How Susceptible Are Jobs to Automation; Oxford Martin School: Oxford, UK, 2013. [Google Scholar]
- Parasuraman, R.; Manzey, D.H. Complacency and bias in human use of automation: An attentional integration. Hum. Factors 2010, 52, 381–410. [Google Scholar] [CrossRef] [PubMed]
- Lee, J.D.; See, K.A. Trust in Automation: Designing for Appropriate Reliance. Hum. Factors 2004, 46, 50–80. [Google Scholar] [CrossRef] [PubMed]
- Sheridan, T.B.; Verplank, W.L. Human and Computer Control of Undersea Teleoperators; Massachusetts Inst of Tech Cambridge Man-Machine Systems Lab: Cambridge, MA, USA, 1978. [Google Scholar]
- Hoff, K.; Bashir, M. Trust in Automation Integrating Empirical Evidence on Factors That Influence Trust. Hum. Factors 2015, 57, 407–434. [Google Scholar] [CrossRef]
- Miller, J.E.; Perkins, L. Development of metrics for trust in automation. Air Force Research Lab Wright-Patterson AFB oh Sensors Directorate. In Proceedings of the International Command and Control Research and Technology Symposium (ICCRTS), Santa Monica, CA, USA, 22–24 June 2010. [Google Scholar]
- Brooke, J. SUS-A quick and dirty usability scale. Usability Eval. Ind. 1996, 189, 4–7. [Google Scholar]


| N | ||
|---|---|---|
| Total | 11 | |
| Gender | Males | 6 |
| Females | 5 | |
| Age | <35 | 3 |
| 36–45 | 6 | |
| 46–55 | 1 | |
| 56< | 1 | |
| Seniority (years) | <10 | 3 |
| 11–20 | 6 | |
| 21–30 | 1 | |
| 31–40 | 1 |
| N | ||
|---|---|---|
| Total | 22 | |
| Gender | Males | 7 |
| Females | 15 | |
| Age | <35 | 8 |
| 36–45 | 4 | |
| 46–55 | 6 | |
| 56< | 4 |
| N | Physical Usability (0–5) | SUS (0–100) | ||
|---|---|---|---|---|
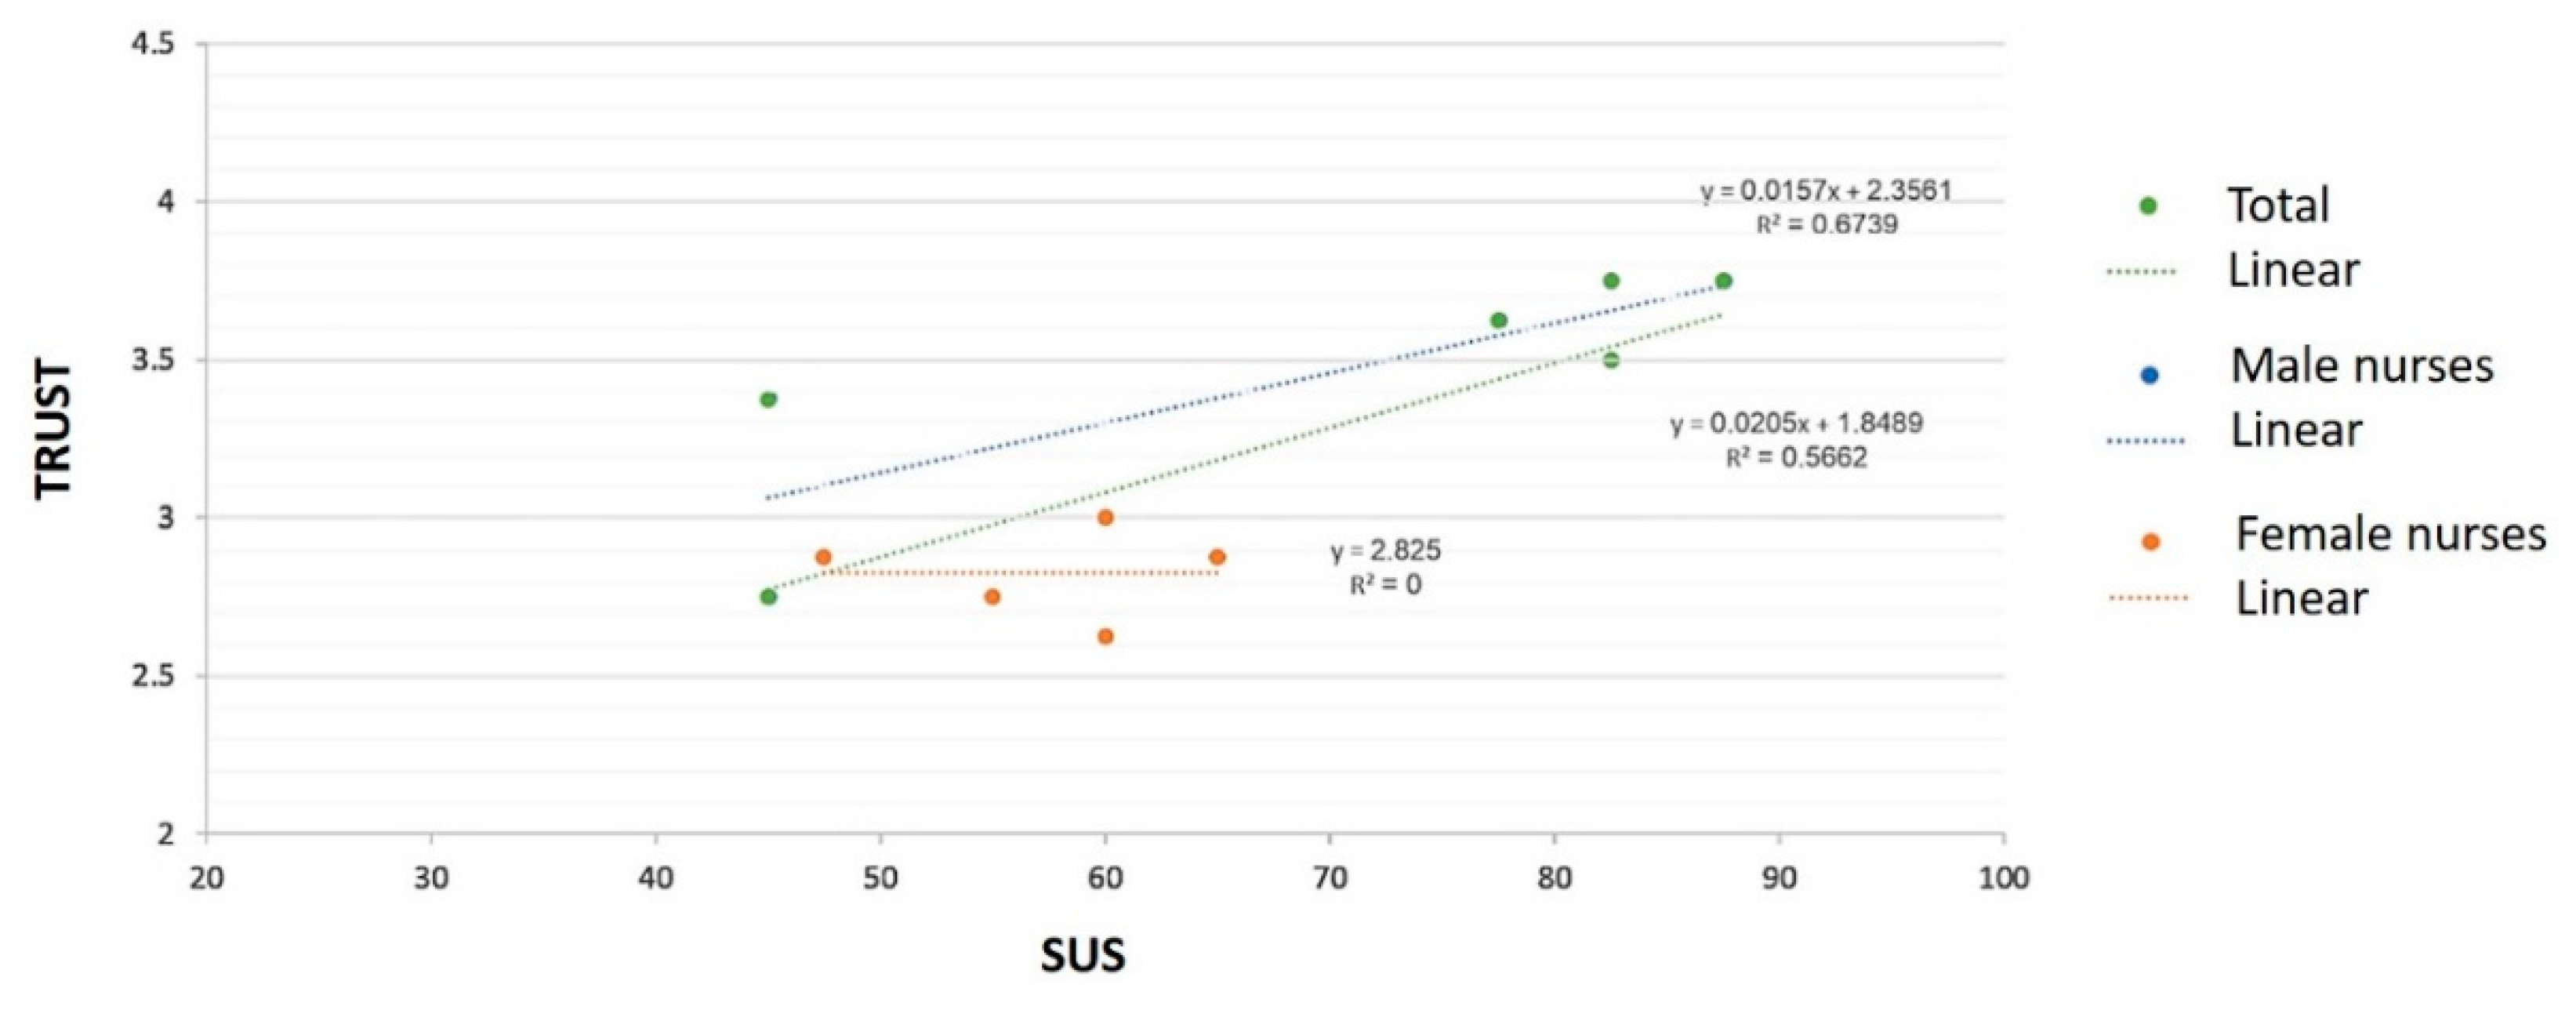
| Total | 11 | 4.28 | 64.32 | |
| Gender | Males | 6 | 4.17 | 70 |
| Females | 5 | 4.41 | 57.5 | |
| Age | <35 | 3 | 4.15 | 76.67 |
| 36–45 | 6 | 4.23 | 62.92 | |
| 46< | 2 | 4.65 | 50 |
| N | Specific Feature Trust (0–5) | General Trust (0–5) | ||
|---|---|---|---|---|
| Total | 11 | 3.72 | 3.17 | |
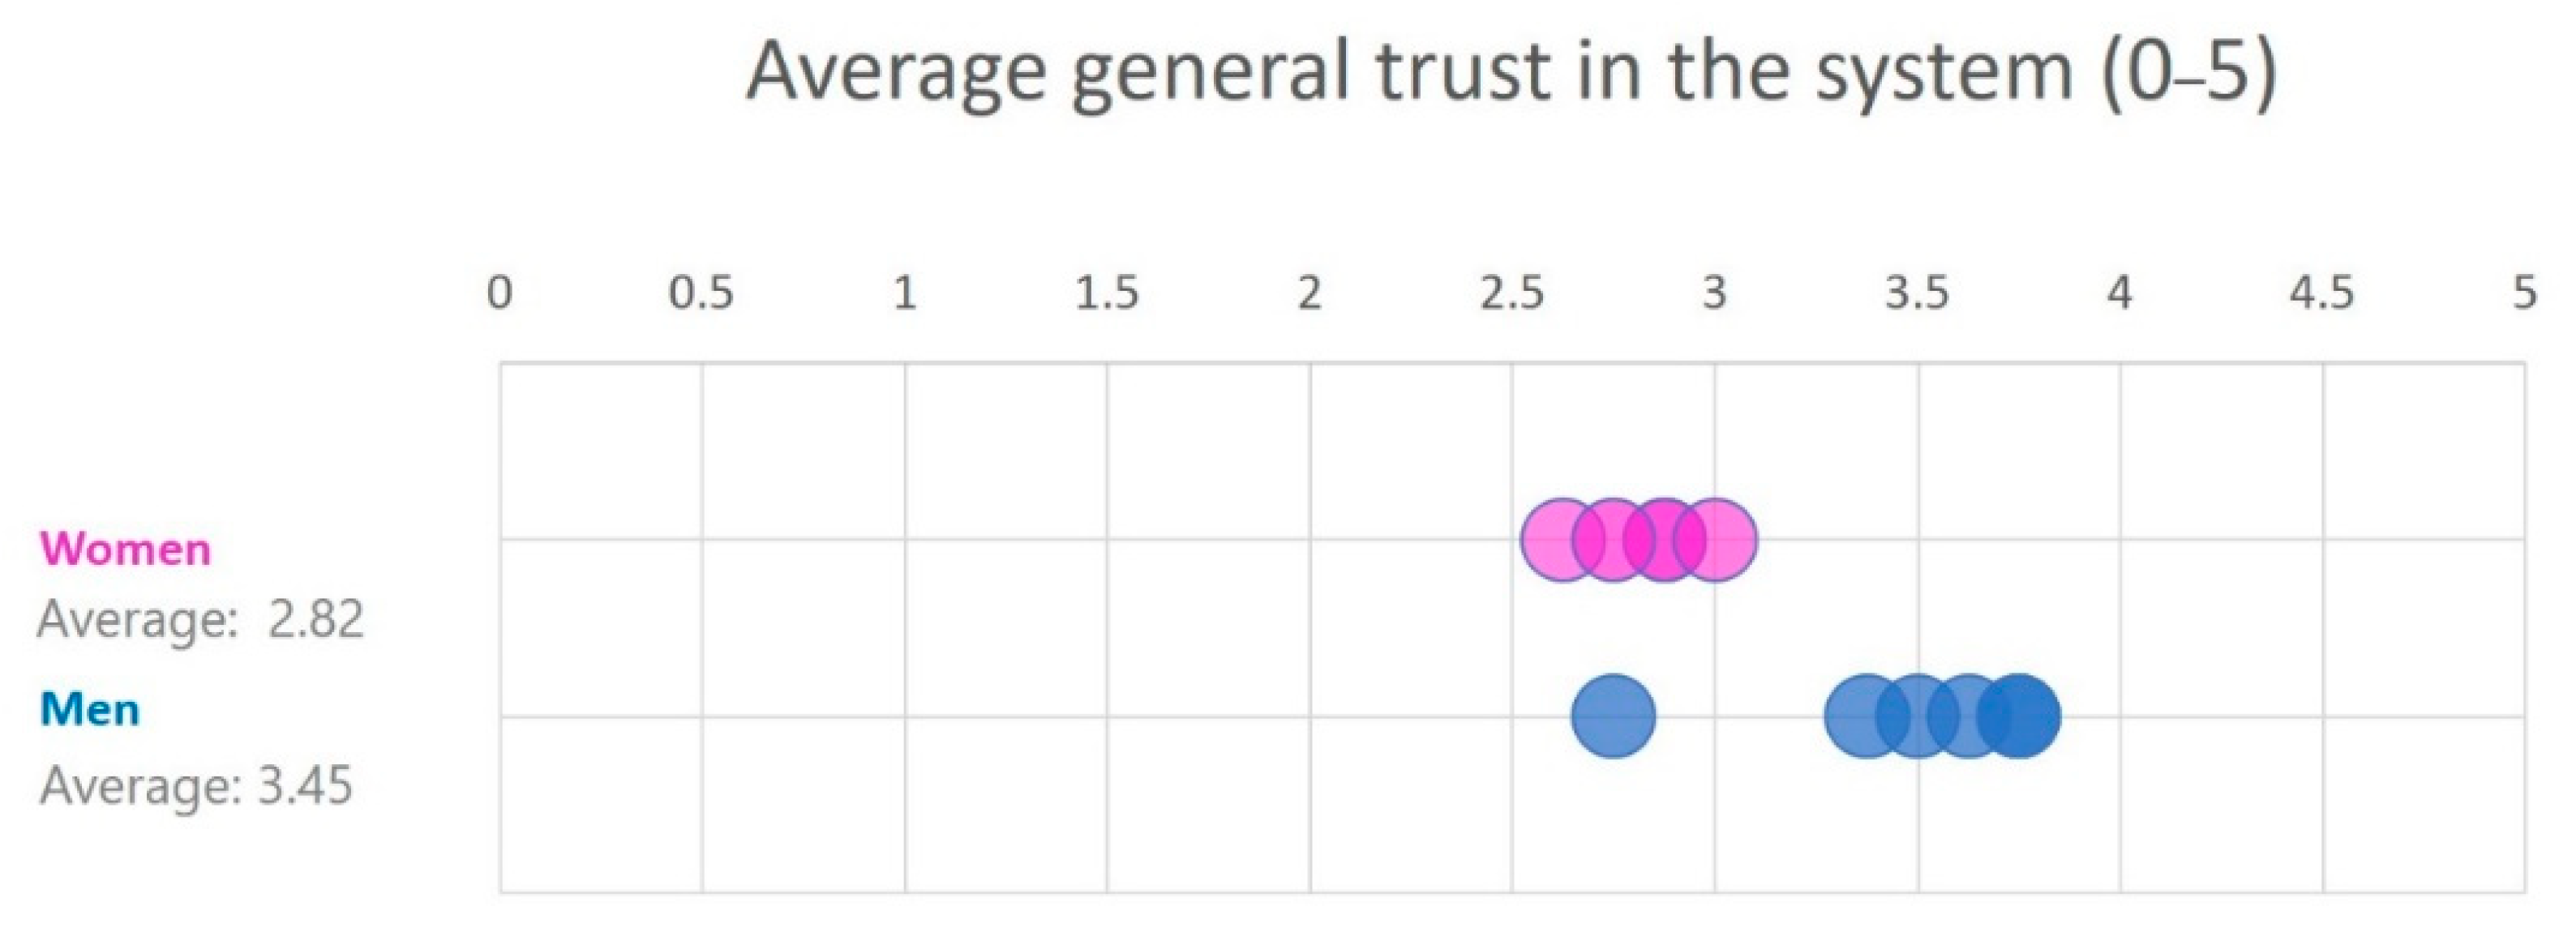
| Gender | Males | 5 | 3.88 | 3.45 |
| Females | 6 | 3.53 | 2.82 | |
| Age | <35 | 3 | 4 | 3.5 |
| 36–45 | 6 | 3.5 | 3.04 | |
| 46< | 2 | 4 | 3.06 |
Publisher’s Note: MDPI stays neutral with regard to jurisdictional claims in published maps and institutional affiliations. |
© 2021 by the authors. Licensee MDPI, Basel, Switzerland. This article is an open access article distributed under the terms and conditions of the Creative Commons Attribution (CC BY) license (http://creativecommons.org/licenses/by/4.0/).
Share and Cite
Liberman-Pincu, E.; Bitan, Y. FULE—Functionality, Usability, Look-and-Feel and Evaluation Novel User-Centered Product Design Methodology—Illustrated in the Case of an Autonomous Medical Device. Appl. Sci. 2021, 11, 985. https://doi.org/10.3390/app11030985
Liberman-Pincu E, Bitan Y. FULE—Functionality, Usability, Look-and-Feel and Evaluation Novel User-Centered Product Design Methodology—Illustrated in the Case of an Autonomous Medical Device. Applied Sciences. 2021; 11(3):985. https://doi.org/10.3390/app11030985
Chicago/Turabian StyleLiberman-Pincu, Ela, and Yuval Bitan. 2021. "FULE—Functionality, Usability, Look-and-Feel and Evaluation Novel User-Centered Product Design Methodology—Illustrated in the Case of an Autonomous Medical Device" Applied Sciences 11, no. 3: 985. https://doi.org/10.3390/app11030985
APA StyleLiberman-Pincu, E., & Bitan, Y. (2021). FULE—Functionality, Usability, Look-and-Feel and Evaluation Novel User-Centered Product Design Methodology—Illustrated in the Case of an Autonomous Medical Device. Applied Sciences, 11(3), 985. https://doi.org/10.3390/app11030985