Article

Structure of Microbial Communities When Complementary Effluents Are Anaerobically Digested

Laboratório Nacional de Energia e Geologia-LNEG, Unidade de Bioenergia e Biorrefinarias, I.P., 1649-038 Lisboa, Portugal
*
Author to whom correspondence should be addressed.
Appl. Sci. 2021, 11(3), 1293; https://doi.org/10.3390/app11031293
Submission received: 28 December 2020 / Revised: 17 January 2021 / Accepted: 27 January 2021 / Published: 1 February 2021
(This article belongs to the Special Issue Microbiological Surveillance of Biogas and Sewage Treatment Plants)

Abstract

:
Olive oil and pig productions are important industries in Portugal that generate large volumes of wastewater with high organic load and toxicity, raising environmental concerns. The principal objective of this study is to energetically valorize these organic effluents—piggery effluent and olive mill wastewater—through the anaerobic digestion to the biogas/methane production, by means of the effluent complementarity concept. Several mixtures of piggery effluent were tested, with an increasing percentage of olive mill wastewater. The best performance was obtained for samples of piggery effluent alone and in admixture with 30% of OMW, which provided the same volume of biogas (0.8 L, 70% CH4), 63/75% COD removal, and 434/489 L CH4/kg SVin, respectively. The validation of the process was assessed by molecular evaluation through Next Generation Sequencing (NGS) of the 16S rRNA gene. The structure of the microbial communities for both samples, throughout the anaerobic process, was characterized by the predominance of bacterial populations belonging to the phylum Firmicutes, mainly Clostridiales, with Bacteroidetes being the subdominant populations. Archaea populations belonging to the genus Methanosarcina became predominant throughout anaerobic digestion, confirming the formation of methane mainly from acetate, in line with the greatest removal of volatile fatty acids (VFAs) in these samples.

1. Introduction

The food industry is an economically important industrial sector [1], in which segments, such as olive oil and animal productions, play a relevant contribution. In Portugal, olive oil production is one of the most significant food industries, with 66,532 tons of virgin oil produced in 2014 [2]. On the other hand, pig industry, being one of leading animal and food economies worldwide as well in Portugal, provided about 2,615,000 heads in 2017 [2] that accounted for 1.2% of European production.
The three-phase olives processing system is identified with the use of large volumes of water and, consequently, with large amounts of olive mill wastewaters (OMW) that must be treated [3,4]. OMW has a high chemical oxygen demand COD content, usually up to 200 g/L, an acidic pH (between 4 and 6), and high content in solid matter (up to 20 g/L) [4,5,6,7]. Additionally, it contains minerals (potassium, sodium, and calcium), fermentable proteins, resinous and serous substances, vitamins, and small amounts of olive oil [3,8,9]. OMW has a reddish to black color, given by recalcitrant compounds (lignin and other polyphenols) and cellulosic compounds [3,6]. The phenolic compounds are phytotoxic and microbial inhibitors [8,10,11]. This effluent contains water (80–95%) and is rich on sugars (fructose, mannose, glucose, saccharose, sucrose, among others), long chain and volatile fatty acids. The composition of this wastewater changes with the type and region of origin of the olives, the ripeness of the olives, and the way of processing and handling.
With regard to pig farming, the large and intensive animal production results in large amounts of manure, part of which can end up in the sewage system. Piggery effluent (PE) is responsible for gas emissions, notably greenhouse gases and nitrogen-based gas (ammonia and nitrous oxide) [12,13]. So, to safely dispose of PE, it is always necessary to provide a treatment process for the manure. PE comprises two fractions: The solid, with animal excrement and food leftovers, and the liquid fraction, containing urine and water from washing and disinfections. It is rich in organic matter, solid residues (usually above 40 g/L), and nitrogen (mostly ammonia) [14,15]. Moreover, it contains high amounts of phosphorus and potassium and other compounds that create bad odors (e.g., volatile fatty acids and phenolic compounds). Additionally, proteins, lipids, and cellulosic components are also present [14].
Anaerobic digestion is a complex biochemical process based on close interactions between various microorganisms, bacteria, and archaeal species, that includes several steps, as hydrolysis, acidogenesis, acetogenesis, and methanogenesis, resulting in the production of methane (CH4), carbon dioxide (CO2), and water (H2O). During the process, a coordinated metabolism is carried out by different groups of microorganisms, which can be affected by various environmental factors, such as temperature, pH, volatile fatty acids, ammonia, nutrient balance, or the presence of toxins and inhibitors [16,17,18].
The harmful characteristics of OMW for the anaerobic process have been overcome with previous procedures providing composition substrate change. Dilution with water, chemical correction, and physical, chemical, and biological treatments, individually or in combination, are pre-treatment actions that present the disadvantages regarding the water consumption and the consequent increase in the flow volume to be treated and the possibility of arising new compounds more toxic/recalcitrant than the originals [19]. Other economic factors concern the loss of part of the organic load contained in the substrate and the inherent decrease in the available energy potential, as well as the cost of the pre-treatment equipment itself and its operation. Proposals applying co-digestion present constraints related to the efficiency of the influent degradation, gas production, and process stability [19,20,21].
Alternatively, the concept of effluents complementarity has been studied for application in anaerobic digestions of unbalanced and/or concentrated substrates and even those that may have inhibitory or recalcitrant capacities, as OMW. It was intended by the authors, therefore, to provide the addition of certain components in deficit in one of the effluents and/or promote the dilution to reduce the toxic effect, using another effluent/residue that is produced in the same region [22,23]. PE was used to complement and dilute OMW allowing the substrate conversion [24,25]. The correlation among the microbiota and compounds presented in digestate (biomolecules, as the bioactive compounds) from the phenolic substrates anaerobic process, like OMW, provided a new insight on the diversity of anaerobic digestion abilities [26]. In addition to the biofertilizer and the energy carrier vector (biogas/methane) from anaerobic digestion, added value compounds can simultaneously be obtained [27].
The development of sequencing techniques for the 16S rRNA gene increased the accuracy and confidence in the genotypic identification of microorganisms. More recently, with high-throughput sequencing technology, highly efficient for identifying the entire profile of microbial communities, it is possible to provide sufficient sequencing depth to cover complex microbial communities, and to establish taxonomic relationships between bacteria or groups of archaea [28]. Next-Generation Sequencing (NGS) is one of these recent techniques that, despite their ability to only produce very short reads, has generated a huge number of sequences available at low cost to explore microbial structure with higher resolution [29], and its changes under environmental conditions [30].
This research will assess the structure of microbial communities, that were involved in the anaerobic digestion process carried out under the concept of substrates complementarity. NGS technique was applied to characterize microbial composition and to identify how this was affected by different degrees of inhibiting environments. Based on previous works, the OMW and PE were selected as experiment substrates to attend the purpose. This study is a contribution to the process optimization by means of knowledge of involved microbiota, to improve the efficiency of anaerobic digestion.

2. Materials and Methods

2.1. Substrates Sampling

The olive mill wastewater (OMW) was collected from an olive oil mill located in Rio Maior, Portugal, which works with three-phase continuous extraction process.
The piggery effluent (PE) was obtained in VALORGADO Company (Salvaterra de Magos, Portugal). The effluent produced in the piggery was directed to a solid-liquid separator device, located outside in the farm, which is later sent to the stabilization ponds. The liquid fraction supplied, was free of most of the solids content and was used as the substrate in this study.

2.2. Anaerobic Digestion Experimental Set-Up

The experiment was carried out in triplicate under batch conditions, using 165 mL-glass vials with a useful volume of 40 mL and leaving 125 mL of headspace. Table 1 shows all the mixtures tested and the process experimental time.
Anaerobic conditions were ensured by de-aerating mixtures and vials with nitrogen gas and sealing. The test units were incubated at constant temperature of 37 ± 1 °C.

2.3. Analytical and Chromatograph Methods

Performance of the process was monitored by analytical characterizations of all samples and by the volume and quality of the obtained biogas. Total and volatile solids (TS, VS), chemical oxygen demand (COD), total nitrogen (Kjeldahl, TN), ammonium (NH4+-N), and pH, were assayed according to standard methods [31]. The total content of phenols was determined by a colorimetric method [32], using caffeic acid as the standard for the calibration curve. To measure the antioxidant capacity, a radical scavenging activity of samples against a stable DPPH radical (2,2-diphenyl-2-picrylhydrazyl hydrate) method was used [33]. A calibration curve was made using a Trolox 1.5 mM solution as the standard antioxidant (dissolved in ethanol), made in triplicate. The radical activity was calculated following antioxidant activity Equation (1):
%DPPH inhibition = [(Absb − Abss)/Absb] × 100
where: Absb is the absorption of blank (t = 0 min), Abss is the absorption of tested sample (t = 30 min). The antioxidant activity was expressed in TEAC (Trolox Equivalent Antioxidant Capacity). The decreasing of the DPPH solution absorbance indicated an increase of the DPPH radical-scavenging activity [34].
Analytical measures of described parameters were performed at the beginning (IN) and at the end (OUT) of the assay experimental time. The biogas production was monitored daily with a pressure transducer, expressed to standard conditions of temperature and pressure (STP: 0 °C, 1 bar) defined by IUPAC (International Union of Pure Applied Chemistry). The methane content of biogas, collected in each unit headspace, was measured by the injection of 0.5 mL gas sample weekly into a gas chromatograph (Varian CP 430-GC), equipped with a thermal conductivity detector and a Porapack S column of 1/8′’x 3 m. Column, injector, and detector temperatures were 50, 80, and 100 °C, respectively. Nitrogen was utilized as the carrier gas (20 mL/mn). Quantification of each gas produced was performed by comparing the obtained graphical peak areas with patterns of an injected gas mix at the beginning of each analysis. Volatile fatty acids (VFA) were evaluated by using a gas chromatograph (Hewlett Packard 5890), furnished with a flame ionization detector and a 2 m × 2 mm Carbopack B-DA/4% Carbowax 20 M (80–120 mesh) column. Nitrogen was the carrier gas (30 mL/mn). Temperature of the column, injector, and detector was 170, 175, and 250 °C, respectively. Total VFAs (acetate, propionate, butyrate, iso-butyrate, iso-valerate, and valerate) concentrations were expressed as acetic acid.
The biogas production was followed for about 73 days. All values of methane yield (L CH4/kg SVin) are presented under STP conditions and divided by the mass of volatile solids of substrate fed in the beginning of the assay. The primary energy yield (kWh/kg VSin) of the tested mixtures was calculated using the lower methane heating value of 9.97 kWh/m3 CH4.

2.4. Molecular Analysis

2.4.1. DNA Extraction and MiSeq Sequencing (Next-Generation Sequencing, NGS) of 16S rRNA Gene Amplicons

An aliquot of each sample, in triplicate, was collected at the beginning (IN) and at the end (OUT) of the experiment, was merged and homogenized for DNA extraction and molecular analysis. DNA extraction was made as described by Zhou et al. [35] and adapted for these samples by Eusébio et al. [7]. After chloroform-isoamyl alcohol steps, add 0.01 volume of 10 mg/mL RNAse. The aqueous phase was precipitated with 0.6 volume of isopropanol and 0.1 volume of 2.5 M C2H3NaO2 solution and was kept at −20 °C for 1 h. The pellet of crude nucleic acids was recovered by centrifuging at 12,800× g for 20 min. Then, cold ethanol 70% was added, left overnight at −20 °C, centrifuged at 12,800× g for 20 min, and resuspended in TE solution (10 mM Tris.HCl, pH 7.5, 1 mM EDTA). The extracted DNA was pooled, quantified, and checked for purity using QubitTM (Thermo Fisher Scientific, Wilmington, USA) prior to storage at −20 °C.
NGS was performed at STAB VIDA facilities (Lisbon, Portugal). For NGS, V3 and V4 regions of bacterial and archaeal 16S rRNA gene were amplified with universal primers 515F (GTGCCAGCMGCCGCGGTAA)—806R (GGACTACNNGGGTATCTAAT). Library construction was performed using the Illumina 16S Metagenomic Sequencing Library preparation protocol [36]. The generated DNA fragments (DNA libraries) were sequenced with MiSeq Reagent Kit v3 in the lllumina MiSeq platform, using 300 bp paired-end sequencing reads.

2.4.2. Data Analysis

The bioinformatics analysis of the generated raw sequence data was carried out using the Quantitative Insights into Microbial Ecology (QIIME2, version 2018.11) [37]. The reads were denoised using the Divisive Amplicon Denoising Algorithm 2 (DADA2) plugin [38], where the following processes were applied: Trimming and truncating low quality regions; dereplicating the reads; filtering chimeras. After denoising, the reads were organized in features, which are operational taxonomic units (OTUs), and a feature table was generated using the plugin feature-Table (https://github.com/qiime2/q2-feature-Table), with each feature being represented by exactly one sequence. After applying the plugins Alignment [39], Phylogeny [40], and Diversity (https://github.com/qiime2/q2-diversity), a pre-trained sk-learn classifier [41] based on the SILVA [42] (release 132 QIIME) with a clustering threshold of 97% similarity was applied to generate taxonomy tables. Taxonomic classification was achieved by using the plugins Feature-classifier (https://github.com/qiime2/q2-feature-classifier) and Taxa (https://github.com/qiime2/q2-taxa), where only OTUs containing at least 10 sequence reads were considered as significant. The sequencing reads were deposited into the NCBI short reads archive database (SRA Accession Number: PRJNA697960).

3. Results and Discussion

3.1. Chemical Composition of Effluents

OMW and PE are substrates that contain very high concentrations of organic compounds (106 and 93 g/L COD, respectively), as shown in Table 2, what indicates a great potential for the production of biogas/methane. In addition, the composition of these effluents has characteristics that complement each other, mainly in terms of acidity and nitrogen contents (Table 2 and Table 3), allowing the joint mass in digestion to present characteristics that are favorable to a better and fast start/development of the anaerobic process.
Both effluents have a VFA composition that includes several different acids, yet comparatively, OMW presents the acetic acid as the main component (about 40%, Table 3) and a total VFA concentration much lower than PE (0.55 versus 5.64 g/L Aac). If, on the one hand, the main OMW compounds are preserved in the oil produced and may therefore be found in smaller quantities in the oil production effluent, on the other hand, the high concentrations of the different acids contained in the PE, such as propionic, isobutyric, and butyric acid, denounce some degradation of the collected flow, which probably results from the way of handling the piggery effluent given its passage through a solid-liquid separator to remove the solids.
The inhibitory ability of OMW due to the total phenols content of about 3 g/L, associated with the acidic pH, can be minimized by the addition of PE, which presents a smaller concentration on phenols (0.9 g/L) and a neutral/basic pH value. The latter effluent is also characterized by a good antioxidant activity, with more than 80% inhibition of the radical (Table 4).
The chemical composition of OMW is in line with the average composition found in literature (e.g., [3,43]). PE is an atypical effluent since its content in organic matter and nitrogen is higher than values reported by other authors (e.g., [44,45]). This can be explained by the conditions of raising the animals and the effluent management carried out in this farmhouse in which, as mentioned, the solid fractions of the PE, mainly lignocellulosic materials, were previously removed from the flow.

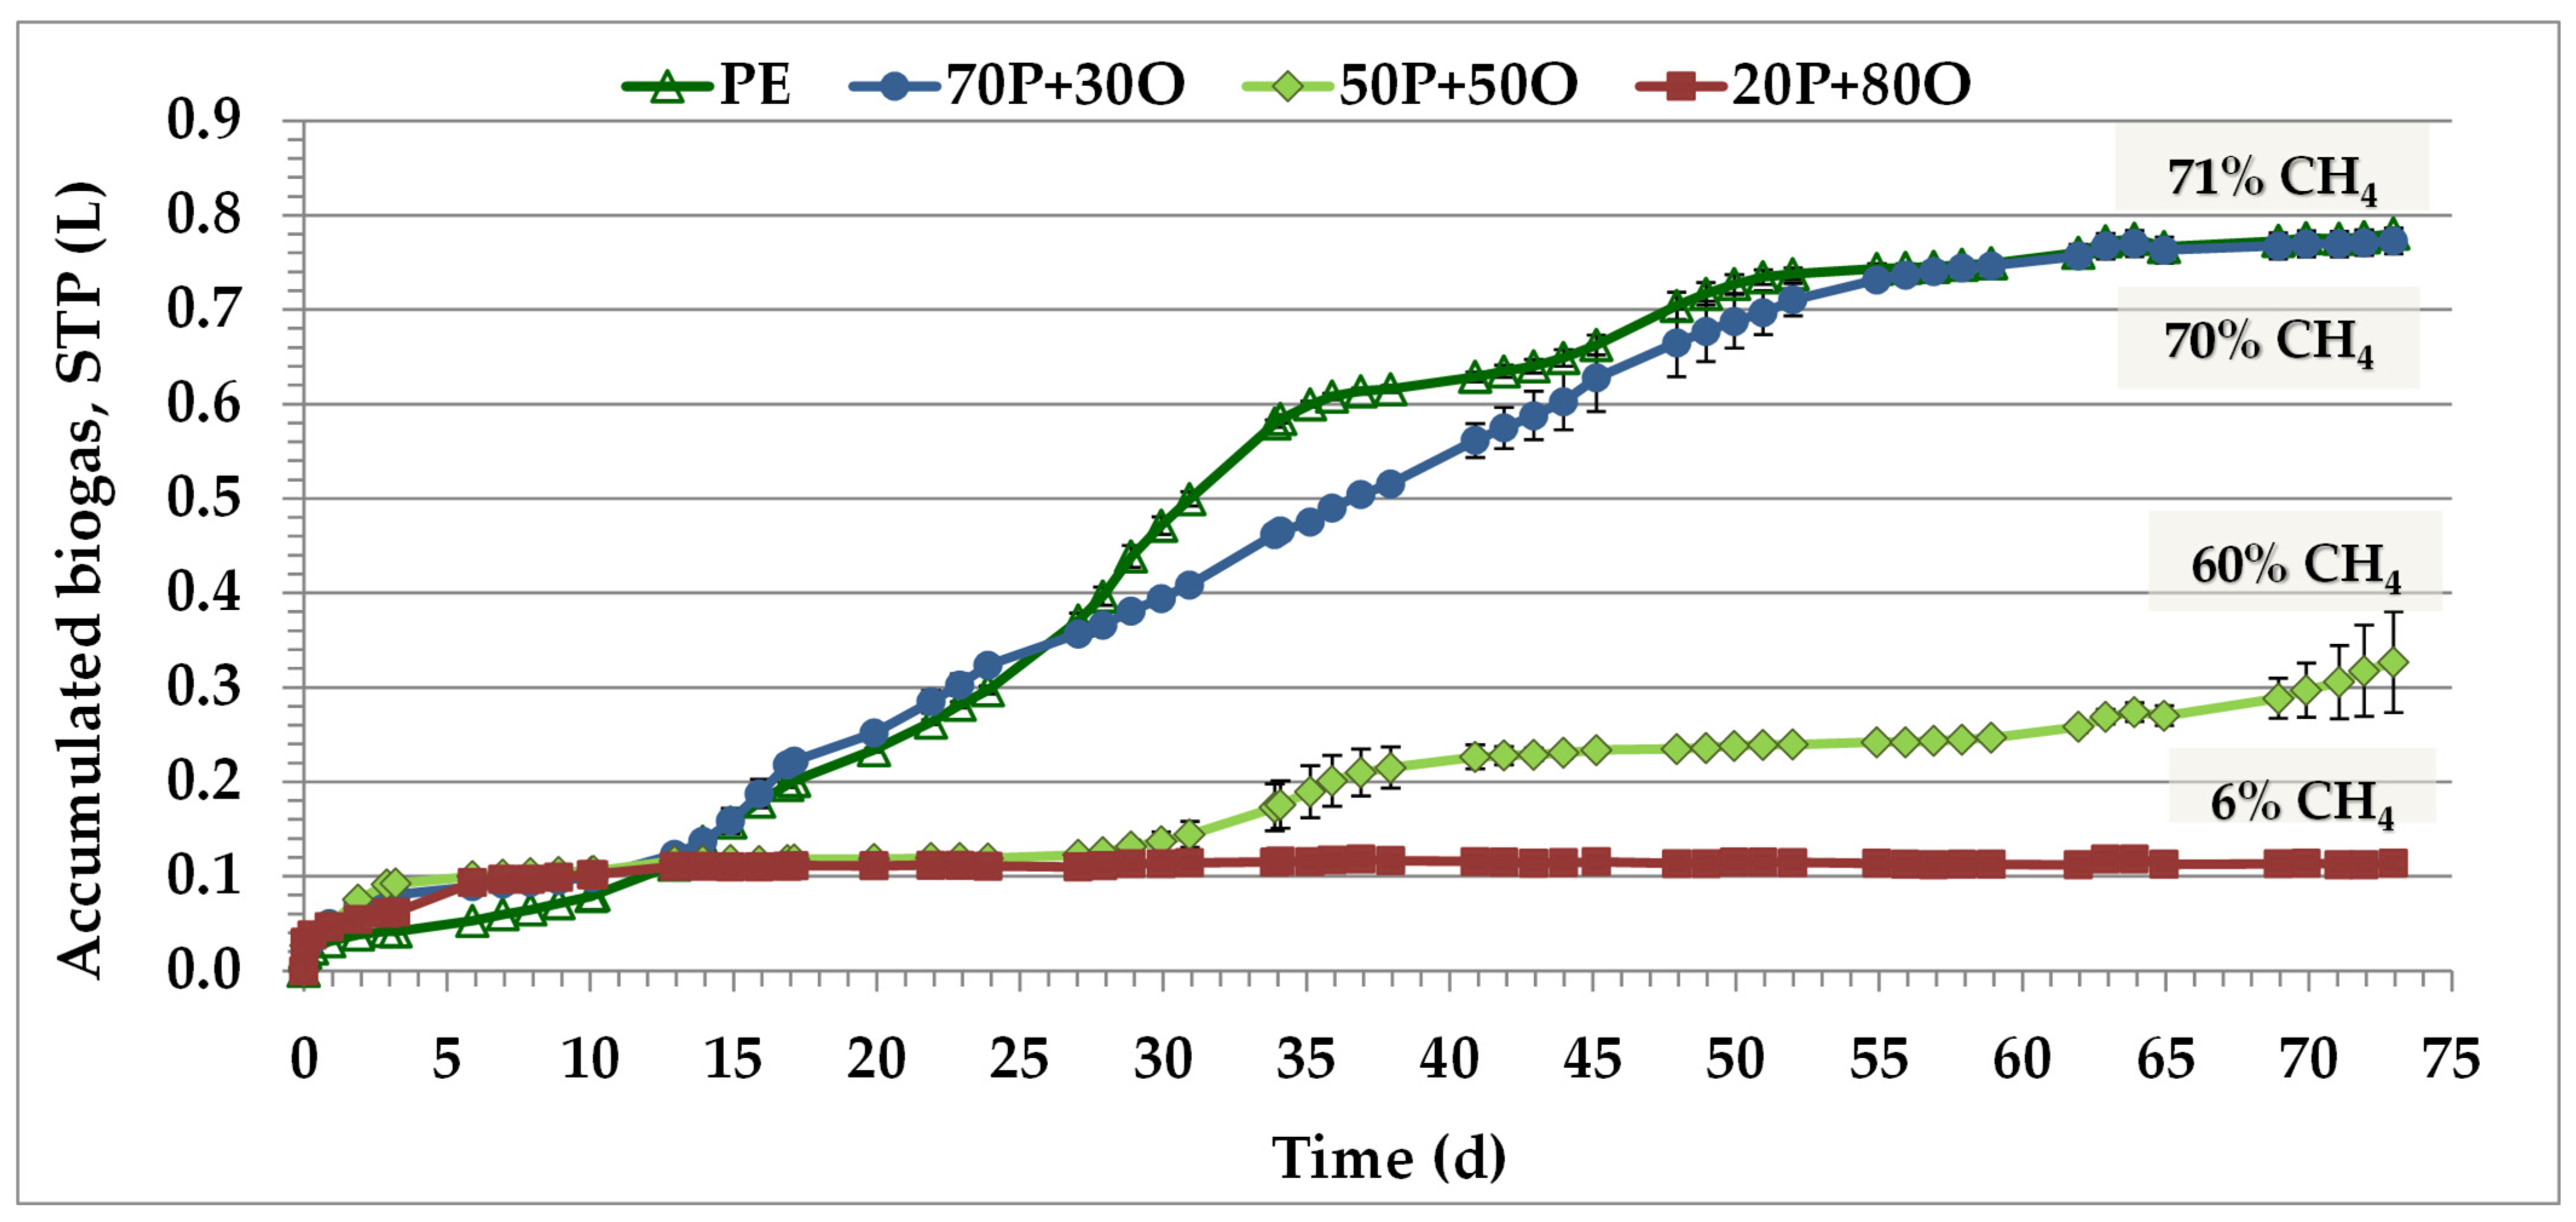
3.2. Anaerobic Digestion of PE and OMW Mixture

Cumulative biogas production was registered in all tested mixtures without any “lag” phase (Figure 1) and around 0.12 L was obtained in all units, 13 days upon start-up. From then onwards, it was observed that the units containing 70P + 30O and PE reached the highest volumes in cumulative biogas (about 0.78 L) and with the best gas quality of the entire experiment (70–71% CH4). Comparatively, the better behavior showed by 70P + 30O mixture than by PE (Figure 1) suggests that PE is an unbalance substrate and may contain inhibitory components for the anaerobic process. Effectively, the slow evolution in biogas production that was observed at the beginning (around the first 10 days), indicates that some biomass adaptation process occurred. Subsequently, the sharp drop in biogas after day 34 still suggests a limitation in the load degradation capacity. Units with 50P + 50O presents a typically diauxic curve, with two clearly distinct growth phases. First, a stable period without increasing biogas production was maintained for a period of about 20 days, reaching a volume of 0.22 L, approximately. Then, more biogas was produced until the end of the assay and values of around 0.33 L were obtained. This performance can be understood as the result of the sequential metabolization of substrates, simultaneously with the adaptation of microorganisms to degrade the polyphenols present in OMW. In consequence, substrates were more available for biogas producers, as methanogens. This inhibition phenomenon is clear evident in the digestion of 20P + 80O mixture, where biogas volumes and methane proportion remained very low throughout the experiment (0.12 L cumulative biogas with 6% CH4).
The highest percentages of PE (≥70%) in the mixture provided greater organic matter removals (63–75% COD, 17–21% TS, 29–36% VS, Table 5). On the contrary, the proportion increase of OMW in the mixture has a negative effect on the performance of the anaerobic treatment, showing how strong the inhibitory capacity of this effluent is on the microbial process only standing a small proportion of about 30% in the mixture with PE. On the other hand, it is interesting to note that the inhibitory effect caused by OMW seems to have been compensated through the balance found in the complementarity with acidity and nutrients, therefore the mixture 70P + 30O provided better results in the removal of solids and COD (Table 5) than PE without mixtures. The mitigating inhibitory effects were also reported when complementary substrates were anaerobically digested [46].
Concerning polyphenols, an increase in concentration was observed as the OMW volume rose in the substrate, as was expected to occur (Table 6). The PE and 20P + 80O mixtures showed the lowest removal values, and despite the small initial phenolic concentrations of PE, the microorganisms did not display the ability of removing them. On the other side, the highest concentration of phenolic compounds in 20P + 80O mixture prevented the removal process due to high inhibitory effect of OMW. Anaerobic process of 70P + 30O and 50P + 50O mixtures provided the best results in removing the phenolic compounds (35% and 30%, respectively), indicating that their microbial consortia were able to degrade this kind of molecules, however, comparing the biogas volumes production, the 50P + 50O units needed about 27 days to start to accumulate gas and, probably, to degrade part of the initial phenolic compounds present in a higher concentration than in the 70P + 30O digesters (2.2 versus 1.7 g/L).
Some phenolic compounds have antioxidant activity due to their chemical and functional characteristics, not exactly because of the amount they are found in the sample. At the beginning of the experiment, the TP values increase with increasing OMW concentration in the mixture, 0.9 up to 2.7 g/L (Table 6), but the antioxidant activity remains constant, and the DPPH inhibition slightly decreases. This observation suggests the maintenance of compounds with antioxidant activity in all mixtures (about 1 mmol TEAC), and that the quantity of phenolic compounds with DPPH inhibitory capacity is much higher in the PE and 70P + 30O samples (81% and 79%, respectively). After anaerobic digestion, despite the low removal of TP in all samples, the values of DPPH inhibition are in accordance with the antioxidant activity, showing that the anaerobic treatment is a process able to remove or convert phenolic compounds, but it does not eliminate the antiradical power of the digested flows. This aspect was already reported by LaCara et al. [27].
The highest concentrations of nitrogen compounds, both total and ammonium, in the substrate, present in PE units, decreased as the volume of OMW in the mixture was increased (Table 7). In terms of anaerobic performance, it was again found that the 70P + 30O unit showed the highest increment of ammonia nitrogen after anaerobic digestion, indicating the existence of a balanced microbial population capable of degrading the organic matter.
All assay mixtures presented almost neutral pH that varied from 6.2 (20P + 80O) to 7.3 (PE) before anaerobic digestion (Table 7). At the end of the process, except for 20P + 80O, the increase in pH suggests the medium conditions for the effective removal of acidic compounds. PE acted as a buffer solution during the experiment due to the presence of high nitrogen content, counteracting the acidic nature of OMW (pH = 5.1, Table 3). The presence of PE in 70P + 30O helps to maintain the medium pH in values appropriate to the development and maintenance of the anaerobic process despite the high VFA concentrations in the substrate (3.9 g/L). On the contrary, 20P + 80O presented a lower quantity of acids than the former but it has a lower proportion of PE and, in addition, the highest concentration of phenolic compounds, which may have contributed to the mixture acidification and justify the acidic pH (5.7) obtained in the digestate.
Regarding VFA, PE digestion was able to reduce most acids (85%, Table 7), including the isobutyric and butyric acid (2.2 and 1.6 g/L as acetic, respectively, data not shown), confirming the presence of an active and balanced microbial population (bacteria and archaea) capable of converting these acids into CH4. While in 70P + 30O mixture, more than half of the initial VFA amount (55%) was converted; in 50P + 50O, it does not happen and a VFA concentration increase was observed at the end of the experiment. Indeed, an accumulation of VFA with a larger chain than acetic acid (propionic, isobutyric, and butyric, at concentrations of 3.1, 0.93 and 0.53 g/L, respectively, data not shown) was registered in the digested 50P + 50O mixture. This unexpected result reveals that although the process was not able to convert the acids that have accumulated, it has not been completely inhibited. Looking at the behavior of 50P + 50O in Figure 1, it is observed that these units do not present any stabilized production line (plateau) at the assay end, as seen in other cases, but a notable growth trend in the biogas production in the final stage. In line with the previous comments, this performance can be regarded as the result of some substrates degradation, after a slow adaptation period of microbial population, where the VFA may be included. Given this composition of the substrates, following Table 3, it is clear that acetic acid is the main component of VFAs in OMW, while PE has higher concentrations in longer chain acids than acetic acid: 39% versus 61% (OMW) and 25% versus 75% (PE) in acetic versus propionic, isobutyric and butyric, respectively. It is expected that as the amount of OMW in the mixture rises, the proportion of acids favorable to the development of the process, mainly composed by acetate, will increase and the conditions for its conversion will improve. In fact, the acetic acid content corresponds to increasing percentages of total acids (expressed as acetic acid) from 24% to 65% as the volumetric contribution of OMW in the mixtures increased. Concerning the digestates, while the conversion of VFA in acetate increased during the process of PE and 70P + 30O (from 24% and 58% in influent to 83% and 68% in effluent, respectively), it came down in the two other cases, confirming their inhibiting conditions. The most disadvantageous situation was found in 50P + 50O, with values of 59% in influent and 31% in effluent, compared to 20P + 80O mixtures (65% in influent and 57% in effluent).
Similar values were obtained for cumulative methane yield with anaerobic digestion of the mixture 70P + 30O and the sample PE, in which values of 489 and 434 L CH4/kg SVin were achieved, respectively (Table 8). In terms of energy, these substrates presented interesting values (between 4.87 and 4.32 KWh/kg SVin), which are of the same order of magnitude or even better than those reported in anaerobic digestion carried out with other substrates. This is the case of data obtained on the rice husk (4.36 KWh/kg SVin), coffee husk, or potato pulp with 1.78 and 3.99 KWh/kg SVin, respectively [47,48]. The complementarity of pig effluent mixtures containing more than 30% OMW (50P + 50O and 20P + 80O) is of no industrial interest, producing less than 178 L CH4/kg SVin and 1.77 KWh/kg SVin.
The recorded data suggests that the use of OMW to complement PE is feasible and is an advantageous way to provide treatment of both effluents, without additional expenses on substrate chemical correction or dilutions, and generate a digestate and biogas/methane. Despite this, it is only possible if a small proportion of OMW (about 30% v/v) is applied to produce methane in satisfactory amounts and avoid inhibitory effects on the digestion process. At higher volumes, OMW might hinder the microbial population, affecting the treatment.

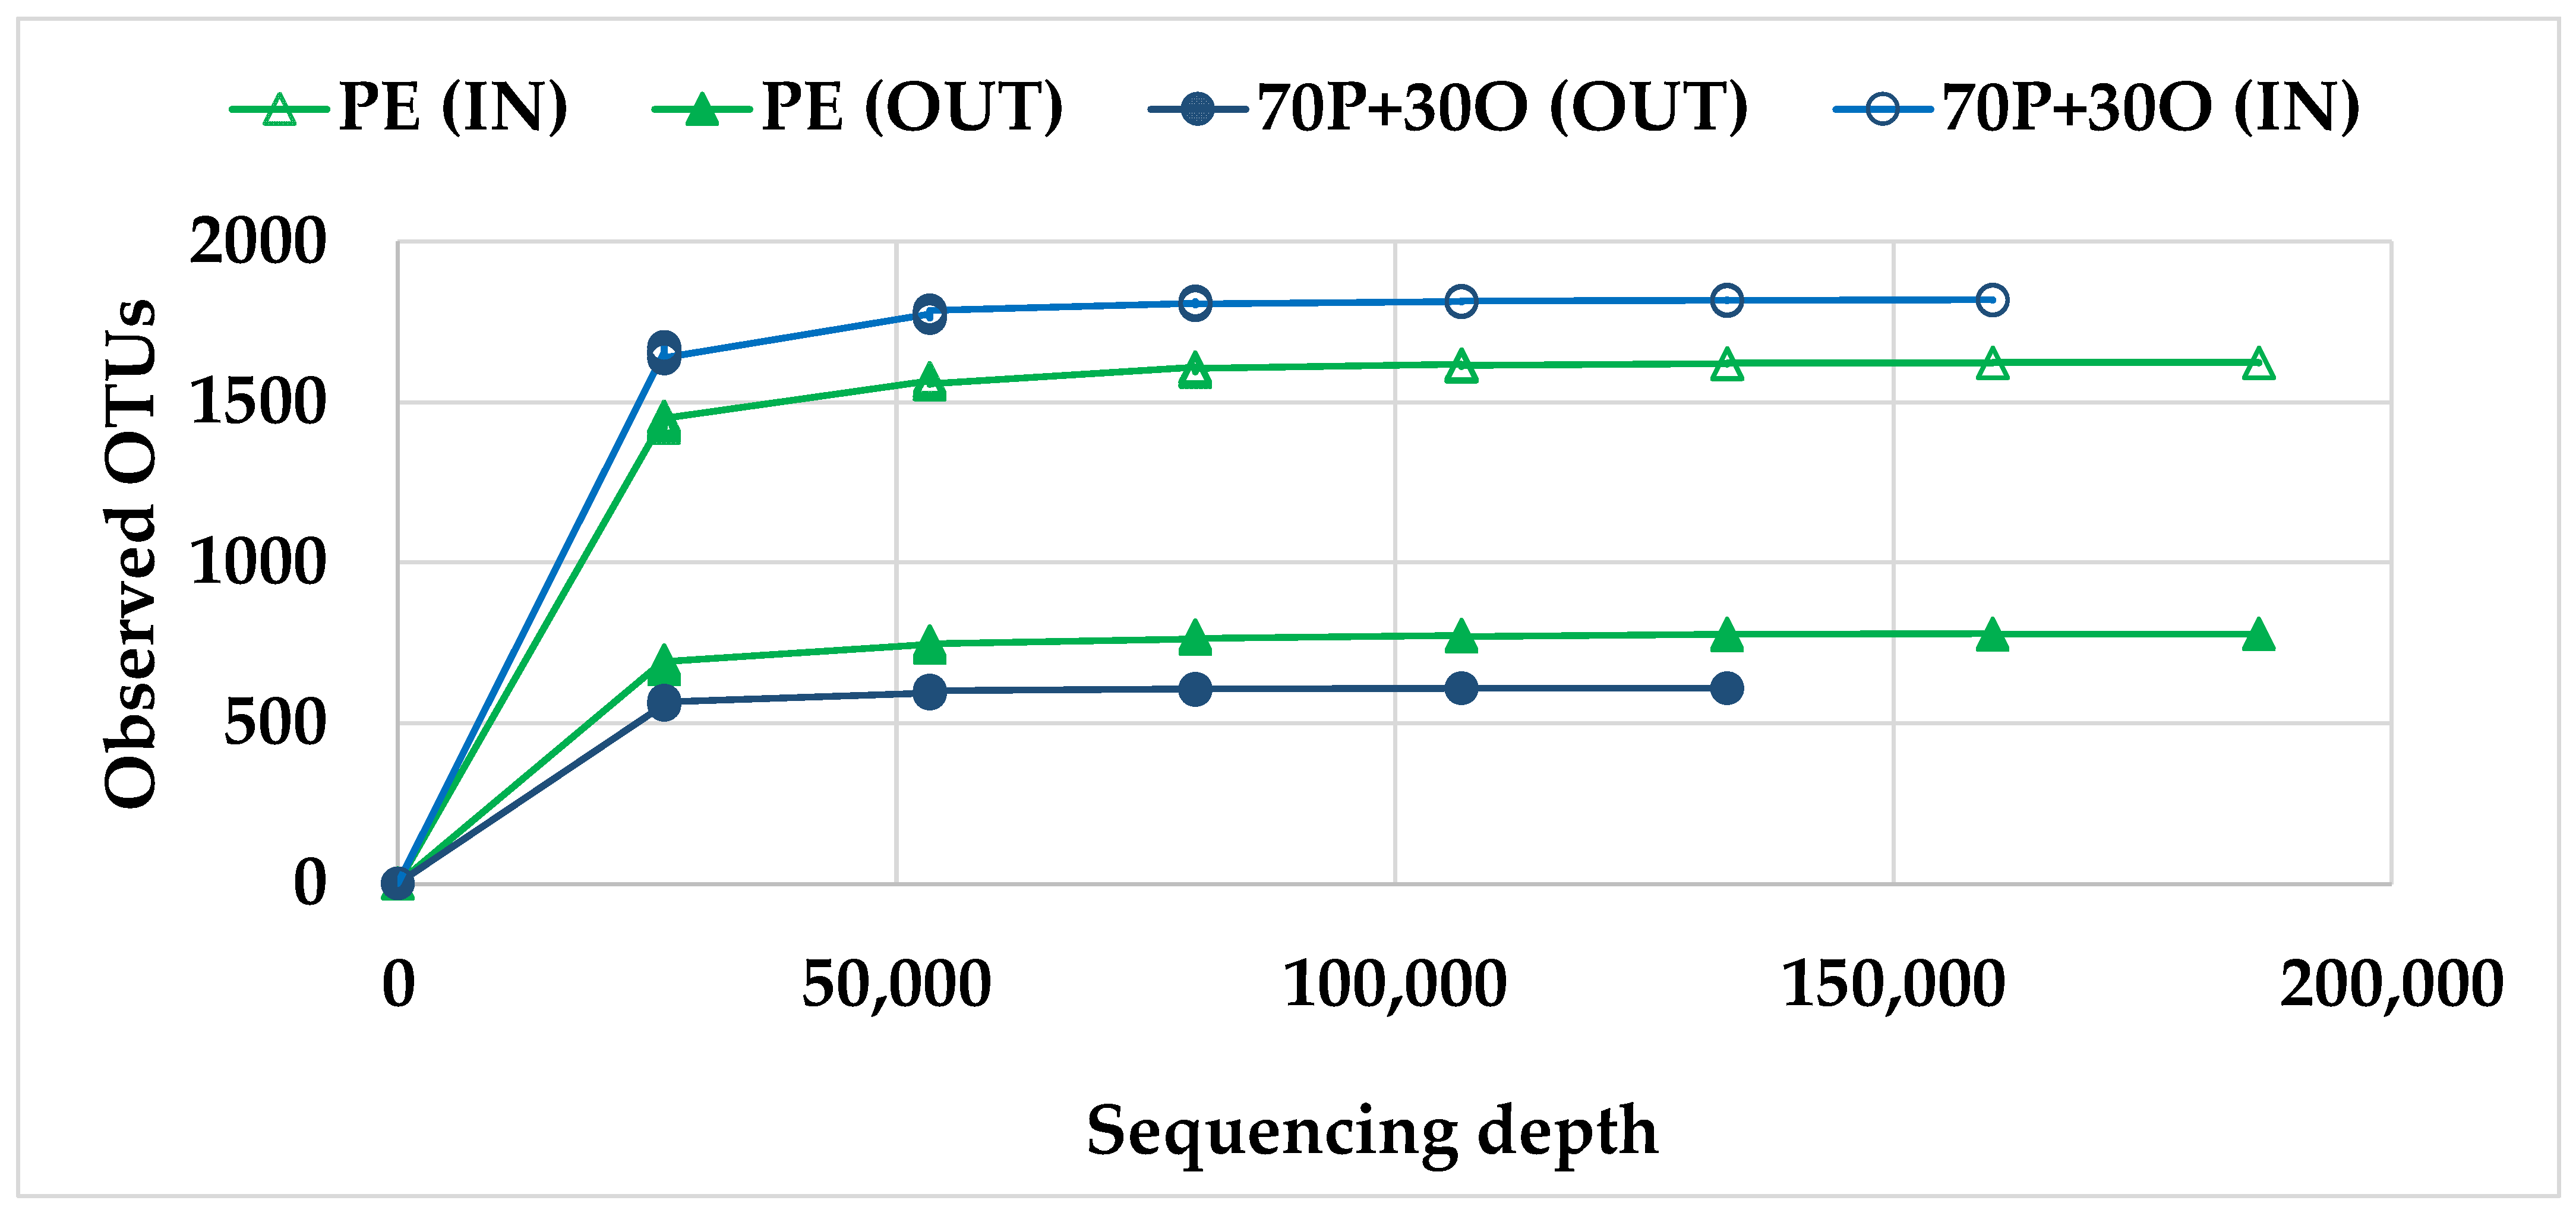
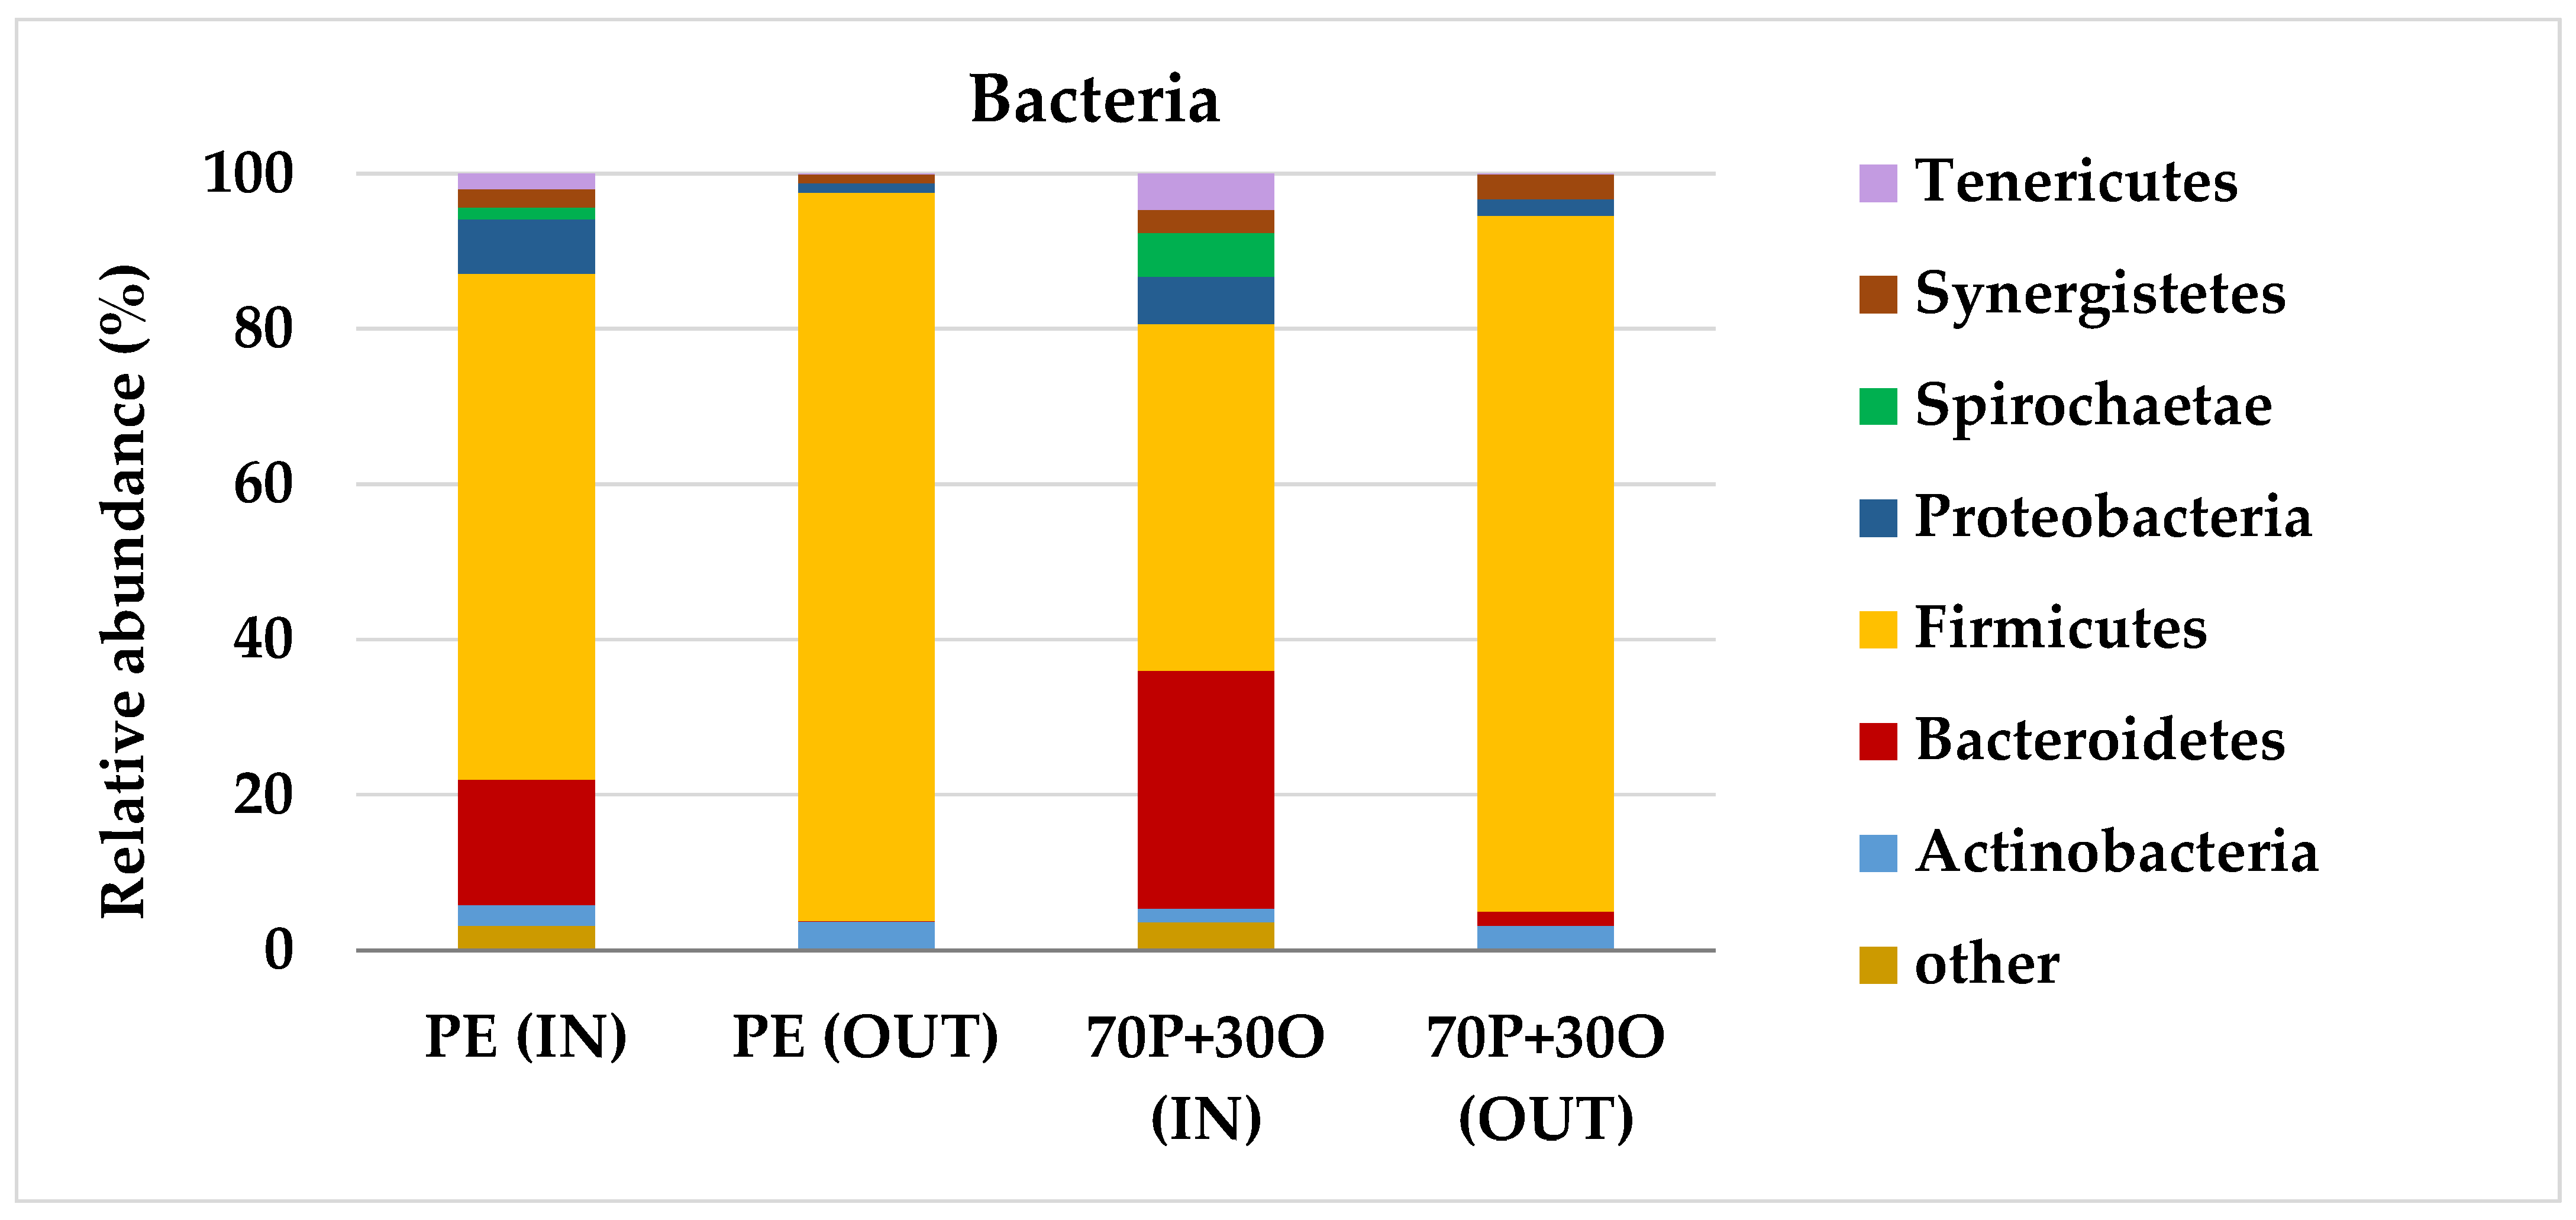
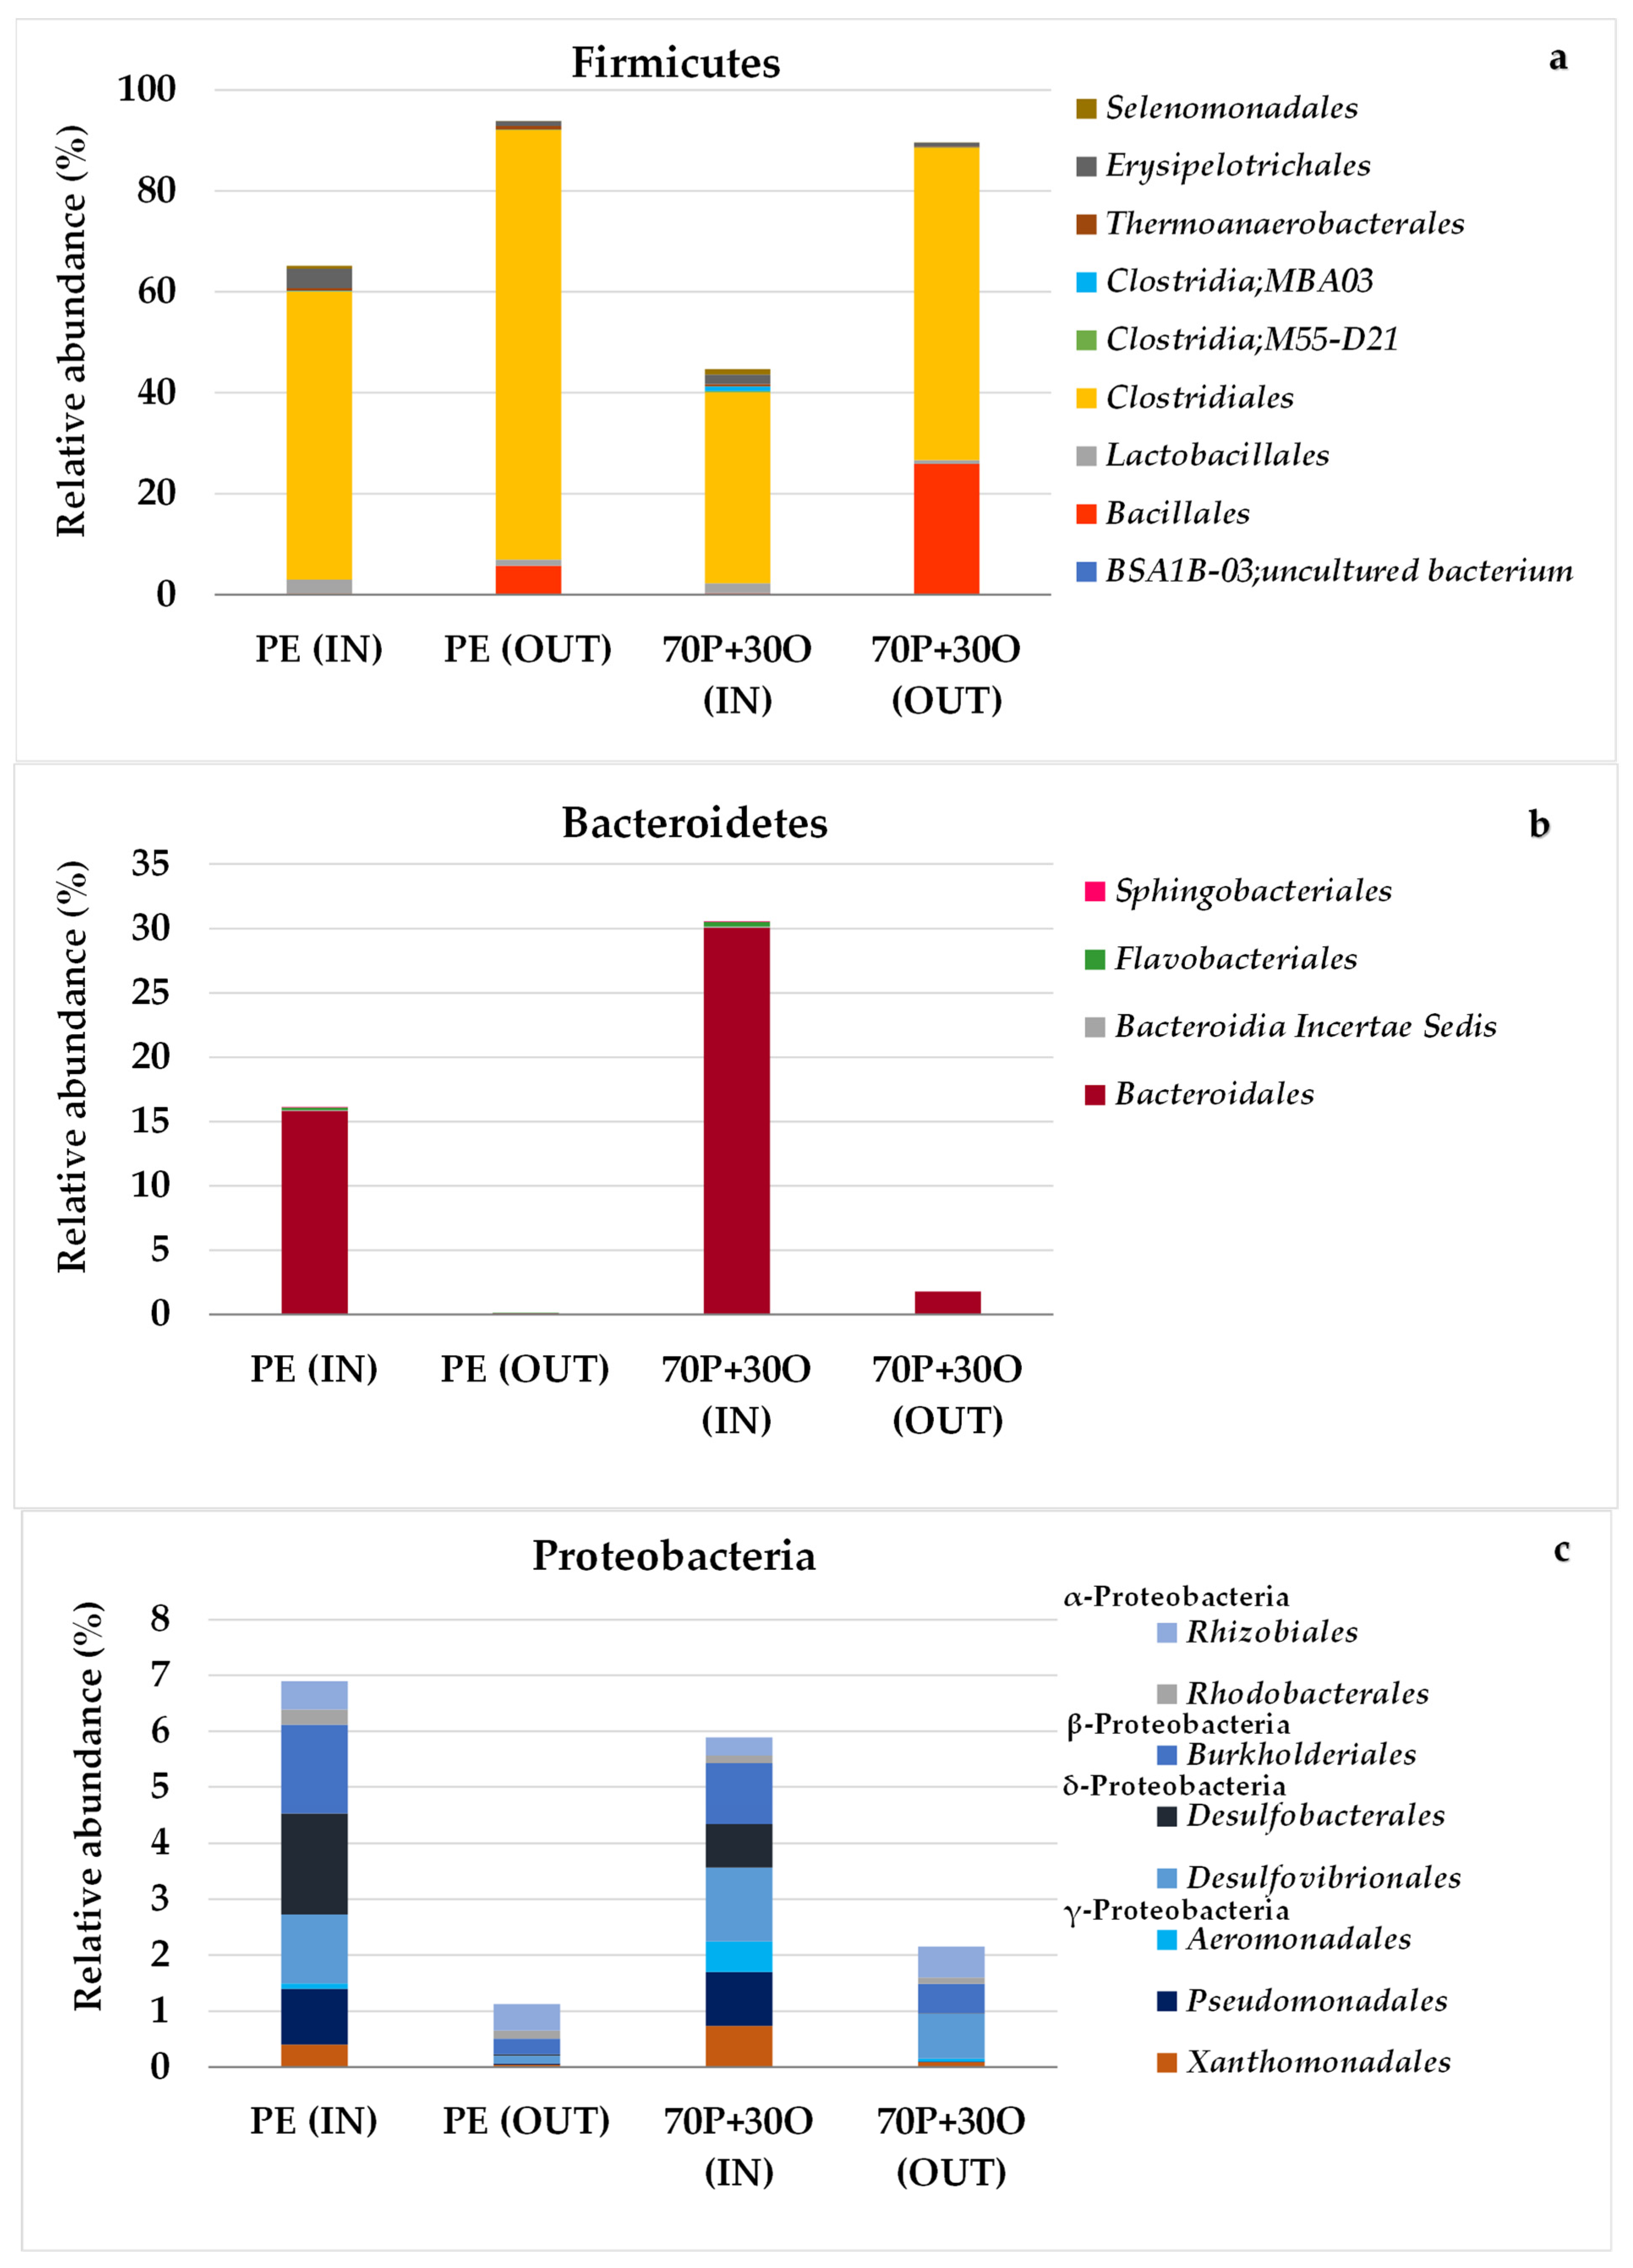
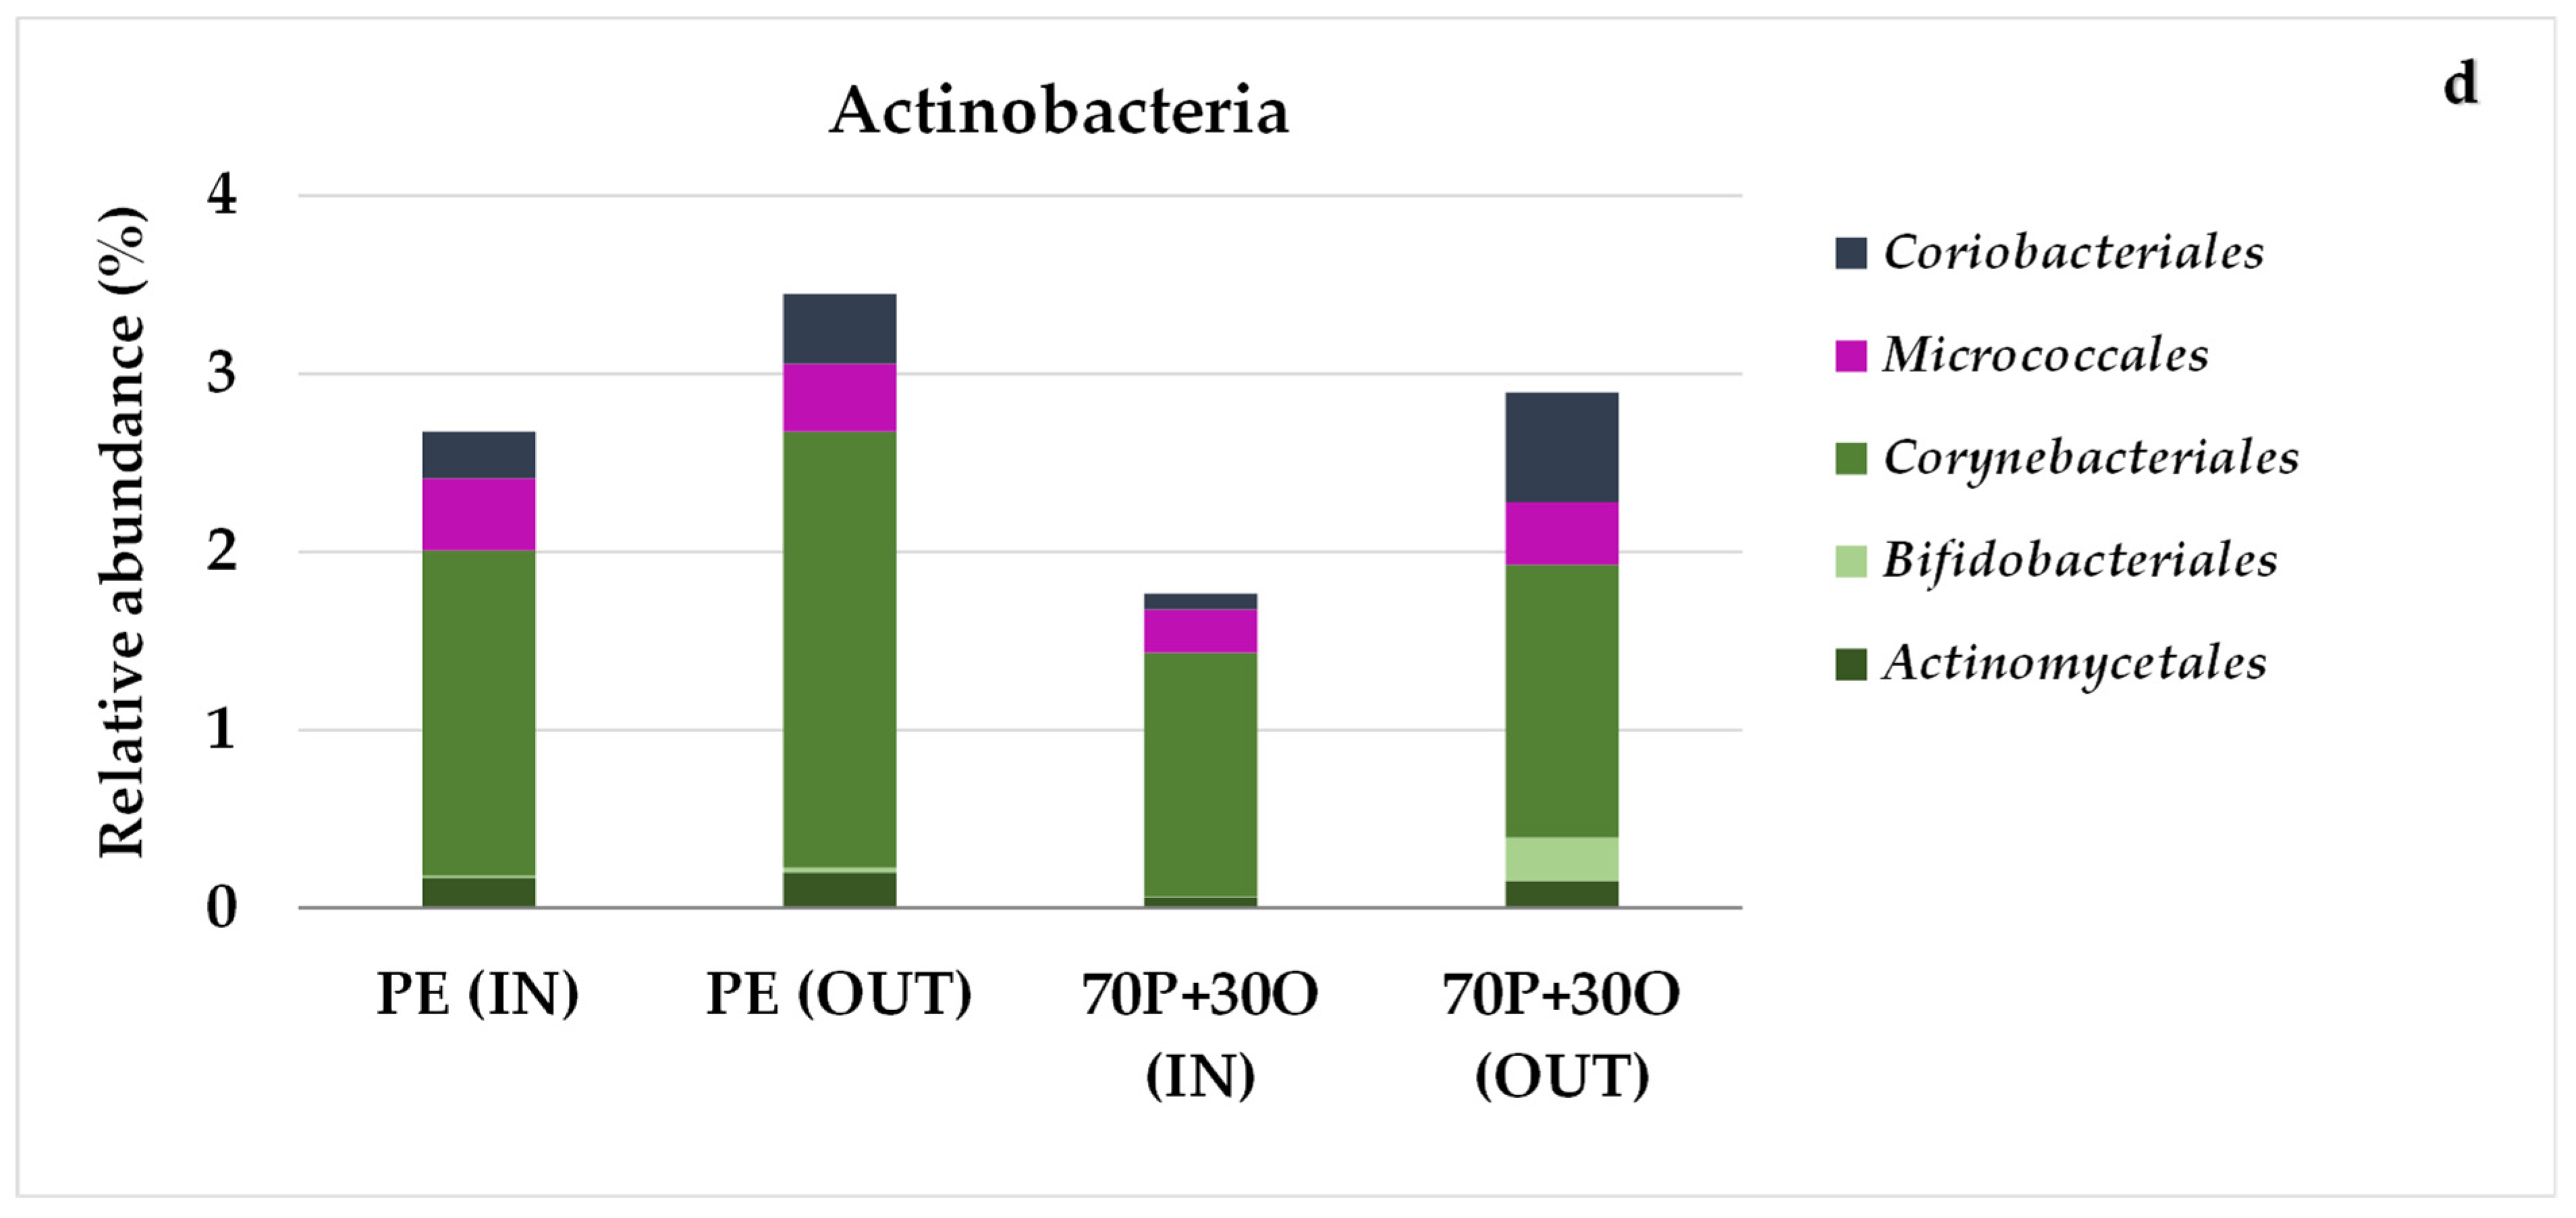
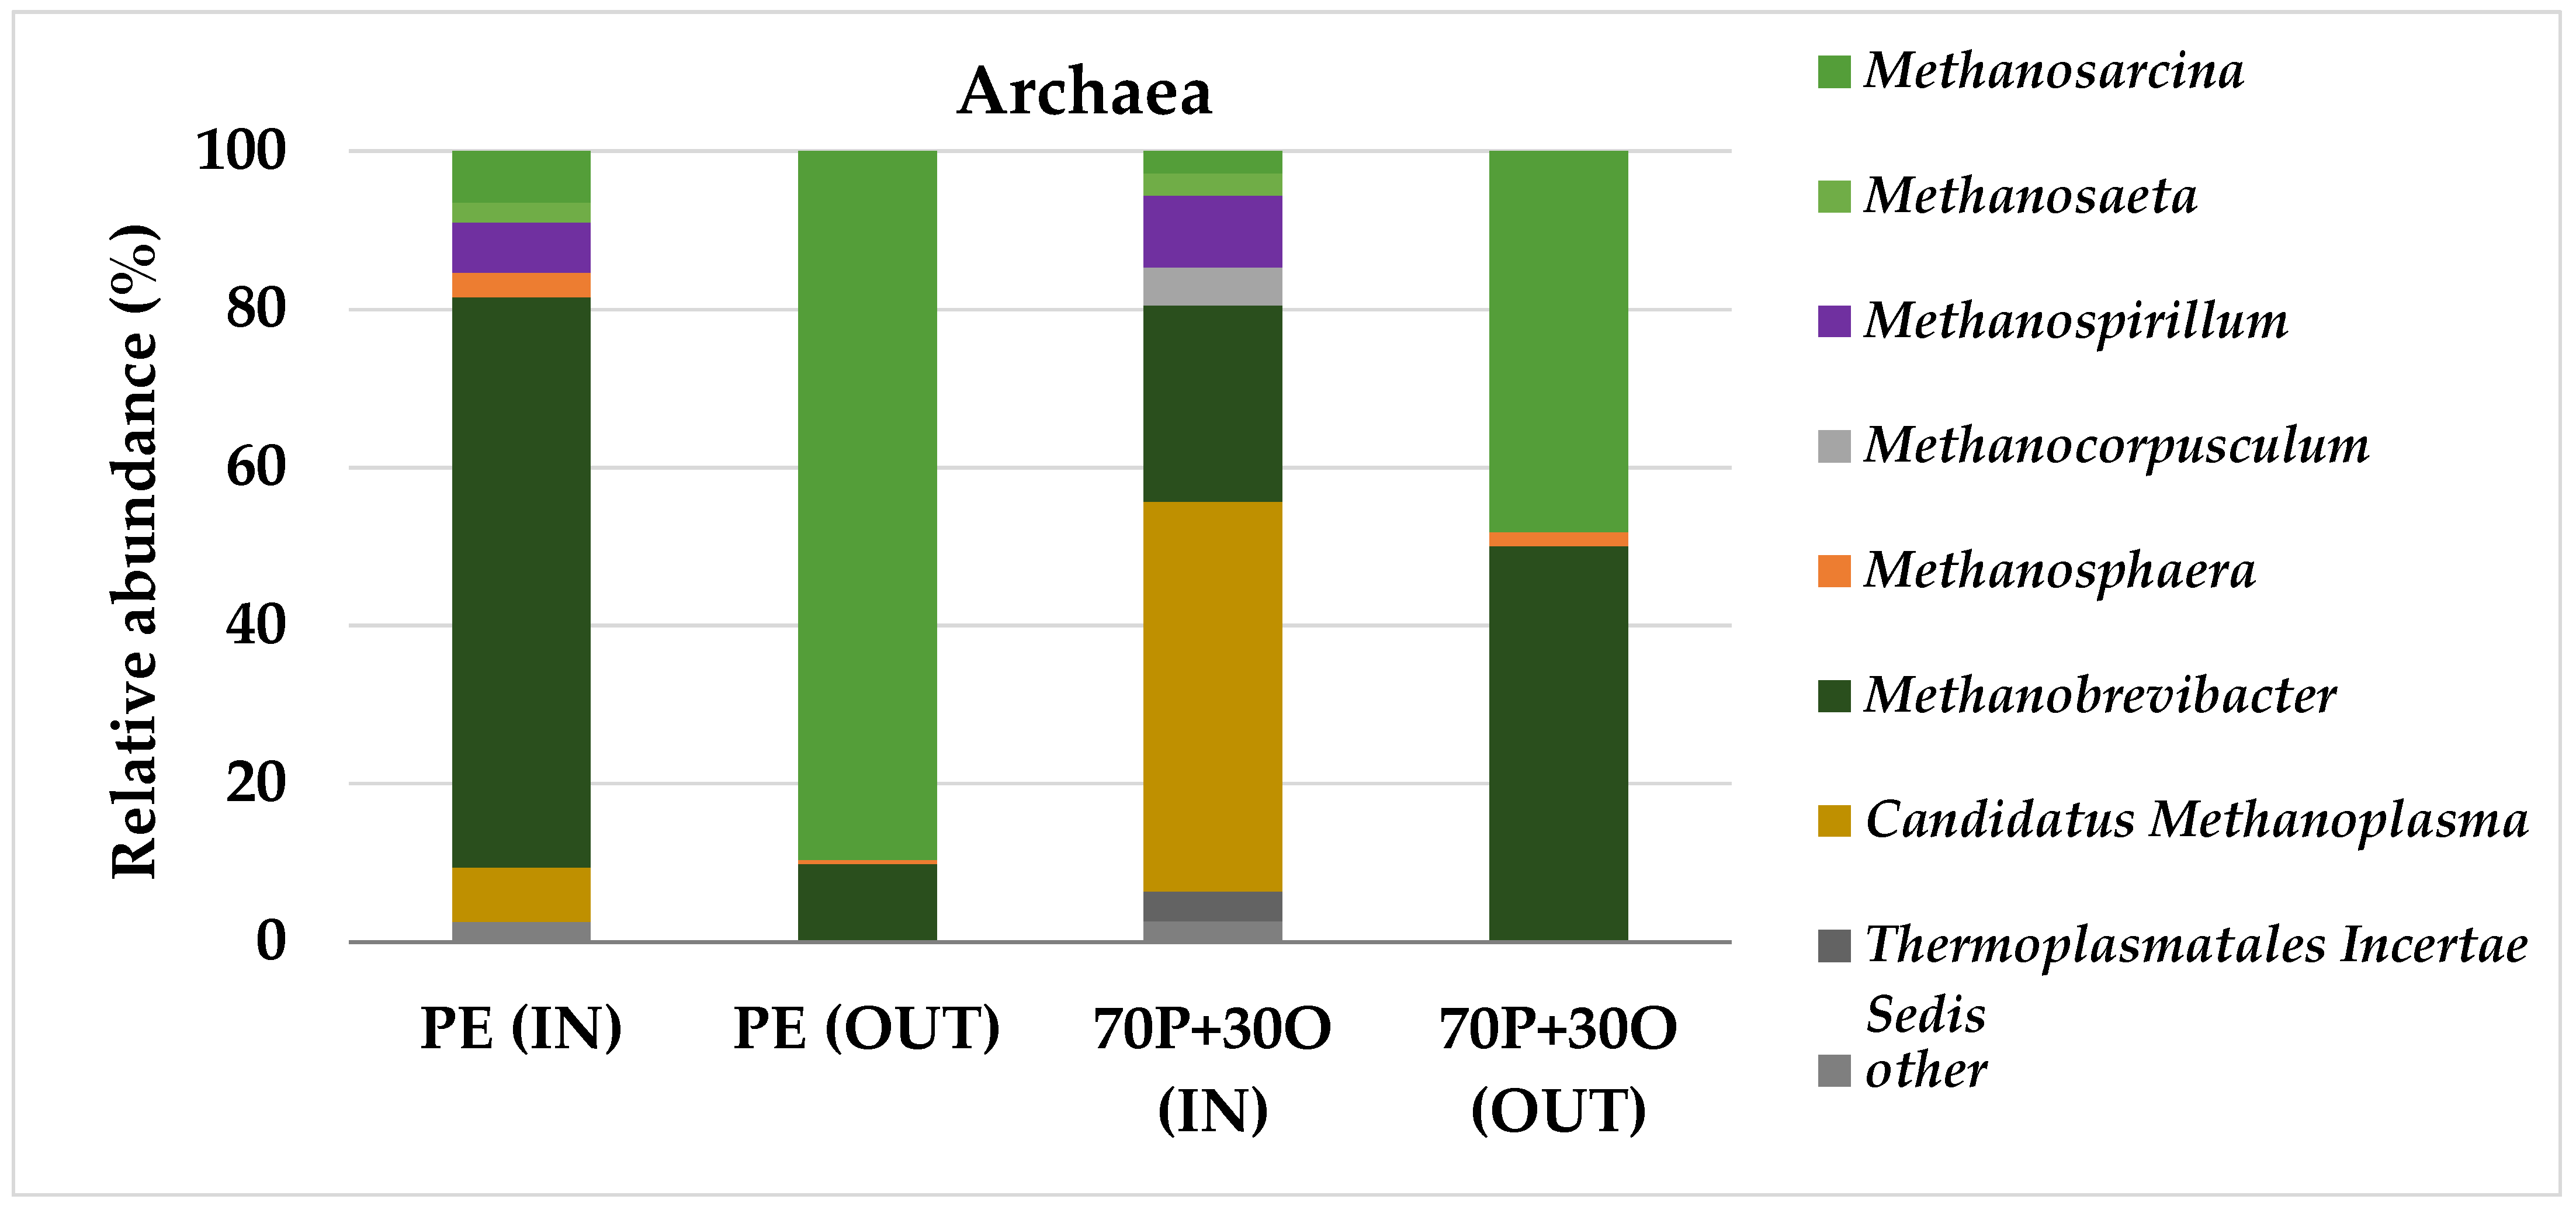
3.3. Molecular Characterization of Microbial Communities

To compare the differences in the distribution of microorganisms, a microbial analysis of samples collected at the beginning (IN) and end (OUT) of the anaerobic digestion was conducted. Samples for microbial characterization were selected according to the best biogas/methane production, PE and 70P + 30O (IN and OUT).
After NGS analysis of microbial communities, the samples generated between 615,732 and 679,254 raw sequence reads, which corresponded to samples 70P + 30O (IN) and PE (OUT), respectively. A total of 723,289 sequences (721,887 bacterial and 1402 archaeal) were retrieved and analyzed. Libraries containing all samples were composed of a total 2522 OTUs (Table 9). Samples collected after anaerobic digestion (OUT) exhibit lower diversity indices than samples at the beginning of the assay (IN), which is confirmed by Shannon–Wiener index in Table 9. The decrease observed in index values for both samples, during anaerobic digestion period, confirms the occurrence of the microbial acclimation to these samples, to a good performance reactors achievement. The greater microbial diversity, both bacterial and archaeal, observed in the 70P + 30O mixture samples, justifies the higher methane yield and COD removals obtained for these samples.
In the case of microbial diversity analysis, it is necessary to know whether the number of reads of the sequencing reaches a reasonable amount so that more sequencing does not significantly increase species diversity. Figure 2 indicates that, with 97% similarity levels, the rarefaction curve was asymptotic, that is, a flat portion of observed OTUs was attained, representing that the sequencing was sufficient for all samples, and the dataset of sequences had thoroughly sampled diversity in this analysis and sufficient sequence depth was achieved.
As expected, bacteria predominated the microbial populations in all samples, accounting for more than 99.7% of relative abundance at domain level (Table 10). The discrepancy found between bacteria and archaea is usual, real, and has already been reported by other authors in anaerobic digestion processes [49,50,51]. After anaerobic digestion, relative abundance of archaeal domain decreased, being the most pronounced reduction observed in the mixture containing OMW.
Concerning bacterial sequences analyzed at phylum level, a majority (about 84%) were classified within three main phyla, Firmicutes, Bacteroidetes, and Proteobacteria (Figure 3). Most of the classes within the Proteobacteria were represented, Alpha-, Beta-, Gamma-, and Deltaproteobacteria, Tenericutes, Synergistetes, Spirochaeta, and Actinobacteria sequences were classified within minor phyla. Proteobacteria, Firmicutes, and Bacteroidetes are likely abundant in all anaerobic digestion systems and have been referred to by several authors (e.g., [49,52]). Furthermore, these phyla contain several species that are known to participate in one or more phases of the general anaerobic process. It was interesting to note that, although the samples came from pig effluents, no bacterial sequences (0%) were assigned to Enterobacteriales, indicating that the presence of common enteric pathogens was excluded from these anaerobic digestion reactors.
The predominant populations in PE (IN) were, respectively, Firmicutes (65%), Bacteroidetes (16%), δ-Proteobacteria (7%), and Actinobacteria (3%). In those samples, Clostridiales (57%, Figure 4a) mainly constituted most of the Firmicutes, Bacteroidales (15%, Figure 4b) mainly constituted Bacteroidetes, Desulfobacterales (1.8%, Figure 4c) mainly constituted Proteobacteria, and Corynebacteriales (1.8%, Figure 4d) mainly constituted Actinobacteria.
After anaerobic digestion of PE effluent, the predominance of the phylum Firmicutes increased in the bacterial population to 94% of the total microbiota, and Actinobacteria increased by about 29% (Figure 4a). Synergistetes suffered a decrease of 51%, Proteobacteria, 83%, and the remaining phyla, more than 90% of respective initial values. A similar behavior was observed in the 70P + 30O mixture, but with a more pronounced increase in phyla Firmicutes and Actinobacteria, and a smaller reduction in the phyla Synergistetes and Proteobacteria. The Actinobacteria populations in both essays were mostly represented by Corynebacteriales (Figure 4d), which has the capacity for nitrate reduction and assimilation that enables its growth under anaerobic conditions [53]. At the end of digestion, the Firmicutes’ populations in both essays were mostly represented by Clostridiales (85% in PE and 62% in 70P + 30O, Figure 4a), whose order consisted mainly of members of the families Lachnospiraceae (8% in PE and 9% in 70P + 30O, data not shown), XI (60% in PE and 32% in 70P + 30O, data not shown), and Ruminococcaceae (24% in PE and 42% in 70P + 30O, data not shown). Most of strains in Firmicutes, including Ruminococcaceae, might hydrolyze cellulose, glucose, starch, and proteins, into small molecular organic acids as acetate, highly contributing for improvement of the methane production yield [54,55]. It is worth noting the increase to 26% of Bacillales in the microbial community in the sample 70P + 30O, whose order consisted mainly of members of the family Planococcaceae (87% in PE and 99% in 70P + 30O, data not shown), known as good carbohydrate-utilizing species [54]. The other populations, more specifically Bacteroidetes, known to be proteolytic bacteria, became almost non-existent, suggesting that these two phyla might compete for the same resources and energy. They are known for their ability to degrade complex and recalcitrant organic matter such as proteins, lipids, and cellulose as well as simpler compounds such as amino acids and sugars, using hydrolytic enzymes [52]. Moreover, the high metabolic versatility of Firmicutes and Bacteroidetes suggests that cellulose residues from PE and other complex organic compounds, present in OMW, were degraded to form the acids [49,54,55,56,57,58]. Some Firmicutes are known to be syntrophic bacteria capable of degrading VFAs, such as butyrate and its analogs [52]. Buhlmann et al. [57] already mentioned that Bacteroidetes and Firmicutes have been identified as the main bacterial phyla present within digesters.
Regarding Archaea domain, considerable changes were also observed during anaerobic digestion. Of most archaeal sequences, 99% were classified within the phylum Euryarchaeota, and only nine sequences were assigned to the phylum Woesearchaeota, which were later not detected after anaerobic digestion.
Methanobrevibacter, which was initially the predominant genus on PE sample with a relative abundance of 72%, decreased its population to 10% (Figure 5). Methanospirillum, which represents only 6 and 9% of the archaea sequences assigned to the genus in PE and 70P + 30O samples, respectively, at the beginning of these assays, was not detected at the end of the anaerobic digestion since these microorganisms preferably utilize H2/CO2 over organic acids as substrate.
After anaerobic digestion, Methanosarcina became the predominant populations, increasing from 7% to 90%, in PE samples, while in 70P + 30O, the content of Methanobrevibacter and Mehanosarcina became predominant after the experiment, with relative abundances of 50% and 48%, respectively. The presence of Methanosarcina in the two mixtures suggests methane formation mainly from acetate [56,59,60], and these results are accordingly with the VFA removals (Table 7), indicating that methane production occurred mainly through acetoclastic methanogenesis. Unlike Methanosarcina, Methanosaeta is an obligately acetoclastic methanogen, reported in the literature as predominant in anaerobic digestion systems [49], however, it was detected only at the beginning of the tests, in the PE and 70P + 30O samples, with 2.5% of assigned sequences, and was not detected at the end of the anaerobic digestion. According to Cho et al. [59], this situation can be explained by the difference in maximum specific growth rate (µmax) and half-saturation constant (Ks) between these two genera. While Methanosaeta spp. have a low µmax of 0.20 d−1 and a Ks of 10–50 mg COD/L, Methanosarcina spp. are characterized by a high µmax of 0.60 d−1 and a Ks of 200–280 mg COD/L. As a result, Methanosaeta spp. are known to be dominant at acetate concentrations not exceeding 100–150 mg COD/L, whereas Methanosarcina spp. became dominant at acetate concentrations above 250–500 mg COD/L [61]. Thus, higher concentrations of VFA (especially acetate) seemed to create favorable conditions for Methanosarcina spp. to be dominant. The higher biogas composition in methane (around 70%) in PE and 70P + 30O samples (Figure 1), indicates the presence of an active methanogenic archaea population in both assays. In addition, the greater microbial diversity index of methanogens (2.16 vs. 1.45, Table 9) found in the 70P + 30O samples explains the higher cumulative CH4 yield (489 L CH4/kg SVin) obtained in this assay, relative to PE sample.
A final note must be made regarding the absence of the use of inoculum in this work. In an anaerobic digestion process, it is common and sometimes relevant to use a good inoculum since methane yield is closely dependent on their microbial community composition [58]. From the obtained results, it was demonstrated that one farmer has the possibility to carry out the effluents treatment, under anaerobic digestion conditions, without resorting to pre-treatments, dilutions, and/or corrections of the substrate or needing inoculum. The piggery effluent allowed to balance the composition of OMW while simultaneously it worked as the inoculum of the process. Further studies under batch and continuous anaerobic digestion mode will allow us to confirm the effectiveness and the benefits of the process pointed in this work.
In addition, if OMW is produced in the vicinity of a piggery effluent, it could be valorized in the same plant, in a proportion of about 30% v/v, and contribute to solve advantageously the treatment of that seasonal wastewater, without other correction needs. The complementarity between OMW and PE is beneficial for the stable structure of one microbiota on the effective anaerobic digestion process, this approach bringing financial, social, and environmental advantages.

4. Conclusions

The concept of complementarity of effluents was successfully applied to the anaerobic digestion of piggery effluent, using the olive mill wastewater as complement, under mesophilic and batch conditions. The organic composition of PE allowed to dilute and counteract the toxic compounds of OMW and make the stable conditions for the microbiota, in order to degrade the effluents and produce biogas/methane. The best result was obtained at tested proportions of 30% (v/v) OMW in the mixture containing PE, in which about 0.80 L of biogas (70% CH4) was produced. At these conditions, a methane yield of 489 L CH4/kg SVin and energetic value of 4.87 KWh/kg SVin was reached.
The molecular analysis showed that changes on the structure of microbial communities occurred during the experiments, involving the reduction of the initial population diversity, towards an acclimation to the operational conditions in the anaerobic processes. Organic composition changes, mainly VFAs degradation (in terms of acetic acid) had a clear relation with microbial structure changes during the anaerobic digestion of OMW complemented with PE. At the end of the anaerobic process, the predominant microbial sequences belonging to the best condition (70P + 30O) were assigned to bacterial phylum Firmicutes (90%) and archaeal genera Methanobrevibacter and Mehanosarcina (50 and 48%, respectively). In future studies, it will be interesting to further characterize microbial diversity and its function in terms of substrate complementarity in anaerobic digestion systems.

Author Contributions

Conceptualization, A.E. and I.P.M.; data curation, A.E., A.N., and I.P.M.; formal analysis, A.E. and I.P.M.; investigation, A.E., A.N., and I.P.M.; methodology, A.E., A.N., and I.P.M.; resources, A.E., A.N., and I.P.M.; supervision, A.E. and I.P.M.; validation, A.E. and I.P.M.; writing—original draft, A.N.; writing—review and editing, A.E. and I.P.M. All authors have read and agreed to the published version of the manuscript.

Funding

This research was funded by ERANET-LAC: ELAC2014/BEE0249—SMIBIO project, and ERANETLAC/0001/2014—GREENBIOREFINERY project.

Institutional Review Board Statement

Not applicable.

Informed Consent Statement

Not applicable.

Data Availability Statement

Publicly available datasets were analyzed in this study. This data can be found here: https://www.ncbi.nlm.nih.gov/sra/?term=PRJNA697960.

Acknowledgments

Authors would like to thank VALORGADO (Portugal) and Natália Santos of Olive Mill (Rio Maior, Portugal) for supplying the effluents. Authors would also like to thank Luis Ramalho for the support in gas chromatography and Luisa Roseiro by the collaboration in phenolic compounds characterization. Special thanks to Natércia Santos for laboratory assistance.

Conflicts of Interest

The authors declare no conflict of interest. The funders had no role in the design of the study; in the collection, analyses, or interpretation of data; in the writing of the manuscript; or in the decision to publish the results.

References

  1. Zhang, Q.; He, J.; Tian, M.; Mao, Z.; Tang, L.; Zhang, J.; Zhang, H. Enhancement of methane production from cassava residues by biological pretreatment using a constructed microbial consortium. Bioresour. Technol. 2011, 102, 8899–8906. [Google Scholar] [CrossRef] [PubMed]
  2. FAOSTAT. 2019. Available online: http://www.fao.org/faostat/en/#data/QA (accessed on 15 February 2019).
  3. Dermeche, S.; Nadour, M.; Larroche, C.; Moulti-Mati, F.; Michaud, P. Olive mill wastes: Biochemical characterizations and valorization strategies. Process. Biochem. 2013, 48, 1532–1552. [Google Scholar] [CrossRef]
  4. El Mekawy, A.; Diels, L.; Bertin, L.; De Wever, H.; Pant, D. Potential biovalorization techniques for olive mill biorefinery wastewater. Biofuels Bioprod. Bioref. 2014, 8, 283–293. [Google Scholar] [CrossRef]
  5. Eroglu, E.; Eroglu, I.; Gündüz, U.; Türker, L.; Yücel, M. Biological hydrogen production from olive mill wastewater with two-stage processes. Int. J. Hydrogen Energy 2006, 31, 1527–1535. [Google Scholar] [CrossRef]
  6. Paraskeva, P.; Diamadopoulos, E. Technologies for olive mill wastewater (OMW) treatment: A review. J. Chem. Technol. Biotechnol. 2006, 81, 1475–1485. [Google Scholar] [CrossRef]
  7. Eusébio, A.; Tacão, M.; Chaves, S.; Tenreiro, R.; Almeida-Vara, E. Molecular assessment of microbiota structure and dynamics along mixed olive oil and winery wastewaters biotreatment. Biodegradation 2011, 22, 773–795. [Google Scholar] [CrossRef] [PubMed]
  8. Tsagaraki, E.; Lazarides, H.N.; Petrotos, K.B. Olive Mill Wastewater Treatment. In Utilization of By-Products and Treatment of Waste in the Food Industry; Oreopoulou, V., Russ, W., Eds.; Springer: New York, NY, USA, 2007; Volume 8, pp. 133–157. [Google Scholar] [CrossRef]
  9. Kapellakis, I.E.; Tsagarakis, K.P.; Crowther, J.C. Olive oil history, production and by-product management. Rev. Environ. Sci. Biotechnol. 2008, 7, 1–26. [Google Scholar] [CrossRef]
  10. McNamara, C.J.; Anastasiou, C.C.; O’Flaherty, V.; Mitchell, R. Bioremediation of olive mill wastewater. Int. Biodeterior. Biodegradation. 2008, 61, 127–134. [Google Scholar] [CrossRef]
  11. Rahmanian, N.; Jafari, S.M.; Galamakis, C.M. Recovery and Removal of Phenolic Compounds of Olive Mill Wastewater. J. Am. Oil Chem. Soc. 2014, 91, 1–18. [Google Scholar] [CrossRef]
  12. Bernet, N.; Béline, F. Challenges and innovations on biological treatment of livestock effluents. Bioresour. Technol. 2009, 100, 5431–5436. [Google Scholar] [CrossRef]
  13. Prapaspongsa, T.; Poulsen, T.G.; Hansen, J.A.; Christensen, P. Energy production, nutrient recovery and greenhouse gas emission potentials from integrated pig manure management systems. Waste Manag. Res. 2010, 28, 411–422. [Google Scholar] [CrossRef] [PubMed]
  14. Boopathy, R. Biological treatment of swine waste using anaerobic baffled reactors. Bioresour. Technol. 1998, 64, 1–6. [Google Scholar] [CrossRef]
  15. Hwang, K.; Song, M.; Kim, W.; Kim, M.; Hwang, S. Effects of prolonged starvation on methanogenic population dynamics in anaerobic digestion of swine wastewater. Bioresour. Technol. 2010, 101, 52–56. [Google Scholar] [CrossRef] [PubMed]
  16. Venkiteshwaran, K.; Bocher, B.; Maki, J.; Zitomer, D. Relating Anaerobic Digestion Microbial Community and Process Function. Microbiol. Insights 2015, 8, 37–44. [Google Scholar] [CrossRef] [Green Version]
  17. Cai, L.; Li, H.; Yao, H. A Membership-Fusing Model for Characterizing the Shift of Methanogen Community in a Three-Stage Sludge-Treatment Process. Appl. Sci. 2020, 10, 4274. [Google Scholar] [CrossRef]
  18. Sulbarán-Rangel, B.; Aguirre, J.S.A.; Breton-Deval, L.; del Real-Olvera, J.; Tun, K.J.G. Improvement of Anaerobic Digestion of Hydrolysed Corncob Waste by Organosolv Pretreatment for Biogas Production. Appl. Sci. 2020, 10, 2785. [Google Scholar] [CrossRef] [Green Version]
  19. Gelegenis, J.; Georgakakis, D.; Angelidaki, I.; Christopoulou, N.; Goumenaki, M. Optimization of biogas production from olive oil mill wastewater, by codigesting with diluted poultry manure. Appl. Energy 2007, 84, 646–663. [Google Scholar] [CrossRef]
  20. Dareioti, M.A.; Dokianakis, S.N.; Stamatelatou, K.; Zafiri, C.; Kornaros, M. Biogas production from anaerobic co-digestion of agroindustrial wastewaters under mesophilic conditions in a two-stage process. Desalination 2009, 248, 891–906. [Google Scholar] [CrossRef]
  21. Martinez-Garcia, G.; Johnson, A.C.; Bachmann, R.T.; Williams, C.J.; Burgoyne, A.; Edyvean, R.G.J. Anaerobic treatment of olive mill wastewater and piggery effluents fermented with Candida tropicalis. J. Hazard. Mater. 2009, 164, 1398–1405. [Google Scholar] [CrossRef]
  22. Marques, I.P.; Texeira, A.; Rodrigues, L.; Dias, S.M.; Novais, J.M. Anaerobic co-treatment of olive mill and piggery effluents. Environ. Technol. 1997, 18, 265–274. [Google Scholar] [CrossRef]
  23. Marques, I.P.; Texeira, A.; Rodrigues, L.; Dias, S.M.; Novais, J.M. Anaerobic treatment of olive mill wastewater with digested piggery effluent. Water Environ. Res. 1998, 70, 1056–1061. [Google Scholar] [CrossRef]
  24. Marques, I.P. Anaerobic digestion treatment of olive mill wastewater for effluent re-use in irrigation. Desalination 2001, 137, 233–239. [Google Scholar] [CrossRef]
  25. Sampaio, M.A.; Gonçalves, M.R.; Marques, I.P. Anaerobic digestion challenge of raw olive mill wastewater. Bioresour. Technol. 2011, 102, 10810–10818. [Google Scholar] [CrossRef] [PubMed]
  26. Marques, I.P.; Eusébio, A.; La Cara, F. Processo para a produção de biogás e obtenção de biomoléculas num só passo. Portuguese Patent 108918, 30 July 2020. [Google Scholar]
  27. La Cara, F.; Ionata, E.; Del Monaco, G.; Marcolongo, L.; Gonçalves, M.R.; Marques, I.P. Olive Mill Wastewater Anaerobically Digested: Phenolic Compounds with Antiradical Activity. Chem. Eng. Trans. 2012, 27, 325–330. [Google Scholar] [CrossRef]
  28. Bailón-Salas, A.M.; Medrano-Roldán, H.; Valle-Cervantes, S.; Ordaz-Díaz, L.A.; Urtiz-Estrada, N.; Rojas-Contreras, J.A. Review of molecular techniques for the identification of bacterial communities in biological effluent treatment facilities at pulp and paper mills. Bioresources 2017, 12, 4384–4409. [Google Scholar] [CrossRef] [Green Version]
  29. Liu, L.; Li, Y.; Li, S.; Hu, N.; He, Y.; Pong, R.; Lin, D.; Lu, L.; Law, M. Comparison of Next-Generation Sequencing Systems. BioMed Research Int. 2012, 2012, 251364. [Google Scholar] [CrossRef]
  30. Vacher, C.; Tamaddoni-Nezhad, A.; Kamenova, S.; Peyrard, N.; Moalic, Y.; Sabbadin, R.; Schwaller, L.; Chiquet, J.; Smith, M.A.; Vallance, J.; et al. Learning Ecological Networks from Next-Generation Sequencing Data. In Advances in Ecological Research; Woodward, G., Bohan, D.A., Eds.; Academic Press: Oxford, UK, 2016; Volume 54, pp. 1–39. [Google Scholar]
  31. APHA; AWWA; EWF. Standard Methods for Examination of Water and Wastewater, 22nd ed.; American Public Health Association; American Water Works Association; Water Environment Federation: Washington, DC, USA, 2012. [Google Scholar]
  32. Singleton, V.L.; Rossi, J.A., Jr. Colorimetry of Total Phenolics with Phosphomolybdic-Phosphotungstic Acid Reagents. Am. J. Eonol. Viticult. 1965, 16, 144–158. [Google Scholar]
  33. Brand-Williams, W.; Cuvelier, M.E.; Berset, C. Use of a free radical method to evaluate antioxidant activity. LWT Food Sci. Technol. 1995, 28, 25–30. [Google Scholar] [CrossRef]
  34. Roseiro, L.; Tavares, C.S.; Roseiro, J.C.; Rauter, A.P. Antioxidants from aqueous decoction of carob pods biomass (Ceretonia siliqua L.): Optimisation using response surface methodology and phenolic profile by capillary electrophoresis y. Ind. Crop. Prod. 2013, 44, 119–126. [Google Scholar] [CrossRef]
  35. Zhou, J.; Bruns, M.A.; Tiedje, J.M. DNA Recovery from Soils of Diverse Composition. Appl. Environ. Microbiol. 1996, 62, 316–322. [Google Scholar] [CrossRef] [Green Version]
  36. Illumina 16S Metagenomic Sequencing Library Preparation. 2013. Available online: https://emea.support.illumina.com/downloads/16s_metagenomic_sequencing_library_preparation.html (accessed on 1 December 2019).
  37. Caporaso, J.G.; Kuczynski, J.; Stombaugh, J.; Bittinger, K.; Bushman, F.D.; Costello, E.K.; Fierer, N.; Peña, A.G.; Goodrich, J.K.; Gordon, J.I.; et al. QIIME allows analysis of high-throughput community sequencing data. Nat. Methods 2010, 7, 335–336. [Google Scholar] [CrossRef] [PubMed] [Green Version]
  38. Callahan, B.J.; McMurdie, P.J.; Rosen, M.J.; Han, A.W.; Johnson, A.J.A.; Holmes, S.P. DADA2: High resolution sample interference from Illumina amplicon data. Nat. Methods 2016, 13, 581–583. [Google Scholar] [CrossRef] [PubMed] [Green Version]
  39. Katoh, K.; Standley, D.M. MAFFT Multiple Sequence Alignment Software Version7: Improvements in Performance and Usability. Mol. Biol. Evol. 2013, 30, 772–780. [Google Scholar] [CrossRef] [Green Version]
  40. Price, M.N.; Dehal, P.S.; Arkin, A.P. FastTree 2 Approximately Maximum-Likelihood Trees for Large Alignments. PLoS ONE 2010, 5, e9490. [Google Scholar] [CrossRef] [PubMed]
  41. Pedregosa, F.; Varoquaux, G.; Gramfort, A.; Michel, V.; Thirion, B. Scikit-learn: Machine Learning in Python. J. Mach. Learn. Res. 2011, 12, 2825–2830. [Google Scholar]
  42. Glöckner, F.O.; Yilmaz, P.; Quast, C.; Gerken, J.; Beccati, A.; Ciuprina, A.; Bruns, G.; Yarza, P.; Peplies, J.; Westram, R.; et al. 25 years of serving the community with ribosomal RNA gene reference databases and tools. J. Biotechnol. 2017, 261, 169–176. [Google Scholar] [CrossRef]
  43. Ergüder, T.H.; Güven, E.; Demirer, G.N. Anaerobic treatment of olive mill wastes in batch reactors. Proc. Biochem. 2000, 36, 243–248. [Google Scholar] [CrossRef]
  44. Boursier, H.; Béline, F.; Paul, E. Piggery wastewater characterisation for biological nitrogen removal process design. Bioresour. Technol. 2005, 96, 351–358. [Google Scholar] [CrossRef]
  45. Velho, V.F.; Mohedano, R.A.; Belli Filho, P.; Costa, R.H.R. The viability of treated piggery wastewater for reuse in agricultural irrigation. Int. J. Recycl. Org. Waste Agric. 2012, 1, 10. [Google Scholar] [CrossRef] [Green Version]
  46. Aboudi, K.; Gómez-Quiroga, X.; Álvarez-Gallego, C.J.; Romero-García, L.I. Insights into Anaerobic Co-Digestion of Lignocellulosic Biomass (Sugar Beet By-Products) and Animal Manure in Long-Term Semi-Continuous Assays. Appl. Sci. 2020, 10, 5126. [Google Scholar] [CrossRef]
  47. Solarte-Toro, J.C.; Chacón-Pérez, Y.; Cardona-Alzate, C.A. Evaluation of biogas and syngas as energy vectors for heat and power generation using lignocellulosic biomass as raw material. Electron. J. Biotechnol. 2018, 33, 52–62. [Google Scholar] [CrossRef]
  48. Chala, B.; Oechsner, H.; Latif, S.; Müller, J. Biogas potential of coffee processing waste in Ethiopia. Sustainability 2018, 10, 2678. [Google Scholar] [CrossRef] [Green Version]
  49. Nelson, M.C.; Morrison, M.; Yu, Z. A meta-analysis of the microbial diversity observed in anaerobic digesters. Bioresour. Technol. 2011, 102, 3730–3739. [Google Scholar] [CrossRef] [PubMed]
  50. Krause, L.; Diaz, N.N.; Edwards, R.A.; Gartemann, K.-H.; Krömeke, H.; Neuweger, H.; Pühler, A.; Runte, K.J.; Schlüter, A.; Stoye, J.; et al. Taxonomic composition and gene content of a methane-producing microbial community isolated from a biogas reactor. J. Biotechnol. 2008, 136, 91–101. [Google Scholar] [CrossRef] [PubMed]
  51. Schlüter, A.; Bekel, T.; Diaz, N.N.; Dondrup, M.; Eichenlaub, R.; Gartemann, K.-H.; Krahn, I.; Krause, L.; Krömeke, H.; Kruse, O.; et al. The metagenome of a biogas-producing microbial community of a production-scale biogas plant fermenter analysed by the 454-pyrosequencing technology. J. Biotechnol. 2008, 136, 77–90. [Google Scholar] [CrossRef] [PubMed]
  52. Gannoun, H.; Omri, I.; Chouari, R.; Eltaief, K.; Keskes, S.; Godon, J.J.; Hamdi, M.; Sghir, A.; Bouallagui, H. Microbial community structure associated with the high loading anaerobic codigestion of olive mill and abattoir wastewaters. Bioresour. Technol. 2016, 201, 337–346. [Google Scholar] [CrossRef]
  53. Nishimura, T.; Vertès, A.A.; Shinoda, Y.; Inui, M.; Yukawa, H. Anaerobic growth of Corynebacterium glutamicum using nitrate as a terminal electron acceptor. Appl. Microbiol. Biotechnol. 2007, 75, 889–897. [Google Scholar] [CrossRef]
  54. Gao, R. Microbial diversity in a full-scale anaerobic reactor treating high concentration organic cassava wastewater. Afr. J. Biotechnol. 2012, 11, 6494–6500. [Google Scholar] [CrossRef]
  55. Guo, W.; Li, Y.; Zhao, K.; Xu, Q.; Jiang, H.; Zhou, H. Performance and Microbial Community Analysis of Anaerobic Digestion of Vinegar Residue with Adding of Acetylene Black or Hydrochar. Waste Biomass Valorization 2020, 11, 3315–3325. [Google Scholar] [CrossRef]
  56. Wang, M.; Zhang, X.; Zhou, J.; Yuan, Y.; Dai, Y.; Li, D.; Li, Z.; Liu, X.; Yan, Z. The dynamic changes and interactional networks of prokaryotic community between co-digestion and mono-digestions of corn stalk and pig manure. Bioresour. Technol. 2017, 225, 25–33. [Google Scholar] [CrossRef]
  57. Buhlmann, C.H.; Mickan, B.S.; Jenkins, S.N.; Tait, S.; Kahandawala, T.K.A.; Bahri, P.A. Ammonia stress on a resilient mesophilic anaerobic inoculum: Methane production, microbial community, and putative metabolic pathways. Bioresour. Technol. 2019, 275, 70–77. [Google Scholar] [CrossRef] [PubMed]
  58. Hülsemann, B.; Zhou, L.; Merkle, W.; Hassa, J.; Müller, J.; Oechsner, H. Biomethane Potential Test: Influence of Inoculum and the Digestion System. Appl. Sci. 2020, 10, 2589. [Google Scholar] [CrossRef] [Green Version]
  59. Cho, S.; Im, W.; Kim, D.; Kim, M.; Shin, H.; Oh, S. Dry anaerobic digestion of food waste under mesophilic conditions: Performance and methanogenic community analysis. Bioresour. Technol. 2013, 131, 210–217. [Google Scholar] [CrossRef] [PubMed]
  60. Wang, P.; Wang, H.; Qiu, Y.; Ren, L.; Jiang, B. Microbial characteristics in anaerobic digestion process of food waste for methane production–A review. Bioresour. Technol. 2018, 248, 29–36. [Google Scholar] [CrossRef] [PubMed]
  61. Conklin, A.; Stensel, H.D.; Ferguson, J. Growth kinetics and competition between Methanosarcina and Methanosaeta in mesophilic anaerobic digestion. Water Environ. Res. 2006, 78, 486–496. [Google Scholar] [CrossRef] [PubMed]
Figure 1. Anaerobic digestion of PE and OMW mixture: biogas production. STP—Standard temperature and pressure.
Applsci 11 01293 g001
Figure 2. Alpha rarefaction curves for the occurrence with which OTUs were detected at each sample. Relative abundance of bacterial and archaea groups was determined in terms of the percentage of total number of sequences in each sample.
Applsci 11 01293 g002
Figure 3. Relative abundance of Bacteria phyla. Other phyla were not considered in this discussion due to their low presence (0.01–1.2%): Armatimonadetes; Atribacteria; BRC1; Chlamydiae; Chlorobi; Chloroflexi; Cloacimonetes; Cyanobacteria; Deinococcus-Thermus; Fibrobacteres; Fusobacteria; Hydrogenedentes; Lentisphaerae; Microgenomates; Nitrospinae; Parcubacteria; Planctomycetes; Saccharibacteria; Verrucomicrobia; WS6; unidentified bacteria.
Applsci 11 01293 g003
Figure 4. Relative abundances of orders (a) Firmicutes (b) Bacteroidetes, (c) α-Proteobacteria, β-Proteobacteria, δ-Proteobacteria, and γ-Proteobacteria, and (d) Actinobacteria composition in samples from anaerobic digestion experiments. The abundance is presented in terms of a percentage of the total number of sequences in a sample.
Applsci 11 01293 g004aApplsci 11 01293 g004b
Figure 5. Relative abundance of Archaea genera. Other genera were not considered in this discussion due to their low presence (0.79–1.77%) in samples: Methanogenium; unidentified archaeon.
Applsci 11 01293 g005
Table 1. Anaerobic digestion in batch conditions.
EffluentsTest Time
(d)
MixtureTest Unit
Label
- Olive mill wastewater0–73100% PEP
(OMW)70% PE + 30% OMW 70P + 30O
- Piggery effluent50% PE + 50% OMW 50P + 50O
(PE)20% PE + 80% OMW 20P + 80O
Table 2. Effluents: Chemical composition.
EffluentsCOD
(g/L)
TS
(g/L)
VS
(g/L)
TN
(g/L)
NH4+-N
(g/L)
OMW106 ± 132 ± 026 ± 00.2 ± 0.00.001 ± 0.00
PE93 ± 547 ± 132 ± 14.9 ± 0.33.21 ± 0.02
COD—chemical oxygen demand; TS and vs.—total and volatile solids; TN—total nitrogen.
Table 3. Effluents: Volatile fatty acids and pH.
EffluentsAcetic Acid (g/L)Propionic Acid (g/L Aac)Isobutyric Acid (g/L Aac)Butyric Acid (g/L Aac)Total
(g/L Aac)
pH
OMW0.210.060.110.160.555.1
PE1.370.562.161.545.647.3
Aac—Acetic acid.
Table 4. Effluents: Antioxidant activity and total phenolic content.
EffluentsAntioxidant Activity
(mmol TEAC)
DPPH Inhibition (%)TP
(g/L)
OMW0.80 ± 0.0761 ± 33.1 ± 0.0
PE1.11 ± 0.0181 ± 10.9 ± 0.0
DPPH—2,2-diphenyl-2-picrylhydrazyl hydrate; TP—total phenols.
Table 5. Anaerobic digestion of PE + OMW: Performance and biogas/methane production.
MixtureCODTotal and Volatile Solids
CODin (g/L)CODr (%)TSin (g/L)TSr (%)VSin (g/L)VSr (%)
PE93 ± 563 ± 647 ± 117 ± 232 ± 129 ± 2
70P + 30O81 ± 375 ± 040 ± 021 ± 228 ± 036 ± 4
50P + 50O77 ± 348 ± 138 ± 016 ± 328 ± 022 ± 3
20P + 80O73 ± 129 ± 233 ± 121 ± 125 ± 125 ± 0
COD—chemical oxygen demand; TS and vs.—total and volatile solids; in—initial; r—removal.
Table 6. Anaerobic digestion of PE + OMW: Antioxidant activity and total phenolic (TP) content.
MixtureTPin (g/L)TPr
(%)
Antioxidant Activity
(mmol TEAC)
DPPH Inhibition
(%)
InitialFinalInitialFinal
PE0.9 ± 0.03 ± 0.01.1 ± 0.00.6 ± 0.181 ± 130 ± 8
70P + 30O1.7 ± 0.035 ± 0.01.1 ± 0.00.4 ± 0.179 ± 010 ± 7
50P + 50O2.2 ± 0.030 ± 0.01.0 ± 0.01.3 ± 0.074 ± 169 ± 2
20P + 80O2.7 ± 0.07 ± 0.00.9 ± 0.01.3 ± 0.068 ± 069 ± 1
DPPH = 2,2-diphenyl-2-picrylhydrazyl hydrate; in—initial; r—removal.
Table 7. Anaerobic digestion of PE + OMW: Total and ammonium nitrogen, pH and VFA.
MixturepHTotal NitrogenAmmonia NitrogenVFA
pHinpHfTNin (g/L)TNr
(%)
NH4+-Nin (g/L)NH4+-Nr (%)Total VFAin (g/L AAc)Total VFAr (%)
PE7.38.14.9 ± 0.3-3.2 ± 0.0−21 ± 4 5.785
70P + 30O6.97.91.8 ± 0.03.0 ± 0.01.3 ± 0.1−88 ± 383.955
50P + 50O6.77.31.3 ± 0.02.2 ± 1.50.8 ± 0.3−14 ± 63.7−81
20P + 80O6.25.70.6 ± 0.05.7 ± 0.00.3 ± 0.013 ± 52.852
TN—total nitrogen; VFA—volatile fatty acids; in—initial; f—final; r—removal; AAc—in terms of acetic acid.
Table 8. Energy potential of PE + OMW mixtures used as feedstock in anaerobic digestion.
MixtureCumulative CH4 Yield
(L CH4/kg SVin)
Energy Content
(KWh/kg SVin)
PE434 ± 34.32 ± 0.03
70P + 30O489 ± 84.87 ± 0.08
50P + 50O178 ± 291.77 ± 0.29
20P + 80O6.3 ± 0.30.06 ± 0.00
Table 9. Sequencing summary and microbial community (bacteria and archaea) diversity index of samples.
SampleNo. of SequencesOTUShannon–Wiener Index
BacteriaArchaea
PE (IN)193,74216233.522.95
PE (OUT)206,7147791.381.45
70P + 30O (IN)181,83418194.794.45
70P + 30O (OUT)140,9996101.642.16
Total723,2894831--
Table 10. Relative abundance of bacteria and archaea domains.
SampleRelative Abundance (%)
BacteriaArchaea
PE IN99.730.26
PE OUT99.870.13
70P + 30O IN99.710.28
70P + 30O OUT99.920.08
Publisher’s Note: MDPI stays neutral with regard to jurisdictional claims in published maps and institutional affiliations.

