Article

Complementary Substrates-Brewery Wastewater and Piggery Effluent—Assessment and Microbial Community Profiling in a Hybrid Anaerobic Reactor

Unidade de Bioenergia e Biorrefinarias, Laboratório Nacional de Energia e Geologia, I.P. (LNEG), Estrada do Paço do Lumiar 22, 1649-038 Lisboa, Portugal
*
Author to whom correspondence should be addressed.
Appl. Sci. 2021, 11(10), 4364; https://doi.org/10.3390/app11104364
Submission received: 19 March 2021 / Revised: 30 April 2021 / Accepted: 5 May 2021 / Published: 11 May 2021
(This article belongs to the Special Issue Microbiological Surveillance of Biogas and Sewage Treatment Plants)

Abstract

:
A hybrid anaerobic reactor was operated under the complementary effluents concept to reduce the unbalanced/inhibitory capacity of the provided piggery effluent. Brewery wastewater was chosen to complement piggery effluent (60:40% v/v, respectively). The HRT reduction from 6.7 to 3.0 days allowed the testing of an organic load increase from 4.5 to 10.0 g COD/L·d, which resulted in the almost doubling of biogas production. Biogas volumes (1.2 and 2.1 L/L·d, respectively) associated with its quality (>77% CH4) revealed that the hybrid anaerobic reactor responded positively to the operational changes and that piggery effluent can be advantageously digested using the brewery wastewater as the complementary effluent. The unit bottom and the packing bed were the main functional sections recognized in the hybrid. At the beginning of anaerobic digestion, bacterial populations belonged mostly to Bacteroidales (33%) and Clostridiales (35%). The process stability and the biogas quality at 3-d HRT were related to a change in the structure composition, since Flavobacteriales (18%), Bacillales (7%), Pseudomonadales (11%) and members of the Alcaligenaceae family (5%) also integrated the microbial communities. An evident change had also occurred in archaeal populations at this phase. Methanosaeta became the dominant genus (95%), confirming that acetoclastic methanogenesis was the main way for methane production.

1. Introduction

Beer is one of the oldest and most consumed beverages worldwide after water and tea. Global beer production evolved from 1.3 billion hectoliters (1998) to about 1.91 billion hectoliters (2019), where China, United States and Brazil are the leading beer producing countries [1]. In Portugal, the volume of beer produced amounted to more than 6.76 million hectoliters in 2018 [1]. The production of this beverage always creates a large volume of wastewater, in addition to the water spent on washing bottles, tanks, and machines, whose discharge (3–10 L for every liter of beer) will contribute to the oxygen depletion and eutrophication of water bodies [2]. It has been estimated that 1 L of beer packaged in glass bottles consumes 17.5 MJ of primary energy and generates 842 g of CO2 eq. emissions [3].
The livestock sector has a relevant contribution to the economy of several countries. Pork and poultry are the most consumed meats in the world, and it is expected that the global consumption of pork will increase from 117.35 ktons in 2017 to about 131 ktons by 2027 [4]. At the end of 2013, Portugal represented 1.37% of the European pig population with a total of 2.02 million heads. In 2019, the annual number of pigs in Portugal was 2.216 million heads [5]. Livestock has been held responsible for its harmful effects on the environment, such as water pollution, the increase in the greenhouse effect and the reduction of biological diversity, which are essentially due to the form of management which has no concern for sustainability [6]. Consequently, suitable management will be necessary by taking advantage of the generated effluent through its treatment and recovery. Among the different ways of proceeding with the treatment of an effluent, anaerobic digestion stands out as an alternative and advantageous process [7]. Anaerobic digestion converts the substrate organic content into biogas (mainly CH4 and CO2) under the absence of oxygen, preserving its nutrients in the digestate. Controlled anaerobic digestion and the consequent biogas application will release carbon dioxide back to the carbon cycle and displace fossil fuel use [8,9]. Anaerobic digestion is a complex biochemical process of successive metabolic stages (hydrolysis, acidogenesis, acetogenesis and methanogenesis), that are coordinated by bacteria and archaea communities in close interaction and interdependence [10]. The performance and stability of the anaerobic digestion process are vulnerable issues that depend on inhibitory or recalcitrant factors intrinsic to the composition of the substrate [11]. Pre-treatments are a common approach to enhance the anaerobic process and provide higher methane production [12,13]. Operational techniques based on the complementary effluents concept can alternatively contribute to solve the disadvantageous initial composition of an “anti-substrate”. Effectively, the combination of effluents that complement each other has been successfully applied in anaerobic digestion of unbalanced, toxic and/or concentrated substrates to promote organic matter conversion, avoiding substrate chemical adjustments and/or pre-treatments [14,15,16,17,18,19,20]. In addition, the reduction in plant operational expenses can be expected.
One of the relevant aspects in the scope of anaerobic digestion concerns the characteristics of the anaerobic reactor to be installed and its performance. Different types of anaerobic reactor have been used in the research of organic materials conversion [9], and the importance of reducing the reactor volume in the installation costs implies operating in conditions of stability, with a short hydraulic retention time that withstands high organic loads and allows its maximum conversion into methane. One way to achieve this performance is to concentrate the microbial biomass through its immobilization, as happens in the high-rate anaerobic reactors. As examples there exists the anaerobic filter (AF) with a packing bed along the column that supports a suspended biomass, and the up-flow anaerobic sludge blanket (UASB) that keep dense granules settled in the reactor. According to Pérez-Pérez et al. [21], AF and UASB are the most studied units regarding the treatment of swine manure by anaerobic processes, and individually present some functional disadvantages during long periods of operation. In the case of AF, the drawbacks correspond to the formation of preferential paths and/or the creation of clogging in the packing bed over time, whose main consequence is the decrease in the useful volume of the unit. Regarding the UASB reactor, it can lose biomass (granules) as is devoid of any filling medium and, in an extreme situation, it can be subjected to system washout, especially when an overload occurs. The combination of these two types of reactors resulted in the hybrid anaerobic reactor, which, by having the packing medium only in the upper area of the unit, gathers the advantageous characteristics and avoids the operational inconveniences of each one. Different configurations of the hybrid anaerobic reactor have been reported in the treatment of effluents. The integral hybrid system, configured in two-sections—the UASB section under anaerobic conditions (initial volume of 2 L) and the UASB section + aerobic packing bed with polyethylene rings (total volume of 3 L)—was used to degrade the swine wastewater [22] where the novel hybrid anaerobic–aerobic baffled reactor was applied to the treatment of the manure-free piggery wastewater, without any supplementation of an external carbon source [23]. The hybrid anaerobic baffled reactor was also reported to digest (synthetic) brewery wastewater [24].
In a previous study, the authors used the Next-Generation Sequencing (NGS) technique to find that changes in the organic composition of the substrate had a clear relationship with changes in the structure of microbial communities during the anaerobic digestion of olive mill wastewater (OMW) and piggery (PE) effluent, by exploiting the complementary effluents concept [20]. The reduction in the initial population diversity occurred towards an acclimation of the operational conditions in the anaerobic process, and the predominant microbial sequences allowed the finding of the best substrate proportion, 30% OMW plus 70% PE (v/v).
The present work intends to continue the previous work, considering the concept of the complementarity of substrates, using brewery wastewater (BWW) to decrease the toxicity and complement the unbalanced substrate, such as the piggery effluent. The experimental conditions were scaled-up to a hybrid anaerobic reactor, as it is important to assess the toxicity of an unbalanced substrate, such as the provided piggery effluent, by exploiting the complementary effluents concept. It aims to assess hybrid anaerobic reactor behavior under high organic load conditions, through the efficiency of organic matter conversion and biogas/methane production as well as the molecular characterization and dynamic changes of microbial communities.

2. Materials and Methods

2.1. Sampling of Substrates

The brewery wastewater (BWW) was collected at the SOCIEDADE CENTRAL DE CERVEJAS E BEBIDAS (SCC, Vialonga, Portugal), which, after a primary treatment on site, was brought to be used in this trial. The piggery effluent (PE) was collected at VALORGADO Company (Salvaterra de Magos, Portugal). The effluent produced in the piggery was directed to a solid–liquid separator device. The resulting liquid fraction, that was free of most of the solids, was collected for this assay before reaching the stabilization pond.

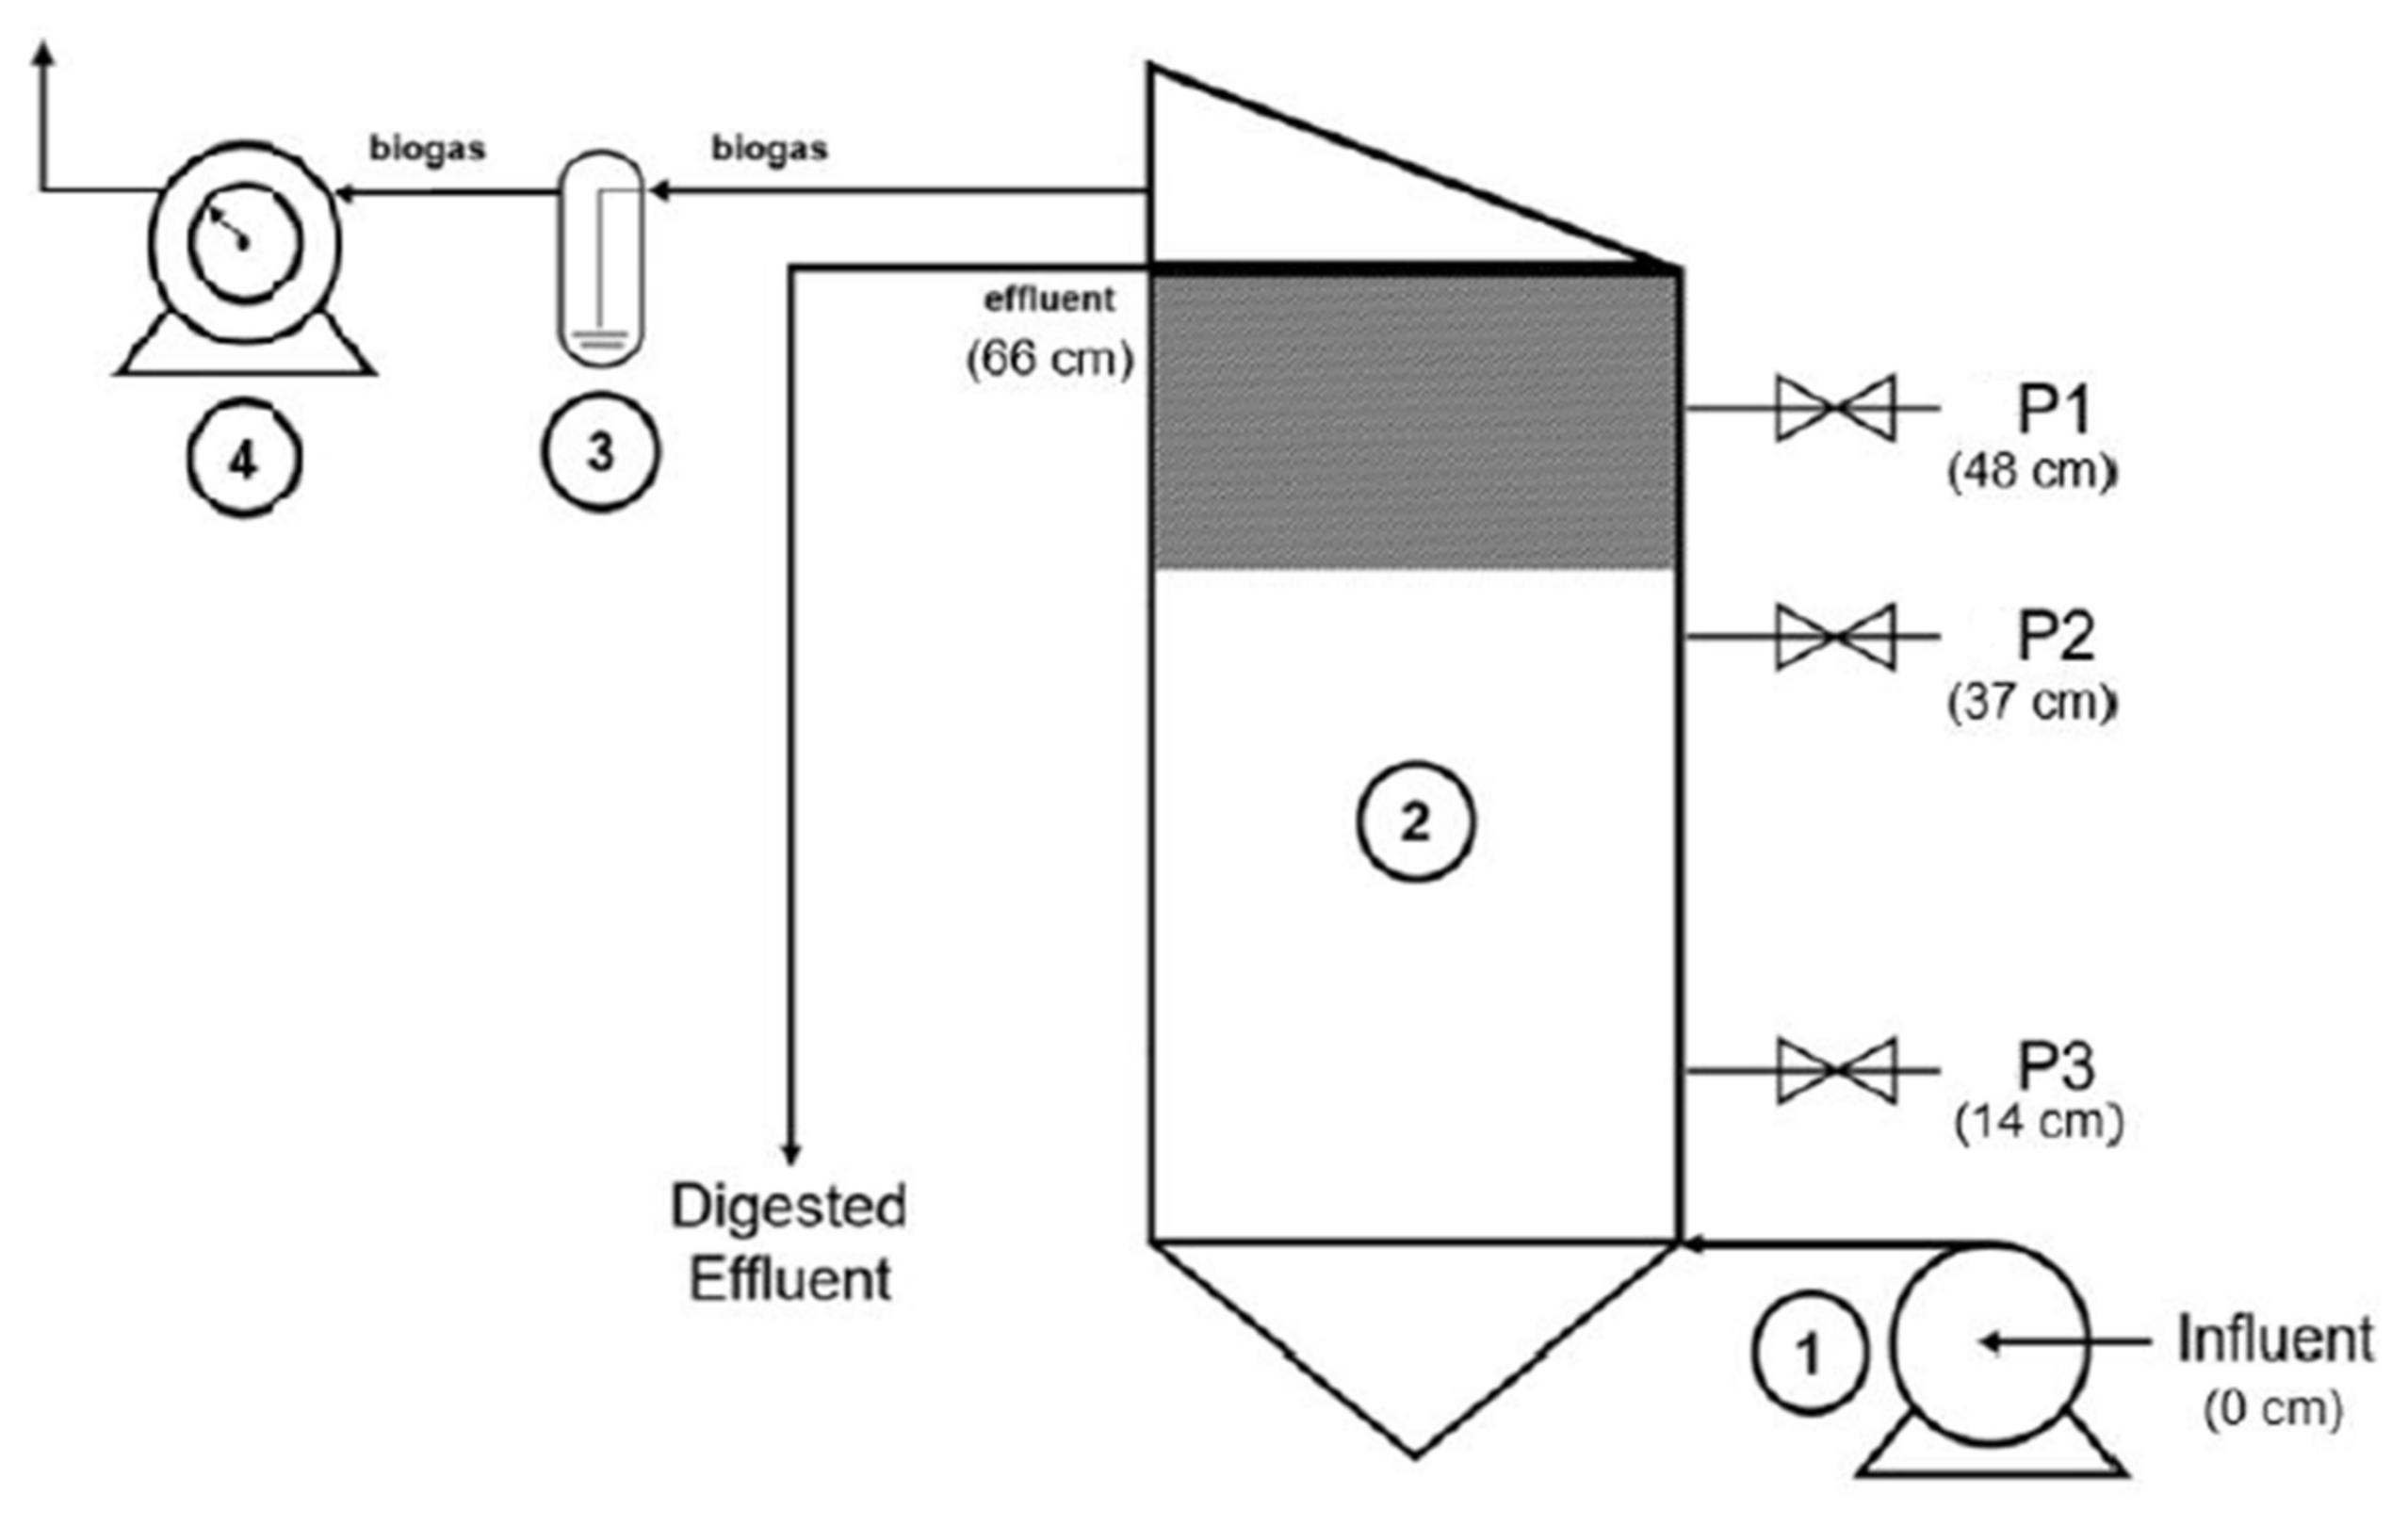
2.2. Anaerobic Digestion Experimental Set-Up

The hybrid anaerobic reactor used in the experiment is a laboratory-scale unit with a total volume of 2 L, designed and assembled at LNEG (Laboratório Nacional de Energia e Geologia, Portugal), and was described elsewhere [25,26,27,28]. It comprises a packing bed (anaerobic filter—AF) selected from previous studies [14,15,16] that was allocated only in the upper third of the reactor column height, and by a sludge bed in the lower unit section (up-flow anaerobic sludge bed—UASB). The hybrid anaerobic reactor is an up-flow unit that was equipped with several ports placed along the column (Figure 1) which allow the collection of samples from inside the unit, analyzing different parameters, and the assessment of the profile characteristics of the hybrid column reactor.
BWW and PE were mixed at proportions of 60% BWW and 40% PE (v/v) and fed as the influent of the hybrid anaerobic digestion unit, under two operational conditions, as shown in Table 1. Hydraulic retention times (HRT) of 6.7 and 3.0 days were tested by increasing organic loading rates (OLR) from 4.5 to 10 g COD/L·d during the experiment. The anaerobic digestion process was performed under mesophilic conditions of temperature (37 ± 1 °C).

2.3. Analytical and Chromatograph Methods

The performance of the process was monitored by analytical characterizations of all samples and by the volume and quality of the biogas. Analytical measures of described parameters were performed at the beginning (IN) and at the end (OUT) of the assay experimental time. Total and volatile solids (TS, VS), chemical oxygen demand (COD), total nitrogen (Kjeldahl, TKN), ammonium (NH4+-N), and pH, were assayed according to standard methods [29]. Total content of phenols was determined by a colorimetric method [30], using caffeic acid as standard for calibration curve.
Volatile fatty acids (VFA) were evaluated by using a gas chromatograph (Hewlett Packard 5890), provided with a flame ionization detector and 2 m × 2 mm Carbopack B-DA/4% Carbowax 20 M (80–120 mesh) column. Nitrogen was the carrier gas (30 mL/mn). Temperatures of the column, injector and detector were 170, 175 and 250 °C, respectively. Total VFA (acetate, propionate, butyrate, iso-butyrate, iso-valerate and valerate) concentrations were expressed as acetic acid.
The methane content in biogas was measured by the injection of a 0.5-mL gas sample into a gas chromatograph (Varian CP 430-GC), equipped with a thermal conductivity detector and a Porapack S column of 1/8″ × 3 m. Column, injector and detector temperatures were 50, 80 and 100 °C, respectively. Nitrogen was utilized as the carrier gas (20 mL/mn). Quantification of each produced gas was performed by comparing the obtained graphical peak areas with patterns of the injected gas mix at the beginning of each analysis.

2.4. Metagenomic Analysis

2.4.1. DNA Extraction and MiSeq Sequencing (Next-Generation Sequencing, NGS) of 16S rRNA Gene Amplicons

An aliquot of each sample, in triplicate, was collected at the beginning (IN) and at the end (OUT) of the experiment and was merged and homogenized for DNA extraction and gene sequencing.
DNA extraction was made as described by Zhou et al. [31] and adapted for these samples by Eusébio et al. [32]. After chloroform–isoamyl alcohol steps, a 0.01 volume of 10 mg/mL RNAse was added. The aqueous phase was precipitated with a 0.6 volume of isopropanol and a 0.1 volume of 2.5 M C2H3NaO2 solution and was kept at −20 °C for 1 h. The pellet of crude nucleic acids was recovered by centrifuging at 12,800× g for 20 min. Then, cold ethanol 70% was added, the solution left overnight at −20 °C, centrifuged at 12,800× g for 20 min, and resuspended in TE solution (10 mM Tris.HCl, pH 7.5, 1 mM EDTA). The extracted DNA was pooled, quantified, and checked for purity using QubitTM (Thermo Fisher Scientific, Wilmington, NC, USA) prior to storage at −20 °C.
NGS was performed at STAB VIDA facilities (Lisbon, Portugal). For NGS, V3 and V4 regions of bacterial and archaeal 16S rRNA gene were amplified with universal primers 515F (GTGCCAGCMGCCGCGGTAA)—806R (GGACTACNNGGGTATCTAAT). Library construction was performed using the Illumina 16S Metagenomic Sequencing Library preparation protocol [33]. The generated DNA fragments (DNA libraries) were sequenced with the MiSeq Reagent Kit v3 in the lllumina MiSeq platform, using 300-bp paired-end sequencing reads.

2.4.2. Data Analysis

The bioinformatics analysis of the generated raw sequence data was carried out using the Quantitative Insights into Microbial Ecology (QIIME2, version 2018.11) [34]. The reads were denoised using the Divisive Amplicon Denoising Algorithm 2 (DADA2) plugin [35], where the following processes were applied: trimming and truncating low quality regions; dereplicating the reads; filtering chimeras. After denoising, the reads were organized in features, which are operational taxonomic units (OTUs), and a feature table was generated using the plugin feature-Table (https://github.com/qiime2/q2-feature-Table, accessed in February 2021), with each feature being represented by exactly one sequence. After applying the plugins Alignment [36], Phylogeny [37], and Diversity (https://github.com/qiime2/q2-diversity, accessed in February 2021), a pre-trained sk-learn classifier [38] based on the SILVA [39] (release 132 QIIME) with a clustering threshold of 97% similarity was applied to generate taxonomy tables. Taxonomic classification was achieved by using the plugins Feature-classifier (https://github.com/qiime2/q2-feature-classifier, accessed in February 2021) and Taxa (https://github.com/qiime2/q2-taxa, accessed in February 2021), where only OTUs containing at least 10 sequence reads were considered as significant.
All the raw data were deposited at the NCBI Sequence Read Archive (SRA) database with accession numbers of SRR13579864, and SRR13697433–SRR13697436.

3. Results and Discussion

3.1. Chemical Composition of Substrates

BWW holds the lowest concentration of organic material (7 g/L COD, 4 g/L TS and 1 g/L VS), having an acidic pH and low nitrogen content (Table 2) as its main characteristics. These characteristics are related directly to the primary treatment carried out on site before the wastewater was collected for this work. On the contrary, PE contains remarkably high concentrations of organic compounds (around 90 g/L COD, Table 2). Other features measured in PE, such as neutral pH, and contents of nitrogen and of VFA, favor the attainment of a more balanced substrate that promotes the start-up and the working stability of the anaerobic process.
BWW presents a lower total VFA concentration than PE (3.1 versus 5.6 g/L HAc), acetic acid being the main component (about 72%, Table 2). In turn, the longer chain acids (isobutyric and butyric) are mainly found in greater quantities in PE. It shows some degradation of the collected flow, probably due to the effluent handling process during the passage of the original piggery effluent through a solid–liquid separator. Additionally, the absence of total phenols in BWW (Table 2) can be a beneficial factor when it is digested together with PE, as it can minimize the potential inhibition capacity of this effluent with a total phenol content of 0.9 g/L caffeic acid.
Untreated BWW is generally described in the literature as a typical pollutant with high organic concentration and low nutrient content, characterized by wide variations in these parameters [41,45,46], yet the values found in the literature were much lower comparatively with PE (Table 2). Moreover, the lower values of COD and TS found for BWW in this work (Table 2) are justified by the primary treatment to which the effluent was subjected.
Effectively, the provided PE is an unusual effluent with several inhibiting characteristics. It is known that the piggery effluent composition is highly variable depending on several factors, such as the farm management practices, animal feed, and storage conditions at the piggery and treatment plant; nevertheless, the PE under study comparatively presents higher concentrations than those stated by other authors (Table 2). This can be explained by the breeding conditions of the animals and the effluent management carried out on this farm in which, as mentioned, the substrate obtained is devoid of most of the solids.
In addition to the toxic potential associated mainly with the total of acids and phenolic compounds found in the PE, high concentrations of nitrogen must be considered. Nitrogen performs contrasting functions in the digestion process. It plays the role of a nutrient, has buffering capacity and exerts inhibitory or toxic action in the solution. Total nitrogen is combined with ionized ammonium nitrogen (NH4+) and unionized ammonium nitrogen (free ammonia form, NH3), whose form heavily depends on the pH and temperature of the medium. Fernandes et al. [47] studied the inhibition effect of ammonia on the anaerobic hydrolysis of carbohydrates and lipids, using biomass adapted to 4.9 g NH4+-N/L, and concluded that concentrations of total ammonia nitrogen between 2.4 and 7.8 g NH4+-N/L (283–957 mg NH3-N/L) do not inhibit the hydrolysis process. Unlike the ammonium ion, free ammonia is known as the main inhibitory form of methanogenesis since it can diffuse through the cell membrane and inhibit the cell functioning [48]. The free ammonia form increases from 1 to 10% of the total ammonia by varying the pH from 7 to 8, respectively, while maintaining the temperature at 35 °C. Looking at the review by Rajagopal et al. [11], the effect of ammonia levels on the anaerobic digestion process is categorized as “Beneficial”, “No antagonistic effect”, “Inhibition (especially at higher pH values)”, and “Complete inhibition or toxic at any pH” for the concentrations of 50–200; 200–1000, 1500–3000 and >3000 mg NH4+-N/L, respectively. According to this information, the PE tested, containing 3000 mg of NH4+-N/L, is positioned in the upper range of the “Inhibition” category, confirming its effective inhibitory capacity and the advantage of digesting it with another effluent that complements and dilute its composition. The advantage of joining substrates was also mentioned by Wang et al. [49], who note that the joint digestion of corn stalk and pig manure provided a greater production of biogas/methane than the individual process because the materials blend makes the process more resistant to harmful inhibitory effects. Treu et al. [50] found that the limited buffering capacity of whey mono-digestion can be resolved by adding cattle manure to stabilize methane production and decrease acid accumulation. The interest in applying the concept of complementary substrates lies not only in avoiding substrate pre-treatments but also in the quality of the digested flow. If piggery effluent is anaerobically digested alone, the digested effluent usually contains large amounts of nutrients, mainly nitrogen, which must be removed by additional processes [51,52]. Thus, the concept of complementary substrates can also avoid the need to apply a post-treatment to the digestate.

3.2. Anaerobic Digestion of the BWW and PE Mixture

During the first phase of 19 days of this trial, conducted under the HRT of 6.7 d and OLR of 4.5 g COD/L·d, biogas production ranged between 0.4 and 1.2 L/L·d, mainly composed of methane in concentrations of 63–78% (Figure 2). A biogas production rate of 0.996 L/L·d and 0.928 L/L·d, containing 65% methane, was registered after the digestion of pre-treated manure (140 °C, 40 min) and without pre-treatment, respectively [12]. The values for biogas and methane content are of the same order of magnitude than those obtained in this work (1.1–1.2 L/L·d), however they were performed under identical OLR (2.5 g VS/L·d versus 2.2 g VS/ L·d) but advantageous operating conditions. They resulted from a higher digestion process temperature and longer HRT than the conditions in this work (55 °C, 18 d HRT versus 37 °C, 6.7 d HRT) [12]. Thermophilic conditions of temperature, such as 55 °C, promote higher biogas productions than the mesophilic ones (37 °C) as shown by Kasinski [53]. On the other hand, the increase in HRT allows for a better conversion of organic matter and, consequently, greater volumes of biogas will be expected as concluded by Shi et al. [54]. Bearing these considerations in mind, the data obtained in the present work are comparatively of relevant interest because they indicate that it is possible to obtain a similar production in biogas (energy) and treat a higher volume of effluent in the same period and, at lower process temperature, conditions that will certainly provide an energy balance more attractive for the operating unit. Considering the co-digestion of Pennisetum hybrid and pig manure (50:50) under a mesophilic range of temperature (35 ± 1 °C) [55], the results obtained are comparable to those of this work, although with a lower methane content: biogas production of 1.16 and 2.07 L/L·d with 77.8 and 79.5% CH4 (OLR 2.22 and 4.96 g VS/L·d) versus 0.87 and 1.92 L/L·d with 56.7 and 60.3% CH4 (OLR 2.0 and 5.0 g VS/ L·d [55]) were registered, respectively.
The variations in biogas volume under HRT 6.7 d (Figure 2) were certainly stressed by the failure to feed the reactor on Sundays. Despite these operating conditions, it was found that the unit always reacted positively, providing successive increments in biogas volume during every week of testing. Thus, the work continued according to the experimental plan outlined, but with an additional objective: to test the unit ability to withstand or not withstand more aggressive operating conditions by decreasing HRT and increasing the loading rate.
In the next phase (HRT 3.0 d), there was a clear intensification in the biogas volume (1.1–2.3 L/L·d), suggesting that both hydraulic and microbial reactor conditions were able to support the OLR rise to 10.0 g COD/L·d (4.06 g SV/L·d). The good process response was confirmed by the improvement in the biogas quality, on which a slight increase in concentrations from around 76 to 80% was registered (Figure 2). Another relevant aspect is the stability in biogas production indicated by the constant values measured in the last week of operation (Figure 2). In fact, the methane level of about 80% in the biogas obtained at the stable period was confirmed by measurements following this experimental phase (data not shown). Amaral et al. [56] reported comparable methane content (77.9%) yet operating under an HRT of 17.86 d (OLR of 1.16 g COD/L·d, 0.45 g SV/L·d) to digest swine effluent.
At this point, roughly comparing these two operational periods, it seems that by doubling the organic load (4.5 to 10 g COD/L·d, Table 1), approximately twice the volume of biogas was obtained (1.2 up to 2.3 L biogas/L·d). The attained data indicate that the hybrid anaerobic reactor reacted positively to the change in operating conditions, showing capacity to accommodate this increase in organic load. On the other side, the reactor design was able to withstand high loads of organic-rich substrate and produce high volumes of biogas/methane, taking advantage of both suspended growth and attached-growth anaerobic microbial biomass as pointed out by Lo et al. [57].
Gas production is a result of the organic matter conversion, and the partial removal of influent contents is consequently achieved. According to the parameters in Table 3, the decrease in substrate concentration, shown in each process stage, indicates that the mixture digestion took place properly under the tested experimental conditions, as expected. However, regarding the data obtained, COD removal decreased from 52 to 12% with the reduction in the HRT from 6.7 d to 3.0 d, contradicting the increase in biogas production (Figure 2). A possible explanation for this would be the presence of additional material in the effluent, such as suspended biomass that reached the top of the hybrid, and was counted as COD content, when the sample was taken for analysis. Regarding solids, the greatest removal amounts of 54% in TS, and 68% in VS, were obtained precisely at HRT 3 d, suggesting that microbial populations were able to convert the majority of the organic matter into biogas. Values of this order of magnitude (55–65% TS and 59–68% VS) were also reported by Demirer and Chen [58] when digesting dairy manure in an anaerobic hybrid reactor, equipped with a floating support for biomass immobilization, yet these values were obtained at a higher HRT of 15 d. In another experiment, Lo et al. [57] achieved COD removal of 57% using a hybrid UASB reactor to test the swine manure treatment.
The neutral pH (7.0, Table 3), measured in the feed mixture resulted from PE characteristics that had counteract the acid conditions of BWW. Slightly higher pH values (7.9–8.1) were measured in the digested flow, indicating that there is a suitable occurrence between the components that provide buffering capacity to the medium and those that act as acidity promoters, such as nitrogen compounds and VFA, respectively, providing conditions for degradation of the acids contained in the substrate and those that are formed during the organic matter digestion, without further accumulation in the reactor.
Regarding nitrogen compounds, despite the similarity between the input and output of TKN values during the initial stage (HRT 6.7 d), the decrease in concentration (21%) achieved after the regimen at HRT 3 d suggests protein degradation by microbial populations, within the hybrid anaerobic reactor, under this last operational condition (Table 3). The ammonium nitrogen data did not provide much additional information due to the small difference registered between the substrate and digestate concentrations. Considering that the proportion of ionized and non-ionized forms (the toxic one) in the medium is pH-dependent and that values in the basic pH range (7.9–8.1) were registered in this work, some toxicity from ammonia could be considered. Nevertheless, from the available data, the initial amount of 800 mg NH4+-N/L is low enough to have any inhibitory effect on the process [11]. As expected, ammonium nitrogen concentration increased in the digestate during the first stage, although not in a very marked way. In the next phase (HRT 3 d), a low removal of ammonium was registered, indicating that both the ammonium contained in the substrate and the ammonium obtained from the conversion of compounds were used in the process. In fact, the greatest VFA removal (95%, Table 3) was registered in the HRT 3 d operational condition, signifying the presence of an adequate buffer capacity in the medium.
Global VFA removal resulted from partial removals of its constituents, as shown in Table 3. Acetic acid is the main component of inputs, comprising 62% of total VFA. Other acids such as propionic, isobutyric and butyric acids are also present in all influents in addition to acetic acid, although in lower concentrations. All these acids were removed efficiently under the tested operating conditions, suggesting that microbial communities could break down the more complex acids into acetate and convert them into biogas/methane, as a result of the active working balance between hydrogen-producing bacteria and hydrogenotrophic methanogens.
Despite the evidence of the good performance of the hybrid anaerobic reactor digesting the mixture of two complementary effluents, through the verified biogas quality and the VFA removal, for instance, the resulting methane yield did not exceed 0.118 L CH4/g CODIN (Table 4). The results obtained confirm the fact that the process efficiency decreases with the reduction in HRT and with the consequent increase in the organic load. Comparatively, the methane yield obtained at 6.7-d and 3-d HRT conditions is compatible with that reported in another hybrid unit treating dairy effluent under an HRT of 15 d [58]: 0.238 L and 0.195 L CH4/ g VSIN (OLR = 2.2 and 5.0 g VS/L·d, respectively) versus 0.191 L CH4/g VSIN (OLR = 7.30 g VS/L·d). By applying another reactor type (UASB) to digest surplus yeast and brewery wastewater, higher values were reported by Neira and Jeison [13] who found a methane production of 0.301 L CH4/g CODIN, however digesting a substrate much less concentrated than the one applied in this work (influent 30 versus 4 g/L COD).

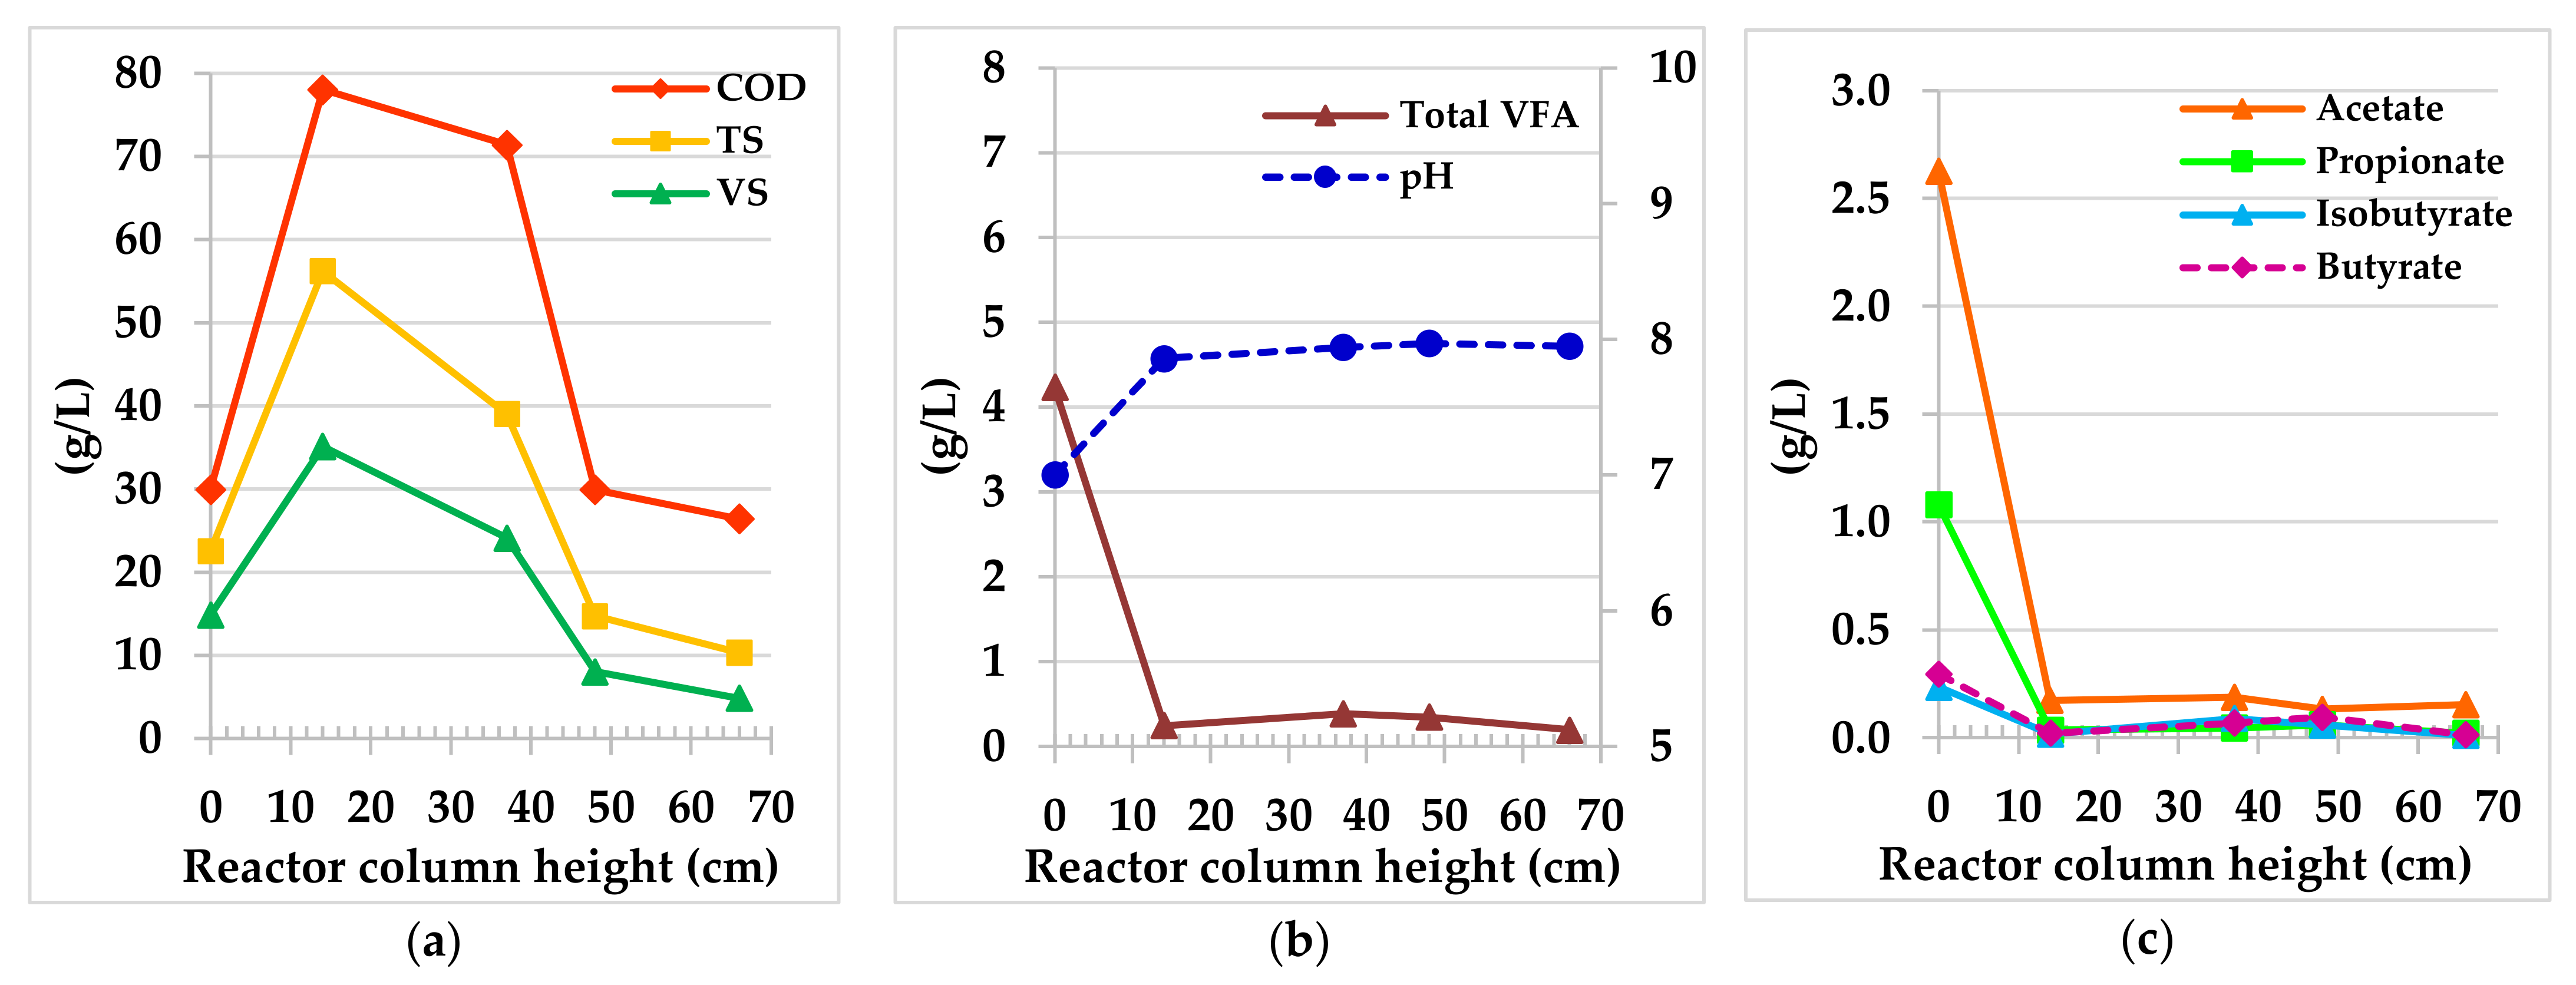
3.2.1. Hybrid Anaerobic Reactor Profile

The hybrid anaerobic reactor profile was created from the samples collected in ports placed at different column heights (Figure 1), at the end of the 3-d HRT phase. As shown in Figure 3a, the highest matter concentration represented by the COD, TS and VS parameters is found, as expected, at the bottom of the hybrid anaerobic reactor (P3, 14 cm, Figure 1), indicating the presence of a dense material known as a sludge blanket. Comparing samples at the P3 and at P2 (37 cm) sampling ports, a decrease in concentrations is observed which continues in the next section (P2 and P1) but in a more pronounced way. Considering that the P1 (48 cm) sampling port is in the packing bed section and the collected sample corresponds to biomass material from the support medium, the greatest decrease verified in the concentration, mainly in terms of COD, could be justified by the functional action of the packing bed in retaining the digesting material and promoting the substrate conversion. However, when comparing the values obtained in the influent and effluent, the difference concerning solids is greater than in the case of COD (54%, 68% versus 12% TS, VS and COD removal, respectively). As was already pointed out, this low removal capacity of COD does not agree with the stable behavior observed in a hybrid anaerobic reactor related to daily production of biogas/methane. The additional material in effluent could be associated to some suspended biomass, coming from the lower layers that passed through the packing bed medium, or even to be related to the aggregated biomass in it that was dragged in the gaseous flow and/or in the digestate exit.
As shown in Figure 3b, the main consumption of VFA was carried out at the bottom of the hybrid anaerobic reactor, in the first column section, about 14 cm high (P3). Accordingly, identical information is given by the pH values. The main evolution of pH to more basic values happened in the same bottom section, which remain relatively stable throughout the column of the hybrid anaerobic reactor until the sample output (at 66 cm height). Figure 3c shows that acetic acid is the main constituent of VFAs at the influent and, together with the other components of VFAs, was converted at the bottom of the hybrid anaerobic reactor (P3).
According to the composition of the reactor (lower and upper sections, Figure 1), the recorded data suggest that a stratification occurs inside the hybrid anaerobic reactor, and the majority of hydrolytic, acidogenic and acetogenic microbial populations are located at the lower layers, acting on the material in digestion and converting most of the compounds for methanogenesis and biogas production. A sludge bed formation in the bottom of the hybrid anaerobic reactor is suggested by the content increase obtained at the 14 cm (P3) sampling port section. The effect of the sludge bed biomass on the hybrid anaerobic reactor has already been observed in another study in which most of the removal of total phenols took place mainly at the reactor base [25]. In addition, the effectiveness of the packing bed placed on top of the hybrid anaerobic reactor used in this assay in promoting the retention of digested material was demonstrated by the fact that the greatest decline in parameters concentrations (COD and solids) were obtained in this section (48 cm column height).

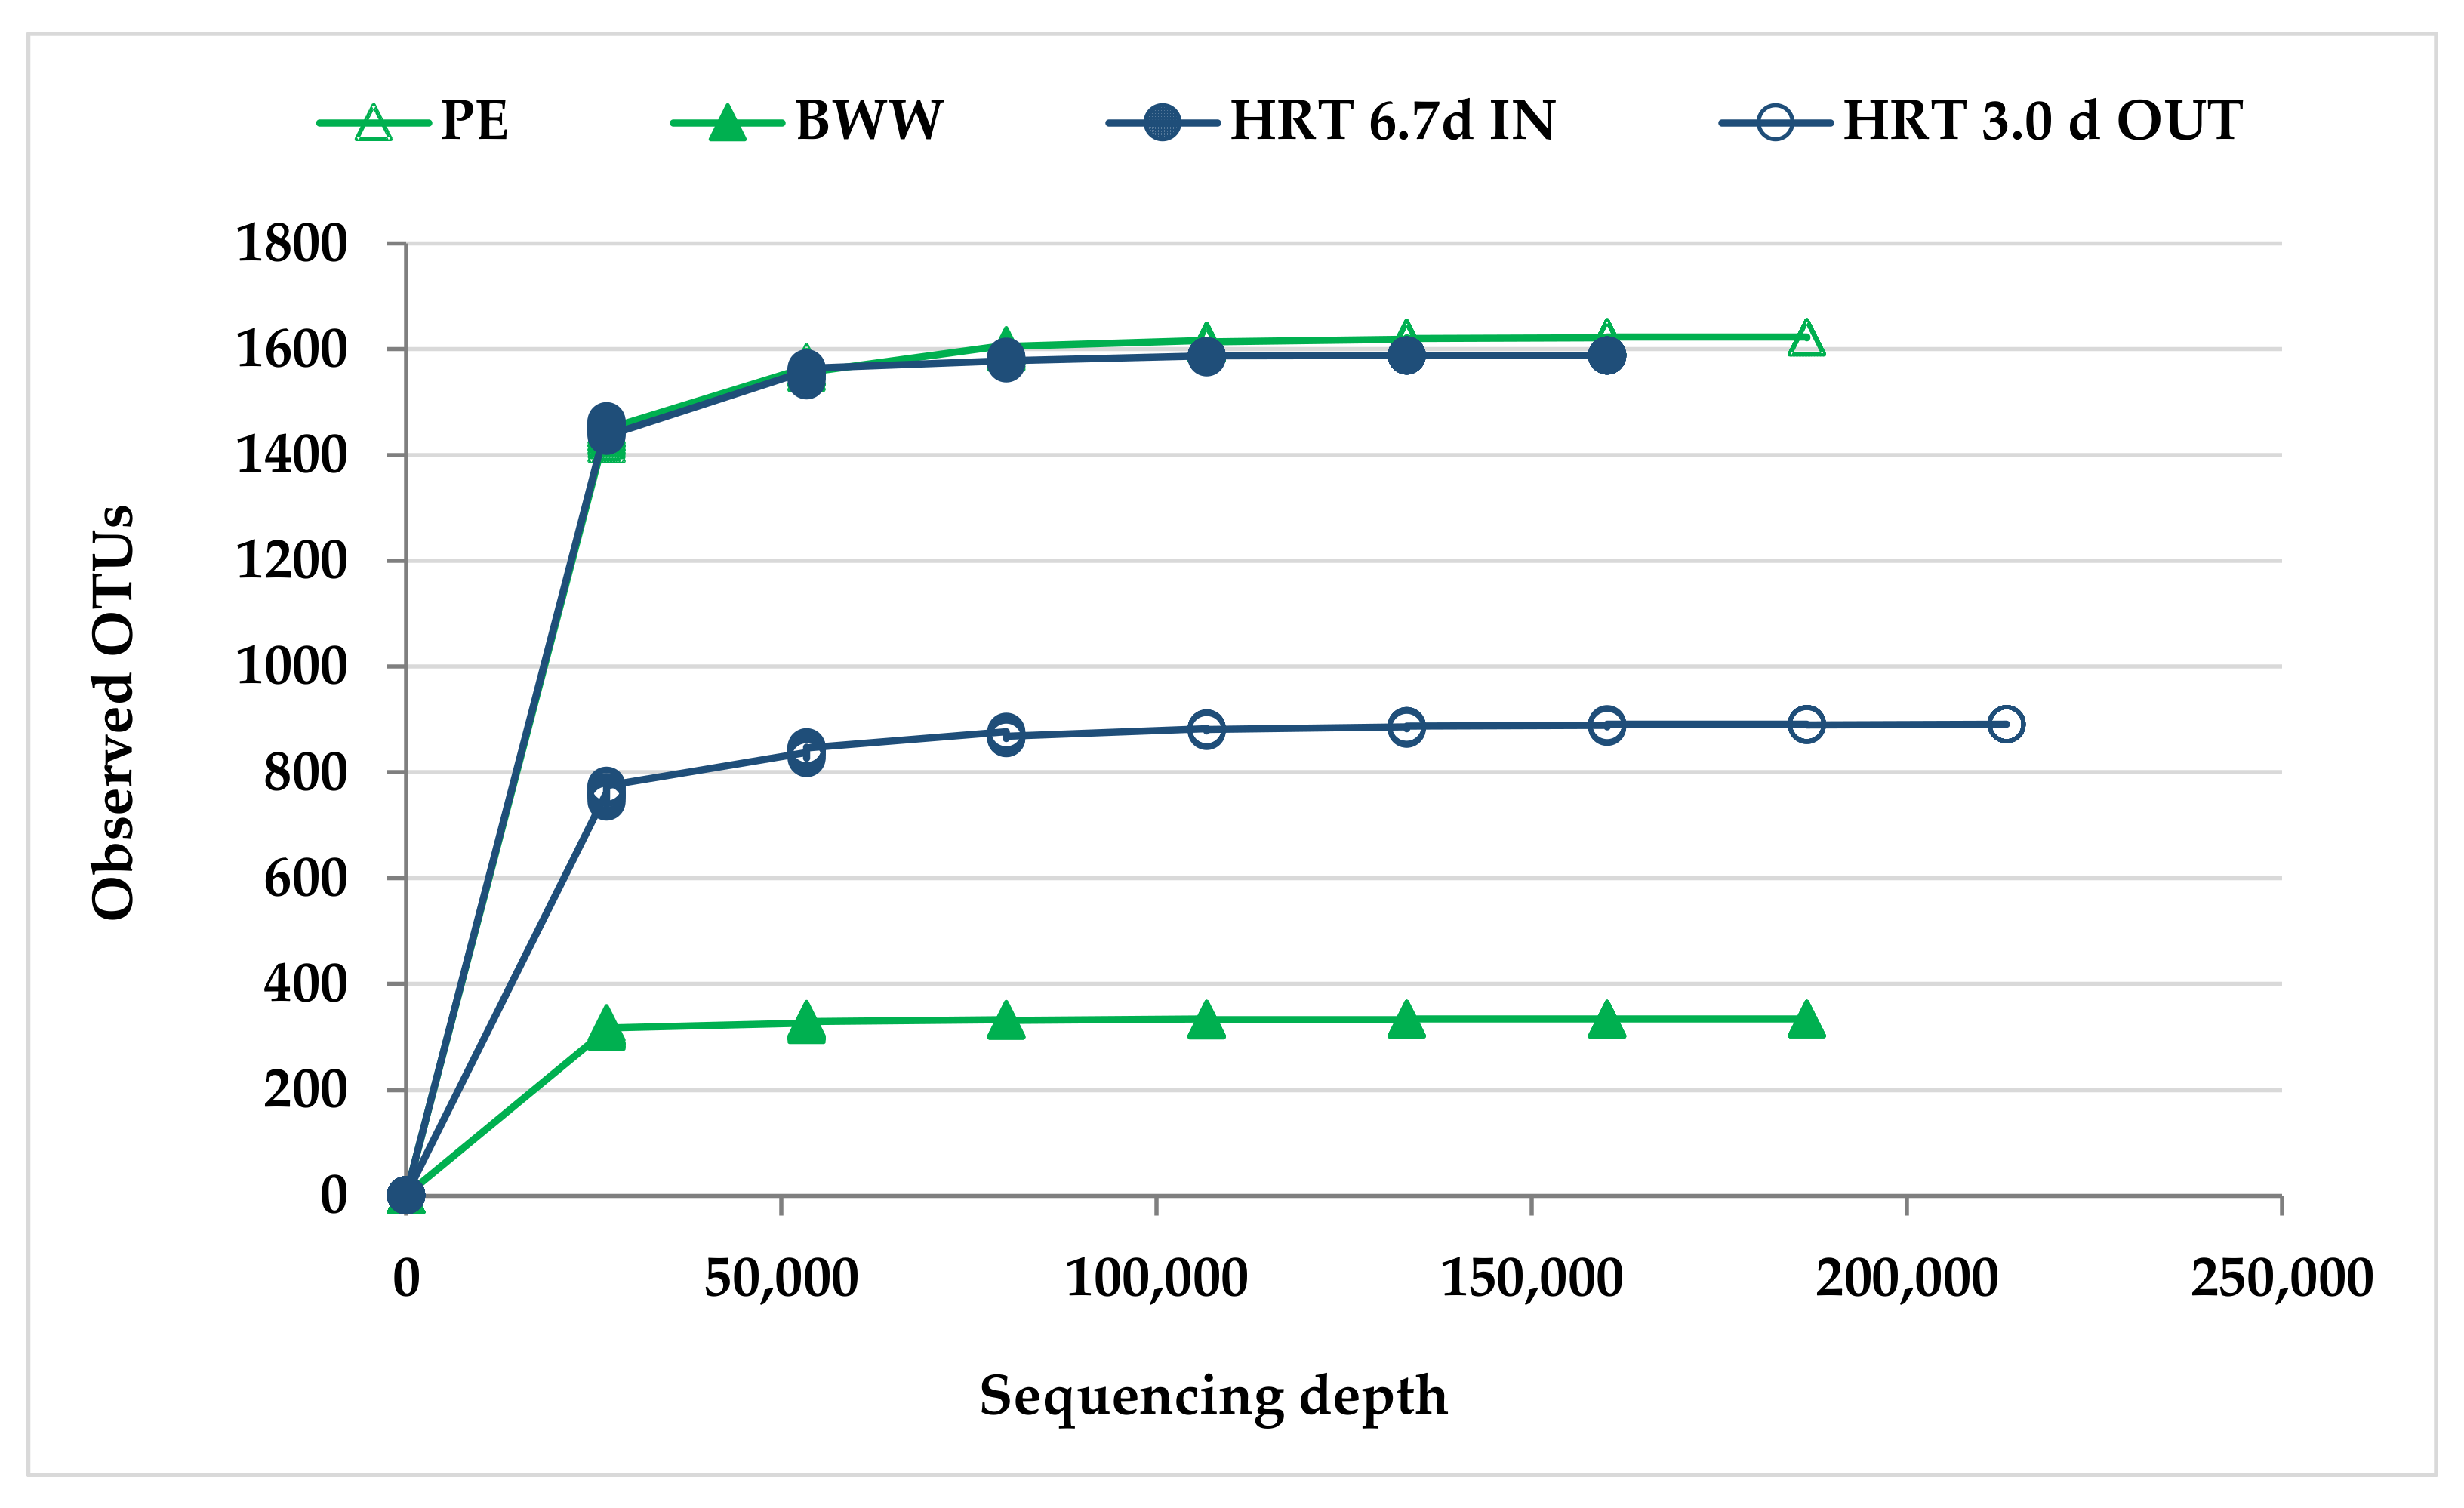
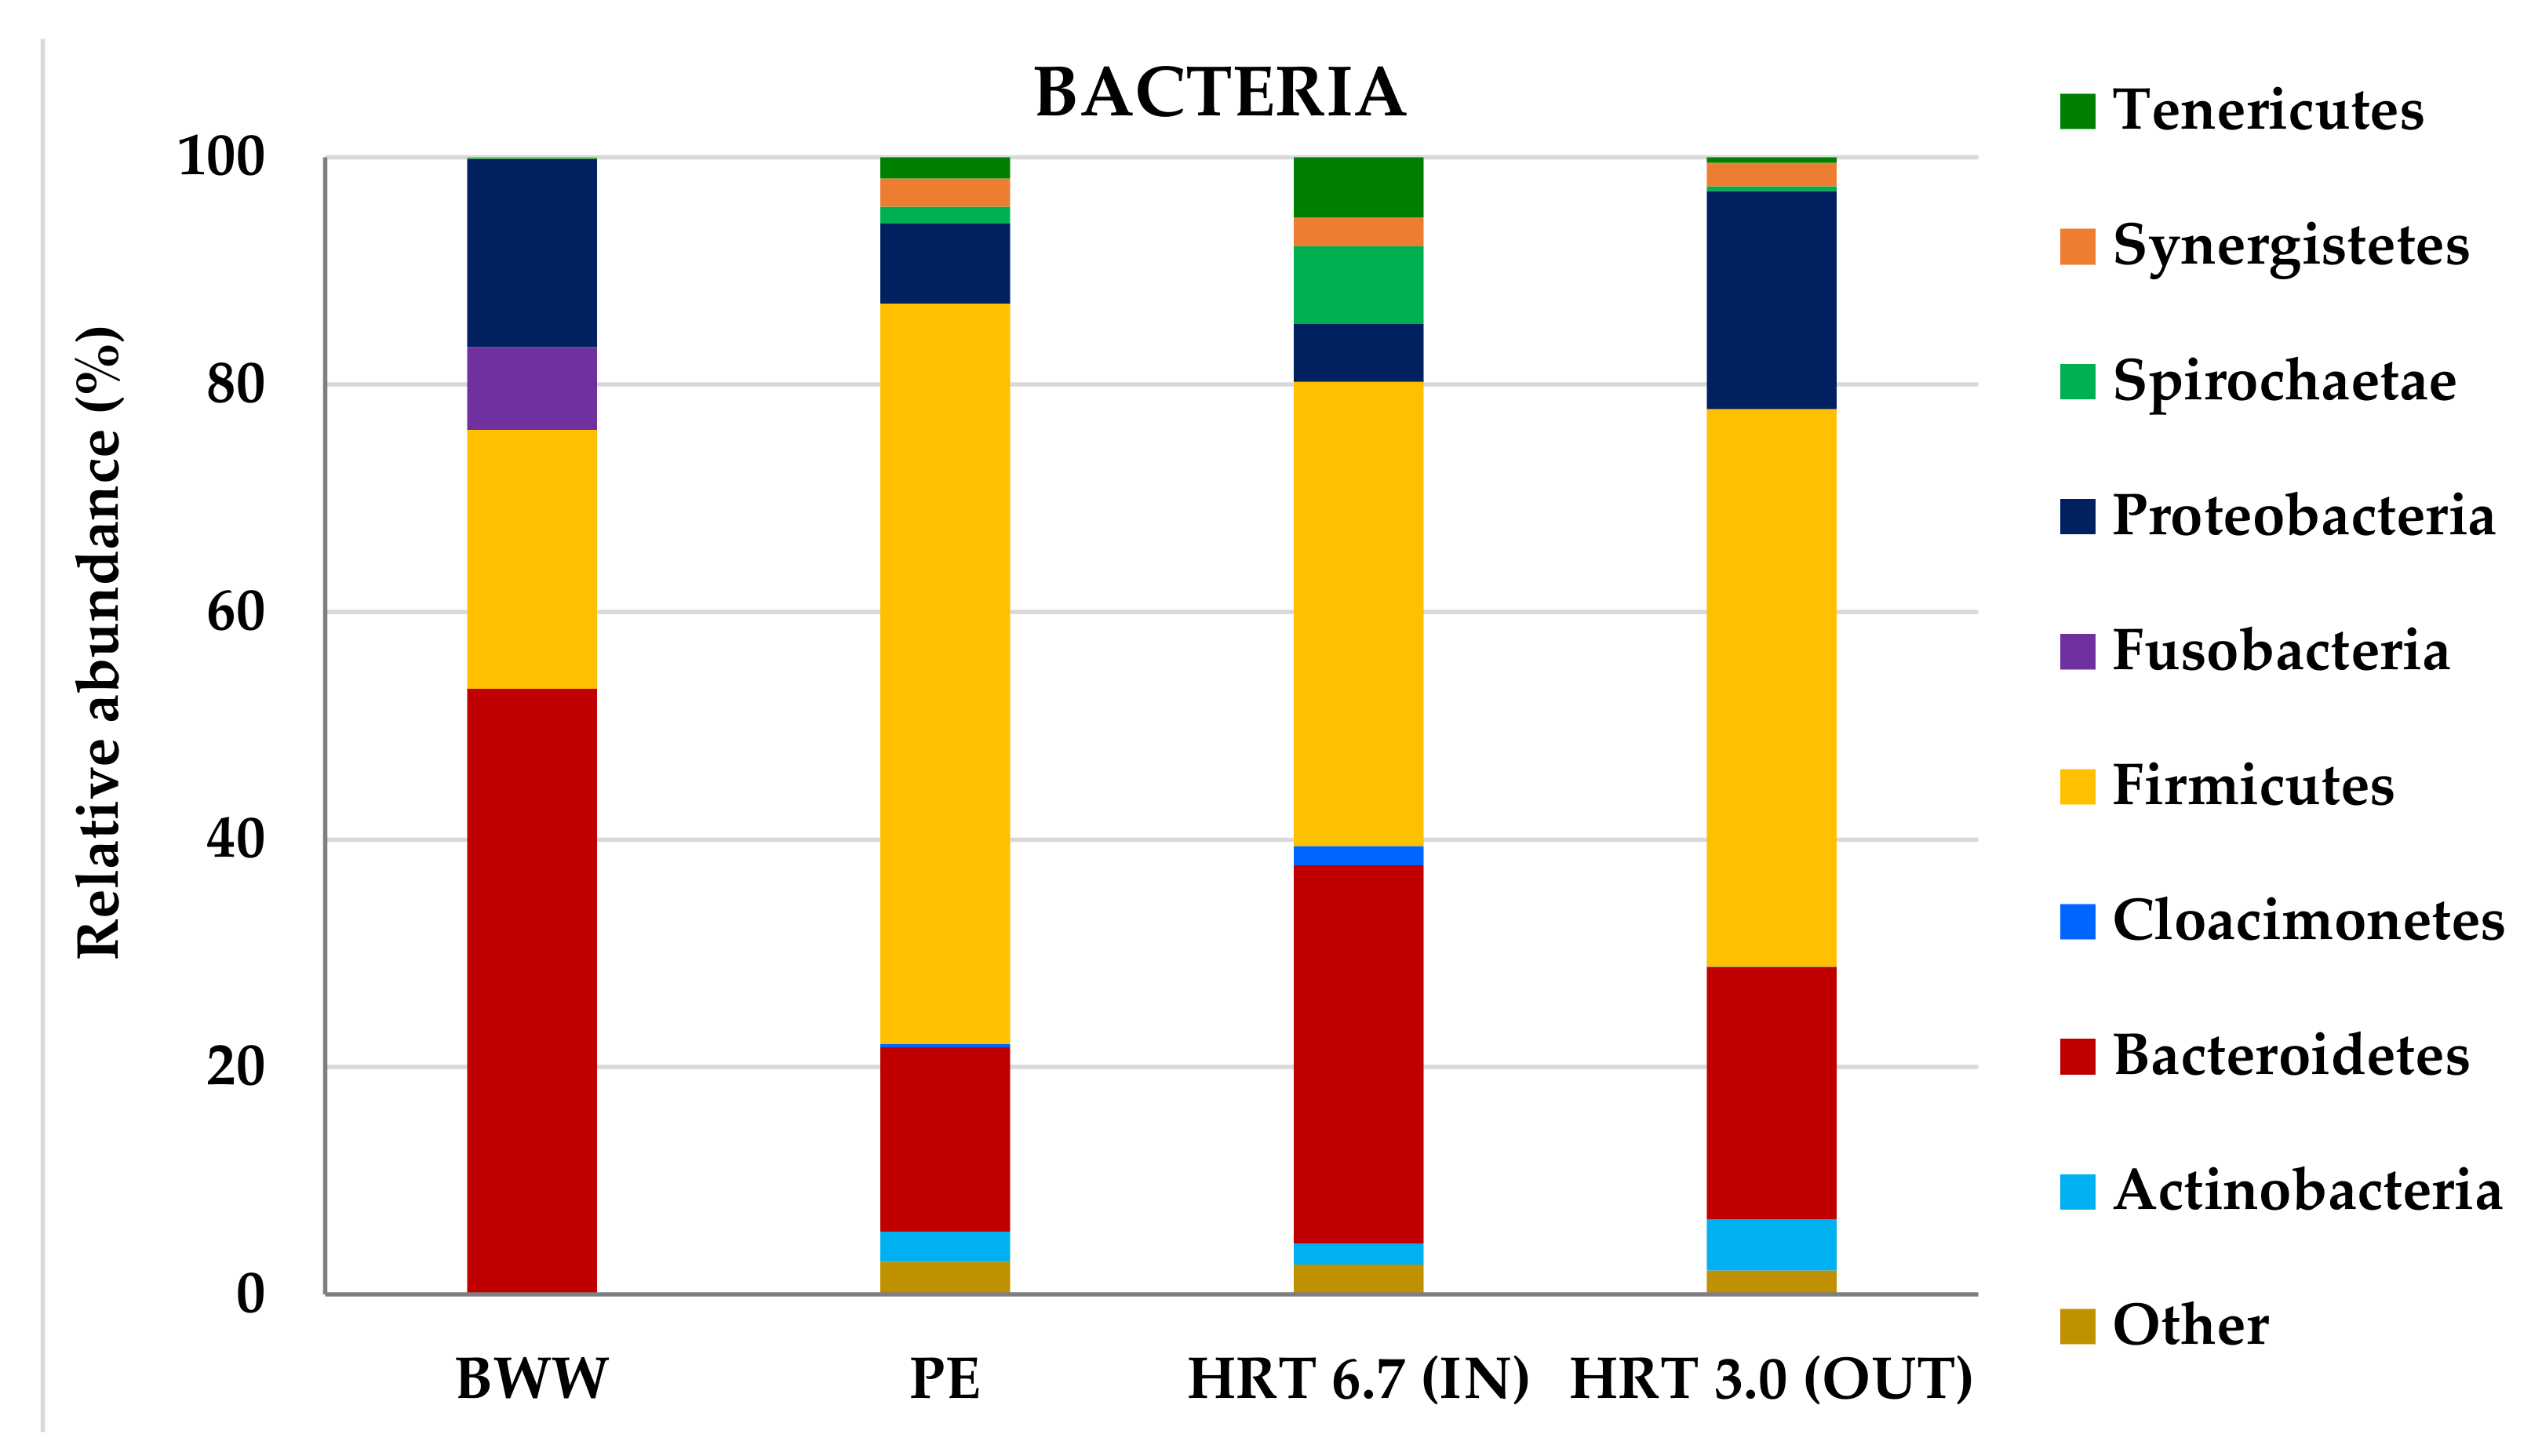
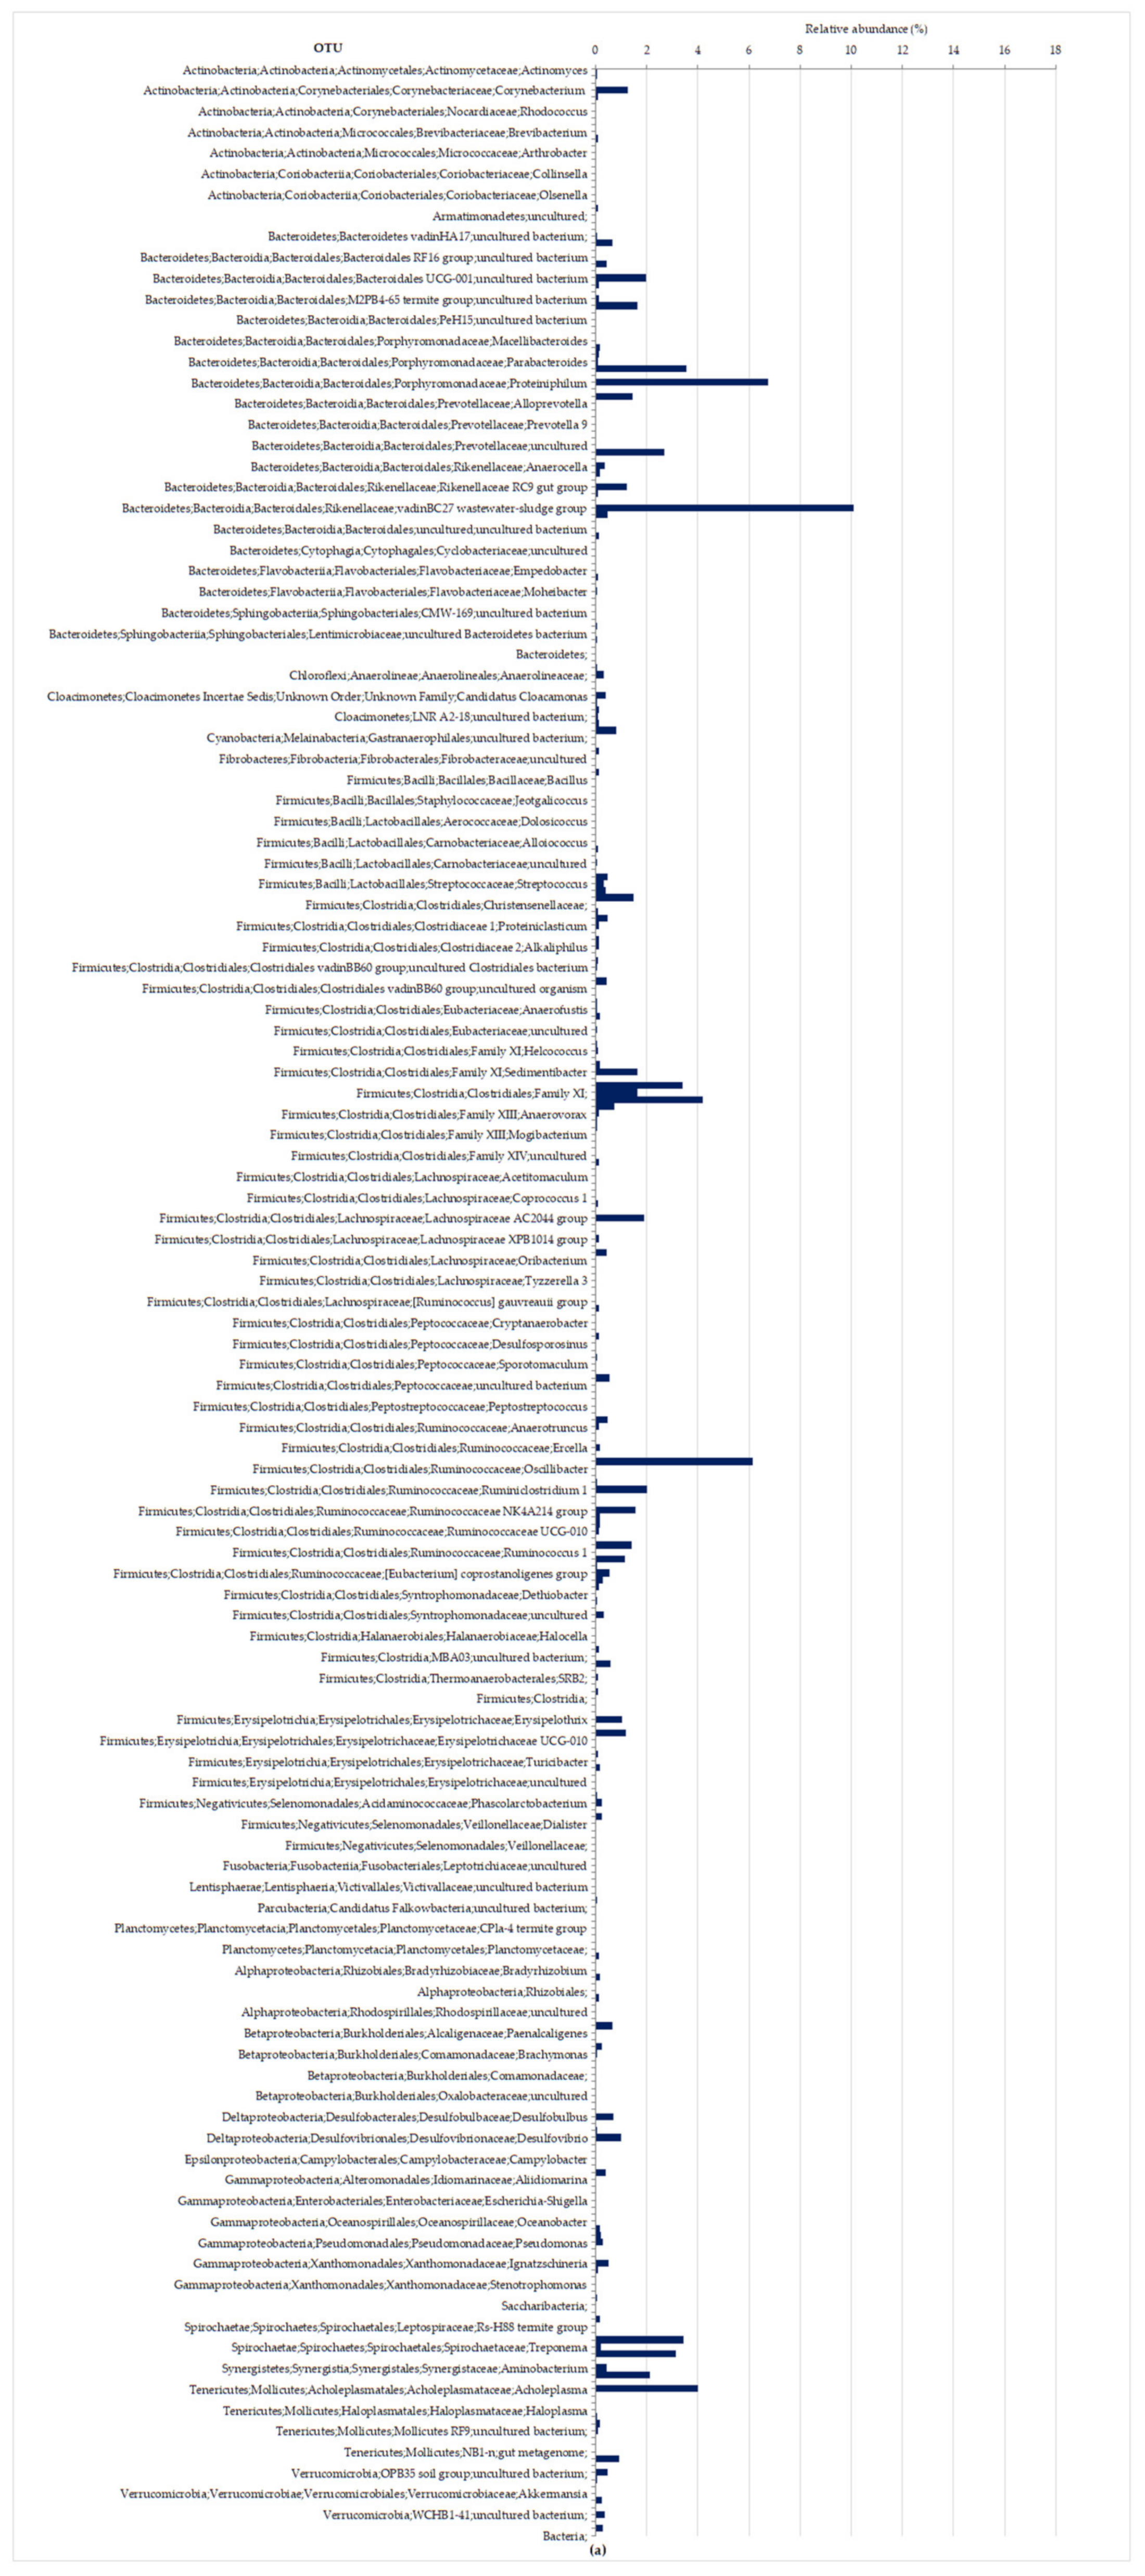
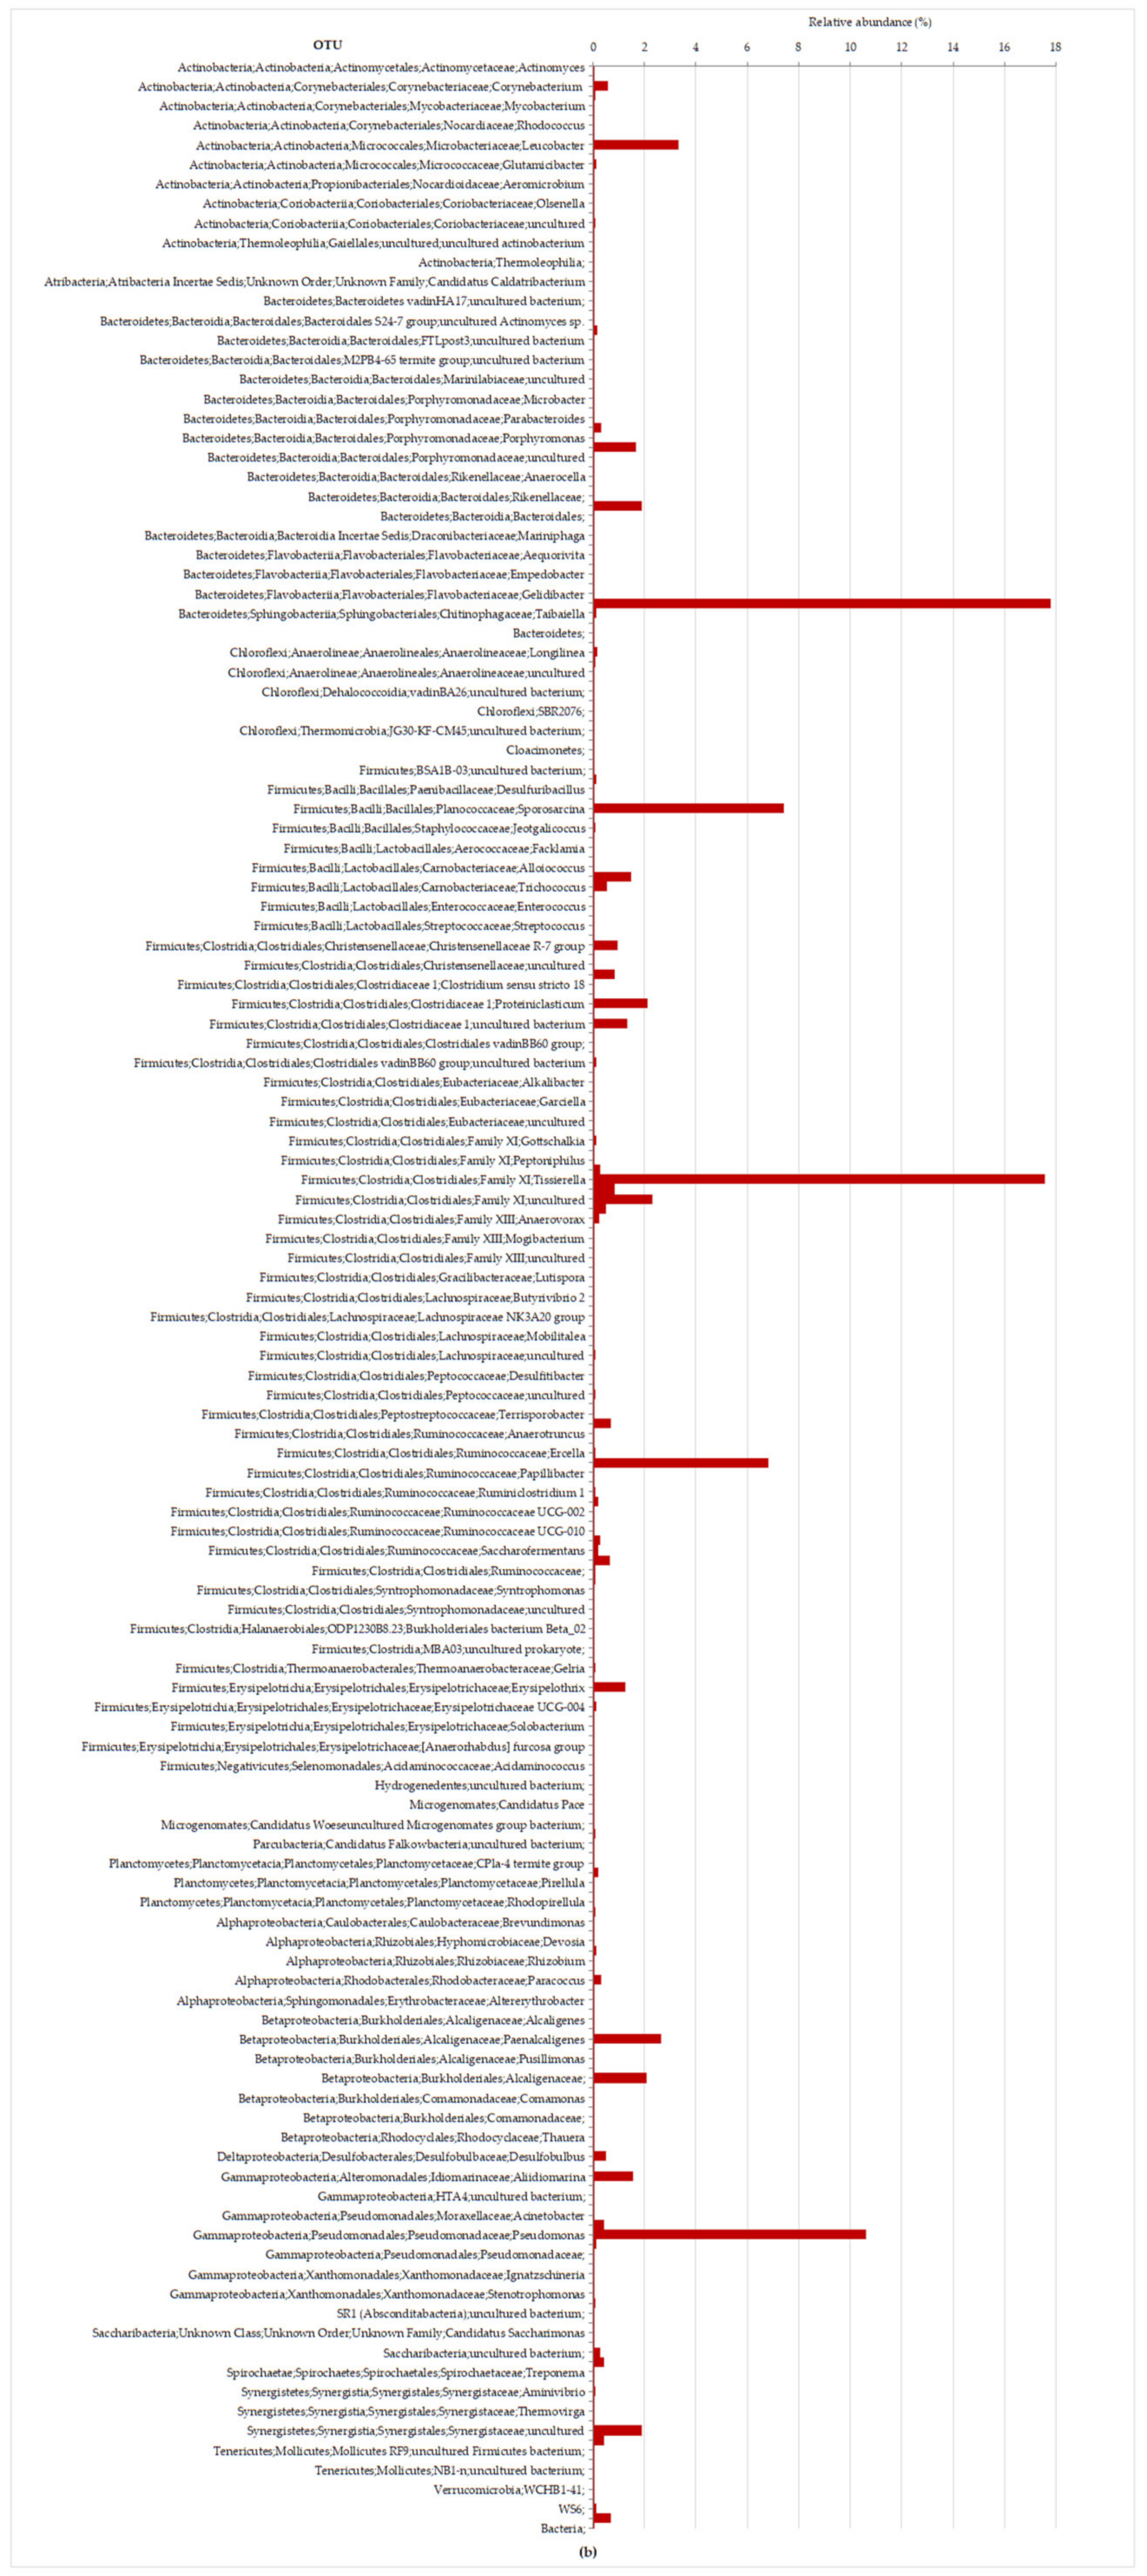
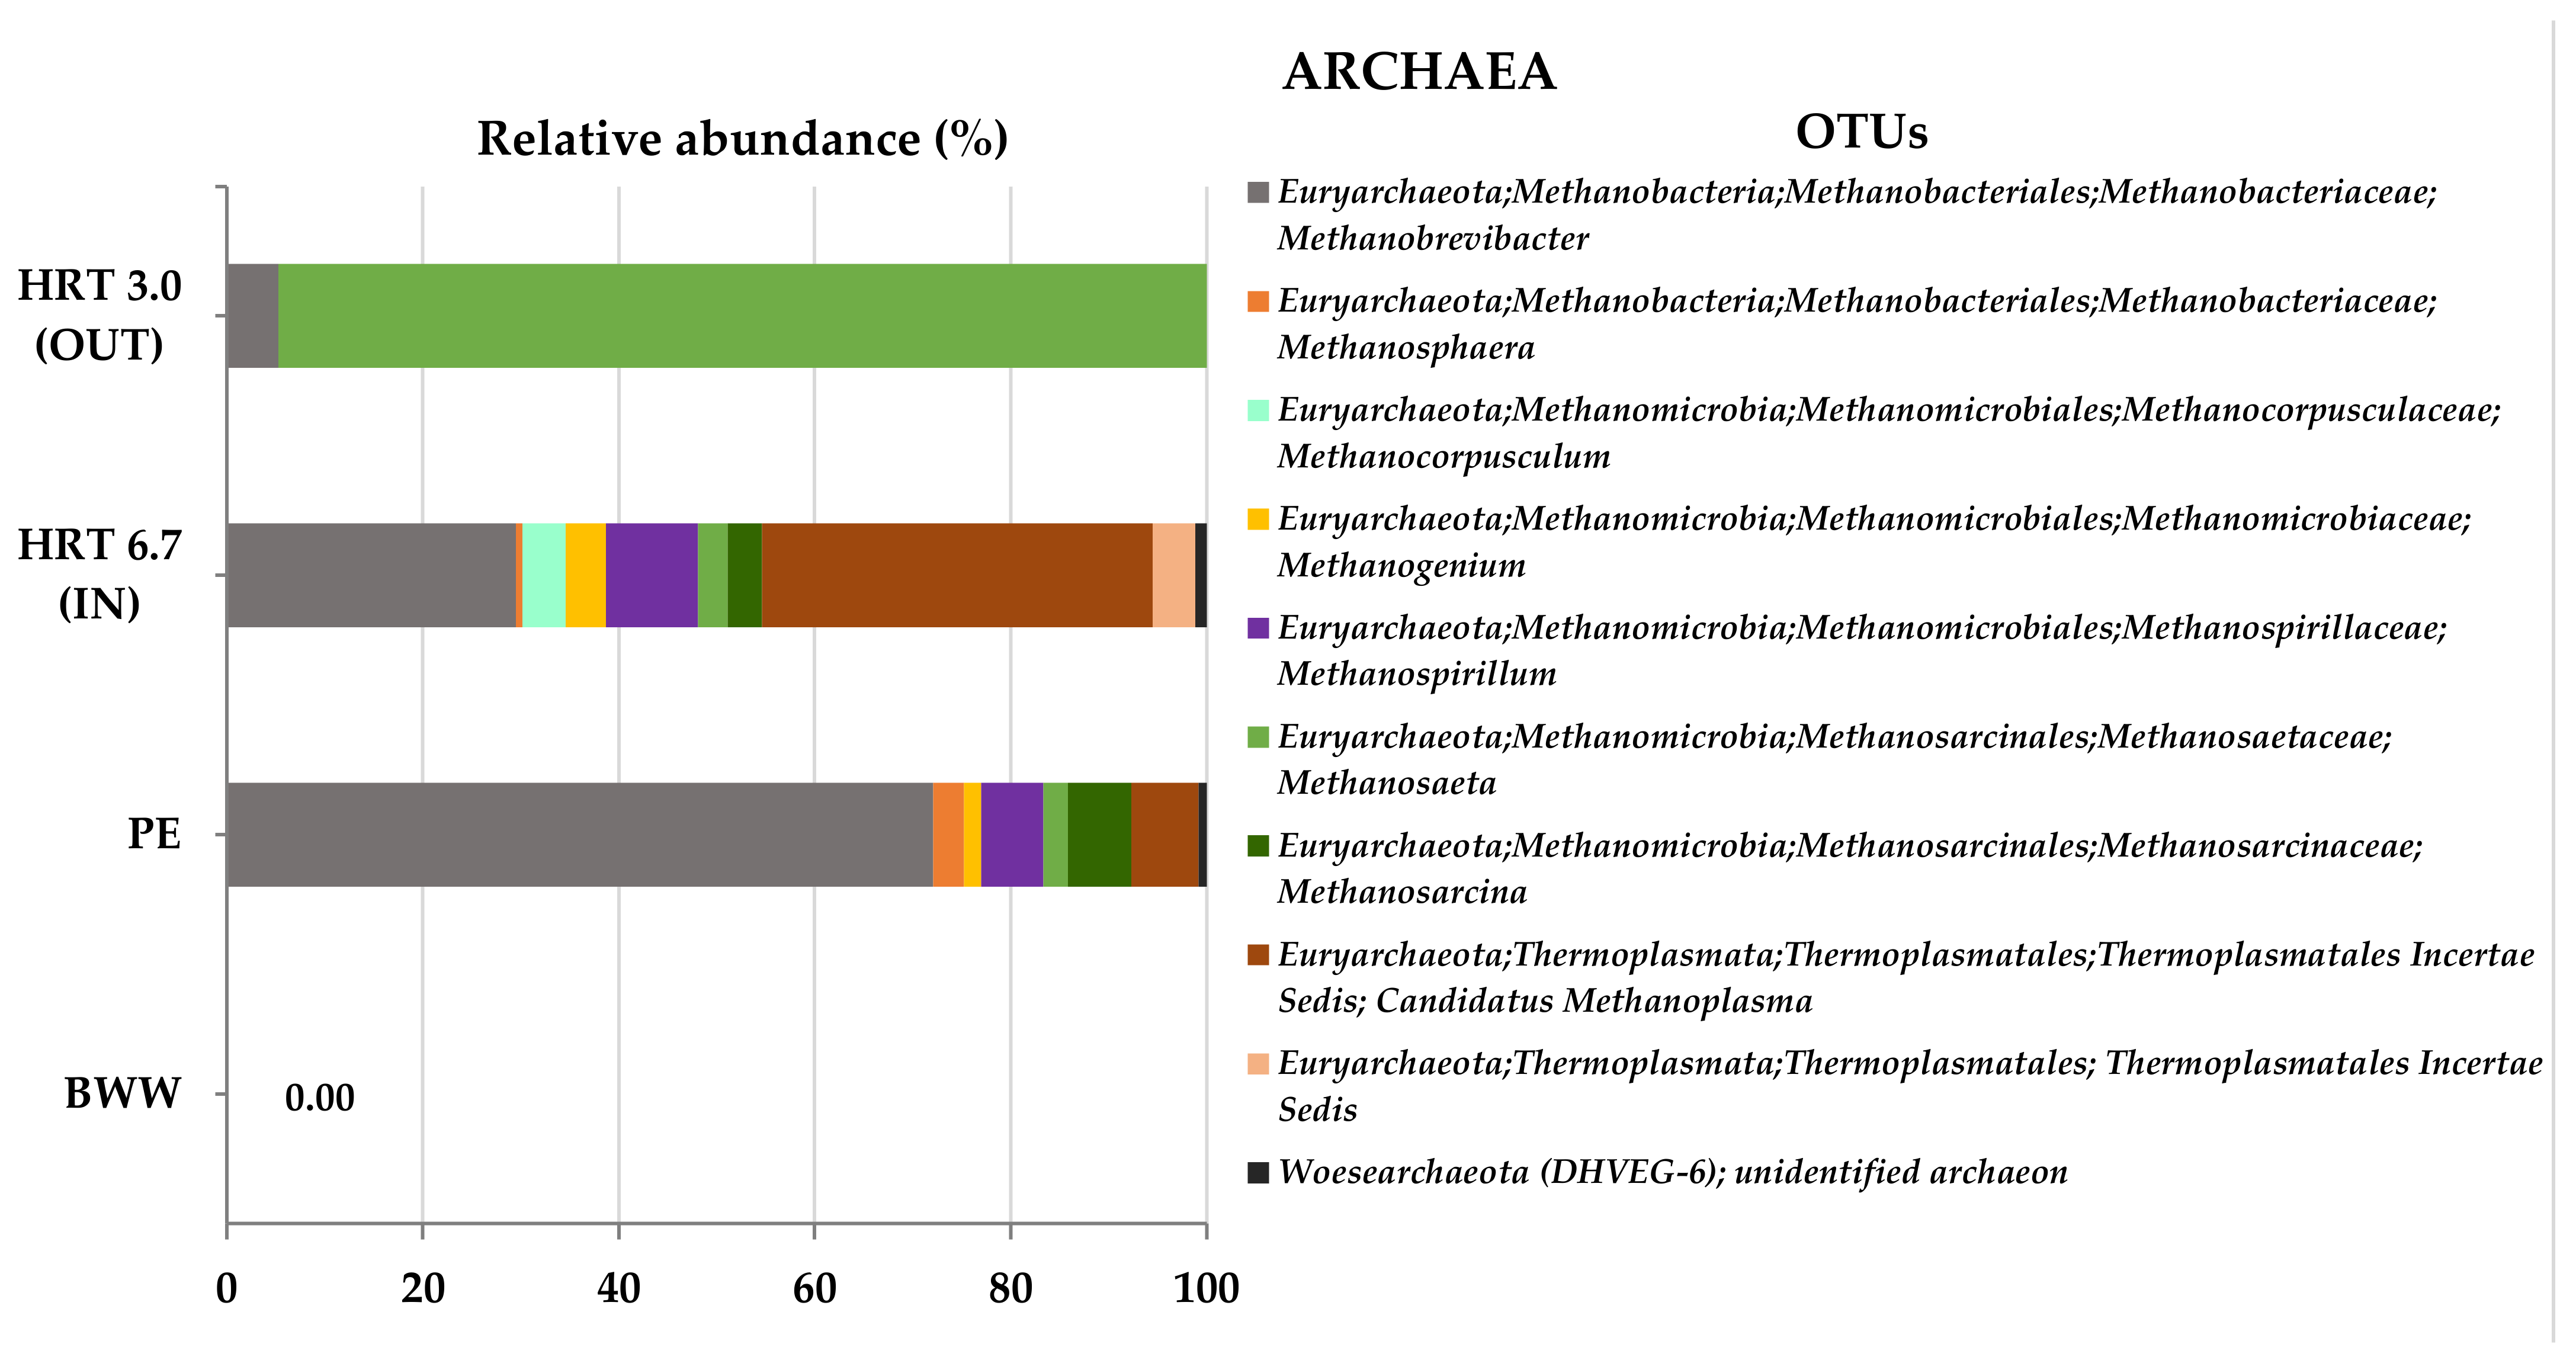
3.2.2. Molecular Characterization of Microbial Communities in the Hybrid Anaerobic Reactor

To compare distribution of microbial populations during the experiment, a microbial analysis of effluents and samples, collected at the beginning of HRT 6.7 d IN and at the end of HRT 3 d OUT, was conducted. The sample collected at the end of the first phase (HRT 6.7 d OUT) of anaerobic digestion failed library preparation and was excluded from the sequencing run.
After NGS, the samples generated were between the minimum of 609,126 and maximum of 682,804 raw sequence reads, which corresponded to samples HRT 6.7 d (IN) and HRT 3 d (OUT), respectively. A total of 777,827 sequences (775,651 bacterial, 2123 archaeal, and 53 unassigned) were retrieved and analyzed (Table 5). Libraries were composed of a total 2634 observed OTUs, that were detected in each sample.
The highest Shannon–Wiener indices (4.95 and 5.28 for bacteria and archaea, respectively, Table 5), suggested that microbial communities were the most diverse at the beginning of experiment (HRT 6.7 d IN). The further decrease observed in Shannon–Wiener index values, until the end of the anaerobic digestion, confirms the occurrence of the microbial acclimation (bacteria and archaea) to the operating hydraulic condition, that is, shortening HRT to 3 d with concomitant increase in OLR up to 10 g COD/L·d. The decrease in microbial diversity means that the microbiota suffers a specialization shift in the microbial structure, consistent with the good performance of the hybrid anaerobic reactor.
In the case of microbial diversity analysis, it is necessary to know whether the number of reads of the sequencing reaches a reasonable amount so that more sequencing does not significantly increase species diversity. Figure 4 indicates that, with 97% similarity levels, the rarefaction curve was asymptotic; that is, a flat portion of observed OTUs was attained, representing that the sequencing was sufficient for all samples, and the dataset of sequences had thoroughly sampled diversity in this analysis and sufficient sequence depth was achieved.
Relative abundance of bacterial and archaeal groups was determined in terms of the percentage of total number of sequences in each sample. As predictable, bacteria predominated the microbial populations in all samples, accounting for more than 99.7% of relative abundance at domain level (Table 6). The discrepancy found between Bacteria and Archaea is normal, real and has already been reported by other authors in anaerobic digestion processes [59,60,61]. Most of the microorganisms presented in the substrate (HRT 6.7 d IN) belonged to the Bacteria domain, with 0.7% represented by the Archaea domain (Table 6).
During the second phase (HRT 3 d) of the anaerobic digestion process in the hybrid anaerobic reactor, archaea populations drastically decreased yet, at a later phase, HRT 1 d, they recovered to the initial values of 0.7% (data not shown), confirming the maintenance quality of the biogas, at methane levels of around 80%.
The composition of the phyla with relative abundances of bacterial communities greater than 1% in at least one sample is illustrated in Figure 5. There were detected nine major phyla including Actinobacteria, Bacteroidetes, Cloacimonetes, Firmicutes, Fusobacteria, Proteobacteria, Spirochaetae, Synergistetes, and Tenericutes, accounting for 97.1% (PE)–99.9% (BWW) of the entire bacterial community. Members of phyla Bacteroidetes, Cloacimonetes, Firmicutes, Proteobacteria, Spirochaetae, and Synergistetes are known to be part of a structural community that efficiently converts the biomass, chemically complex feedstocks, into high-yield methane containing biogas [62]. Proteobacteria, Firmicutes, and Bacteroidetes are likely abundant in all anaerobic digestion systems and have been referred to by several authors (e.g., [59,60,61,63]). Moreover, these phyla contain several species whose metabolism can contribute to one or more of the phases of the general anaerobic digestion process.
A diverse bacterial population was found in both effluents (Figure 5), being dominated mainly by Bacteroidetes (53%) on BWW and by Firmicutes (65%) on PE. These bacterial populations remain predominant throughout the experiment, and Firmicutes increases from 41% to 49% on the last phase (HRT 3 d OUT) becoming the predominant phylum in this sample. The observed decrease in Bacteroidetes during anaerobic digestion further implies that it may have competed with Firmicutes over the same resources on the reactor, the latter prevailing. Buhlmann et al. [64] already mentioned that Bacteroidetes and Firmicutes have been identified as the main bacterial phyla present within anaerobic digesters. Most of members of the phyla Bacteroidetes are known for their ability either to convert easily degradable amino acids, sugars, and alcohols into VFA, which emphasizes their potential crucial role in acido- and acetogenesis. On the other hand, the Bacteroidetes activity can be self-inhibited by the accumulation of acids [65]. Some Firmicutes are known to be syntrophic bacteria capable of degrading VFAs, such as butyrate and its analogues [63]. In addition, most of strains in the phylum Firmicutes might hydrolyze cellulose, glucose, starch, and proteins into small molecular organic acids such as acetate, highly contributing to improvement of the methane production yield [66,67]. Microbial community profiles are demonstrated with more detail at genus level in Figure 6. In the anaerobic digestion process, most of the members of Bacteroidetes were assigned to Bacteroidales or Flavobacteriales, respectively, at 33% and 18% for HRT 6.7 d IN and HRT 3 d OUT, and most of the members of Firmicutes were assigned to Clostridiales (35% and 37%, respectively, for HRT 6.7 d IN and HRT 3 d OUT). At the end of the HRT 3 d phase (Figure 6b), microbial populations of the order Flavobacteriales became predominant (18%), and consisted mainly of members of the family Flavobacteriaceae, genus Moheibacter (17.8%), replacing the Bacteroidales populations. Moheibacter has been described as a strictly aerobic bacterium and without an important role in the breakdown of complex or other carbohydrates [68,69], which can explain its sudden appearance at this stage. Apparently, these changes in bacterial populations are meaningless and without much influence on the performance of the process. During this phase, Bacillales also became part of the composition structure of microbial communities (7.8%). Bacillales, whose order consisted mainly of members of the family Planococcaceae, and genus Sporosarcina (7.4%), which are known as good carbohydrate-utilizing species [60], and as Clostridiales, also Bacillales can decompose protein, cellulose, fat, and carbohydrates to produce VFAs [65].
As can be observed in Figure 5, Proteobacteria, known degraders of polysaccharides and more complex substrates [65], predominate at phase HRT 3 d (19%). All five classes within the Proteobacteria were detected during the experiment, Beta- and Gammaproteobacteria dominated at HRT 3 d representing, respectively, 5% and 13% of the total bacterial sequences (Figure 6b). Betaproteobacteria is involved in the first steps of degradation during the anaerobic digestion process, and they are the main consumers of propionate, butyrate, and acetate [70]. Most of the members of Betaproteobacteria belong to the family Alcaligenaceae that increased from 1% (6.7-d HRT, Figure 6a) to 4.8% (3-d HRT, Figure 6b) of total sequences. At HRT 3 d (Figure 6b), Gammaproteobacteria represented 28,784 sequences, with the genus Pseudomonas representing 81% of those sequences and 11% of bacterial sequences. Pseudomonadaceae is a group with important environmental functions, such as bioremediation of toxic residues, as well as xenobiotic compound degradation. The presence of Pseudomonas in the microbiota also has been related with phenol degradation and organic matter removal, during the effluents biotreatment processes [32].
During the anaerobic digestion of the mixture BWW + PE (60:40, v/v), slight changes in the structure of the bacterial populations were observed, mainly at HRT 3 d, in which the pronounced increase in Bacillales, Pseudomonadaceae and Alcaligenaceae certainly may have contributed to the stabilization of the process at a continuous feeding regime with OLR of 10 g COD/L·d, achieving 95% VFA removal rates, and around 2 L biogas/L·d.
Methanogenesis has three major pathways, each converting a different substrate into methane gas [71]: methylotrophic (decarboxylation of methyl alcohols/methyl amines/methyl sulfides); hydrogenotrophic (reduction of H2/CO2); and acetoclastic methanogenesis (decarboxylation of acetate). The pathway which leads to the methane production occurring in an anaerobic reactor only depends on the methanogenic populations and the availability of the suitable substrates for the anaerobic digestion process.
Regarding the Archaea domain, Figure 7 shows considerable changes that occurred during anaerobic digestion in the hybrid anaerobic reactor. Of most archaeal sequences, 99% were classified within the phylum Euryarchaeota, and only 18 sequences were assigned to the phylum Woesearchaeota, present in the piggery effluent and at the beginning (HRT 6.7 d IN) of the assay, which were later not detected after anaerobic digestion. As for the Bacteria domain, Archaea also shows high diversity, 5.28 (Table 5) on samples at the beginning of the anaerobic digestion (HRT 6.7 d IN), with predominance in archaea communities of the obligately hydrogen-dependent methylotroph Candidatus Methanoplasma (40%) and the hydrogenotrophs Methanobrevibacter (29%), and Methanospirillum (9%), as shown in Figure 7.
Since no archaea populations were detected in brewery wastewater, it can be concluded that the archaeal populations in piggery manure were crucial to further production of methane in this experiment. After the anaerobic digestion of the mixture BWW + PE (60:40, v/v), a considerable shift in the archaeal populations had occurred, and Methanosaeta, an obligate acetoclastic methanogen, became the dominant genus, reaching 95% of archaea populations at the end of HRT 3 d (Figure 7), and 84% in a later phase, HRT 1 d (data not shown). The presence of Methanosaeta in these phases means that the methane produced during anaerobic digestion in the hybrid anaerobic reactor was formed through acetoclastic methanogenesis as the main pathway [49,72,73]. These results are in line with the high biogas composition in methane (between 77% and 80%) along the anaerobic digestion (Figure 2), indicating the presence of the active methanogenic archaea populations at all tested conditions. The important involvement of Methanosaeta in the methanogenesis process is evident, also being reported in the literature as predominant in several anaerobic digestion systems [49,59,74].
In addition, VFA concentrations (Table 3) never reached the inhibitory level for methanogenic activity throughout the experiment and, more importantly, the limit of propionic acid concentration was maintained lower than 2000 mg/L, as stated by Lee et al. [75], not inhibiting the methanogens.
These results show that communities of bacterial and archaeal populations were affected by the composition of the substrates mixture of brewery wastewater and piggery effluent, and by the HRT and OLR operating conditions.

4. Conclusions

The inhibiting capacity of the unusual and concentrated piggery effluent can be advantageously overcome by applying the complementary effluents concept. The brewery wastewater used as the complement provided the decrease in the piggery effluent concentrations, such as nitrogen, VFA and TP contents, making the anaerobic digestion process viable without any previous change in its composition. The tested hybrid anaerobic reactor withstood large substrate streams (HRT of 6.7 d and 3 d) whose high organic loading rates of 4.5 and 10.0 g COD/L·d provided productions in biogas of 1.2 and 2.1 L/L·d (77.8–79.5% CH4), respectively.
Different functional sections of the hybrid anaerobic reactor could be recognized: (a) the unit bottom (0–14 cm) identified as the sludge blanket section, presents the highest matter concentration (COD, TS and VS) and carries out the main consumption of VFA and the basification of pH; (b) the unit central section (14–37 cm) where a decrease in previous concentrations was observed and VFA is maintained in low content and pH in the same basic value; (c) the unit upper section (37–48 cm) shows the greatest reduction in the matter concentrations that is justified by the functional action of the packing bed in retaining the material in digestion. VFA and pH were maintained at the preceding values.
The metagenomic analysis presented a considerable shift of the microbial populations during the experiments towards a specialization to the operational conditions in the anaerobic processes, with the loss of the initial population diversity. The high relative abundance of Bacillales, Clostridiales and Pseudomonas could be indicative of the important contribution of these bacteria to the efficient bioconversion at HRT 3 d. Likewise, Methanosaeta was the predominant methanogenic archaeal genus, strongly suggesting that acetoclastic methanogenesis could be the main pathway in the process.
Long-term studies will provide more insights on the hybrid reactor behavior digesting unbalance/inhibiting effluents concerning its efficiency under extreme operating conditions of organic load. Microbial biomass stratification and function and the packing bed effect on the unit removal capacity will be the predictable goal of future research in the continuation of this work.

Author Contributions

Conceptualization, A.E. and I.P.M.; data curation, A.E., A.N. and I.P.M.; formal analysis, A.E. and I.P.M.; investigation, A.E., A.N. and I.P.M.; methodology, A.E., A.N. and I.P.M.; resources, A.E. and I.P.M.; supervision, A.E. and I.P.M.; validation, A.E. and I.P.M.; writing—original draft, A.N.; writing—review and editing, A.E. and I.P.M. All authors have read and agreed to the published version of the manuscript.

Funding

This research was funded by ERANETLAC/0001/2014—GREENBIOREFINERY project.

Institutional Review Board Statement

Not applicable.

Informed Consent Statement

Not applicable.

Data Availability Statement

Publicly available datasets were analyzed in this study. These data can be found at the NCBI Sequence Read Archive (SRA) database with accession numbers of SRR13579864, and SRR13697433–SRR13697436 (bioproject PRJNA701622).

Acknowledgments

Authors would like to thank SOCIEDADE CENTRAL DE CERVEJAS E BEBIDAS (SCC, Vialonga, Portugal) and VALORGADO (Salvaterra de Magos, Portugal) for supplying the brewery wastewaters and piggery effluents. Special thanks to Natércia Santos for laboratory assistance.

Conflicts of Interest

The authors declare no conflict of interest.

References

  1. Conway, J. Published in Statista, 12 October 2020. Available online: https://www.statista.com/statistics/270275/worldwide-beer-production/ (accessed on 27 February 2021).
  2. Simate, G.S.; Cluett, J.; Iyuke, S.E.; Musapatika, E.T.; Ndlovu, S.; Walubita, L.F.; Alvarez, A.E. The treatment of brewery wastewater for reuse: State of the art. Desalination 2011, 273, 235–247. [Google Scholar] [CrossRef]
  3. Amienyo, D.; Azapagic, A. Life cycle environmental impacts and costs of beer production and consumption in the UK. Int. J. Life Cycle Asses. 2016, 21, 492–509. [Google Scholar] [CrossRef] [Green Version]
  4. Shahbandeh, M. Published in Statista, 30 April 2020. Available online: https://www.statista.com/statistics/273232/net-pork-production-worldwide-by-country/ (accessed on 29 February 2021).
  5. Guia 333. 2020. Available online: https://www.3tres3.com.pt/estadisticas_suino/graficos/#5 (accessed on 29 February 2021).
  6. Dalibard, C. Livestock′s contribution to the protection of the environment. 1995. Available online: http://www.fao.org/ag/Aga/agap/FRG/FEEDback/War/V8180b/v8180b14.htm (accessed on 29 February 2021).
  7. Meegod, J.N.; Li, B.; Patel, K.; Wang, L.B. A Review of the Processes, Parameters, and Optimization of Anaerobic Digestion. Int. J. Environ. Res. Public Health 2018, 15, 2224. [Google Scholar] [CrossRef] [PubMed] [Green Version]
  8. Skerman, A.G. Methane Recovery and Use at Grantham Piggery—Addendum to Final Report; RIRDC Publication No. 13/107; RIRDC: Canbera, Australia, 2013; ISBN 978-1-74254-600-1. [Google Scholar]
  9. Ward, A.J.; Hobbs, P.J.; Holliman, P.J.; Jones, D.L. Optimisation of the anaerobic digestion of agricultural resources. Bioresour. Technol. 2008, 99, 7928–7940. [Google Scholar] [CrossRef] [PubMed]
  10. Náthia-Neves, G.; Berni, M.; Dragone, G.; Mussatto, S.I.; Forster-Carneiro, T. Anaerobic digestion process: Technological aspects and recent developments. Int. J. Environ. Sci. Technol. 2018, 15, 2033–2046. [Google Scholar] [CrossRef]
  11. Rajagopal, R.; Massé, D.I.; Singh, G. A critical review on inhibition of anaerobic digestion process by excess ammonia. Bioresour. Technol. 2013, 143, 632–641. [Google Scholar] [CrossRef]
  12. Mladenovska, Z.; Hartmann, H.; Kvist, T.; Sales-Cruz, M.; Gani, R.; Ahring, B.K. Thermal pretreatment of the solid fraction of manure: Impact on the biogas reactor performance and microbial community. Water Sci. Technol. 2006, 53, 59–67. [Google Scholar] [CrossRef] [Green Version]
  13. Neira, K.; Jeison, D. Anaerobic co-digestion of surplus yeast and wastewater to increase energy recovery in breweries. Water Sci. Technol. 2010, 61, 1129–1135. [Google Scholar] [CrossRef]
  14. Marques, I.P.; Texeira, A.; Rodrigues, L.; Dias, S.M.; Novais, J.M. Anaerobic co-treatment of olive mill and piggery effluents. Environ. Technol. 1997, 18, 265–274. [Google Scholar] [CrossRef]
  15. Marques, I.P.; Texeira, A.; Rodrigues, L.; Dias, S.M.; Novais, J.M. Anaerobic treatment of olive mill wastewater with digested piggery effluent. Water Environ. Res. 1998, 70, 1056–1061. [Google Scholar] [CrossRef]
  16. Marques, I.P. Anaerobic digestion treatment of olive mill wastewater for effluent re-use in irrigation. Desalination 2001, 137, 233–239. [Google Scholar] [CrossRef]
  17. Marques, I.P.; Sampaio, M.; Gonçalves, M. Process for the treatment of inhibiting/toxic organic waste and production of biofuels by obtaining an adapted microbial consortium. Portuguese Patent 105738, 29 October 2013. [Google Scholar]
  18. Sampaio, M.A.; Gonçalves, M.R.; Marques, I.P. Anaerobic digestion challenge of raw olive mill wastewater. Bioresour. Technol. 2011, 102, 10810–10818. [Google Scholar] [CrossRef] [PubMed]
  19. Assemany, P.; Marques, I.P.; Calijuri, M.L.; Reis, A. Complementarity of Substrates in Anaerobic Digestion of Wastewater Grown Algal Biomass. Waste Biomass Valor. 2020, 11, 5759–5770. [Google Scholar] [CrossRef]
  20. Eusébio, A.; Neves, A.; Marques, I.P. Structure of Microbial Communities when Complementary Effluents are Anaerobically Digested. Appl. Sci. 2021, 11, 1293. [Google Scholar] [CrossRef]
  21. Pérez-Pérez, T.; Pereda-Reyes, I.; Oliva-Merencio, D.; Zaiat, M. Anaerobic digestion technologies for the treatment of pig wastes. Cuba. J. Agr. Sci. 2016, 50, 343–354. [Google Scholar]
  22. Gonzalez-Tineo, P.A.; Durán-Hinojosa, U.; Delgadillo-Mirquez, L.R.; Meza-Escalante, E.R.; Gortáres-Moroyoqui, P.; Ulloa-Mercado, R.G.; Serrano-Palacios, D. Performance improvement of an integrated anaerobic-aerobic hybrid reactor for the treatment of swine wastewater. J. Water Process Eng. 2020, 34, 101164. [Google Scholar] [CrossRef]
  23. Deng, K.; Tang, L.; Lib, J.; Meng, J.; Li, J. Practicing anammox in a novel hybrid anaerobic-aerobic baffled reactor for treating high-strength ammonium piggery wastewater with low COD/TN ratio. Bioresour. Technol. 2019, 294, 122193. [Google Scholar] [CrossRef]
  24. Hui-ting, L.; Yong-feng, L. Performance of a hybrid anaerobic baffled reactor (HABR) treating brewery wastewater. In Proceedings of the 2010 International Conference on Mechanic Automation and Control Engineering, Wuhan, China, 26–28 June 2010. [Google Scholar]
  25. Gonçalves, M.R.; Freitas, P.; Marques, I.P. Bioenergy recovery from olive mill effluent in a hybrid reactor. Biomass Bioenergy 2012, 39, 253–260. [Google Scholar] [CrossRef] [Green Version]
  26. Marques, I.P. Anti-clogging packed bed for fixed bed digesters as support for microorganisms and gas-liquid separator. Portuguese Patent 106576, 28 April 2015. [Google Scholar]
  27. Mendonça, H.V.; Ometto, J.P.H.B.; Otenio, M.H.; Reis, A.J.D.; Marques, I.P.R. Bioenergy recovery from cattle wastewater in an UASB-AF. Water Sci. Technol. 2017, 76, 2268–2279. [Google Scholar] [CrossRef]
  28. Assemany, P.; Marques, I.P.; Calijuri, M.L.; da Silva, T.L.; Reis, A. Energetic valorization of algal biomass in a hybrid anaerobic reactor. J. Environ. Manag. 2018, 209, 308–315. [Google Scholar] [CrossRef] [Green Version]
  29. Standard Methods for Examination of Water and Wastewater, 22nd ed.; American Public Health Association: Washington, DC, USA; American Water Works Association: Denver, CO, USA; Water Environment Federation: Alexandria, VA, USA, 2012.
  30. Singleton, V.L.; Rossi, J.A., Jr. Colorimetry of Total Phenolics with Phosphomolybdic-Phosphotungstic Acid Reagents. Am. J. Eonol. Viticult. 1965, 16, 144–158. [Google Scholar]
  31. Zhou, J.; Bruns, M.A.; Tiedje, J.M. DNA Recovery from Soils of Diverse Composition. Appl. Environ. Microbiol. 1996, 62, 316–322. [Google Scholar] [CrossRef] [Green Version]
  32. Eusébio, A.; Tacão, M.; Chaves, S.; Tenreiro, R.; Almeida-Vara, E. Molecular assessment of microbiota structure and Dynamics along mixed olive oil and winery wastewaters biotreatment. Biodegradation 2011, 22, 773–795. [Google Scholar] [CrossRef] [PubMed]
  33. Illumina 16S Metagenomic Sequencing Library Preparation. 2013. Available online: https://emea.support.illumina.com/downloads/16s_metagenomic_sequencing_library_preparation.html (accessed on 1 December 2019).
  34. Caporaso, J.G.; Kuczynski, J.; Stombaugh, J.; Bittinger, K.; Bushman, F.D.; Costello, E.K.; Fierer, N.; Peña, A.G.; Goodrich, J.K.; Gordon, J.I.; et al. QIIME allows analysis of high-throughput community sequencing data. Nat. Methods 2010, 7, 335–336. [Google Scholar] [CrossRef] [PubMed] [Green Version]
  35. Callahan, B.J.; McMurdie, P.J.; Rosen, M.J.; Han, A.W.; Johnson, A.J.A.; Holmes, S.P. DADA2: High resolution sample interference from Illumina amplicon data. Nat. Methods 2016, 13, 581–583. [Google Scholar] [CrossRef] [Green Version]
  36. Katoh, K.; Standley, D.M. MAFFT Multiple Sequence Alignment Software Version7: Improvements in Performance and Usability. Mol. Biol. Evol. 2013, 30, 772–780. [Google Scholar] [CrossRef] [PubMed] [Green Version]
  37. Price, M.N.; Dehal, P.S.; Arkin, A.P. FastTree 2 Approximately Maximum-Likelihood Trees for Large Alignments. PLoS ONE 2010, 5, 1–10. [Google Scholar] [CrossRef]
  38. Pedregosa, F.; Varoquaux, G.; Gramfort, A.; Michel, V.; Thirion, B. Scikit-learn: Machine Learning in Python. J. Mach. Learn. Res. 2011, 12, 2825–2830. [Google Scholar]
  39. Glöckner, F.O.; Yilmaz, P.; Quast, C.; Gerken, J.; Beccati, A.; Ciuprina, A.; Bruns, G.; Yarza, P.; Peplies, J.; Westram, R.; et al. 25 years of serving the community with ribosomal RNA gene reference databases and tools. J. Biotechnol. 2017, 261, 169–176. [Google Scholar] [CrossRef]
  40. Parawira, W.; Kudita, I.; Nyandoroh, M.G.; Zvauya, R. A study of industrial anaerobic treatment of opaque beer brewery wastewater in a tropical climate using a full-scale UASB reactor seeded with activated sludge. Process Biochem. 2005, 40, 593–599. [Google Scholar] [CrossRef]
  41. Shao, X.; Peng, D.; Teng, Z.; Ju, X. Treatment of brewery wastewater using anaerobic sequencing batch reactor (ASBR). Bioresour. Technol. 2008, 99, 3182–3186. [Google Scholar] [CrossRef] [PubMed]
  42. Liu, G.J.; Zheng, D.; Deng, L.W.; Wen, Q.; Liu, Y. Comparison of constructed wetland and stabilization pond for the treatment of digested effluent of swine wastewater. Environ. Technol 2014, 35, 2660–2669. [Google Scholar] [CrossRef] [PubMed]
  43. Boursier, H.; Béline, F.; Paul, E. Piggery wastewater characterisation for biological nitrogen removal process design. Bioresour. Technol. 2005, 96, 351–358. [Google Scholar] [CrossRef] [PubMed]
  44. Lee, Y.-S.; Han, G.-B. Pig slurry treatment by a hybrid multi-stage unit system consisting of an ATAD and an EGSB followed by a SBR reactor. Biosyst. Eng. 2012, 111, 243–250. [Google Scholar] [CrossRef]
  45. Yu, H.; Gu, G. Biomethanation of brewery wastewater using an anaerobic upflow blanket filter. J. Clean. Prod. 1996, 4, 219–223. [Google Scholar] [CrossRef]
  46. Cronin, C.; Lo, K.V. Anaerobic treatment of brewery wastewater using UASB reactors seeded with activated sludge. Bioresour. Technol. 1998, 64, 33–38. [Google Scholar] [CrossRef]
  47. Fernandes, T.; Fernandes, V.; Keesman, K.J.; Zeeman, G.; van Lier, J.B. Effect of ammonia on the anaerobic hydrolysis of cellulose and tributyrin. Biomass Bioenergy 2012, 47, 316–323. [Google Scholar] [CrossRef]
  48. Kayhanian, M. Ammonia inhibition in high-solids biogasification: An overview and practical solutions. Environ. Technol. 1999, 20, 355–365. [Google Scholar] [CrossRef]
  49. Wang, M.; Zhang, X.; Zhou, J.; Yuan, Y.; Dai, Y.; Li, D.; Li, Z.; Liu, X.; Yan, Z. The dynamic changes and interactional networks of prokaryotic community between co-digestion and mono-digestions of corn stalk and pig manure. Bioresour. Technol. 2017, 225, 23–33. [Google Scholar] [CrossRef]
  50. Treu, L.; Tsapekos, P.; Peprah, M.; Campanaro, S.; Giacomini, A.; Corich, V.; Kougias, P.G.; Angelidaki, I. Microbial profiling during anaerobic digestion of cheese whey in reactors operated at different conditions. Bioresour. Technol. 2019, 275, 375–385. [Google Scholar] [CrossRef]
  51. Obaja, D.; Macee, S.; Costa, J.; Sans, C.; Mata-Alvarez, J. Nitrification, denitrification and biological phosphorus removal in piggery wastewater using a sequencing batch reactor. Bioresour. Technol. 2003, 87, 103–111. [Google Scholar] [CrossRef]
  52. Luo, Z.; Wang, D.; Yang, J.; Huang, H.; Su, G. Nitrogen removal from digested piggery wastewater using fermented superphosphate within the pretreatment stage and an MAP fertilizer pot test. J. Clean. Prod. 2019, 212, 372–380. [Google Scholar] [CrossRef]
  53. Kasinski, S. Mesophilic and Thermophilic Anaerobic Digestion of Organic Fraction Separated during Mechanical Heat Treatment of Municipal Waste. Appl. Sci. 2020, 10, 2412. [Google Scholar] [CrossRef] [Green Version]
  54. Shi, X.-S.; Dong, J.-J.; Yu, J.-H.; Yin, H.; Hu, S.-M.; Huang, S.-X.; Yuan, X.-Z. Effect of Hydraulic Retention Time on Anaerobic Digestion of Wheat Straw in the Semicontinuous Continuous Stirred-Tank Reactors. Biomed Res. Int. 2017, 2017, 2457805. [Google Scholar] [CrossRef]
  55. Lianhua, L.; Shuibin, H.; Yongming, S.; Xihui, K.; Junfeng, J.; Zhenhong, Y.; Dingfa, L. Anaerobic co-digestion of Pennisetum hybrid and pig manure: A comparative study of performance and microbial community at different mixture ratio and organic loading rate. Chemosphere 2020, 247, 125871. [Google Scholar] [CrossRef]
  56. Amaral, A.C.; Kunz, A.; Steinmetz, R.L.R.; Cantelli, F.; Scussiato, L.A.; Justi, K.C. Swine Effluent Treatment Using Anaerobic Digestion at Different Loading Rates. Eng. Agríc. 2014, 34, 567–576. [Google Scholar] [CrossRef] [Green Version]
  57. Lo, K.V.; Liao, P.H.; Gao, Y.C. Anaerobic treatment of swine wastewater using hybrid UASB reactors. Bioresour. Technol. 1994, 47, 153–157. [Google Scholar] [CrossRef]
  58. Demirer, G.N.; Chen, S. Anaerobic digestion of dairy manure in a hybrid reactor with biogas recirculation. World J. Microb. Biot. 2005, 21, 1509–1514. [Google Scholar] [CrossRef]
  59. Nelson, M.C.; Morrison, M.; Yu, Z. A meta-analysis of the microbial diversity observed in anaerobic digesters. Bioresour. Technol. 2011, 102, 3730–3739. [Google Scholar] [CrossRef] [PubMed]
  60. Krause, L.; Diaz, N.N.; Edwards, R.A.; Gartemann, K.-H.; Krömeke, H.; Neuweger, H.; Pühler, A.; Runte, K.J.; Schlüter, A.; Stoye, J.; et al. Taxonomic composition and gene content of a methane-producing microbial community isolated from a biogas reactor. J. Biotechnol. 2008, 136, 91–101. [Google Scholar] [CrossRef]
  61. Schlüter, A.; Bekel, T.; Diaz, N.N.; Dondrup, M.; Eichenlaub, R.; Gartemann, K.-H.; Krahn, I.; Krause, L.; Krömeke, H.; Kruse, O.; et al. The metagenome of a biogas-producing microbial community of a production-scale biogas plant fermenter analysed by the 454-pyrosequencing technology. J. Biotechnol. 2008, 136, 77–90. [Google Scholar] [CrossRef] [PubMed]
  62. Theuerl, S.; Klang, J.; Heiermann, M.; de Vrieze, J. Marker microbiome clusters are determined by operational parameters and specific key taxa combinations in anaerobic digestion. Bioresour. Technol. 2018, 263, 128–135. [Google Scholar] [CrossRef] [PubMed]
  63. Gannoun, H.; Omri, I.; Chouari, R.; Eltaief, K.; Keskes, S.; Godon, J.J.; Hamdi, M.; Sghir, A.; Bouallagui, H. Microbial community structure associated with the high loading anaerobic codigestion of olive mill and abattoir wastewaters. Bioresour. Technol. 2016, 201, 337–346. [Google Scholar] [CrossRef] [PubMed]
  64. Buhlmann, C.H.; Mickan, B.S.; Jenkins, S.N.; Tait, S.; Kahandawala, T.K.A.; Bahri, P.A. Ammonia stress on a resilient mesophilic anaerobic inoculum: Methane production, microbial community, and putative metabolic pathways. Bioresour. Technol. 2019, 275, 70–77. [Google Scholar] [CrossRef] [PubMed]
  65. Hülsemann, B.; Zhou, L.; Merkle, W.; Hassa, J.; Müller, J.; Oechsner, H. Biomethane Potential Test: Influence of Inoculum and the Digestion System. Appl. Sci. 2020, 10, 2589. [Google Scholar] [CrossRef] [Green Version]
  66. Gao, R. Microbial diversity in a full-scale anaerobic reactor treating high concentration organic cassava wastewater. Afr. J. Biotechnol. 2012, 11, 6494–6500. [Google Scholar] [CrossRef]
  67. Guo, W.; Li, Y.; Zhao, K.; Xu, Q.; Jiang, H.; Zhou, H. Performance and Microbial Community Analysis of Anaerobic Digestion of Vinegar Residue with Adding of Acetylene Black or Hydrochar. Waste Biomass Valor. 2020, 11, 3315–3325. [Google Scholar] [CrossRef]
  68. Schauss, T.; Busse, H.-J.; Golke, J.; Kämpfer, P.; Glaeser, S.P. Moheibacter stercoris sp. nov., isolated from an input sample of a biogas plant. Int. J. Syst. Evol. Microbiol. 2016, 66, 2585–2591. [Google Scholar] [CrossRef]
  69. Zhang, R.-G.; Tan, X.; Zhao, X.-M.; Deng, J.; Lv, J. Moheibacter sediminis gen. nov., sp. nov., a member of the family Flavobacteriaceae isolated from sediment, and emended descriptions of Empedobacter brevis, Wautersiella falsenii and Weeksella virosa. Int. J. Syst. Evol. Microbiol. 2014, 64, 1481–1487. [Google Scholar] [CrossRef] [Green Version]
  70. Ariesyady, H.D.; Ito, T.; Okabe, S. Functional bacterial and archaeal community structures of major trophic groups in a full-scale anaerobic sludge digester. Water Res. 2007, 41, 1554–1568. [Google Scholar] [CrossRef]
  71. Goswami, R.; Chattopadhyay, P.; Shome, A.; Banerjee, S.N.; Chakraborty, A.K.; Mathew, A.K.; Chaudhury, S. An overview of physico-chemical mechanisms of biogas production by microbial communities: A step towards sustainable waste management. 3 Biotech 2016, 6, 72. [Google Scholar] [CrossRef] [Green Version]
  72. Cho, S.; Im, W.; Kim, D.; Kim, M.; Shin, H.; Oh, S. Dry anaerobic digestion of food waste under mesophilic conditions: Performance and methanogenic community analysis. Bioresour. Technol. 2013, 131, 210–217. [Google Scholar] [CrossRef] [PubMed]
  73. Wang, P.; Wang, H.; Qiu, Y.; Ren, L.; Jiang, B. Microbial characteristics in anaerobic digestion process of food waste for methane production—A review. Bioresour. Technol. 2018, 248, 29–36. [Google Scholar] [CrossRef]
  74. Hardegen, J.; Latorre-Pérez, A.; Vilanova, C.; Günther, T.; Porcar, M.; Luschnig, O.; Simeonov, C.; Abendroth, C. Methanogenic community shifts during the transition from sewage mono-digestion to co-digestion of grass biomass. Bioresour. Technol. 2018, 265, 275–281. [Google Scholar] [CrossRef] [PubMed]
  75. Lee, D.J.; Lee, S.Y.; Bae, J.S.; Kang, J.G.; Kim, K.H.; Rhee, S.S.; Seo, D.C. Effect of volatile fatty acid concentration on anaerobic degradation rate from field anaerobic digestion facilities treating food waste leachate in South Korea. J. Chem. 2015, 2015, 9. [Google Scholar] [CrossRef] [Green Version]
Figure 1. The experimental set scheme of the hybrid anaerobic reactor: (1) peristaltic pump for effluent feeding, (2) hybrid reactor, (3) liquid trap, (4) mechanical gas meter. Sampling ports: P3 (14 cm), P2 (37 cm), P1 (48 cm), Effluent exit (66 cm).
Applsci 11 04364 g001
Figure 2. Anaerobic digestion of BWW and PE mixture under fed-batch conditions in the hybrid anaerobic reactor: biogas production and methane composition. HRT = hydraulic retention time.
Applsci 11 04364 g002
Figure 3. Hybrid anaerobic reactor profile: (a) COD, TS, and VS; (b) total VFA and pH; (c) VFA composition. Sampling ports: P3 (14 cm), P2 (37 cm), P1 (48 cm). COD—Chemical oxygen demand; TS—total solids; VS—volatile solids; VFA—volatile fatty acids.
Applsci 11 04364 g003
Figure 4. Alpha rarefaction curves for the occurrence with which OTUs were detected at each sample from effluents and from hybrid anaerobic reactor. PE—piggery effluent; BWW—brewery wastewater; HRT—hydraulic retention time; OUT—operational taxonomic unit.
Applsci 11 04364 g004
Figure 5. Relative abundance and dynamics of bacterial communities, taxonomic classification of bacterial reads at phylum level in samples collected at different operating conditions and effluents. BWW—Brewery wastewater, PE—Piggery effluent, HRT—Hydraulic retention time, OUT—Operational taxonomical unit. Other phyla were not considered in this discussion due to their low presence (0.01–1.2%) in the community: Armatimonadetes; Atribacteria; BRC1; Candidatus Berkelbacteria; Chlamydiae; Chlorobi; Chloroflexi; Cyanobacteria; Deinococcus-Thermus; Fibrobacteres; Hydrogenedentes; Lentisphaerae; Microgenomates; Nitrospinae; Parcubacteria; Planctomycetes; SR1 (Absconditabacteria); Saccharibacteria; TM6 (Dependentiae); Verrucomicrobia; WS6; and unidentified bacteria.
Applsci 11 04364 g005
Figure 6. Relative abundance of bacterial communities at genera level in samples from anaerobic digestion phases (a) HRT 6.7 d and (b) HRT 3 d, in the hybrid anaerobic reactor. The abundance is presented in terms of a percentage of the total number of sequences in a sample.
Applsci 11 04364 g006aApplsci 11 04364 g006b
Figure 7. Relative abundance and dynamics of archaeal communities and taxonomic classification of archaeal reads at genus level in samples collected at two operating conditions and effluents. BWW—Brewery wastewater, PE—Piggery effluent, HRT—Hydraulic retention time, OUT—Operational taxonomical unit.
Applsci 11 04364 g007
Table 1. Anaerobic digestion of BWW + PE (60:40, v/v) in continuous conditions, in the hybrid anaerobic reactor.
Process Time (d)HRT (d)OLR (g COD/L·d)OLR (g VS/L·d)
0–196.74.502.22
20–373.010.04.96
BWW—Brewery wastewater; PE—Piggery effluent; HRT—hydraulic retention time; OLR—organic loading rate.
Table 2. Chemical composition of effluents.
ParametersUnitsBWWPE
This Work[2][40][41]This Work[42][43][44]
pH 5.13–124.53.2–3.97.3
COD(g/L)7 ± 02–68.2–2022.5–32.593 ± 50.82 ± 0.2326–5120–91
TS(g/L)4 ± 05.1–8.75.1–8.75 47 ± 1 28–5423–61
VS(g/L)1 ± 0 32 ± 1 16–51
TKN(mg/L)25 ± 025–800.02–0.03320–4505000 1500–6100
NH4+-N(g/L)0.01 ± 0 3 ± 00.51 ± 0.14 1.15–4.8
Total VFA(g/L HAc)3.131–2.5 5.64
Acetic acid(g/L)2.27 1.37
Propionic acid(g/L HAc)0.55 0.56
Isobutyric acid(g/L HAc)0.07 2.16
Butyric acid(g/L HAc)0.24 1.54
Total phenols(g/L caffeic acid)0.00 0.9 ± 0.0
BWW—Brewery wastewater; PE—Piggery effluent; COD—chemical oxygen demand; TS and VS—total and volatile solids; TKN—total Kjeldahl nitrogen; HAc—Acetic acid.
Table 3. Anaerobic digestion performance: brewery wastewater and piggery effluent mixture.
ParametersHRT 6.7 dHRT 3.0 d
COD (g/L)IN30 ± 130 ± 1
COD (%)R52 ± 212 ± 3
TS (g/L)IN23 ± 123 ± 1
TS (%)R8 ± 454 ± 2
VS (g/L)IN15 ± 115 ± 1
VS (%)R22 ± 568 ± 1
TP (g/L caffeic acid)IN0.4 ± 00.4 ± 0
TP (%)R38 ± 038 ± 1
pHIN7.07.0
pHOUT8.17.9
TKN (g/L)IN1.1 ± 0.01.1 ± 0.0
TKN (%)R−4 ± 0.021 ± 0.0
NH4+-N (g/L)IN0.8 ± 0.00.8 ± 0.0
NH4+-N (%)R−0.7 ± 0.06 ± 2.0
Total VFA (g/L Hac)IN4.244.24
Total VFA (%)R8795
Acetic acid (g/L)IN2.632.63
OUT0.240.15
Propionic acid (g/L HAc)IN1.081.08
OUT0.250.02
Isobutyric acid (g/L HAc)IN0.230.23
OUT0.030.01
Butyric acid (g/L HAc)IN0.290.29
OUT0.020.01
HRT—hydraulic retention time; COD—chemical oxygen demand; TS and VS—total and volatile solids; TP—total phenols; TKN—total Kjeldahl nitrogen; VFA—volatile fatty acids; HAc—in terms of acetic acid; IN—input; OUT—output; R—removal.
Table 4. Anaerobic digestion performance: gas yield.
HRTOLRBiogas YieldMethane YieldReferences
(d)(g COD/L·d)(g VS/L·d)(L biogas/g VSIN)(L CH4/g VSIN)(L CH4/g CODIN)
6.74.52.220.3060.2380.118This work
3.010.04.960.2450.1950.096
156.97.300.2930.191-[58]
-8.2 --0.301[13]
HRT—hydraulic retention time; OLR—organic loading rate; VS—volatile solids; COD—chemical oxygen demand; IN—input; R—removal.
Table 5. Sequencing summary and microbial community (bacteria and archaea) diversity index of samples.
SamplesNo. of SequencesOTUShannon–Wiener Index
BacteriaArchaea
BWW194,3233343.25-
PE193,74216233.522.95
HRT 6.7 d (IN)168,86815894.955.28
HRT 3.0 d (OUT)220,8948914.031.23
BWW—brewery wastewater; PE—piggery effluent; HRT—hydraulic retention time; OUT—operational taxonomic unit.
Table 6. Relative abundance of the Bacteria and Archaea domains.
SampleRelative Abundance (%)
BacteriaArchaeaUnassigned
BWW100.00.000.00
PE99.730.270.00
HRT 6.7 d (IN)99.260.710.03
HRT 3.0 d (OUT)99.810.190.00
Publisher’s Note: MDPI stays neutral with regard to jurisdictional claims in published maps and institutional affiliations.

