Article

Diurnal, Temporal and Spatial Variations of Main Air Pollutants Before and during Emergency Lockdown in the City of Novi Sad (Serbia)

by
Miloš Davidović
1,*,
Sonja Dmitrašinović
2,
Maja Jovanović
1,
Jelena Radonić
2 and
Milena Jovašević-Stojanović
1
1
VINČA Institute of Nuclear Sciences—National Institute of the Republic of Serbia, University of Belgrade, 11000 Belgrade, Serbia
2
Faculty of Technical Sciences, Department of Environmental Engineering and Occupational Safety and Health, University of Novi Sad, Trg Dositeja Obradovića 6, 21000 Novi Sad, Serbia
*
Author to whom correspondence should be addressed.
Appl. Sci. 2021, 11(3), 1212; https://doi.org/10.3390/app11031212
Submission received: 13 December 2020 / Revised: 14 January 2021 / Accepted: 18 January 2021 / Published: 28 January 2021
(This article belongs to the Special Issue Advances in Air Quality Monitoring and Assessment)

Abstract

:
Changes in air pollution in the region of the city of Novi Sad due to the COVID-19 induced state of emergency were evaluated while using data from permanently operating air quality monitoring stations belonging to the national, regional, and local networks, as well as ad hoc deployed low-cost particulate matter (PM) sensors. The low-cost sensors were collocated with reference gravimetric pumps. The starting idea for this research was to determine if and to what extent a massive change of anthropogenic activities introduced by lockdown could be observed in main air pollutants levels. An analysis of the data showed that fine and coarse particulate matter, as well as SO2 levels, did not change noticeably, compared to the pre-lockdown period. Isolated larger peaks in PM pollution were traced back to the Aralkum Desert episode. The reduced movement of vehicles and reduced industrial and construction activities during the lockdown in Novi Sad led to a reduction and a more uniform profile of the PM2.5 levels during the period between morning and afternoon air pollution peak, approximately during typical working hours. Daily profiles of NO2, NO, and NOX during the state of emergency proved lower levels during most hours of the day, due to restrictions on vehicular movement. CO during the state of the emergency mainly exhibited a lower level during night. Pollutants having transportation-dominated source profiles exhibited a decrease in level, while pollutants with domestic heating source profiles mostly exhibited a constant level. Considering local sources in Novi Sad, slight to moderate air quality improvement was observed after the lockdown as compared with days before. Furthermore, PM low-cost sensors’ usefulness in air quality assessment was confirmed, as they increase spatial resolution, but it is necessary to calibrate them at the deployment location.

1. Introduction

The appearance of the highly contagious coronavirus [1] (COVID-19) at the end of 2019 in Wuhan, China, and many deaths all over the globe, forced the world’s governments to adopt different levels of interventions and emergency measures, due to the virus’ easy human transmission [1,2]. The emergency measures included travel restrictions and lockdowns. During the implementation of these measures worldwide, many countries reported air pollution reduction, which could result from reduced transport and other anthropogenic activities in some countries [3]. Besides transport sector restrictions, the industrial and manufacturing sectors are heavily affected by the pandemic [4,5], and their reduced or stopped activities could also be reflected in decrease of air pollution.
The lockdown interventions led to a reduction in population-weighted PM2.5 of 14.5 µg/m3 across China (−29.7%) and 2.2 µg/m3 across Europe (−17.1%), with mean reduction in PM2.5 concentrations during the lockdown period of around 20% in Europe when comparing the lockdown period in 2020 to previous years [6,7]. A study led by French National Institute for Industrial Environment and Risks (INERIS) [8], which analyzed short-term influence of COVID lockdowns on PM10 and nitrogen dioxide (NO2), determined significant decreases in NO2 and nitrogen oxides throughout Europe. Regarding PM10 concentration, the situation is less uniform and European cities selected in the study [8] experienced a range of different outcomes depending on the city region. At Iberian Peninsula, reductions in PM10 were observed. In Western Europe, PM10 increase (or only a slight decrease) after lockdown was observed due to dominating effect of emission advections from anthropogenic sources (e.g., agricultural, industrial). At Scandinavian Peninsula, only a small decrease of PM10 levels was identified due to considerable effect of road dust due to use of studded tires, road dusting and salting, i.e., high road dust emissions, which caused enhancement of PM10 effectively masking the lockdown reduction effect. At Central and Eastern Europe mixed decrease/increase of the average PM10 concentrations was identified as the effect of lockdown emission reductions was disturbed by a large natural dust episode on 26–29 March. In addition to PM, the main gaseous air pollutants NO2, sulfur dioxide (SO2), carbon monoxide (CO), and ozone (O3) that are usually collected at monitoring sites were analyzed in different areas all over Europe [8]. From these preliminary studies and reports [7,8], it seems evident that nitrogen dioxide (NO2), nitrogen oxide (NO) and nitrogen oxides (NOX) noticeably decrease while O3 increases.
This study is devoted to short-term air quality changes in the city of Novi Sad, Serbia (Lat/Long: 45.26714°, 19.83355°), focused on the period immediately before and during the COVID-19 lockdown. In order to create data sets, online and off-line data from national [9], regional [10], and local monitoring networks [11] were combined with newly acquired data from an ongoing measurement campaigns utilizing PM low-cost sensors (LCS). The aim of this study was to investigate the impacts of lockdown and local meteorology on the level of selected main air pollutants [12]. The analysis was focused on the period of approximately three months, 1 February–30 April, six weeks before and six weeks during lockdown, with additional attention focused to period of about one week immediately before and during the COVID-19 lockdown, for which high-resolution LCS data were available. Selected air pollution data was supplemented (underpinned) with available local meteorological parameters in order to better understand and explain the interactions between pollution and meteorology. Depending on the temporal resolution of data provided by used monitoring tools, variations of main pollutants at the daily level were analyzed in cases when data with sufficient temporal resolution were available.

2. Materials and Methods

2.1. Study Area

Novi Sad represents an urban-industrial agglomeration and, it is the second largest city in Serbia. The city is situated at about 80 m above sea level and it experiences a regional climate from moderately continental to continental. The speed of all recorded winds is mostly between 2.2 and 3.1 m/s, and in terms of frequency, winds that prevail in Novi Sad are north, northeast, and northwest [13]. The main sources of outdoor air pollution in Serbia include the energy sector, the transport sector, waste dump sites, and industrial activities, while the specific sources of air pollution in Novi Sad include the petrochemical industry complex and increasing road traffic [14].

2.2. Air Pollution Monitoring at National, Regional and Local Networks at Novi Sad

The monitoring of outdoor ambient air quality is usually done via networks at the national and local levels. However, despite having a high quality of instrumentation, these kinds of networks are usually very sparse, may not monitor all of the needed parameters, and give little insight into personal exposure. In specific cases, when rapid deployment and increased temporal resolution may be of more interest, IoT (Internet of Things) enabled low-cost sensors may provide interesting complementary data.
In the city of Novi Sad, there are three main groups of monitoring stations: stations that belong to national networks, stations in the regional network, and stations in the local monitoring networks.
  • NN1, Novi Sad-Rumenačka (air quality variables that are monitored: SO2, NO2, CO, PM10, PM2.5, wind direction, wind speed) type of station: traffic (Lat/Long: 45.26263°, 19.81902°)
  • NN2, Novi Sad—Liman (air quality variables that are monitored: SO2, O3, NO2, CO) type of station: background (Lat/Long: 45.23864°, 19.83570°)
  • RN1, Novi Sad—Šangaj (air quality variables that are monitored: BTEX, H2S, SO2, t, RH, wind direction, wind speed), type of station: industrial, (Lat/Long: 45.27237°, 19.87333°)
  • LN1, Novi Sad—Intersection of Rumenačka and Bulevar Jaše Tomića, type of station: urban/traffic, (Lat/Long: 45.26348°, 19.81903°)
  • LN2, Kać—Kralj Petar 1, type of station: suburban/traffic, (Lat/Long: 45.29980°, 19.93926°)
  • LN3, Novi Sad- Sunčani kej 41, type of station: urban/background, (Lat/Long: 45.24000°, 19.85139°)
  • LN4, Sremska Kamenica, Kamenički park 1-14, type of station: suburban/background, (Lat/Long: 45.22931°, 19.84898°)

2.3. Ongoing Sampling Campaign with Low-Cost Sensors and Reference Pumps

An ongoing measuring campaign with low-cost sensors and reference gravimetric pumps in the city of Novi Sad started in February 2020 and was conducted during mid-February and March. Our monitoring campaign utilizing low-cost sensors was already underway in Novi Sad when Emergency State Measures were introduced on 16 March. The more, or less severe lockdown was used as a unique opportunity to conduct this additional experiment, in which results about the possible relation between massive change of general population daily habits and change in traffic and industrial emissions could be obtained. At selected sampling sites, besides low-cost sensors that measured PM2.5 with a temporal resolution of several seconds, PM2.5 was collected on Quartz fiber filters by reference gravimetric pumps set to sample air for 48 h. A note about sampling duration is in place here. Timing and duration of the sampling can be adapted for specific purpose in order to use the available resources most effectively. For example, within the ESCAPE project sampling schedule (for purposes of Europe-wide LUR modeling) was two-week sampling, with timers which were set to sample for 15 min every 2 h so that effectively a 42-h sample was collected over 14 days [15]. This compromise must encompass frequency of accessing device in the field conditions on one hand and quality and quantity of samples necessary for calibration of low-cost sensor on the other hand. In this way “best of both worlds” are obtained: the low-cost sensors provide high temporal resolution, while use of reference gravimetric pumps minimizes the errors. Our sampling schedule produces approximately 8 samples over period of 16 days. Additional details are given in Appendix A. Particulate matter low-cost sensor suite (LCS), ekoNET was made by Dunavnet [16]. LCS platform was equipped with a PMS7003 particulate matter sensor. Plantower PMS7003 has counting efficiency of 50% at 0.3 μm and 98% at 0.5 μm, and maximum consistency error ±10% at 100~500 μg/m3 and ±10 μg/m3 at 0~100 μg/m3 range [17,18]. Reference gravimetric pump that was collocated with each LCS was Leckel Model LVS3 [19], with standard PM2.5 inlet and 2.3 lpm flowrate.
In the period before the Emergency State Measures, the sampling campaign was performed at 4 measuring sites (MS), namely: MS1 (Hajduk Veljkova 4), MS2 (Rumenački put 20), MS3 (Reljkovićeva 2), MS5 (Račkog 78). All four localities can be characterized as traffic sites since they are situated in the vicinity of traffic intersections and streets with a high or medium volume of traffic (Figure 1). After lockdown, the campaign was continued during the following 8–10 days at 3 sites (MS1, MS2, MS3) and repeated at MS5 where sampling was performed previously during February. The instruments were situated within 1m of each other, and no additional inlets were used in order to minimize particle losses. At measuring sites, the instrumentation was at about 2–3 m above the ground. The sampling campaign was carried out at all 4 measuring sites continuously, 7 days before the state of emergency (abbreviation BEMS in further text) and 8 days during the state of emergency (abbreviation EMS in further text) that was declared due to COVID-19 in Serbia.
Measuring site 1 (MS1, Lat/Long: 45.24968°, 19.82467°) was located in a narrow city center, at a distance of 50 m from the intersection of Futoški put, Hajduk Veljkova, and Cara Dušana Street. Possible sources of PM2.5 in addition to traffic may include residential heating, small boilers and stoves for individual households in the surrounding area. Types of vehicles passing through the intersection are light vehicles and public transportation (buses). A small heating plant is placed within close proximity (about 1 km). Measuring site 2 (MS2, Lat/Long: 45.27573°, 19.80066°) was located in the Industrial Zone South, at the very border of the residential area in the Rumenačka 20 street. Measuring instruments were located at the height of about 2.5 m next to a very busy roundabout within the courtyard of the Veterinary Institute in Novi Sad. The distance between the roundabout and measuring site was about 30 m. The traffic at MS2 consists mainly of light and heavy trucks and buses since the roundabout represents the main way that leads to the highway in that city area. The rest of the Industrial zone consists of a couple of industrial plants whose production capacities are very low, so the main source of suspended particles at this location is traffic. The third measuring site, (MS3, Lat/Long: 45.2494°, 19.87729°), was situated in Petrovaradin, associated municipality of Novi Sad. Instruments were placed at the height of 3 m, near the intersection of Reljkovićeva and Preradovićeva Street, which is one of the busiest intersections in Petrovaradin municipality. The distance between the measuring site and Reljkovićeva Street was 5 m, and the distance to the intersection was 60 m. Reljkovićeva Street is the main street with heavy traffic that passes through Petrovaradin from Novi Sad. Traffic mainly consists of trucks and cars and, to a lesser extent, of bus traffic. Sources of PM2.5 at the measuring site beside traffic are residential heating. The fourth site (MS5, Lat/Long: 45.23406°, 19.88453°), was also situated in Petrovaradin, as was MS3. Račkog Street serves as a transportation hub and is in the vicinity of the intersections of regional roads. It is the busiest street in Petrovaradin, with high intensity of both heavy vehicle and light vehicle traffic. The majority of heavy transportation from Reljkovićeva Street passes through this street. The measuring devices were set at the height of 3 m, at a distance of 12 m from the street. At this site, particulate matter can be emitted mainly by traffic and by residential heating boilers. Considering MS positions, possible sources of PM2.5 in the ambient air at all four localities include traffic, along with households and facilities in the vicinity that are using natural gas and other fossil fuels as a heating source.

3. Results and Discussion

As an initial analysis step, we have plotted particulate matter concentration at available stations that belong to local and national monitoring networks before and after entering the state of emergency (Figure 2) in the period from 1 February to 30 April. Local and regional monitoring stations publicly report daily average concentrations, while data collected at national monitoring station are available with 1 h resolution. A large peak in both PM2.5 (Figure 2b) and PM10 (Figure 2a) concentration is clearly visible on 26, 27 and 28 March, and is similar in magnitude for all monitoring stations. For these several days, the daily average levels of PM10 and PM2.5 were up to 250 and 100 μg/m3, respectively. Extremely high concentrations of particulate matter were recorded at automatic monitoring stations in the whole of Serbia and surrounding countries. The level of PM10 at the higher temporal resolution (e.g., 1 min) in some cities in Serbia, including Novi Sad, reached up to 600 μg/m3. No similar peaks exist for PM10 for other days, while for PM2.5 similar magnitude peaks do exist, albeit only locally (i.e., for only one of the observed monitoring stations). This kind of pattern indicates some isolated regional event that happened in the period on 26–28 March. Figure A2 shows the back trajectory that was calculated using Hybrid Single-Particle Lagrangian Integrated Trajectory (HYSPLIT) transport and dispersion model. The air mass back trajectory was calculated at 270 m above the ground, on 27 March, when the maximal concentration of PM10 was measured at Novi Sad’s national and local network sites. Based on the back-trajectory analysis, the presence of a possible source of non-local air pollution is evident. This source of dust can be associated via back trajectory tracing to the Aralkum Desert that is located at the Kazakhstan and Uzbekistan border. Back trajectory for surrounding days is also given in Appendix B.
Table 1 and Table 2 show descriptive statistics for fine and coarse particulate matter data collected at stations that belong to the national and local monitoring network in the area of Novi Sad for the period from 1 February to 30 April, split into periods before and after lockdown measures introduced due to COVID-19 pandemic. Tables also include descriptive statistic when 3-day Aralkum Desert episode is excluded from data. Looking into data from EMS and EMS* columns in Table 1 and Table 2, it becomes evident that natural distant sources may be very dominant in total particulate matter pollution and thus effectively mask local changes originating from emergency state, strongly swaying mean and maximum values of PM pollution. When comparing BEMS (before emergency state) and EMS* (during emergency state) columns in Table 1, it can be seen that the median slightly increased for LN1 and NN1 (both stations are urban traffic), strongly increased for LN3 (urban background), and decreased for LN2 and LN4 (LN2 and LN4 are suburban traffic and suburban background stations respectively). When comparing BEMS and EMS* columns in Table 2, it can be seen that the median decreased for LN2, LN4 and NN1 (suburban traffic, suburban background and urban traffic) and, again, strongly increased for LN3 (urban background). While it is expected that traffic sites experienced decrease in PM2.5 pollution, a strong increase in both PM10 and PM2.5 for LN3 is somewhat surprising and may indicate presence of source which emits both fine and coarse particles that was active during EMS. However, LN3 had lowest concentration of all stations in BEMS period. The often-nonlinear relationships between changes in emissions and changes in concentrations may also explain why lower air pollution may not occur at all locations.
In the subsequent section, diurnal variation will be able to reveal more details about changes and differences in air pollution levels since we will use additional data obtained from high-resolution low-cost sensors.
Weather conditions can also noticeably contribute to the changes that are seen in pollutant concentrations, and in some cases changes in meteorology can lead to increased air pollution. At the time of this study, meteorological data with 1 h temporal resolution originating from national network station NN1 were available. Meteorological conditions in the interaction with the landscape’s physical features are key factors that influence the rate of change, movement, and dispersal of gaseous and particulate matter pollution in the air. Sampling campaign in both BEMS and EMS period was conducted during the heating season (lasting from 15 October until 15 April) in the Republic of Serbia. It is well known that particulate matter concentration may correlate with temperature and relative humidity, and that often it strongly negatively correlates with wind speed [20]. This means that wind speed and temperature are two key factors affecting PM2.5 and PM10 concentration distributions emitted from local sources. These two factors will be discussed next.
Before and during the emergency state lowest PM2.5 concentrations were observed when the wind was coming from the southeast direction and to a lesser extent north-east direction (Figure 3 upper row), while most of the highest PM2.5 concentrations were observed for low wind speeds within the 1.5 m/s, (Figure 3 upper and middle row).
Having in mind the position and type (traffic) of Rumenačka monitoring station, this indicates the presence of strong local sources of air pollution, mainly related to traffic and residential heating, whose influence is minimized mainly by favorable meteorological conditions. These conditions may come in form of stronger winds, for example over 5 m/s, as can be seen from low PM2.5 concentrations in Figure 3b,c middle row. This is also confirmed by lower row in Figure 3, depicting PM2.5~PM10 robust slope. Different types of sources have different size distribution signature, for example combustion sources emit a large proportion of PM2.5, while on the other hand material used during construction, geological matter, polen and similar have larger coarse fraction. As can be seen from Figure 3b,c, within wind speeds smaller than 1 m/s there is an indication of strong local combustion processes, indicated by high PM2.5~PM10 ratio. Stronger wind noticeably change local air pollution composition and reduce PM2.5 concentration, thus making PM2.5~PM10 ratio very small.
Figure 4 shows the mean values and 95% confidence interval for the normalized pressure, temperature and PM2.5 measured at station Rumenačka, before and during emergency state. All of the air quality variables are min-max normalized taking into account the whole period 1 March to 15 April. Min-max values for the pressure, temperature and PM2.5 concentrations are 989.0–1024.0 mbar, −2.06–28.4 °C, and 0.0–91.97 μg/m3, respectively.
The period during the emergency state had a lower mean temperature in 0–6 h period of the day, as evident from the plots. This is also accompanied by increased PM2.5 concentrations in the 0–6 h period of the day and higher pressure throughout the day compared to the period before the emergency state. In the city of Novi Sad, residential heating is realized either as individual boilers or via district heating facilities, which are a substantial contributor to PM concentrations. Residential heating had to be used more since citizens have been instructed to stay at home as much as possible [21]. This is evident in Figure 4b, where lower temperatures correspond to higher PM2.5 pollution. On the other hand, as evident from Figure 4c, higher temperatures, at least in part, can be associated with reduction in PM2.5 pollution.

3.1. Descriptive Statistic of PM2.5 Levels before and at the Beginning of Emergency Measure State Measured with Low-Cost Sensors

In the current and following section, we will try to gain a bit more insight into periods before and during COVID lockdown by utilizing higher temporal resolution of low-cost sensors. Table 3 shows descriptive statistics for data collected via low-cost sensors at 4 different locations in Novi Sad. For each measuring spot, two columns are given, first referring to the period before the emergency state, and second referring to the period after the emergency state. These periods are identical for measuring sites MS1, MS2 and MS3, going from 8 to 15 March 2020 for the BEMS period, and from 16 to 24 March 2020 for the EMS period. From MS5 site, BEMS period data was collected somewhat earlier from 6 to 23 February 2020, while the EMS period mostly coincides with the EMS period for the remaining sites, 18 to 26 March 2020.
The median of PM2.5 concentration was similar in the BEMS and EMS period for all sites, a slight decrease in the median was observed only for MS3. Maximum values of PM2.5 (98th percentile) increased for MS2 and MS3 sites, remained the same for MS1, and decreased for MS5 site. Another interesting aspect is the standard deviation of the pollution, which may signal change in pollution sources and their distribution: it remained the same at MS1 and MS3 sites but showed a noticeable decrease at MS5 site. More insight into PM2.5 pollution and change that occurred during EMS at these sites is possible via time series and 24 h boxplots shown in further text.

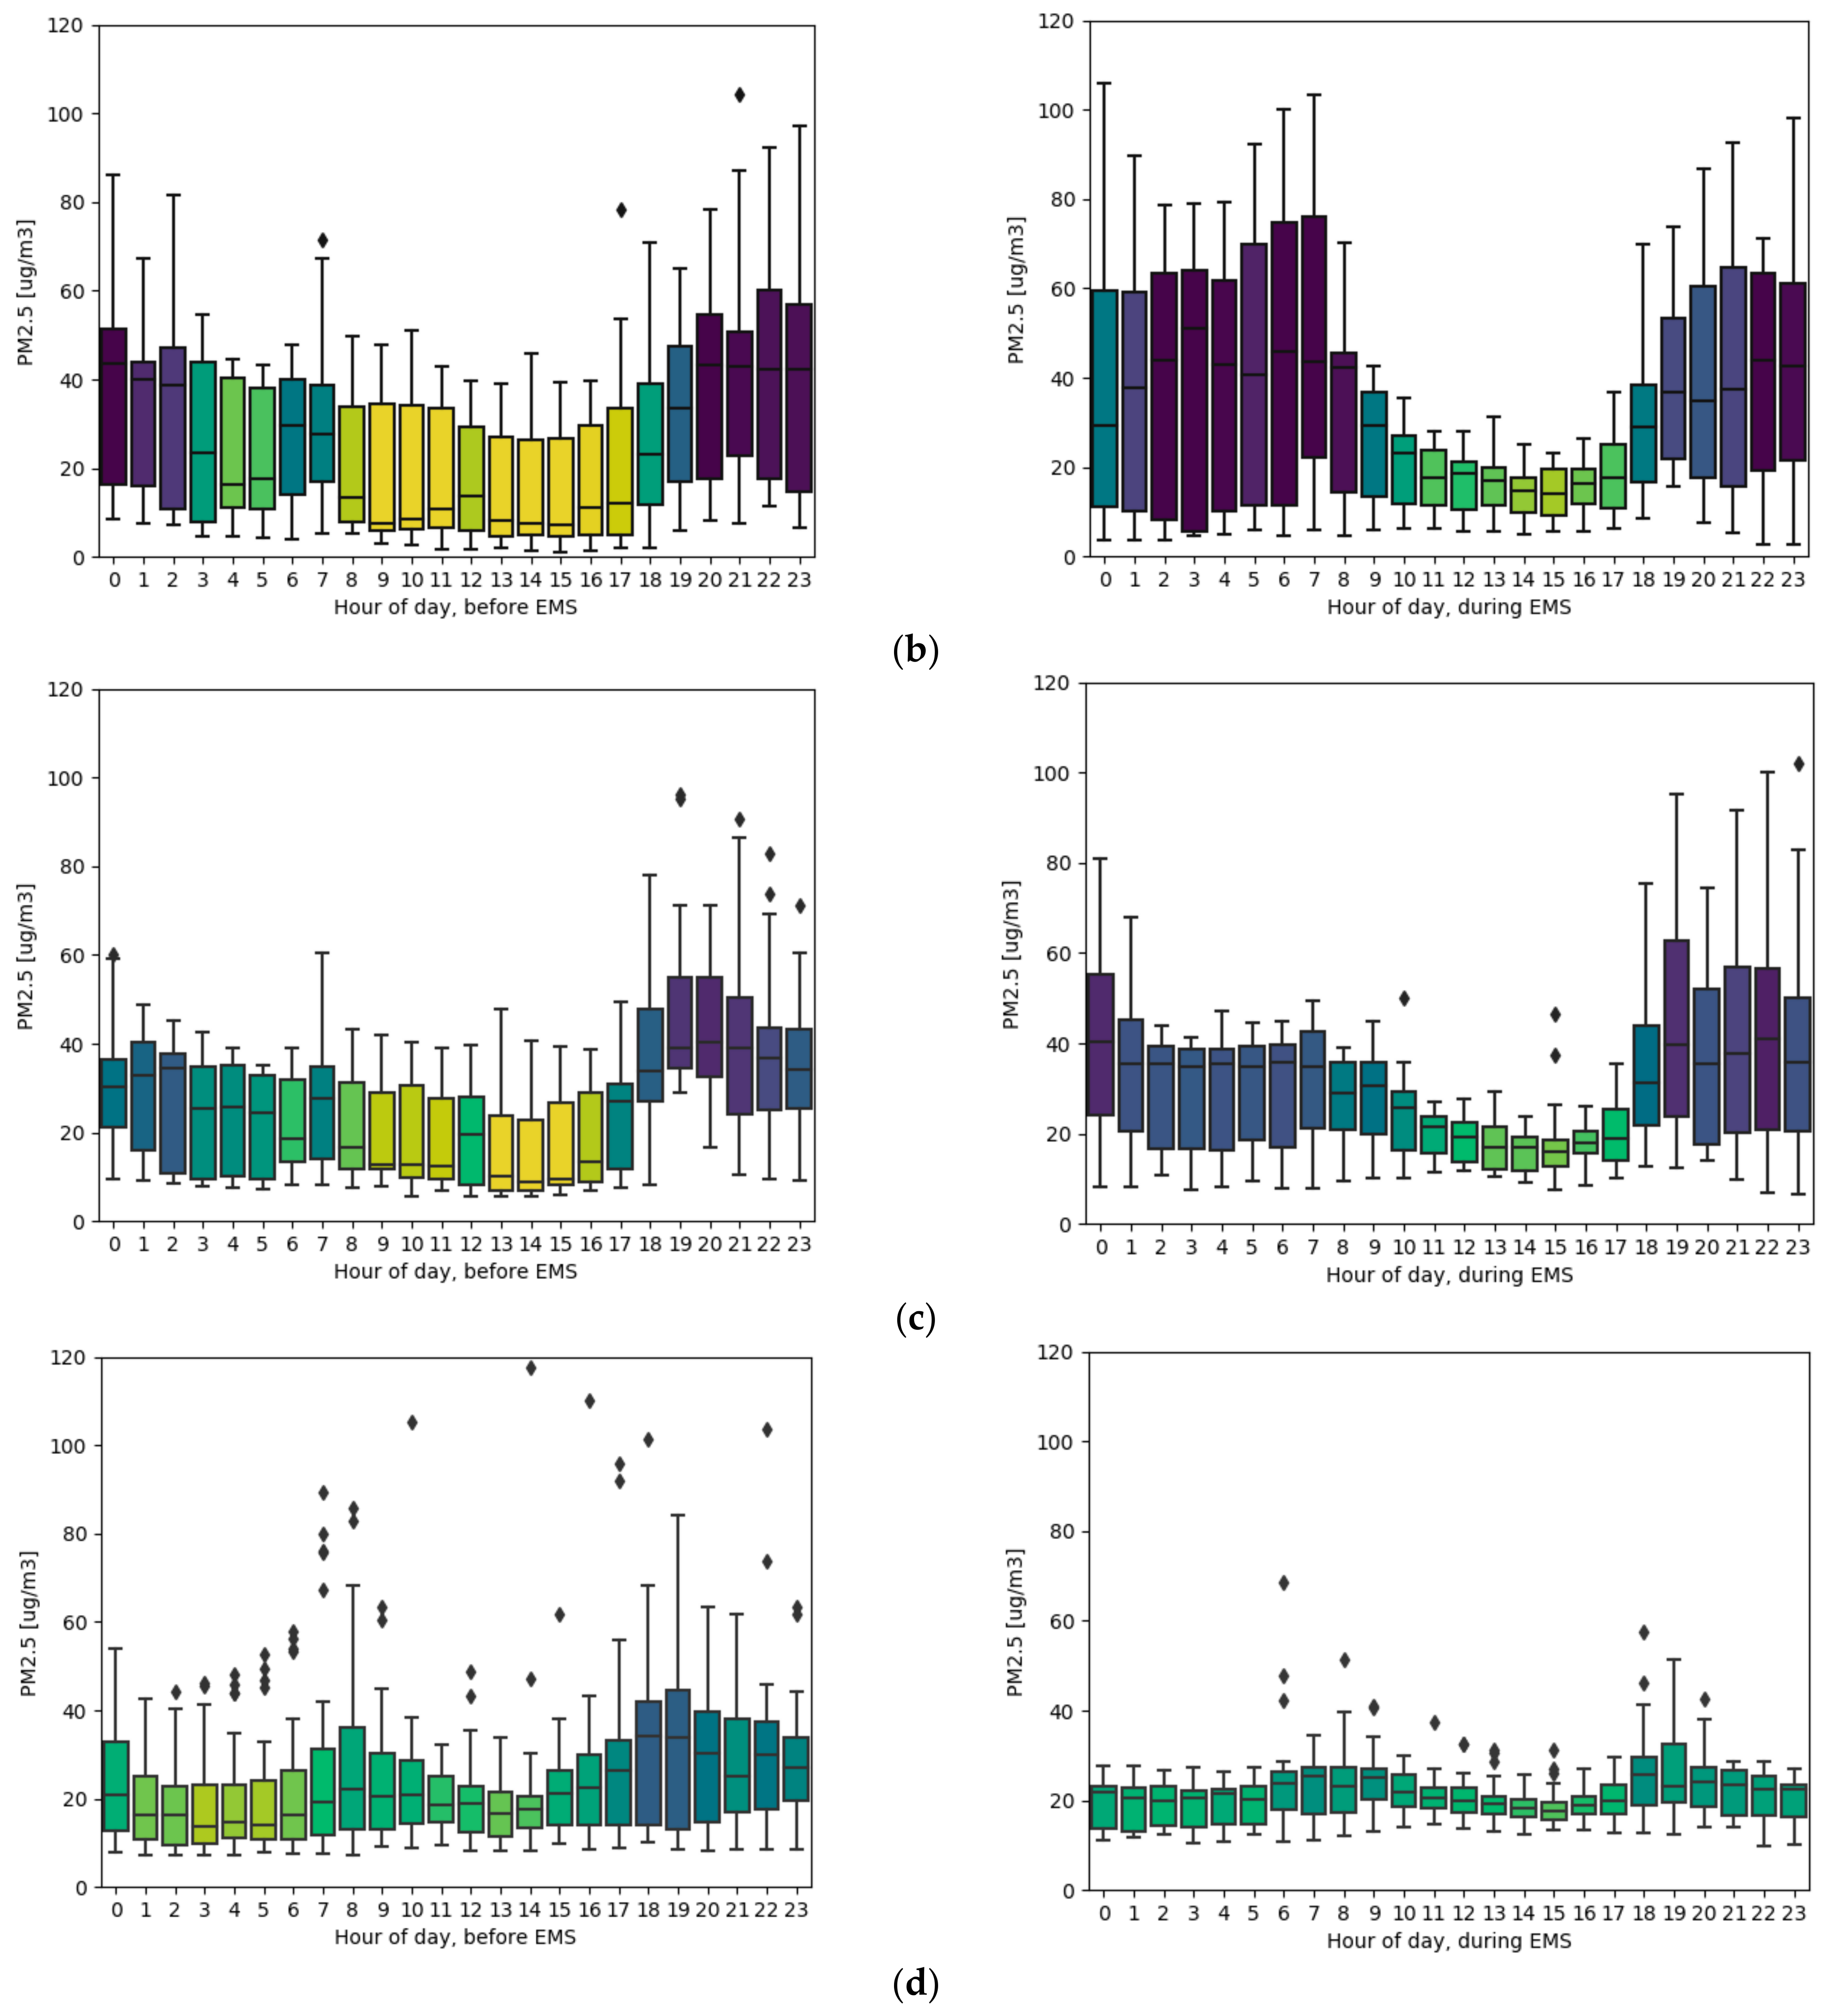
3.2. Changes in Diurnal Variation of PM2.5 at Sampling Site MS1, MS2, MS3 and MS5 before and after Measures of the State Emergency

The reduced movement of vehicles as well as reduced industrial activities during lockdown in Novi Sad, leading to the reduction of the exhaust emissions, were a probable cause for a reduction (as seen from reduced interquartile range of hourly boxplots in Figure 5) and a more uniform profile of the PM2.5 levels approximately during typical working hours (8 AM–5 PM).
According to recently published studies, similar findings were identified in several cities in various parts of the world [22]. In the first month of lockdown, period 15 March–15 April 2020, the official heating session was still ongoing. For the most part, mean daily temperatures in the week before and in the first weeks of lockdown, during which the sampling campaign was conducted, were below 10 °C. Residential heating sources caused higher concentration in the morning and during the night at almost all sampling sites and can be clearly recognized from the boxplot representing 1 h variations in the week before the EMS and period at the EMS beginning (Figure 5).

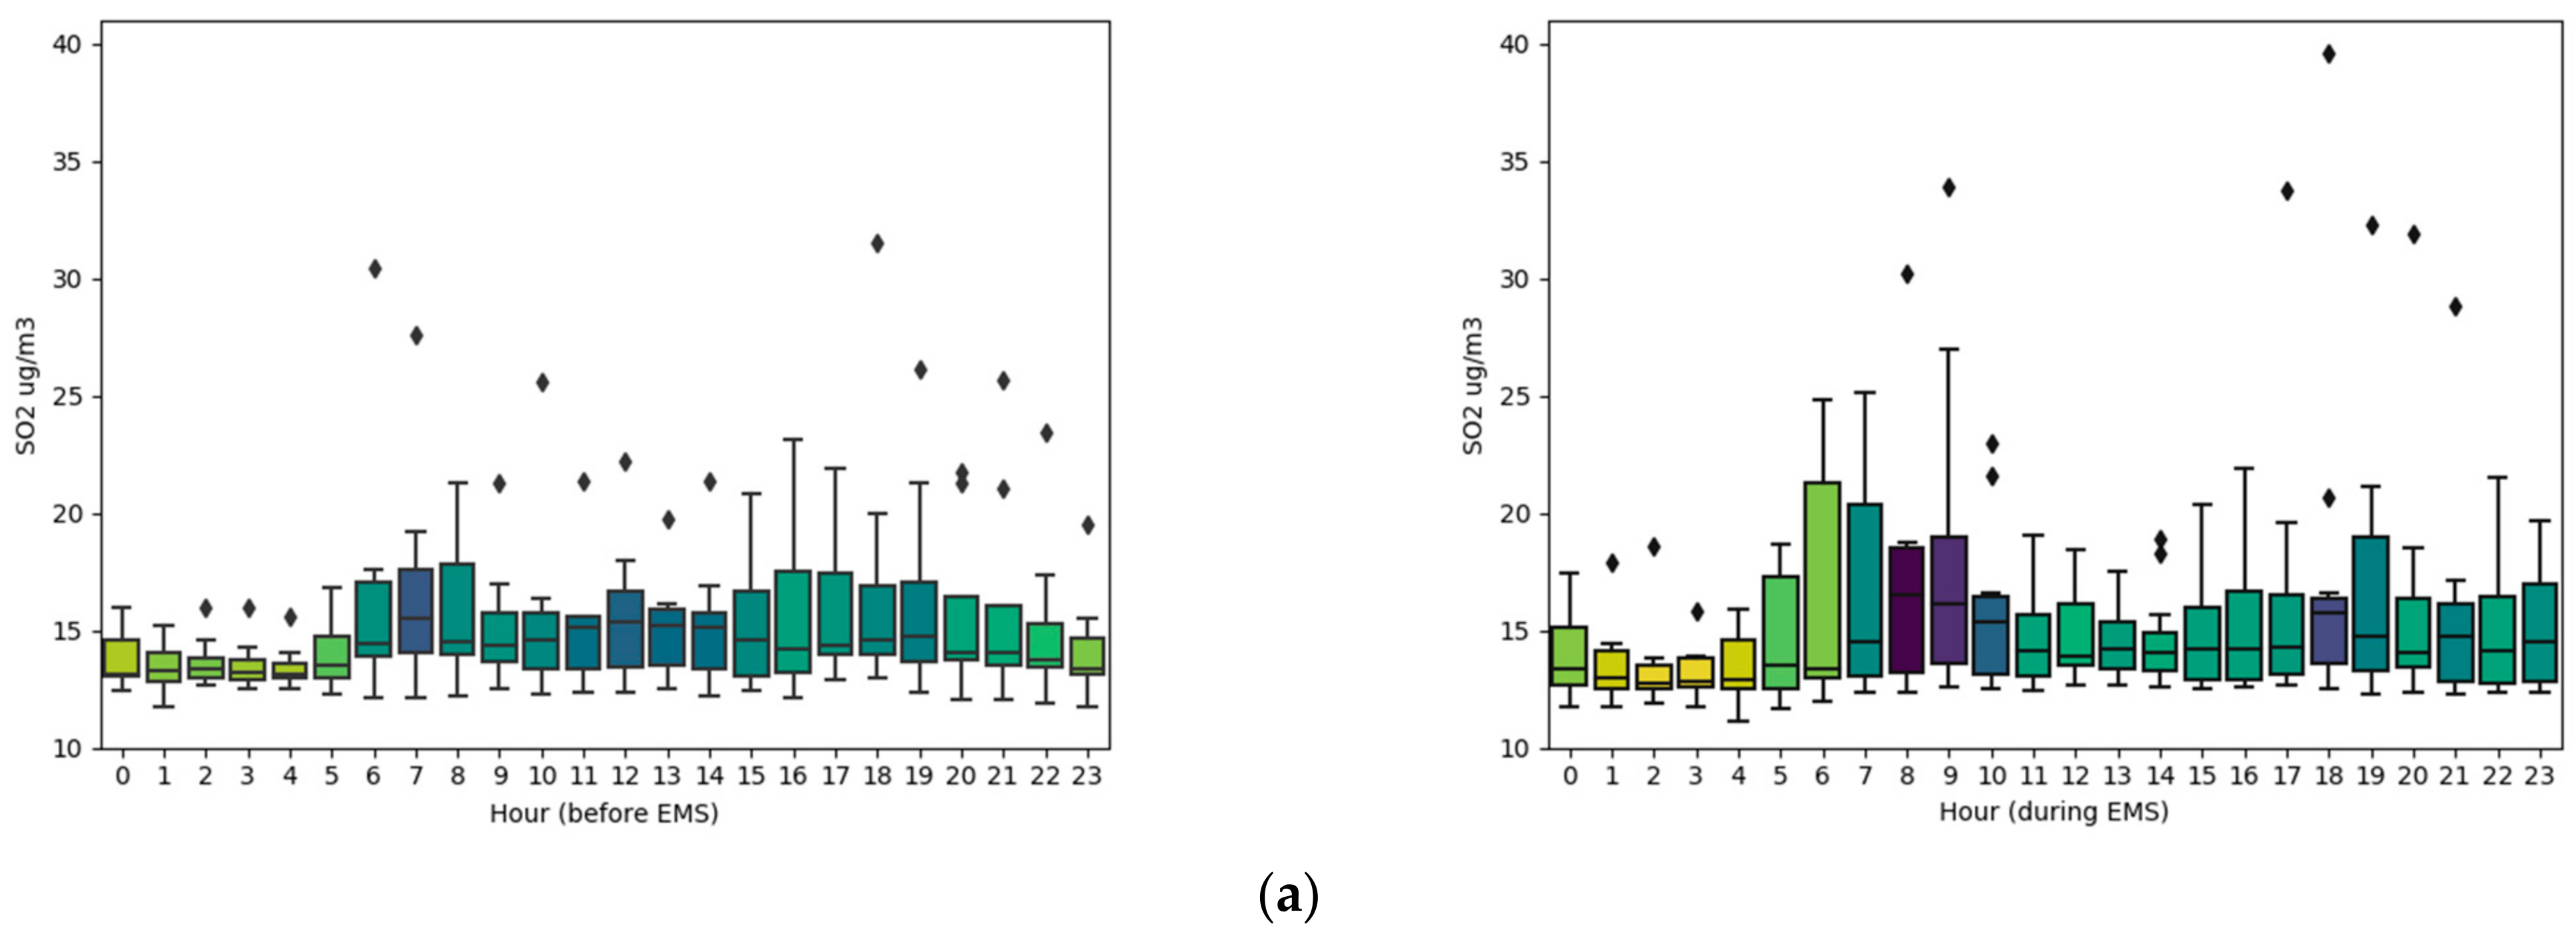
3.3. Changes in Diurnal Variation of Gaseous Pollutants and PM2.5 at NN1 before and after Measures of the State Emergency

For the identification of changes of main air pollutants levels, it was necessary to create diurnal variation whenever it was possible, i.e., data have been collected using monitors with high temporal resolution. Figure 6 depicts diurnal variations of measured main gaseous pollutants at site that belongs to the national monitoring network: Rumenačka SEPA, NN1 before and after measures of the state emergency. At NN1 the following was observed:
  • Daily profiles of SO2, the main pollutant, depicted in the form of a boxplot (Figure 6a), show that, on average, there was no noticeable change a week before and 10 days during the emergency state. For most hours of day, the SO2 concentration was below 20 μg/m3, with occasional “outliers” in the range from 35–40 μg/m3 in the morning and afternoon pollution peaks.
  • Daily profiles for NOx show a clear change in daily patterns (Figure 6b). Because boxplot color corresponds to the value of median, it is evident that the median of these main pollutants was reduced during the first 10 days of the emergency state during most hours of the day. NOx boxplots show clear morning and afternoon pollution peaks, both before and during the emergency state, but the median of these peaks is reduced during the emergency state. The median was around 80–95 μg/m3 before emergency state from 18–19 h, and an evident reduction to the median of about 15–25 μg/m3 is visible during the emergency state. Additionally, during the most active hours of the day (period from 9 h to 17 h), a noticeable drop in the level of air pollution was observed, indicated by lower median and smaller interquartile range (median around 50 μg/m3 before emergency state during this time of day, and about 25 μg/m3 during emergency state in this time of day).
  • Observing CO daily profiles following conclusions can be reached. During the active hours of the day, in the period from 9 h to 17 h, the level of air pollution stayed similar in, going around 0.8 mg/m3 with a relatively narrow interquartile range (Figure 6c). During morning hours, the situation is similar, with a slight increase during the emergency state, with median still being in the range from 0.8 to 1 mg/m3, but with larger interquartile ranges during the emergency state. On the other hand, from 18 h to 23 h, there is a slight reduction in the CO level during the emergency state. Since there are no noticeable changes in the daily profiles before and during the emergency state for CO levels, it can be argued that pollutants with domestic heating source profiles mostly exhibited constant levels.
  • An interesting increase in PM2.5 levels in the early morning and in the nighttime at different monitoring sites over the area of the city of Novi Sad, even during lockdown, has also been noticed (Figure 6d). However, during the most active hours of the day (period from 9 h to 17 h) a noticeable drop in the level of air pollution was evident, as indicated by a lower median and smaller interquartile range.
Equivalent analysis was also done for Liman SEPA NN2 station and is shown in Appendix D. Similar and comparable results were observed all over the EU in various studies focusing on COVID-19 influences [23,24]. Results for levels of NO2, PM10 and PM2.5 over the EU member countries have been presented by EEA [25]. Data show, as in the city of Novi Sad, that NO2, a pollutant mainly emitted by road transport, has decreased in many European cities where lockdown measures were applied. Changes in levels of PM2.5 may also be expected due to lockdown measures, however, a consistent reduction cannot yet be seen across European cities, as is the case in Novi Sad. This is likely due to the fact that the main sources of this pollutant are more varied, including, at the European level, the combustion of fuel for the heating of residential, commercial and institutional buildings, industrial activities and road traffic.

4. Conclusions

In this paper, we have presented a study targeting particulate matter pollution in the city of Novi Sad that was conducted during February–April of 2020. On 15 March 2020, when the COVID-19 lockdown started and emergency state measures were declared, a sampling campaign of collecting data with gravimetric pumps and IoT low-cost sensors has been already in progress. New circumstances were promptly integrated into the campaign’s planning, as they opened possibilities for examining the influence of broader societal changes on air pollution. Additional campaign efforts, which now also included examining COVID-19 lockdown influence, were carried out and data were collected both before and at the beginning of COVID-19 lockdown in Novi Sad.
Looking at descriptive aggregate statistical data, we have not identified a noticeable reduction in PM2.5 concentration levels at a daily level. The measuring campaign and data collection were finished at the last sampling site (MS5) on March 26th. No significant non-local sources were influential up until that point. On 27 and 28 March, when the concentrations of PM2.5 and PM10 were extremely high in the whole of Serbia and surrounding countries, Aralkum desert was pointed out as the external source of high increase in PM. This source of dust was confirmed via back trajectory tracing to Aralkum Desert. The trends and levels of fine and coarse particulate matter in Novi Sad and other cities in Serbia before and after lockdown were under multiple factors similar to those that were observed in cities in the region, e.g., Budapest and Sofia, as shown in [8].
In the city of Novi Sad, air pollution mainly comes from traffic and residential heating, where citizens of Novi Sad use a variety of fuels for heating of individual houses: gas, biomass, and fossil fuels. More detailed analysis showed that the morning peak and higher concentration during the night period remained present in the daily profiles, even after the COVID-19 lockdown and in that period, there were also no noticeable changes in the daily profile at all sampling sites. Morning peak and higher concentrations during the night and variability characteristics for that period stayed the same at all four low-cost sampling sites and part of the daily profile for that period was similar before and after emergency state measures were declared. For the period corresponding to working hours, between 8 AM and 5 PM, when people are the most active and traffic is usually the most frequent, the PM concentrations and their variability were lower during COVID-19 lockdown than during the week before COVID-19 lockdown. This can be attributed to the fact that majority of citizens stayed at home, leading to reduced traffic and associated emissions.
These analyses prove that lowering anthropogenic activities intensity contributes to changes in the diurnal pattern of fine particulate matter and some other main air pollutants. Natural events like long–range transport of air masses that may happen during lock–down, also strongly contribute to the increased air pollutants concentrations. These influences may sway the summary statistics and illustrates the need for higher temporal resolution monitoring. The perspective for further analyses is in additional analyses of chemical content of PM2.5 from collected filters.

Author Contributions

Conceptualization, M.D. and M.J.-S.; Data curation, M.D., S.D., M.J. and M.J.-S.; Funding acquisition, M.D. and M.J.-S.; Investigation, M.D., S.D., M.J. and M.J.-S.; Methodology, M.D. and M.J.-S.; Project administration, M.D. and M.J.-S.; Resources, M.J.-S.; Supervision, M.D., J.R. and M.J.-S.; Validation, M.D., M.J. and M.J.-S.; Visualization, M.D. and S.D.; Writing—Original draft, M.D., S.D. and M.J.-S.; Writing—Review & editing, M.D., S.D., M.J., J.R. and M.J.-S. All authors have read and agreed to the published version of the manuscript.

Funding

The research was funded by the Ministry of Education, Science and Technological Development of the Republic of Serbia and H2020 project VIDIS (GA 952433).

Institutional Review Board Statement

Not applicable.

Informed Consent Statement

Not applicable.

Data Availability Statement

Data is contained within the article. Additional data referenced but not presented in this study could be made available on request from the corresponding author.

Acknowledgments

We thank the United Nations Development Programme (UNDP) Serbia, for support of our research efforts, especially during COVID-19 pandemic.

Conflicts of Interest

The authors declare no conflict of interest.

Appendix A

Field Calibration of PM2.5 Low-Cost Device Performed via Collocation with Reference Pump

As our extensive descriptive data analysis has shown, low-cost PM2.5 devices are suitable for giving insights into air pollution trends, which can be confirmed via strong correlation between low-cost device readings and data obtained from the national network. However, despite this and despite the fact that the low-cost devices have gone through initial calibration, in order to avoid mismatch between calibration location and deployment location, low-cost sensors were additionally calibrated by collocating them with the reference gravimetric pumps at their deployment location. Data calibration is also essential to mitigate unfounded risk perception from low-cost sensors [26,27]. Calibration curves are shown in Figure A1, along with the Pearson’s correlation coefficient and calibration equations.
Figure A1. PM2.5 correlation: (a) MS1 site reference pump vs. low-cost device (b) MS2 site reference pump vs. low-cost device (c) MS3 site reference pump vs. low-cost device (d) MS5 site reference pump vs. low-cost device.
Applsci 11 01212 g0a1
Only the data points that were obtained from unscathed filters were used for calibration purposes. Despite the sensors having gone through initial calibration by the manufacturer, calibration coefficients obtained via collocation at the deployment location are modestly (figure panels (a), (b), (c), or significantly (d) different from 1.0). It can be thus concluded that the additional round calibration at the deployment location is a desirable and necessary step to obtain useful results from low-cost sensors. All results and data reported in this study, originating from low-cost sensors, are calibrated using deployment location calibration.

Appendix B

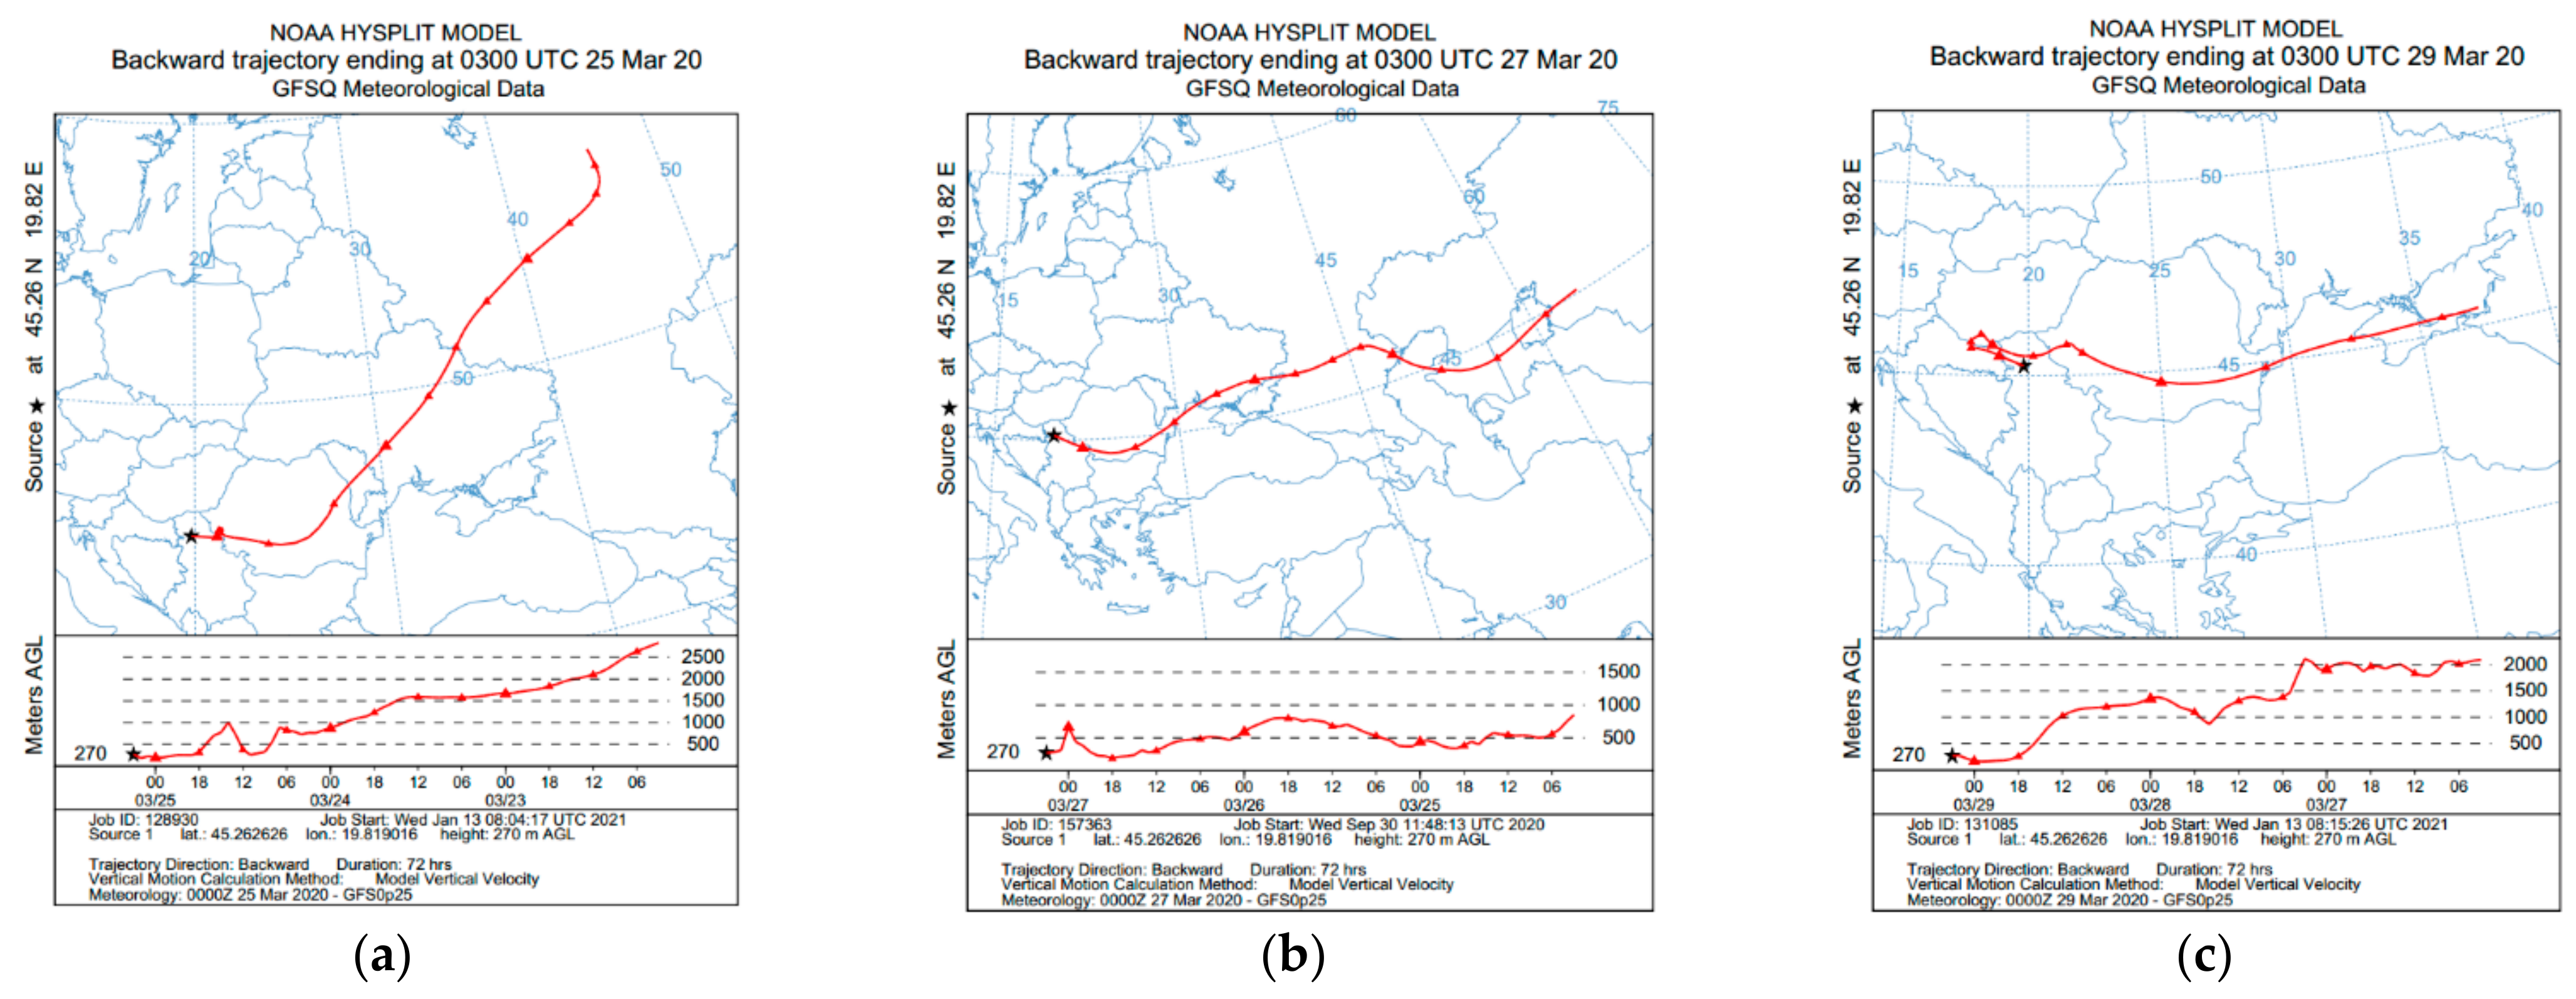
HYSPLIT Analysis of Sand Episode Originating from Aralkum Desert

During the episode [28], air mass trajectory came from the northeast, passed through Romania, Ukraine, Russia, Kazakhstan and Uzbekistan (Figure A2b). Finally, extremely high concentrations of PM10 were probably, in large part, due to the dust coming from the Aralkum Desert located at the Kazakhstan and Uzbekistan border.
Figure A2. The air mass back trajectory for the city of Novi Sad on (a) 25 of March (b) 27 of March (c) on 29 of March.
Applsci 11 01212 g0a2
In the period before and after PM pollution episodes, back trajectories showed less capability for long-range transport as evident from Figure A2a,c (note the differences in zoom level for same 72 h trajectory duration).

Appendix C

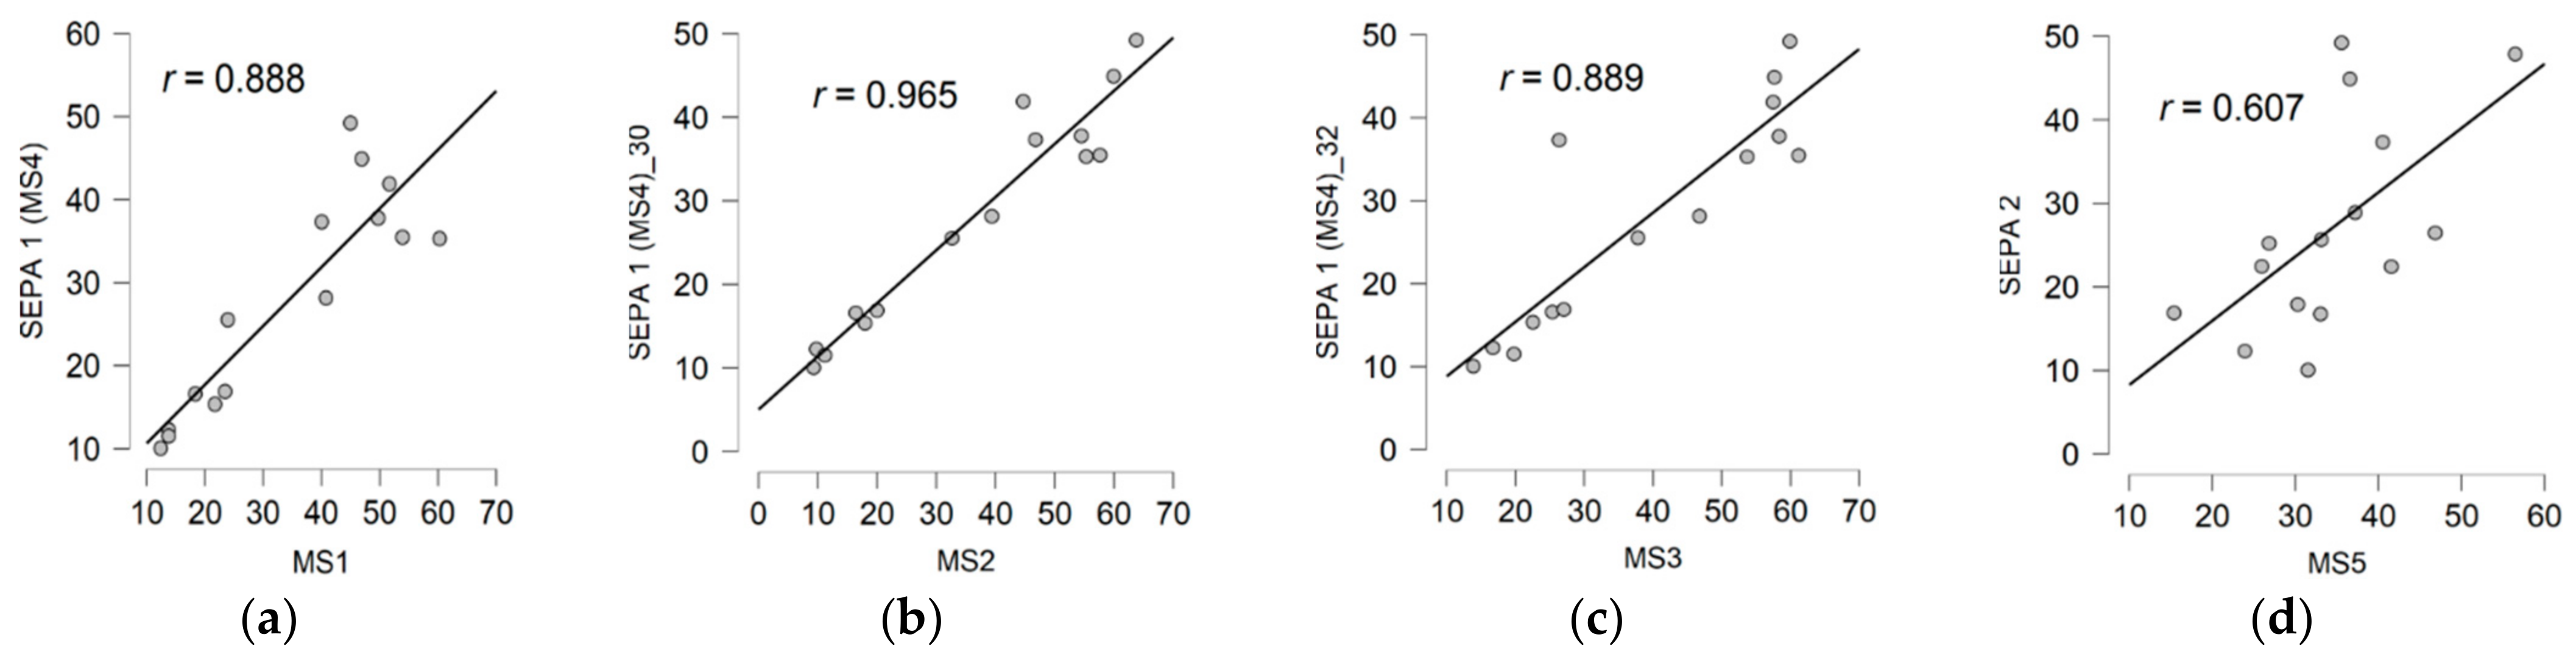
Correlation of PM2.5 Concentration in the City of Novi Sad between Spatially Distributed Measuring Sites

In order to better understand spatial variability of PM pollution in the city of Novi Sad, data for PM2.5 fine particulate matter at additional sampling sites, which was measured simultaneously using low-cost sensors and reference pumps set to 48 h averaging, were correlated with the NN1 SEPA station.
Pearson’s correlation coefficient between 48 h concentrations measured at the site that belongs to the national network of air quality monitoring NN1 collected with equivalent monitor GRIMM Aerosol EDM 180 [29] and concentrations measured using reference gravimetric pumps LVS3 Sven Leckel [19] at MS1, MS2, MS3 and MS5 site vary between 0.85 and 0.99 (Figure A3).
Figure A3. PM2.5 correlation: (a) MS1 site reference pump vs. SEPA equivalent instrument (b) MS2 site reference pump vs. SEPA equivalent instrument (c) MS3 site reference pump vs. SEPA equivalent instrument (d) MS5 site reference pump vs. SEPA equivalent instrument.
Applsci 11 01212 g0a3
The highest Pearson’s correlation coefficient was identified, not surprisingly, between sites situated along the same street, Rumenačka (Figure A3b), at the distance of about 2.7 km. High correlation despite the relatively large distance between the sites indicates that sources of pollution covary, most probably due to traffic consisting of mainly light and heavy trucks and buses, since the roundabout represents the main way that leads to the highway. Pearson’s correlation coefficient was also high for the other three sites, approximately 0.86 for the MS1 site and 0.85 for the other two sites located on the other side of the Danube river at Petrovaradin, a location where there are currently no monitoring sites from national, regional or local monitoring network.
Pearson’s correlation coefficient between 1 h concentrations measured at the site that belongs to the national network of air quality monitoring NN1 and concentrations measured using low-cost sensors at MS1, MS2, MS3 and MS5 shown in Figure A4 vary between 0.61 and 0.97. The highest Pearson’s correlation coefficient can be noticed between the sites at the same street, Rumenačka (Figure A4b), at a distance of about 2.7 km, r = 0.97. Pearson’s coefficient correlation of 0.89 is identified between NN1 measured with equivalent instrument GRIMM Aerosol EDM 180 and Dunavnet ekoNET device equipped with PMS7003 low-cost sensor located at MS1 (Figure A4a) and MS3 (Figure A4c).
Figure A4. PM2.5 correlation: (a) MS1 low-cost sensor vs. SEPA equivalent instrument (b) MS2 low-cost sensor vs. SEPA equivalent instrument (c) MS3 low-cost sensor vs. SEPA equivalent instrument (d) MS5 low-cost sensor vs. SEPA equivalent instrument (at different location).
Applsci 11 01212 g0a4
A Pearson’s correlation coefficient that is lowest is identified between the equivalent device at NN1 and low-cost device at MS5 (Figure A4d). The possible reason for the lower coefficient correlation between NN1 and MS5 is probably due to differences in particulate matter levels and probably due to divergent content as well as local meteorological conditions at two locations. This illustrates the need for higher spatial resolution of PM monitoring efforts and, to some extent, locations where there is a need to deploy additional sensors (locations with lower correlation to reference stations).

Appendix D

Changes in Diurnal Variation of Gaseous Pollutants at NN2 before and after Measures of the State Emergency

In Figure A5, diurnal variation of the main gaseous pollutants at Liman SEPA, NN2 automatic monitoring station, before and after the state emergency measures, are shown:
  • Daily profiles of SO2, the main pollutant, depicted in the form of a boxplot (Figure A5a), show that, on average, there is a slight change a week before and 10 days during the emergency state. In the week before, for most hours of day, SO2 concentration was approximately 5 μg/m3, while in the first 10 days of the emergency state, the median is a bit higher between 7 and 8 μg/m3 from midnight to morning hours and about 10 μg/m3 later on during the working hours and evening.
  • Daily profiles for O3, the main pollutant, follow diurnal cycle with maximal levels from 10 to 16 h with a median of about 70 μg/m3 in the week before and 80 μg/m3 in the first 10 days of the emergency state (Figure A5b). During morning and evening hours, median values are also 10 μg/m3 lower in the week before (about 50 μg/m3) than in the first 10 days of the emergency state (60 about μg/m3). Interquartile ranges are larger during the emergency state in periods of day with maximal levels of O3.
  • Daily profiles for NO, NO2 and NOx at Liman NN2 site, although lower in general, show a clear change in daily patterns similar to Rumenačka NN1 site. NOx boxplots (Figure A5c) show clear morning and afternoon pollution peaks, both before and during the emergency state, but the median of these peaks is reduced during the emergency state (median around 30–35 μg/m3 before emergency state from 18 to 19 h, and an evident reduction of the median of about 15 μg/m3 during the emergency state). In addition, during the most active hours of the day (period from 9 to 17 h), a significant drop in the level of air pollution can be observed, indicated by a lower median (median around 15–30 μg/m3 before the emergency state during this time of day, and about 10–15 μg/m3 during emergency state during this time of day).
  • Observing CO daily profiles at Liman (Figure A5d), NN2 site, the following conclusions can be reached. During the active hours of the day, from 9 h to 17 h level of CO stayed similar, going between 0.4 and 0.5 mg/m3, with a narrower interquartile range during the emergency state. During morning hours, the median level is similar, but with larger interquartile ranges before the emergency state. Similar as at the Rumenačka site, from 18 to 23 h, there is a slight reduction in CO level during the emergency state. Daily profiles before and during the emergency state for CO levels are connected with domestic heating sources that stay the same and traffic, leading to a slight reduction.
Figure A5. Liman SEPA, NN2, station, hourly boxplots before (left) and during emergency state (right) (a) SO2 (b) O3 (c) NOx (d) CO.
Applsci 11 01212 g0a5aApplsci 11 01212 g0a5b

References

  1. Shrestha, A.M.; Shrestha, U.B.; Sharma, R.; Bhattarai, S.; Tran, H.N.T.; Rupakheti, M. Lockdown Caused by COVID-19 Pandemic Reduces Air Pollution in Cities Worldwide. 2020. Available online: https://eartharxiv.org/repository/view/304/ (accessed on 28 January 2021). [CrossRef]
  2. Sharma, S.; Zhang, M.; Anshika; Gao, J.; Zhang, H.; Kota, S.H. Effect of restricted emissions during COVID-19 on air quality in India. Sci. Total Environ. 2020, 728, 138878. [Google Scholar] [CrossRef] [PubMed]
  3. Muhammad, S.; Long, X.; Salman, M. COVID-19 pandemic and environmental pollution: A blessing in disguise? Sci. Total Environ. 2020, 728, 138820. [Google Scholar] [CrossRef] [PubMed]
  4. Dutheil, F.; Baker, J.S.; Navel, V. COVID-19 as a factor influencing air pollution? Environ. Pollut. 2020, 263, 2019–2021. [Google Scholar] [CrossRef] [PubMed]
  5. Li, L.; Li, Q.; Huang, L.; Wang, Q.; Zhu, A.; Xu, J.; Liu, Z.; Li, H.; Shi, L.; Li, R. Air quality changes during the COVID-19 lockdown over the Yangtze River Delta Region: An insight into the impact of human activity pattern changes on air pollution variation. Sci. Total Environ. 2020, 139282. [Google Scholar] [CrossRef] [PubMed]
  6. Giani, P.; Castruccio, S.; Anav, A.; Howard, D.; Hu, W.; Crippa, P. Short-term and long-term health impacts of air pollution reductions from COVID-19 lockdowns in China and Europe: A modelling study. Lancet Planet. Health 2020, 4, e474–e482. [Google Scholar] [CrossRef]
  7. European Environment Agency. Air Quality in Europe—2020 Report; European Environment Agency: Copenhagen, Denmark, 2020.
  8. INERIS. COVID Impact on Air Quality in Europe: A Preliminary Regional Model Analysis. Available online: https://policy.atmosphere.copernicus.eu/reports/CAMS71_COVID_20200626_v1.3.pdf (accessed on 1 December 2020).
  9. Serbian Environmental Protection Agency. Combined Review of Automatic Air Quality Monitoring in the Republic of Serbia. Available online: http://www.amskv.sepa.gov.rs/ (accessed on 12 February 2020).
  10. Provincial Secretariat for Urban Planning and Environmental Protection. Available online: http://www.ekourbapv.vojvodina.gov.rs (accessed on 12 February 2020).
  11. Monitoring the Air Quality of the City of Novi Sad. Available online: https://environovisad.rs/vazduh (accessed on 5 December 2020).
  12. Cleaner Air for All. Available online: https://ec.europa.eu/environment/air/cleaner_air/ (accessed on 5 December 2020).
  13. Petrović, J. Environmental Aspects of Thermal Power Plants Utilization in Novi Sad—Air Pollution. Ph.D. Thesis, University Educons, Faculty of Environmental Protection, Sremska Kamenica, Serbia, April 2017. [Google Scholar]
  14. WHO Regional Office for Europe. Health Impact of Ambient Air Pollution in Serbia, A Call to Action. Available online: https://serbia.un.org/en/22141-health-impact-ambient-air-pollution-serbia-call-action (accessed on 5 December 2020).
  15. Eeftens, M.; Tsai, M.-Y.; Ampe, C.; Anwander, B.; Beelen, R.; Bellander, T.; Cesaroni, G.; Cirach, M.; Cyrys, J.; de Hoogh, K. Spatial variation of PM2.5, PM10, PM2.5 absorbance and PMcoarse concentrations between and within 20 European study areas and the relationship with NO2–results of the ESCAPE project. Atmos. Environ. 2012, 62, 303–317. [Google Scholar] [CrossRef] [Green Version]
  16. DunavNet. Environmental Monitoring. Available online: https://dunavnet.eu/solutions/environmental-monitoring/ (accessed on 5 December 2020).
  17. Plantower. Digital Universal Particle Concentration Sensor, PMS7003 Series Data Manual. Plantower: 2016. Available online: https://download.kamami.com/p564008-p564008-PMS7003%20series%20data%20manua_English_V2.5.pdf (accessed on 5 December 2020).
  18. Levy Zamora, M.; Xiong, F.; Gentner, D.; Kerkez, B.; Kohrman-Glaser, J.; Koehler, K. Field and laboratory evaluations of the low-cost plantower particulate matter sensor. Environ. Sci. Technol. 2018, 53, 838–849. [Google Scholar] [CrossRef] [PubMed]
  19. Sven Leckel. LVS3 Poduct Page. Available online: https://www.leckel.de/ (accessed on 1 December 2020).
  20. Wang, J.; Ogawa, S. Effects of meteorological conditions on PM2. 5 concentrations in Nagasaki, Japan. Int. J. Environ. Res. Public Health 2015, 12, 9089–9101. [Google Scholar] [CrossRef] [PubMed]
  21. Menut, L.; Bessagnet, B.; Siour, G.; Mailler, S.; Pennel, R.; Cholakian, A. Impact of lockdown measures to combat Covid-19 on air quality over western Europe. Sci. Total Environ. 2020, 741, 140426. [Google Scholar] [CrossRef] [PubMed]
  22. Singh, V.; Singh, S.; Biswal, A.; Kesarkar, A.P.; Mor, S.; Ravindra, K. Diurnal and temporal changes in air pollution during COVID-19 strict lockdown over different regions of India. Environ. Pollut. 2020, 266, 115368. [Google Scholar] [CrossRef] [PubMed]
  23. Donzelli, G.; Cioni, L.; Cancellieri, M.; Llopis Morales, A.; Morales Suárez-Varela, M.M. The Effect of the Covid-19 Lockdown on Air Quality in Three Italian Medium-Sized Cities. Atmosphere 2020, 11, 1118. [Google Scholar] [CrossRef]
  24. Fu, F.; Purvis-Roberts, K.L.; Williams, B. Impact of the COVID-19 Pandemic Lockdown on Air Pollution in 20 Major Cities around the World. Atmosphere 2020, 11, 1189. [Google Scholar] [CrossRef]
  25. European Environment Agency. Air Quality and COVID19. Available online: https://www.eea.europa.eu/themes/air/air-quality-and-covid19 (accessed on 1 December 2020).
  26. Lee, C.-H.; Wang, Y.-B.; Yu, H.-L. An efficient spatiotemporal data calibration approach for the low-cost PM2. 5 sensing network: A case study in Taiwan. Environ. Int. 2019, 130, 104838. [Google Scholar] [CrossRef] [PubMed]
  27. Trilles, S.; Vicente, A.B.; Juan, P.; Ramos, F.; Meseguer, S.; Serra, L. Reliability Validation of a Low-Cost Particulate Matter IoT Sensor in Indoor and Outdoor Environments Using a Reference Sampler. Sustainability 2019, 11, 7220. [Google Scholar] [CrossRef] [Green Version]
  28. EUMETSAT. Aralkum Desert Dust Pollutes Air in South-East European Countries on March 27th. Available online: https://www.eumetsat.int/aralkum-desert-dust-pollutes-air-south-east-europe (accessed on 5 December 2020).
  29. Grimm Aerosol. MODEL EDM180 Product Page. Available online: https://www.grimm-aerosol.com/products-en/environmental-dust-monitoring/approved-pm-monitor/edm180-the-proven/ (accessed on 1 December 2020).
Figure 1. Map with location of measuring sites (MS1, MS2, MS3, MS5) and monitoring stations at national (NN), regional (RN) and local level (LN).
Applsci 11 01212 g001
Figure 2. Daily concentrations at sites belonging to national and local monitoring networks before and after entering the state of emergency (dashed gray line) (a) PM10 (b) PM2.5.
Applsci 11 01212 g002
Figure 3. PM2.5 [μg/m3] counts by wind direction (upper row), PM2.5 [μg/m3] pollution rose (middle row) and PM2.5~PM10 robust slope (lower row) (a) before emergency state 1–15 March (b) during emergency state 16–31 March, Aralkum episode excluded (c) during emergency state 1–15 April.
Applsci 11 01212 g003
Figure 4. Normalized pressure, temperature and PM2.5 concentrations in different hours of the day (min-max normalization for the whole period) (a) before emergency state 1–15 March (b) during emergency state 16–31 March, Aralkum episode excluded (c) during emergency state 1–15 April.
Applsci 11 01212 g004
Figure 5. Daily profile of PM2.5 measured before measures of the state of emergency (left) and during measures of the state of emergency (right) at (a) MS1 (b) MS2 (c) MS3 (d) MS5.
Applsci 11 01212 g005aApplsci 11 01212 g005b
Figure 6. Rumenačka SEPA, NN1 station, hourly boxplots before (left) and during emergency state (right) (a) SO2 (b) NOx (c) CO (d) PM2.5.
Applsci 11 01212 g006aApplsci 11 01212 g006b
Table 1. Descriptive statistics for PM10 [μg/m3] data collected via the national and local network for air pollution monitoring in Novi Sad for the period of BEMS and EMS campaign in Novi Sad. EMS* denotes EMS data with Aralkum Desert episode excluded from data.
LN1LN2LN3LN4NN1
PeriodBEMSEMSEMS*BEMSEMSEMS*BEMSEMSEMS*BEMSEMSEMS*BEMSEMSEMS*
Mean30.9743.9732.5923.77/24.9717.7239.6928.8825.2129.4920.3836.8349.5841.89
St.dev.13.2443.5613.8410.31/22.307.6240.1712.4921.8537.64 9.8316.8939.9520.30
Median28.5033.0030.5021.10/17.0016.0531.0028.5020.4019.0017.0033.3536.5036.30
MIN14.0013.0013.008.70/5.007.306.006.0011.704.00 4.009.7013.2013.20
MAX62.00243.0066.0044.60/122.0040.90219.0051.00122.60209.0042.0085.10231.6088.50
Table 2. Descriptive statistics for PM2.5 [μg/m3] data collected via the national and local network for air pollution monitoring in Novi Sad for the period of BEMS and EMS campaign in Novi Sad. EMS* denotes EMS data with Aralkum Desert episode excluded from data.
LN2LN3LN4NN1
PeriodBEMSEMSEMS*BEMSEMSEMS*BEMSEMSEMS*BEMSEMSEMS*
Mean19.08/19.9512.0925.2219.4418.7119.9514.7720.9523.9521.42
St.dev.8.26/17.525.1921.258.5114.8521.067.6310.0815.4410.65
Median17.00/14.0010.9520.3519.0014.8014.0012.4018.3018.5017.60
MIN7.00/4.005.004.104.108.003.203.206.807.307.30
MAX36.00/97.6028.0099.0035.0084.0099.0033.6050.5086.4048.20
Table 3. Descriptive statistics for data collected via low-cost sensors, at 4 different locations in Novi Sad.
MS1MS2MS3MS5
CampaignBEMEMBEMEMBEMEMBEMEM
Mean24.0525.8526.7931.0226.2728.7223.5021.31
St.dev.17.7016.7120.9423.5416.1416.8615.506.38
Median21.4622.1322.5423.6126.6124.0220.0121.11
MIN2.566.371.904.476.508.287.9911.49
MAX74.2174.2678.8488.5466.3475.6461.8339.14
25th perc.8.7313.247.9712.1511.0316.3412.5917.08
75th perc.34.5235.2640.8147.5036.0738.1230.1324.70
Publisher’s Note: MDPI stays neutral with regard to jurisdictional claims in published maps and institutional affiliations.

