Review

Advanced Label-Free Laser Scanning Microscopy and Its Biological Imaging Application

1
Health Electronics Center, Institute of Microelectronics of the Chinese Academy of Sciences, Beijing 100029, China
2
School of Microelectronics, University of Chinese Academy of Sciences, Beijing 100049, China
*
Authors to whom correspondence should be addressed.
Appl. Sci. 2021, 11(3), 1002; https://doi.org/10.3390/app11031002
Submission received: 29 December 2020 / Revised: 19 January 2021 / Accepted: 20 January 2021 / Published: 22 January 2021
(This article belongs to the Special Issue Perspectives in Laser Scanning Microscopy)

Abstract

:
By eliminating the photodamage and photobleaching induced by high intensity laser and fluorescent molecular, the label-free laser scanning microscopy shows powerful capability for imaging and dynamic tracing to biological tissues and cells. In this review, three types of label-free laser scanning microscopies: laser scanning coherent Raman scattering microscopy, second harmonic generation microscopy and scanning localized surface plasmon microscopy are discussed with their fundamentals, features and recent progress. The applications of label-free biological imaging of these laser scanning microscopies are also introduced. Finally, the performance of the microscopies is compared and the limitation and perspectives are summarized.

1. Introduction

To date, optical microscopy has been the most important tool in biology for observing the biological structures, morphology and dynamics in subcellular size. Due to high spatial resolution induced by focal point of light in point-scanning mode, laser scanning microscopy (LSM) got rapidly development in the past decades. In 1957, the first confocal laser scanning microscopy (CLSM) was proposed by M. Minsky for reducing blurring and improving contrast via point-to-point illumination and detection [1]. Nowadays, the fluorescent confocal laser scanning microscopy (FCLSM) that combines the fluorescent labels and CLSM has been one of the most powerful and versatile methods for studying cells, tissues and organisms. Furthermore, various super resolution microscopies have been developed based on FCLSM, such as stimulated emission depletion (STED) [2,3,4], reversible saturable optical fluorescence transitions (RESOLFT) [5,6,7], and saturated excitation (SAX) [8,9].
Although FCLSM has been applied extensively in biological imaging, both photo-damage and photo-bleaching induced by high intensity laser and fluorophore hindered the imaging and analysis to biological samples. Furthermore, functional disturbance caused by fluorophore may also limit the applications of FCLSM. In contrast, advanced label-free imaging LSM techniques shows advantages in imaging and dynamic tracing to biological tissues and cells. This review discussed LSM and its label-free biological imaging application. Firstly, the laser scanning coherent Raman scattering microscopy (CRSM) and its two subclasses, i.e., coherent anti-Stokes Raman scattering microscopy (CARSM) and stimulated Raman scattering microscopy (SRSM) were introduced, and their applications in imaging cells and issues were reviewed and compared. Then, the progress of second harmonic generation microscopy (SHGM) was discussed. Finally, label-free scanning localized surface plasmon microscopy (SLSPM) based on LSM was introduced, which was especially suitable for studying morphology and dynamics at cell-subtract interface. These three LSMs based microscopic techniques were summarized and compared in the aspects of work wavelength, lateral resolution, axial resolution, etc. The advantages and potential applications for biological imaging of each technique were discussed.

2. Laser Scanning Coherent Raman Scattering Microscopy (CRSM)

Due to the vibration at characteristic frequencies, chemical bonds of molecules can be utilized to obtain information of the molecules. Based on Raman active vibrational modes of molecules, coherent Raman scattering (CRS) is used for vibrational spectroscopic imaging method which has been an emerging technique to map the distribution of specific molecules inside specimen. The CRS has two types: coherent anti-Stokes Raman scattering (CARS) and stimulated Raman scattering (SRS), which has been used for important label-free imaging techniques in biology with high specificity of quantitative analysis.

2.1. Laser Scanning Coherent Anti-Stokes Raman Scattering Microscopy (CARSM)

In 1965, Terhune and Maker discovered the CARS phenomenon. They found a blue-shift of the Raman scattering spectrum when the frequency difference of two incident lasers match the benzene Raman scattering [10]. Then Duncan and coworkers demonstrated the first laser scanning CARSM in 1982 [11]. As shown in Figure 1a [12], the CARS is a coherent nonlinear optical process. Two laser beams (frequency f p ) with one for pump and probe and another for Stokes laser (frequency f s ), are impinged to target molecules within the sample. When the frequency difference between pump and Stokes laser satisfies the Raman active vibrational frequency of molecules f v i b = f p f s , the CARS occurs with frequency being f C A R S = 2 f p f s . Specifically, the molecule absorbs a pump photon to a lower virtual state and emits a Stokes photon for returning to a higher energy ground state. Then the molecule immediately absorbs a probe photon to a higher virtual state, emits a photon with frequency of f p + f v i b and returns to the ground state, as shown in Figure 1a.
The optical schematic of laser scanning CARSM is shown in Figure 1b [13]. Two incident lasers are collimated and tightly focused on sample to excite the CARS signal. A time-delay is used to control the temporal overlap of two excitation beams for effective excitation of CARS. The signal of backward propagating is collected by a high NA objective, which is also used to focus incident light. The signal of forward propagating is collected by another objective on transmission light path. The CARS signal is detected by PMT (Photomultiplier tubes) detector after filtering the incident lasers.
The CARSM began a rapid development via improving the detection speed, broadband, and sensitivity. Cheng et al. developed a high-speed CARS vibrational imaging method, which is two orders of magnitude faster than traditional CARSM by combining high repetition rate laser scanning and analog signal detection scheme [14]. Then a CARSM with imaging speed of video-rate was developed for vibrational imaging of tissues in vivo by Xie’s group via detecting strong backscattering of forward CARS signal with video-rate scanning microscopy [15]. Today, higher speed imaging has been achieved by employing more techniques, such as Fourier-transform [16] and deep-learning noise reduction [17]. The spectral bandwidth of CARSM has also shown great increase by multiplex [18,19] and broadband CARSM techniques [20,21]. Xie and coworkers reported a two-pulse multiplex CARS microspectroscopy using a picosecond pump beam and a femtosecond Stokes beam to demonstrate the polarization CARS imaging [18]. Lee et al. demonstrated the three-color CARS with continuum pulse of different frequency components as pump and Stokes and a narrowband pulse as probe [22]. As sensitivity of CARSM is restrained by the strong non-resonant background noise, polarization CARSM [23], phase and polarization coherent control CARSM [24], and femtosecond adaptive spectroscopic technique via CARS were introduced for suppressing background noise [25]. Cicerone’s group developed a broadband CARS imaging platform by using intrapulse three-color excitation and exploiting the strong non-resonant background to amplify the inherently weak fingerprint signal, which provides an advantageous combination of speed, sensitivity and spectral bandwidth [26].
Recently, the study on improving the resolution of CARSM has attracted lots of attentions. By using laser beam shaping and higher-order CARS signal, resolution of CARSM has been remarkably enhanced. Resolution approaching 130 nm was achieved by narrowing the microscope’s excitation volume in the focal plane through the combined use of a Toraldo-style pupil phase filter with the multiplicative nature of four-wave mixing [27]. A supercritical focusing CARSM has been developed by using two optimized phase patterns with combination of concentric rings with alternant 0 and π phase, which is generated by a spatial light modulator and applied to the pump beam for minimizing the focal spot size [28]. The theoretical research has indicated that diffraction limit can be also broken by controlling the relative phase around the center of the pump and Stokes pulses [29]. Recently, a novel higher-order CARSM was investigated by using the higher-order nonlinear optical processes and detect the CARS signal at new wavelength to achieve high-contrast, super-resolution vibrational imaging [30].
Several distinct characteristics, including high specificity, high spatial resolution, high sensitivity, and label-free, make CARSM potentially ideal for noninvasively imaging complex biological and chemical samples. In living cells imaging, various molecule vibrational modes can be detected by CARS, such as phosphate stretch vibration, amide I vibration [14,31], OH stretching vibration [32,33] and CH stretch vibration [34,35], which can be applied for visualizing DNA, protein, water and lipids, respectively. Meanwhile, high imaging speed and signal level make CARS more suitable for observing biological dynamic process in vivo [15,36]. The synchronous change of the cell voltage and distribution of chemical states of water inside a nafion membrane was monitored with CARSM. For example, the transient values of the number of water molecules per sulfonic acid group increased rapidly from 7.4 at 0 s to 11.7 at 4.5 s under current density jump from 0.1 to 1.0 A⋅cm−2 [37]. In addition, CARSM also found applications in gas phase analysis [38] and material characterization [39]. Multiplex CARSM imaging was demonstrated and used to visualize the thermodynamic state, including the liquid crystalline and gel phase of lipid membranes [19]. In addition, CARSM has also been a powerful characterization tool for Hexagonal Boron Nitride [40], porous carbon [41] and graphene [42].

2.2. Laser Scanning Stimulated Raman Scattering Microscopy (SRSM)

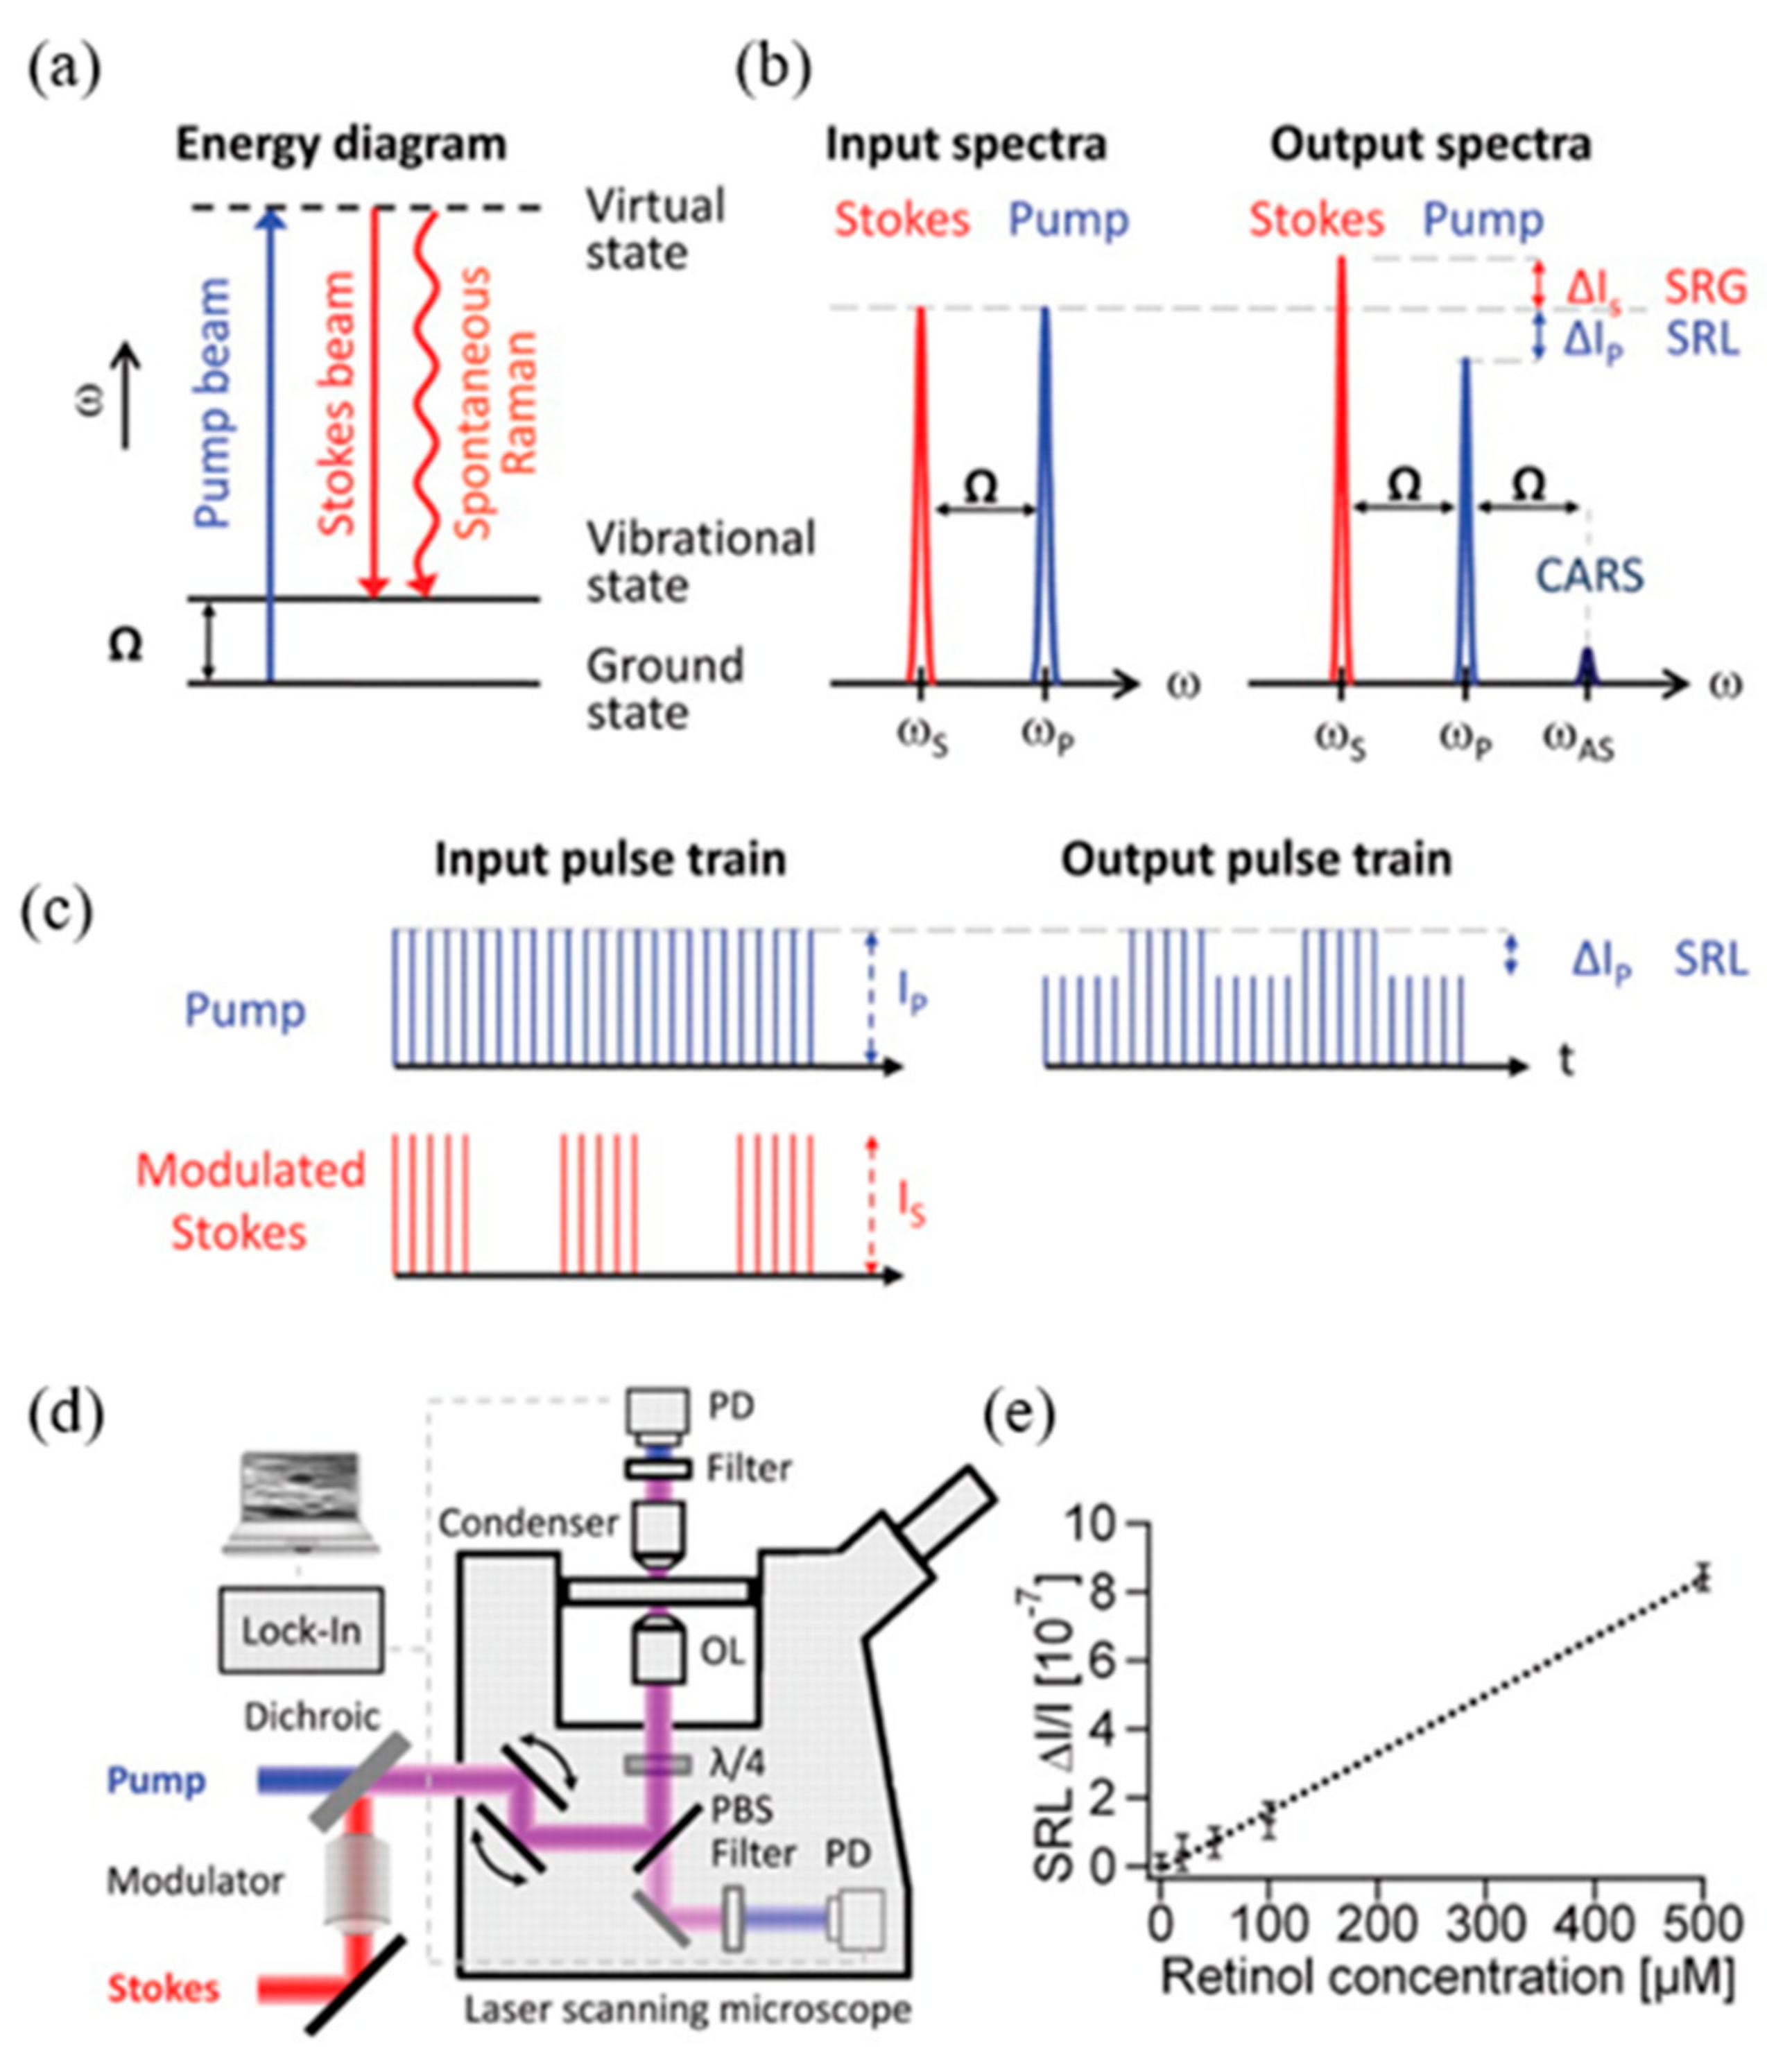
Although CARSM has good performance on high sensitivity and high spatial resolution imaging to biological and chemical specimen, it is not suitable for quantitative chemical imaging, and has to restrain the strong non-resonant background. As SRS signals depend linearly on concentration of signaling molecule inside sample with background-free contrast, SRSM is a good candidate for quantitatively analyzing the molecule map information inside specimen. The excitation process of SRS is displayed in Figure 2a [43]. Similar with CARS, when the frequency difference between pump and Stokes beams is equal to Raman active vibrational frequency of molecules, amplification of the Raman signal is achieved by virtue of stimulated excitation. Consequently, the intensity of Stokes beam I s , experiences a gain Δ I s (stimulated Raman gain, SRG), and the intensity of pump beam I p , experiences a loss Δ I p (stimulated Raman loss, SRL), as shown in Figure 2b. Therefore, unlike CARS, SRL and SRG do not exhibit a nonresonant background. For SRSM, the Stokes beam is modulated at a high frequency, and the amplitude modulation of the pump beam can be detected by using SRL (Figure 2c). As shown in Figure 2d, the Stokes beam of SRSM is modulated by an electro-optic modulator. A photodiode is used to detect the transmitted and reflected light after filtering. SRL is measured by a lock-in amplifier to provide image pixels, and a fast scanning is performed for 3D imaging. Linear dependence of SRL signal intensity on concentrations of target molecule is shown in Figure 2e.
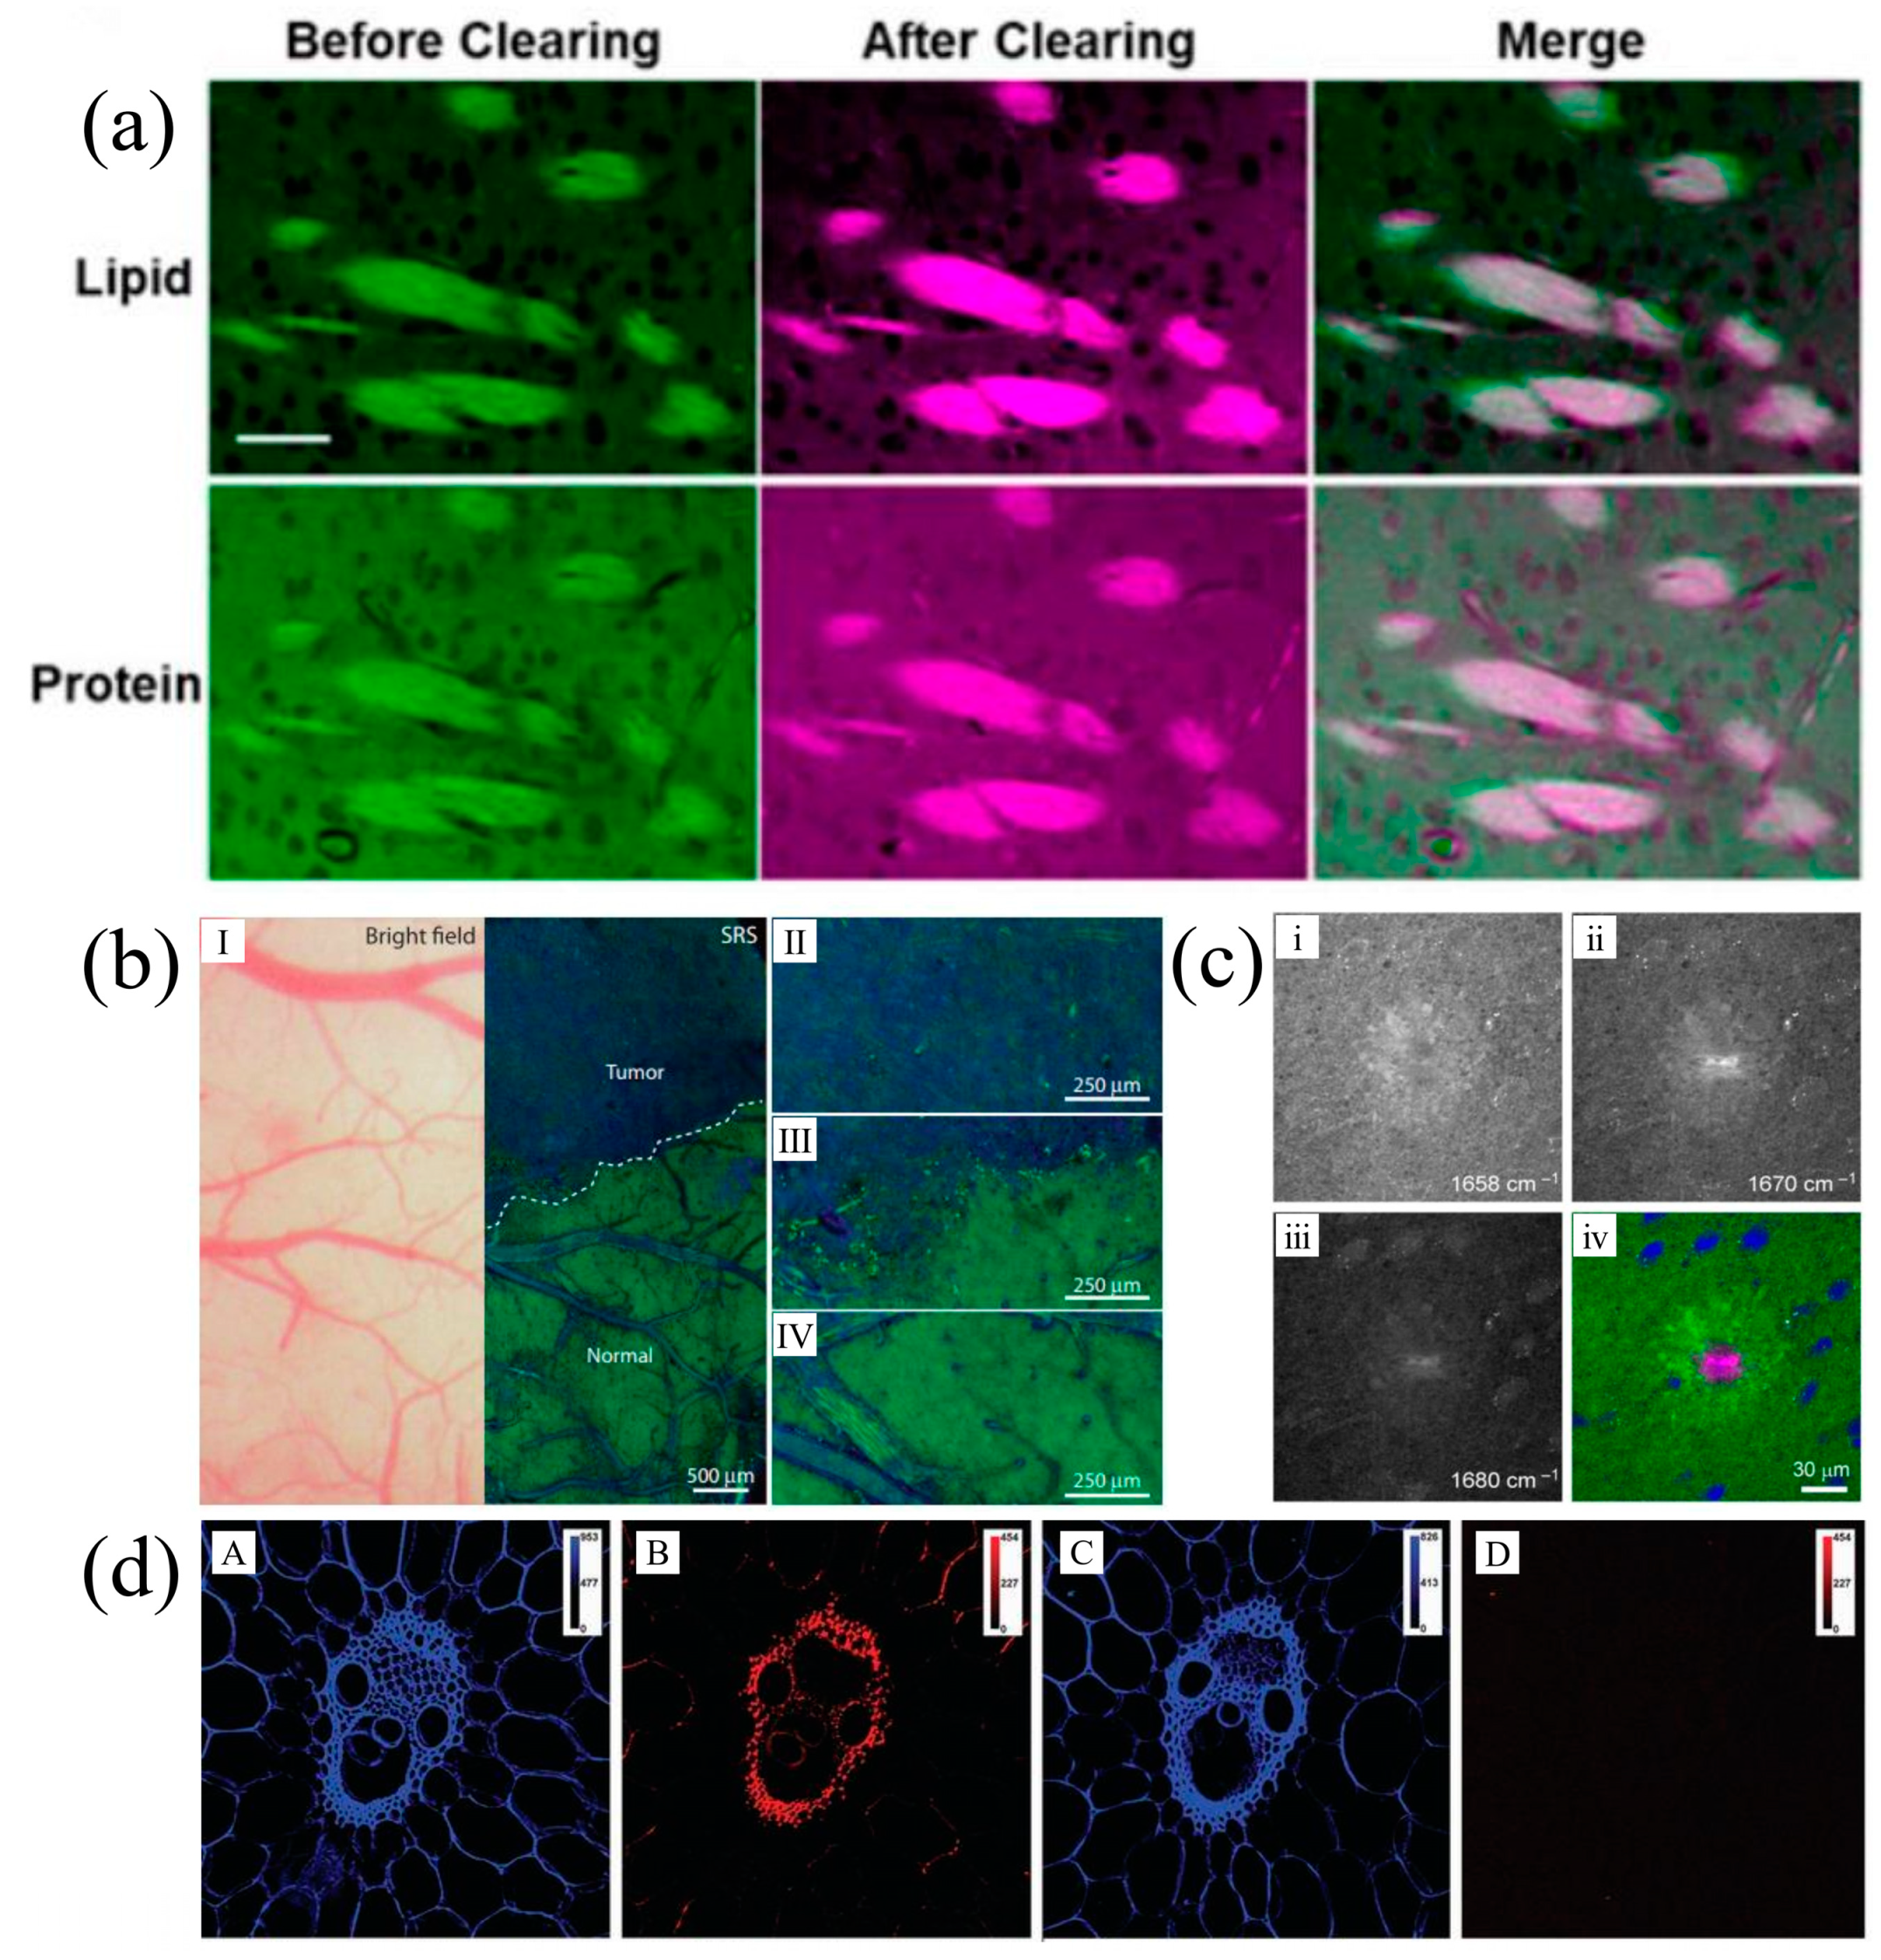
SRS was first discovered by Woodbury and Ng in 1962 [44,45]. Then SRSM was introduced by Ploetz et al. for imaging polystyrene beads in 2007 [46]. In 2008, Xie’s group reported a high speed, high sensitivity, and three-dimensional multiphoton vibrational imaging technique based on SRS, which showed powerful label-free chemical contrast capability in bio-imaging [43]. The sensing range of typical SRSM is μM-mM of molecules concentration. Through using a microsecond resonant delay line, the detection sensitivity approaches 21.2 mM at 83 μs acquisition time [47]. Meanwhile, the super-resolution SRS imaging has been proposed and implemented by combining concepts from stimulated emission depletion (STED) microscopy and femtosecond stimulated Raman spectroscopy (FSRS) [48]. The far-field spatial resolution of SRSM has achieved ~130 nm with excitation wavelength of 800~1064 nm [49]. A virtual sinusoidal modulation method was also proposed for retrieving super-resolution SRS images, which demonstrated a spatial resolution of 255 nm [50]. As volumetric imaging provides global understanding of 3D complex systems, Chen et al. demonstrated the Bessel-beam-based simulated Raman projection microscopy and tomography for label-free volumetric imaging with spatial resolution being 0.83 μm [51]. Typically, the imaging depth of SRSM is 100 μm for high scattering biological samples and 300–500 μm for less scattering biological samples. Wei et al. developed a volumetric chemical imaging method that couples Raman-tailored tissue-clearing with SRSM, which achieves greater than 10 times depth increase compared with the standard SRS (Figure 3a) [52]. By now, SRSM has achieved a high speed with video-rate, sensitivity down to single molecules, spatial resolution breaking the diffraction limit and volumetric imaging depth with millimeter [53]. Moreover, SRSM permits rapid imaging of polystyrene and polymethyl methacrylate beads in Brownian motion in dimethyl sulfoxide (DMSO) at 70 ms intervals without motion artiacts, and shows powerful ability to monitor real-time cancer treatment effects and in vivo transport of drug solvent and penetration of DMSO into the plant tissue in vivo [54].
Recently, SRSM rapidly developed and was widely applied in various branch of life science, such as histopathology, cell biology, neuroscience, tumor research etc. Histopathological diagnosis in vivo has been demonstrated by using multicolor images originating from CH2 and CH3 vibrations of lipids and proteins, which retrieved the subcellular resolution from fresh tissue [55]. Moreover, SRS imaging to lipid metabolism was reported to reveal an aberrant accumulation of esterified cholesterol in lipid droplets of high-grade prostate cancer and metastases [56]. Label-free SRS imaging of DNA enabled noninvasive visualization of live cell nuclei in both human and animals. Through the distribution of DNA retrieved from the strong background of proteins and lipids by linear decomposition of SRS images at three optimally selected Raman shifts, it is possible to obtain instant histological tissue examination during surgical procedures [57]. SRSM has also been proved to be able to differentiate healthy human and mouse brain tissue as well as tumors from non-neoplastic tissue based on their different Raman spectra (Figure 3b) [58]. Likewise, SRS imaging has shown its potential capability and application for differentiating misfolded amyloid-β on Alzheimer’s disease pathology (Figure 3c) [59]. These works provided new approaches for tracing dynamics and metabolism in living cells, which can be used for diagnosing and treating diseases.
SRS imaging has also been used for monitoring the breakdown of biomass to biofuels. It helps researchers to understand the conversion mechanisms of plant cell biomass to biofuels and find cost-effective industrial conversion strategy. By recognizing the Raman signal, the different chemical bonding is detected. A chemical movie recording degradation of lignin and cellulose in cell wall was used to understand which parts of plant are degraded most efficiently by the treatment process [60]. By comparing the two-colored SRS imaging before and after delignification reaction, another study revealed that hemicelluloses were generally resistant to acid chlorite at room temperature, and digestion of the delignified walls apparently depended on wall mass concentration but not on wall types (Figure 3d) [61]. These works have greatly promoted the development of SRSM and its application in biomedicine [62,63,64,65].

3. Second Harmonic Generation Microscopy (SHGM)

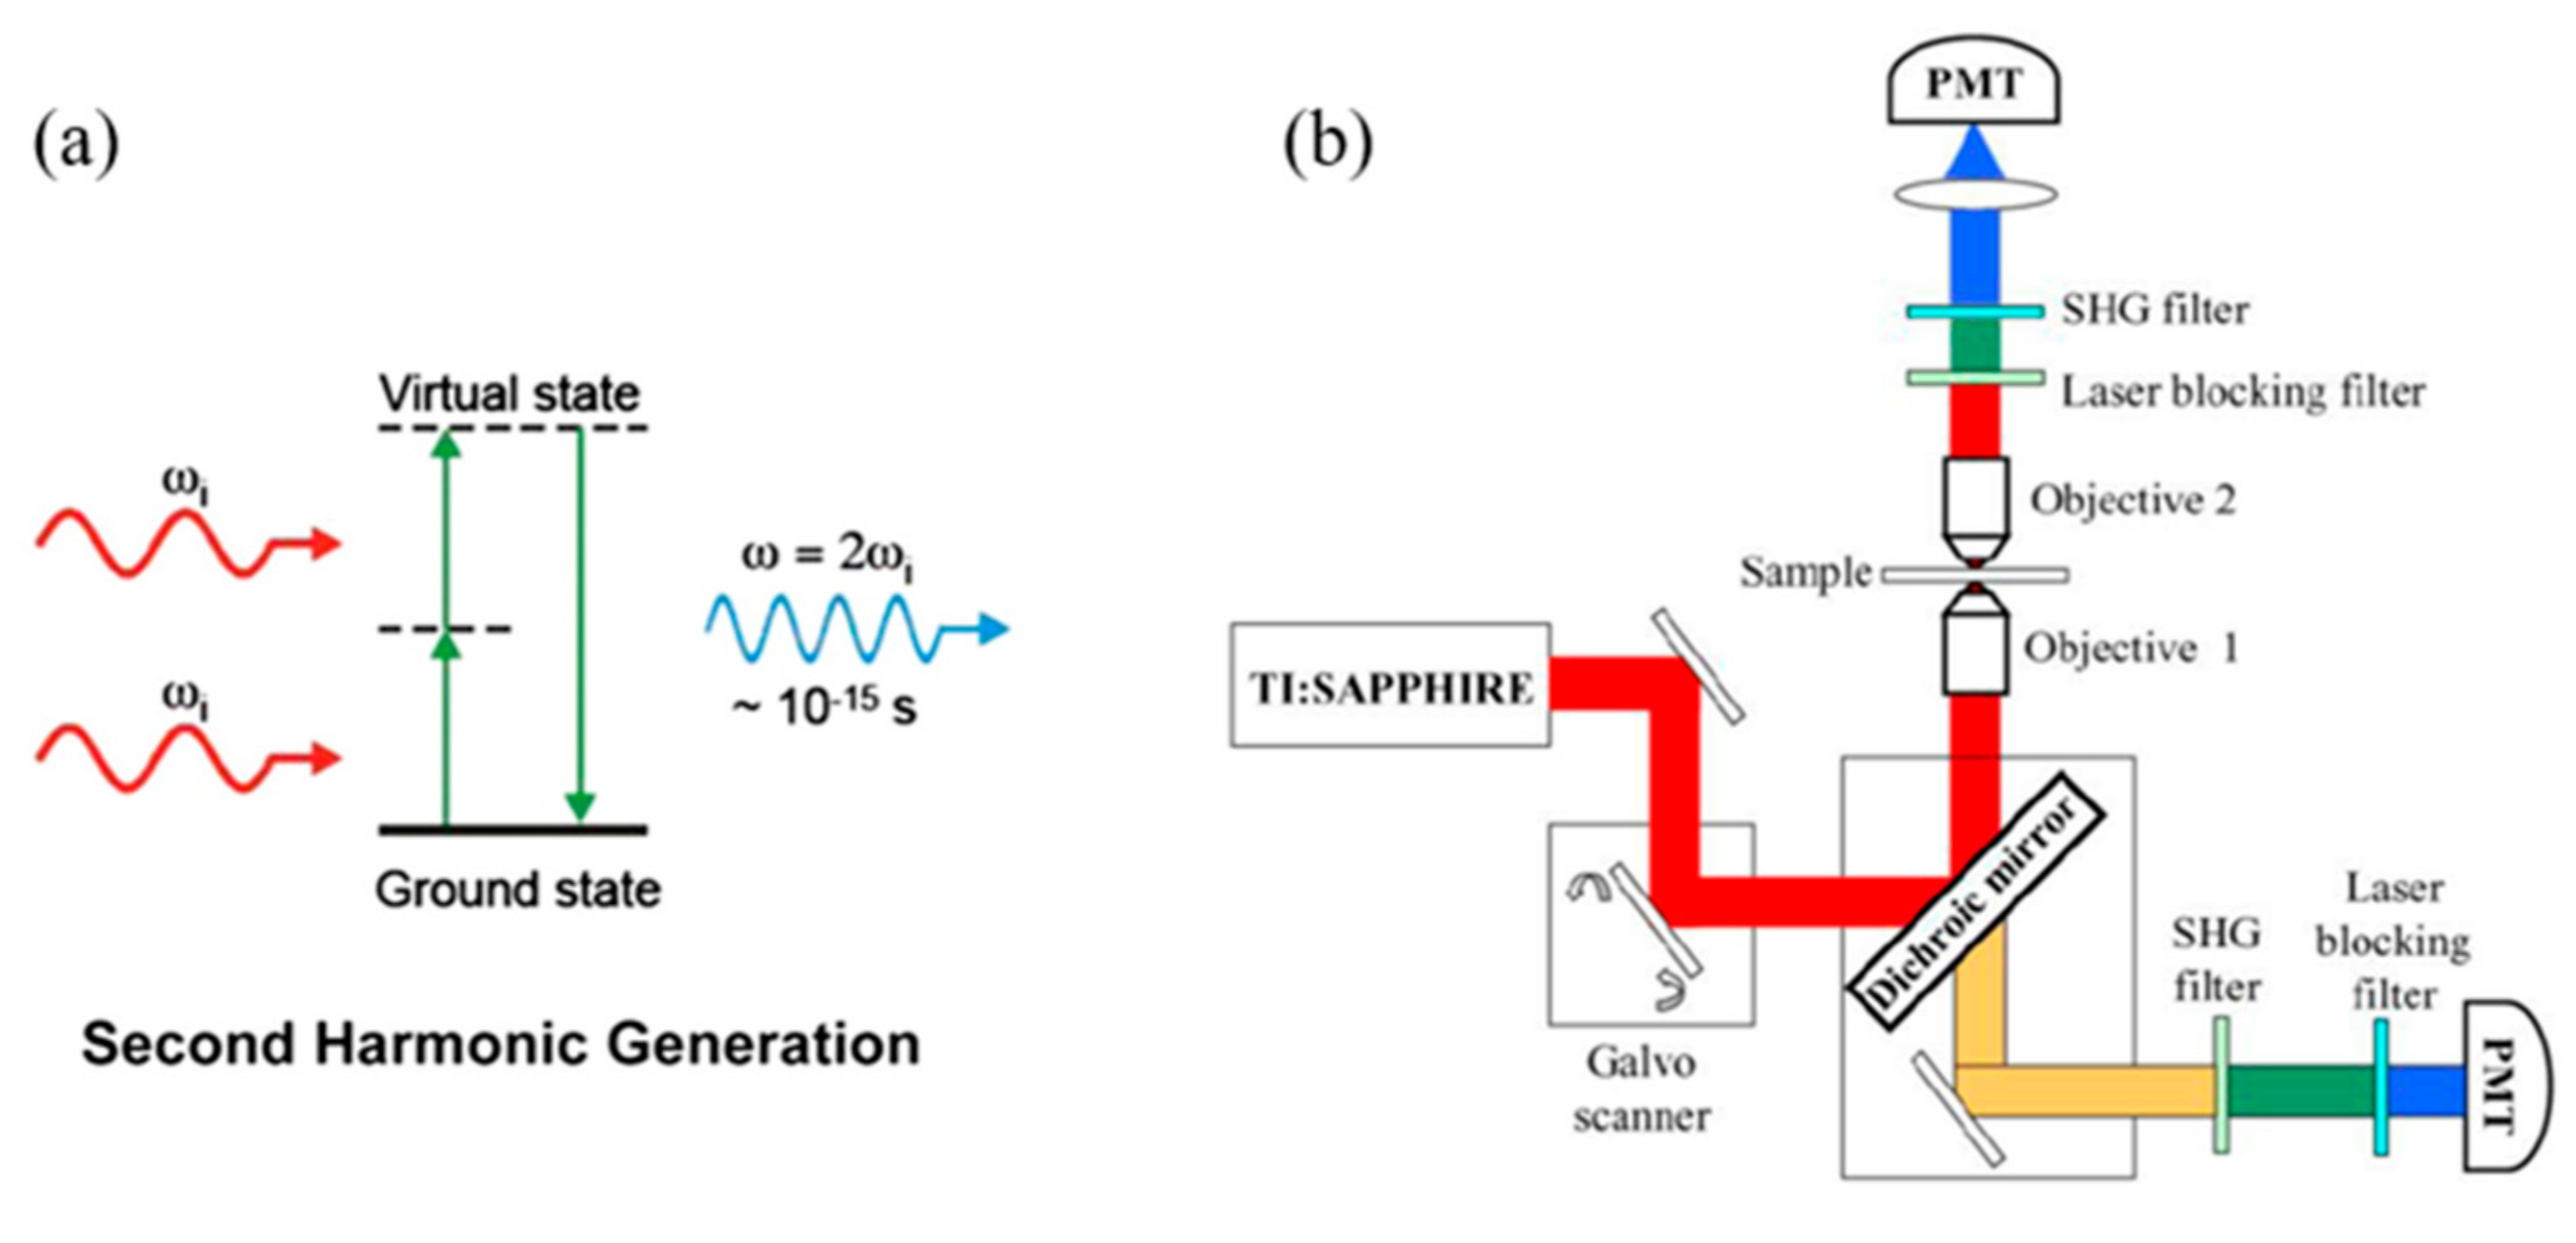
SHG process is a special case of the sum frequency process, also called “frequency doubling”. As shown in Figure 4a [66], by using two incident lights with same frequency, the output is twice the frequency of the incident lights. The incident light is called fundamental frequency and the output with frequency doubling is called second harmonic. In 1961, SHG was first confirmed with a quartz sample by P. A. Franken et al. [67]. In 1974, Hellwarth and Christensen firstly integrated SHG and microscopy by imaging SHG signals from polycrystalline ZnSe [68]. A typical setup of SHGM is shown in Figure 4b [69]. The excitation wavelength was 780 nm. A galvo scanner was used to direct the beam in a raster-scan pattern. The beam was reflected by a dichroic mirror and focused onto the sample using a high NA water-immersion objective 1. The emitted backward SHG signal was collected by the same objective, whereas the forward signal was collected by a low NA objective 2. In both geometries the same two filters were used: one filter was used to block the fundamental laser, and the other was a band-pass filter to transmit the SHG signal at 390 nm. The photomultiplier tubes in both geometries were used to record the forward and backward SHG images.
In 1986, the first biological SHG imaging experiments were done by Freund and Deutsch to study the orientation of collagen fibers in rat tail tendon [70]. In 1993, Lewis examined the second-harmonic response of biological membrane in electric fields via using chiral styryl dye [71]. He also demonstrated his work on live cell imaging [72]. In 2010, P. Pantazis extended SHG to whole animal in vivo imaging [66]. The review by Paolo showed how SHGM achieved multimodal microscopic images of biological tissues, namely backward, forward and polarization SHG imaging [73]. However, the spatial resolution of SHGM is vastly restricted due to the near infrared excitation wavelength. Many methods have been carried out in order to improve the spatial resolution. Radially-polarized laser illumination is an effective and easy way for dramatically enhancing the resolution of SHGM [74,75,76]. Wang et al. demonstrated that spatial resolution was improved more than 21% by using radially-polarized beam focused by elliptical mirror compared with lens [77]. The work of Tian et al. showed that the subtractive imaging method could been extended to SHGM that increased the resolution to 210 nm and obtained a better contrast simultaneously [78]. Yeh et al. combined SHGM with structured illumination based on point-scanning, which improves the resolution by factors of ~1.4 in the lateral and 1.56 in the axial directions, respectively [74]. Sheppard proposed pixel reassignment, in which the point detector of the traditional confocal microscopy is replaced by a multi-element array detector [79]. Combining with deblurring operation, this method showed a spatial resolution enhancement of about 1.87 compared with conventional SHGM [80].
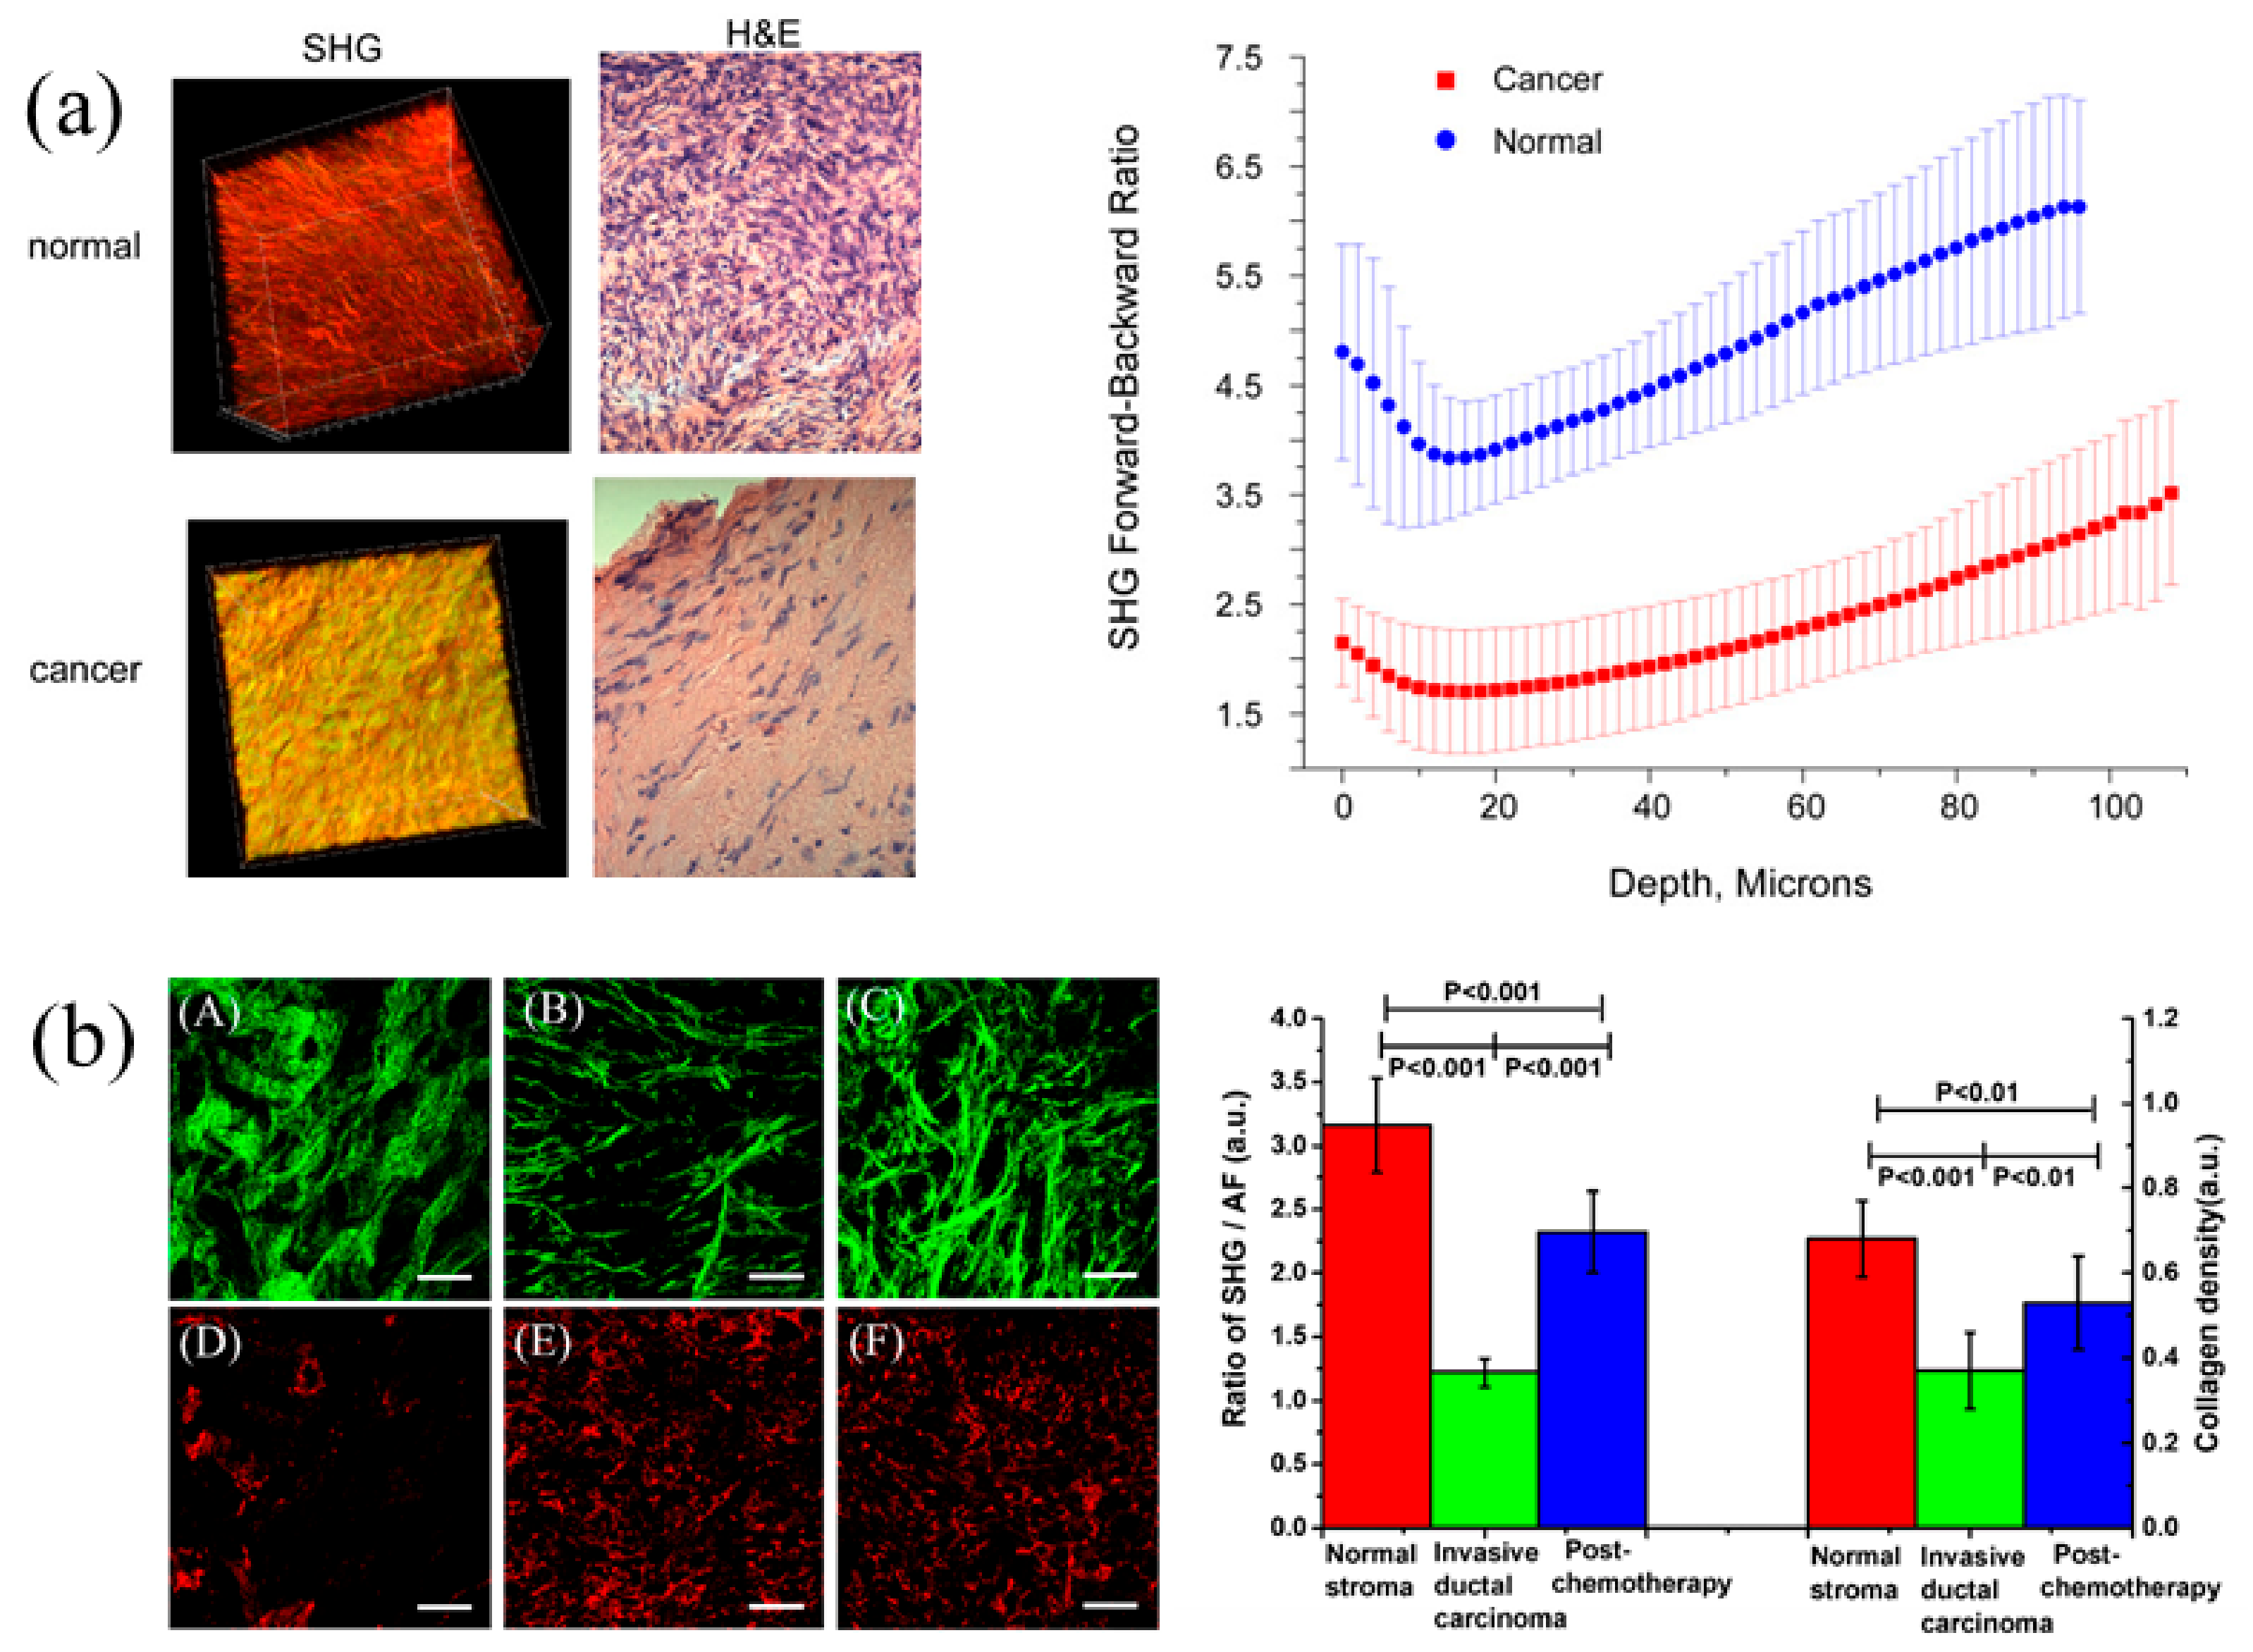
Nowadays, SHGM has been extensively used in visualization to structures and functions of cells and tissues. As SHG is highly sensitive to collagen fibril/fiber structure [70,81], SHG imaging can be used to detect collagen-associated changes occurred in various diseases [82], such as cancer, fibrosis, and connective tissue disorders. Dynamic reorganization of the collagen network in ex vivo murine skin dermis was imaged rapidly by polarization-resolved SHGM during mechanical assays with acquisition time of 27 ms per line [83]. Ovarian cancer was studied by SHGM to detect the structure changes of the ovarian extracellular matrix in human normal and malignant ex vivo biopsies (Figure 5a) [84]. The results showed that the SHG emission distribution and bulk optical parameters are related to the tissue structure and significantly different in the tumors. Combining with autofluorescence (AF), SHGM can prove a quantitative analysis to different collagen content in the process of tumor progression and recession post-chemotherapy via calculating the ratio of SHG/AF (Figure 5b) [85]. Polarization-dependent SHGM was developed for accurately diagnosing the tumor state of breast cancer by analyzing anisotropy and the “ratio parameter” values of SHG signal (Figure 6a) [86]. Through further data analysis, parameters of PIPO (polarization-in, polarization-out) SHGM, i.e., susceptibility ratios and degree of linear polarization, can be used to distinguish tumor from normal tissue (Figure 6b) [87].
Furthermore, some automated or semi-automated solutions have been developed to analyze SHG images for evaluating the healthy and abnormal tissue. Early embryogenesis of zebrafish embryos was automatically reconstructed and analyzed with conformal scanning harmonic microscopy scheme for better imaging quality [88]. Fast Fourier transform analysis and the gray-level co-occurrence matrix have also been applied to analyze biopsy samples of human ovarian epithelial cancer at different stages [89]. It showed the feasibility of identifying collagen fibril morphology based on first and second-order texture statistical parameters from SHG images. In addition, radiomics feature analysis, tree-based pipeline optimization tool [90] and 3D texture analysis based on k-nearest neighbor classification are also proposed for differentiating healthy and pathologic tissues [91].

4. Scanning Localized Surface Plasmon Microscopy (SLSPM)

Surface plasmon polaritons (SPPs) is the collected oscillation of electrons at metal-dielectric interface. As SPPs is evanescent wave along metal-dielectric interface, the excitation of SPPs requires the wavevector matching condition satisfied by prism, waveguide, and gratings. Due to their high sensitivity to refractive index change near interface, in 1984, SPPs was firstly used as gas detector and bio-sensor based on Kretschmann configuration [92,93], then SPPs became an essential tool for biological and chemical sensing [94,95,96,97]. Due to non-intrusive, label-free and high sensitivity surface plasmon microscopy (SPM) is a suitable technology for near-field imaging to the cell-substrate interface [98]. However, the resolution of SPM is limited by propagation length of SPPs, e.g., being 7 μm for gold film illuminated by 633 nm wavelength. In order to improve the resolution, H. Kono et al. firstly presented SLSPM, in which the SPPs is excited by a focused laser beam as sensing probe to measure refractive index and film thickness [99,100]. Polarization of incident light is an important factor to increase resolution of SLSPM. Axially symmetric radial-polarized light optimizes the probe with full width at half maximum of 210 nm that increases the resolution [101]. H. Kono et al. used the SLSPM to image microspheres with diameter being 1.5 μm [100]. Nowadays, SLSPM have improved lateral resolution of SPP imaging up to ~200 nm by using high numerical aperture (NA) objective [96,101].
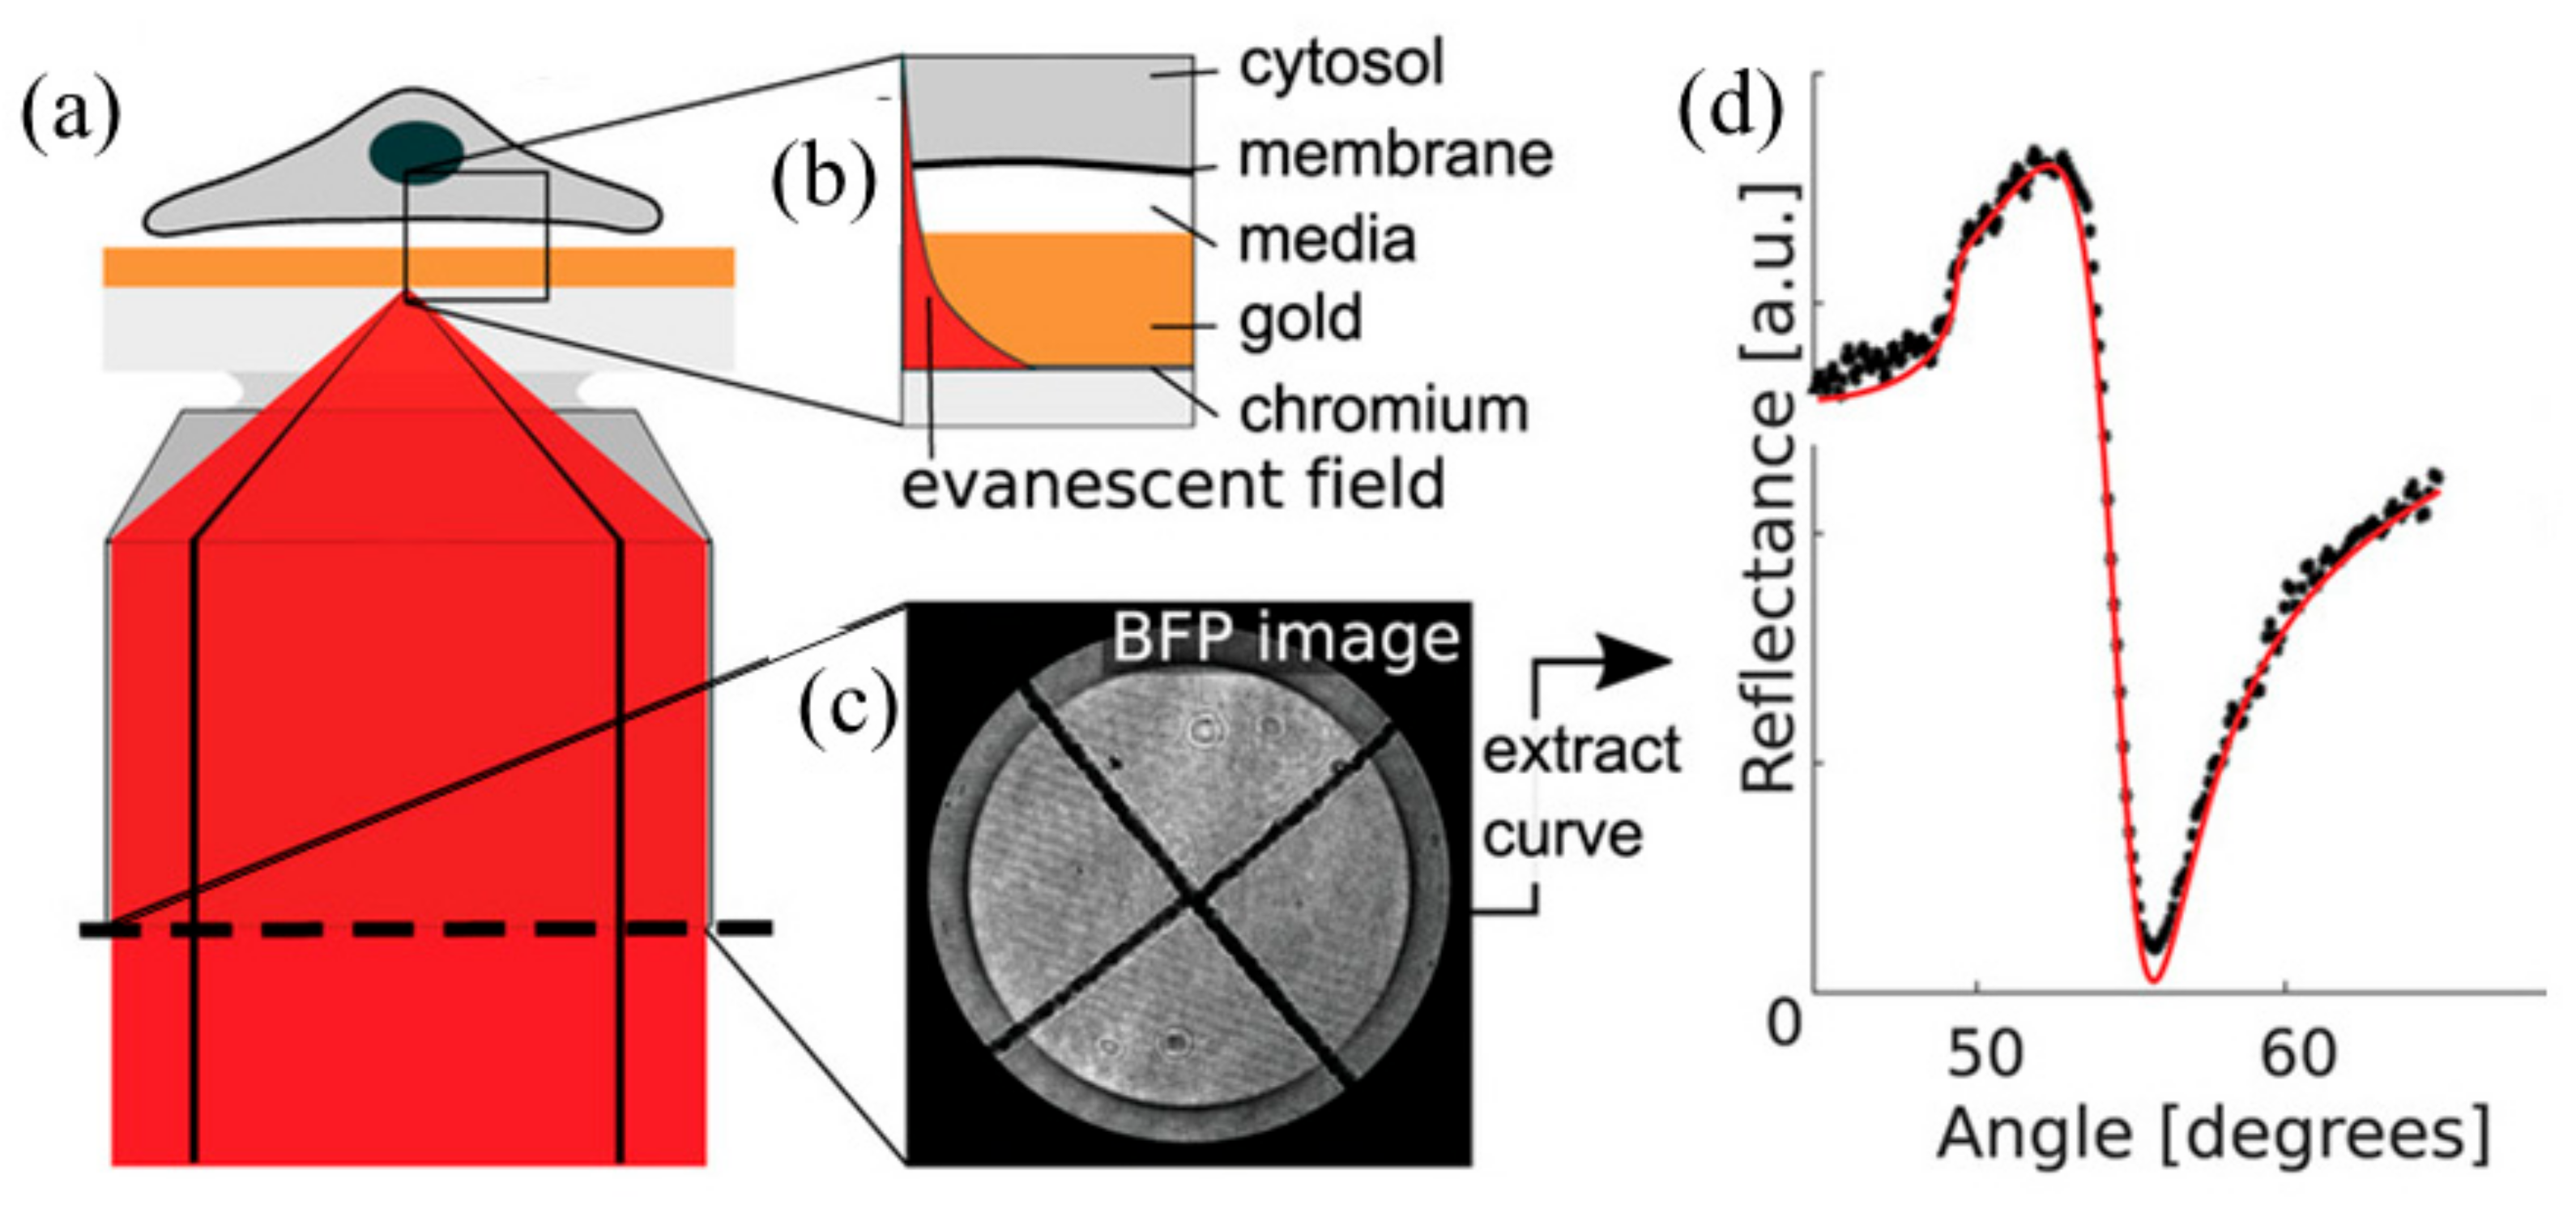
The setup of SLSPM is shown in Figure 7a [102], the collimated incident light illuminates objective after transforming through lenses, mirrors and radial polarizer, which ensures that incident light is TM-polarization in each incident plane of focal beam. The incident light is focused into spot with diffraction limit dimension to excite SPPs. The maxima of incident angle is determined by NA of objective as N A =   n   s i n θ M ( θ M is maximum angle of incident light). The intensity distribution on back focal plane (BFP) is recorded by a CCD camera, and a high-resolution image of specimen is acquired by using two-dimensional scanning. Figure 7b shows how the SPP evanescent field penetrates the cytosol on gold film. A typical BFP image is shown in Figure 7c, in which the dark ring indicates the SPPs excited by the incident light and ring radius represents propagation constant of SPPs. Along the radial direction, the reflective intensity profile dependent to incident angle is illustrated in Figure 7d. The refractive index and thickness of specimen can be obtained by fitting the resonant angle using a theoretical multilayer model [103,104].
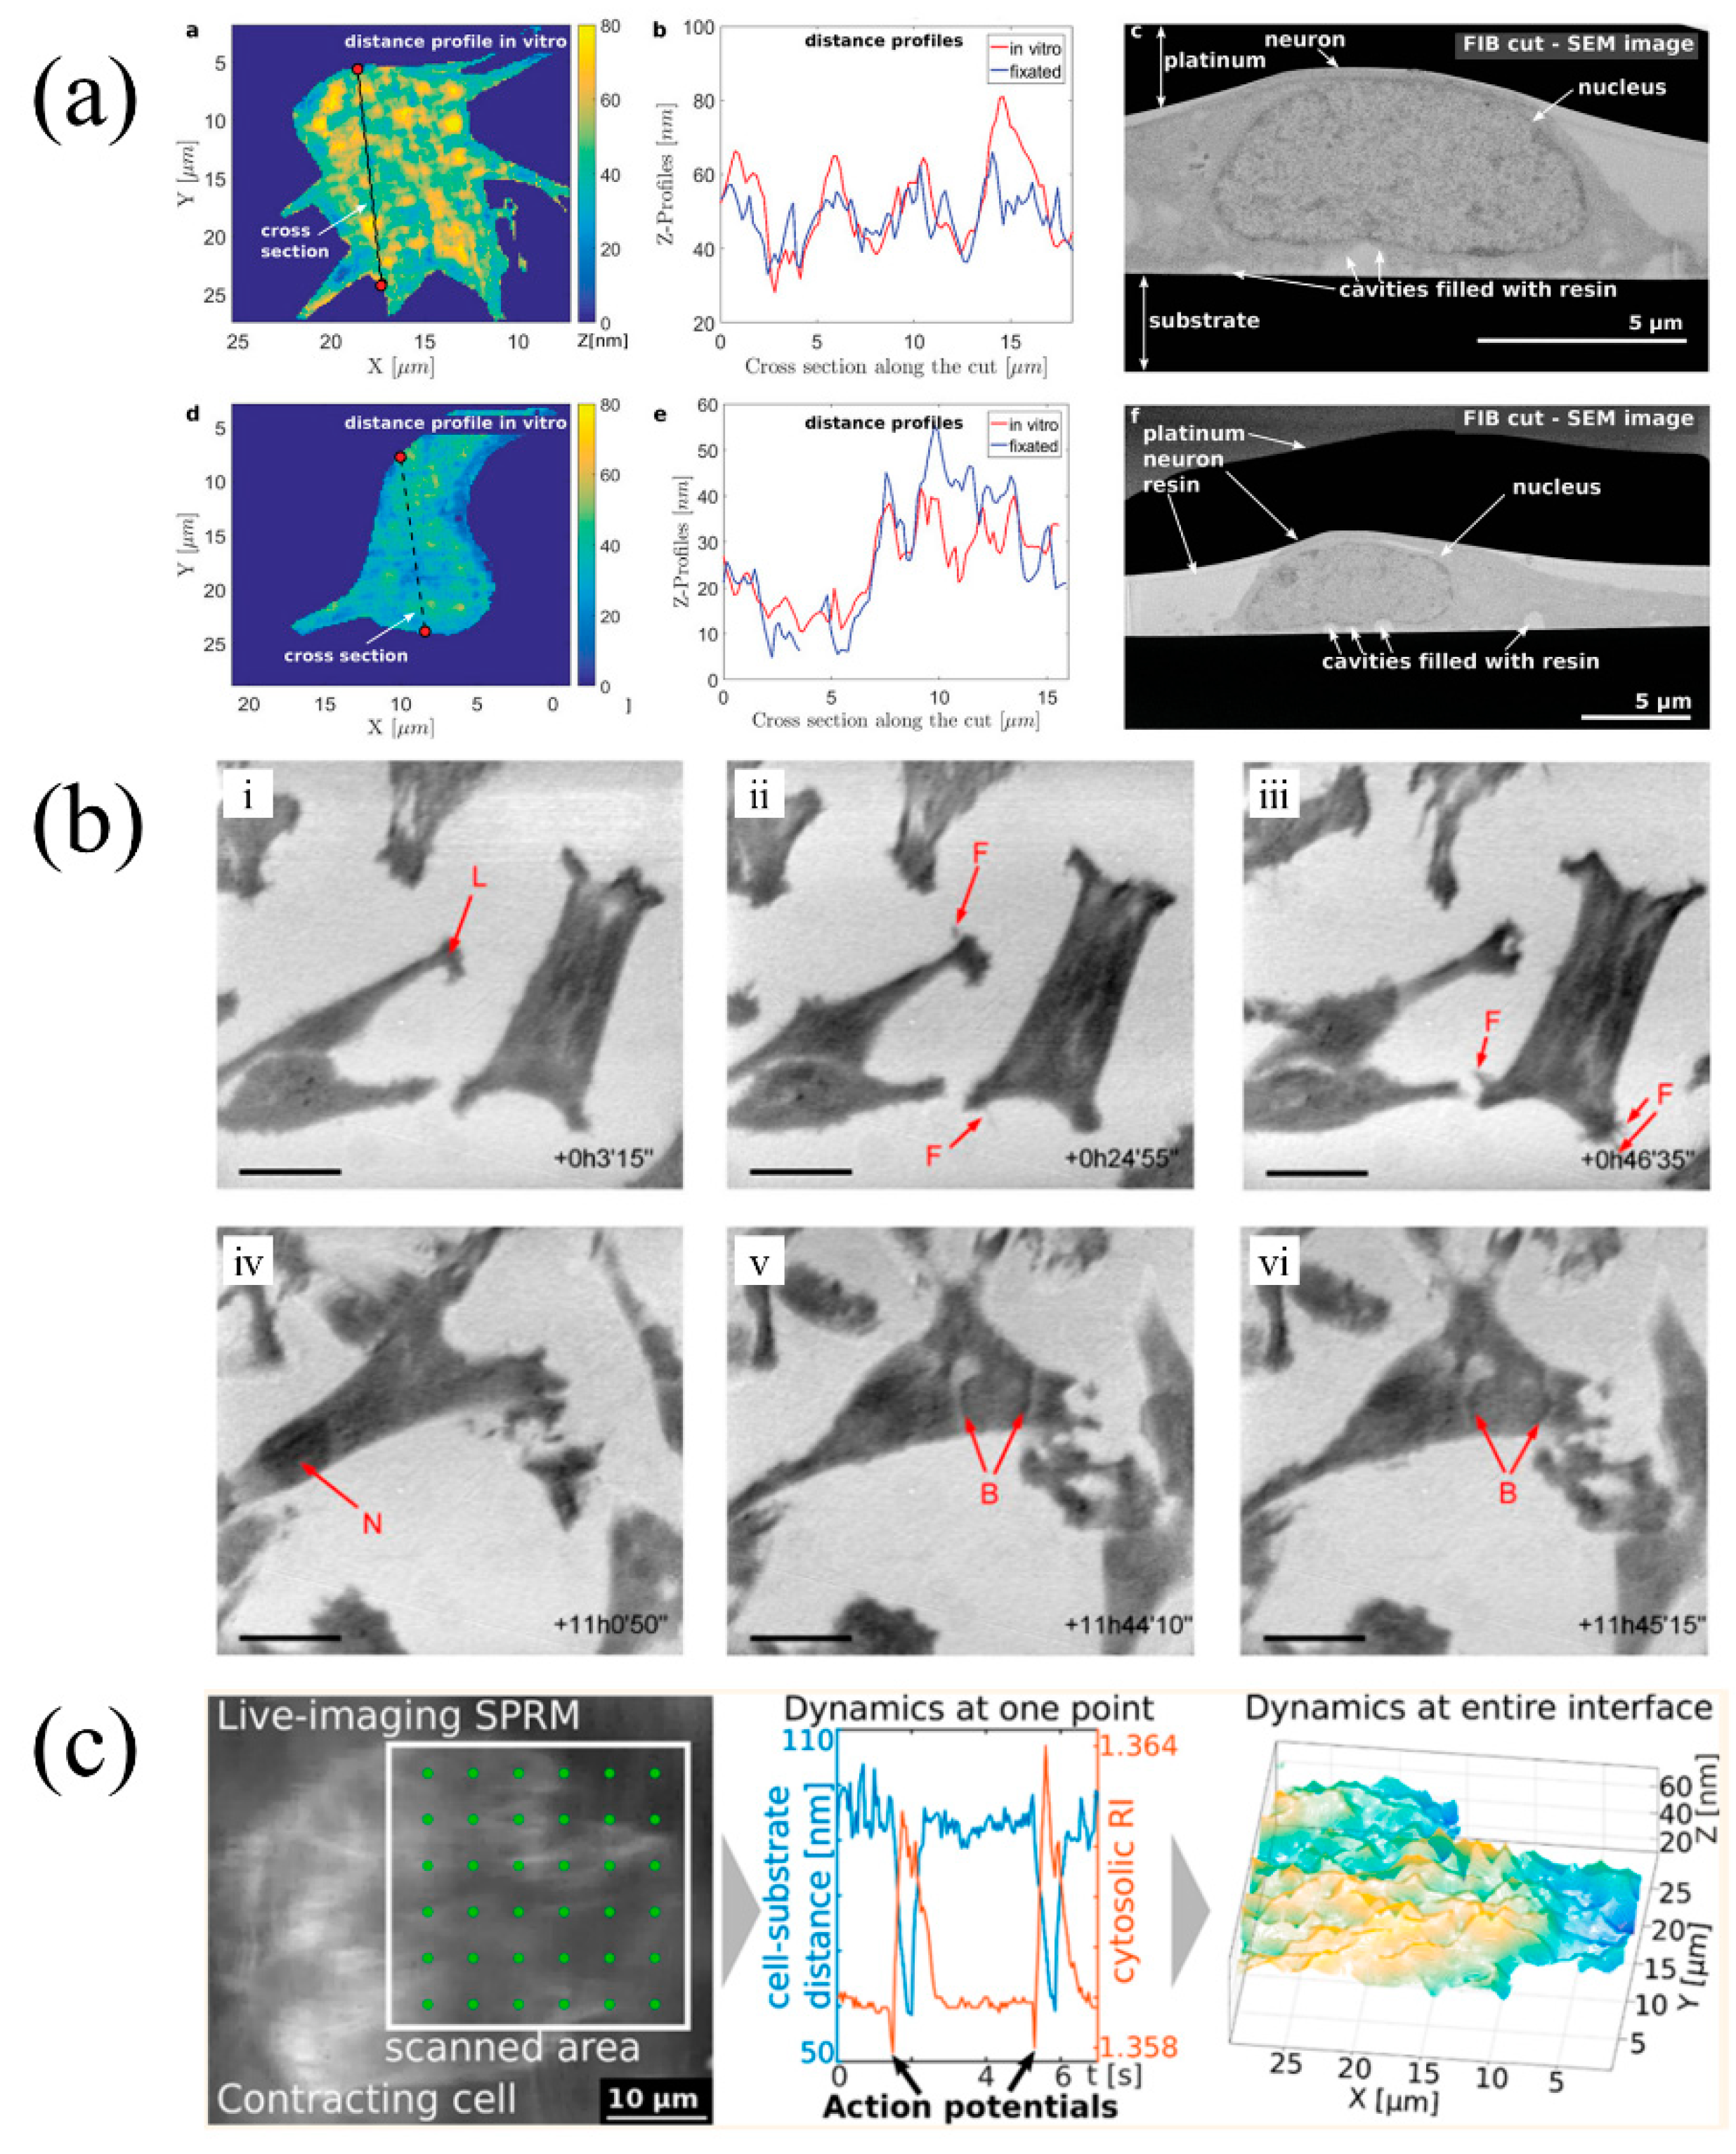
To gain better imaging quality and greater application, researchers have made many attempts to improve the performance and expand its application range. SLSPM was demonstrated to detect oligonucleotide-functionalized nanoarray by S. C. Wei, et al. [105]. In order to improve the image contrast, M. G. Somekh et al. introduced a Z-direction movement mechanism to the two-dimensional scanning mechanism. They found that if the sample is slightly shifted from the focus by about 1 μm, the image contrast (refractive index sensitivity) will be improved and the refractive index can be retrieved from the interference fringes [106,107]. In 2012, B. Zhang et al. proposed a confocal system integrated scanning SPM, which provides a simpler and more stable alternative [108]. L. Berguiga et al. reported a high-resolution metal-clad waveguide scanning microscopy with a diffraction-limited resolution, which can be operated in both TM and TE waveguide modes with radially and azimuthally polarized beams, respectively, and allows both refractive index and topography of dielectric objects to be evaluated at high resolution and sensitivity [106]. K. Watanabe reported a high resolution imaging with lateral resolution of ~170 nm and thickness resolution against the deposited lipid bilayer being ~0.33 nm [109]. E. Kreysing et al. proposed a workflow to make SLSPM as a complement for EM studies (Figure 8a, which allows for the quantification of the impact of chemical fixation on the cell–substrate interface [102].
As SPPs is evanescent wave, the SLSPM is particularly attractive for studying cell adhesion and dynamics without staining the samples [110,111,112]. Time-lapse long-term imaging of living adherent cells was reported via combining SLSPM and fiber interferometer [113]. Adherence and motility of living C2C12 myoblast cells are monitored for 50 h, revealing the dynamics of these cells during their migration (Figure 8b) [114]. Further understanding at the bio-interface has growing importance in fundamental neuroscience and biomedical research. With SLSPM, cell-substrate interface was real-time monitored and its cleft gap distance was measured in-situ [115]. E. Kreysing et al. showed a temporal and spatial mapping to changes of both refractive index and the cell-substrate distance which strongly correlates with the action potentials. They also reconstructed the three-dimensional profiles of the basal cell membrane and its dynamics, which reached an actual measurement accuracy of 2.3 nm (Figure 8c) [103]. By using SLSPM, they also analyzed the refractive index of cell organelles quantitatively in a noninvasive and label-free manner with a lateral resolution of diffraction limit [104].

5. Discussion

In this review, three types of label-free laser scanning microscopy are mentioned with their particular features. The laser scanning CRSM is a vibrational spectroscopic imaging method by using Raman active vibrational modes of molecules, which has two subtypes: CARSM and SRSM. With second-harmonic response of biological samples, SHGM is achieved and has highly sensitivity to the collagen fibril structure, which can be used to detect collagen-associated changes occurred in various diseases. Due to SPPs’ evanescent features, SLSPM is highly sensitive to refractive index change near the interface, which is appropriate for investigating cell-substrate interface. Label-free laser scanning microscopies show powerful capability for imaging and dynamic tracing biological tissues and cells. Imaging speed and sensitivity are key issues for the label-free LSM methods. Moreover, spatial resolution is also an important parameter for the microscopies. We organized the comparison of three label-free LSMs, which is shown in Table 1. The lateral resolutions of the three label-free LSMs possess the same magnitude, while the axial resolution of SLSPM is extremely high which is below one nanometer.
Although label-free LSMs prevent the photodamage and photobleaching induced by high intensity laser and fluorescent molecule, photodamage and photobleaching are also key issues that should be considered. In fluorescent confocal laser scanning microscopy (FCLSM), single-photon absorption and heating are the dominant sources of photo-induced damage, which carries the risk of linear damage [116]. The power density of 3.0 × 10⁸ W/cm2 induced the photodamage to zebrafish craniofacial bone by using FCLSM [117]. For label-free LSMs, namely CARSM, SRSM and SHGM, the nonlinear effects require illumination with high power, which might also lead to photodamage and photobleaching. Some strategies have been employed to minimizing the photodamage and photobleaching in the nonlinear label-free LSMs. For CARSM, they are negligible by using excitation light with long wavelength, proper power and repetition rate [118,119,120]. In SRSM, nonlinear absorption is avoided for reducing the risk of photodamage and photobleaching because of background-free and long wavelength for excitation [118,121]. Furthermore, as involving only virtual state without energy deposition, SHGM brings little photodamage or photobleaching by increasing the repetition rate that keeps the peak intensity below damage threshold [122,123]. The laser powers and repetition rates of label-free LSMs are indicated in Table 1.
However, there are still some limitations for current label-free laser scanning microscopies. CARSM is relatively easy to implement but with non-resonance background from a four-wave mixing process inside sample. This impedes accessibility of CARSM to higher resolution and sensitivity in biological imaging. Compared to CARSM, SRSM is background-free imaging, but the extraction of SRS signal requires complex lock-in detection for modulation and demodulation. SHGM is suitable for samples without inversion symmetry, such as collagen and myosin, which limits its scope of application. SLSPM is limited to image samples within evanescent penetration depth of SPPs and have a slow imaging speed due to scanning mode and sophisticated data process.
From the above discussion, no single imaging technology can present a global understanding to the complex biological structure and process. Therefore, multi-technique combination is a trend for imaging and information analysis to complicated samples [124,125,126]. New imaging schemes will make these label-free laser scanning microscopies to be more powerful biological imaging tool when combine with spectroscopy, laser and detection technology. Higher resolution, sensitivity and faster imaging speed are still the most important pursuits of microscopy for more detailed and accurate morphology and dynamic process. With the increase of imaging speed and broadband, more effective and automated data method is required to process statistics and extremely large amounts of raw data, and will benefit tremendously from growth of artificial intelligence; fast and automated data processing will become easier to implement. There is a reasonable prospect that advanced label-free laser scanning microscopy will occupy a more dominant position in biological and biomedical imaging.

Author Contributions

Conceptualization, X.W., X.L.; writing—original draft preparation, X.W., X.L.; writing—review and editing, X.W., X.L., C.H.; supervision, C.H. All authors have read and agreed to the published version of the manuscript.

Funding

This research was funded by National Key Research and Development Program of China, grant numbers 2018YFC2001100 and 2017YFF0107002; Beijing Natural Science Foundation, grant numbers 4192063 and 4182073; Scientific Research Equipment Project of Chinese Academy of Sciences, grant numbers YJKYYQ20190056.

Institutional Review Board Statement

Not applicable.

Informed Consent Statement

Not applicable.

Data Availability Statement

Data sharing not applicable.

Conflicts of Interest

The authors declare no conflict of interest.

References

  1. Minsky, M. Memoir on Inventing the Confocal Scanning Microscope. Scanning 1988, 10, 128–138. [Google Scholar] [CrossRef]
  2. Hell, S.W.; Wichmann, J. Breaking the Diffraction Resolution Limit by Stimulated-Emission—Stimulated-Emission-Depletion Fluorescence Microscopy. Opt. Lett. 1994, 19, 780–782. [Google Scholar] [CrossRef] [PubMed]
  3. Vicidomini, G.; Bianchini, P.; Diaspro, A. STED super-resolved microscopy. Nat. Methods 2018, 15, 173–182. [Google Scholar] [CrossRef] [PubMed]
  4. Gottfert, F.; Wurm, C.A.; Mueller, V.; Berning, S.; Cordes, V.C.; Honigmann, A.; Hell, S.W. Coaligned dual-channel STED nanoscopy and molecular diffusion analysis at 20 nm resolution. Biophys. J. 2013, 105, L01–L03. [Google Scholar] [CrossRef] [PubMed] [Green Version]
  5. Hofmann, M.; Eggeling, C.; Jakobs, S.; Hell, S.W. Breaking the diffraction barrier in fluorescence microscopy at low light intensities by using reversibly photoswitchable proteins. Proc. Natl. Acad. Sci. USA 2005, 102, 17565–17569. [Google Scholar] [CrossRef] [Green Version]
  6. Keller, J.; Schonle, A.; Hell, S.W. Efficient fluorescence inhibition patterns for RESOLFT microscopy. Opt. Express 2007, 15, 3361–3371. [Google Scholar] [CrossRef] [Green Version]
  7. Frawley, A.T.; Wycisk, V.; Xiong, Y.; Galiani, S.; Sezgin, E.; Urbančič, I.; Jentzsch, A.V.; Leslie, K.G.; Eggeling, C.; Anderson, H.L. Super-resolution RESOLFT microscopy of lipid bilayers using a fluorophore-switch dyad. Chem. Sci. 2020, 11, 8955–8960. [Google Scholar] [CrossRef]
  8. Yamanaka, M.; Yonemaru, Y.; Kawano, S.; Uegaki, K.; Smith, N.I.; Kawata, S.; Fujita, K. Saturated excitation microscopy for sub-diffraction-limited imaging of cell clusters. J. Biomed. Opt. 2013, 18, 126002. [Google Scholar] [CrossRef]
  9. Nawa, Y.; Yonemaru, Y.; Kasai, A.; Oketani, R.; Hashimoto, H.; Smith, N.I.; Fujita, K. Saturated excitation microscopy using differential excitation for efficient detection of nonlinear fluorescence signals. APL Photonics 2018, 3, 080805. [Google Scholar] [CrossRef] [Green Version]
  10. Terhune, R.W.; Maker, P.D.; Savage, C.M. Measurements of Nonlinear Light Scattering. Phys. Rev. Lett. 1965, 14, 681–684. [Google Scholar] [CrossRef]
  11. Duncan, M.D.; Reintjes, J.; Manuccia, T.J. Scanning coherent anti-Stokes Raman microscope. Opt. Lett. 1982, 7, 350–352. [Google Scholar] [CrossRef]
  12. Potcoava, M.C.; Futia, G.L.; Aughenbaugh, J.; Schlaepfer, I.R.; Gibson, E.A. Raman and coherent anti-Stokes Raman scattering microscopy studies of changes in lipid content and composition in hormone-treated breast and prostate cancer cells. J. Biomed. Opt. 2014, 19, 111605. [Google Scholar] [CrossRef] [PubMed]
  13. Li, R.; Wang, X.X.; Zhou, Y.; Zong, H.; Chen, M.D.; Sun, M.T. Advances in nonlinear optical microscopy for biophotonics. J. Nanophotonics 2018, 12, 033007. [Google Scholar] [CrossRef]
  14. Cheng, J.X.; Jia, Y.K.; Zheng, G.; Xie, X.S. Laser-scanning coherent anti-Stokes Raman scattering microscopy and applications to cell biology. Biophys. J. 2002, 83, 502–509. [Google Scholar] [CrossRef] [Green Version]
  15. Evans, C.L.; Potma, E.O.; Puoris’haag, M.; Cote, D.; Lin, C.P.; Xie, X.S. Chemical imaging of tissue in vivo with video-rate coherent anti-Stokes Raman scattering microscopy. Proc. Natl. Acad. Sci. USA 2005, 102, 16807–16812. [Google Scholar] [CrossRef] [Green Version]
  16. Kinegawa, R.; Hiramatsu, K.; Hashimoto, K.; Badarla, V.R.; Ideguchi, T.; Goda, K. High-speed broadband Fourier-transform coherent anti-stokes Raman scattering spectral microscopy. J. Raman Spectrosc. 2019, 50, 1141–1146. [Google Scholar] [CrossRef]
  17. Yamato, N.; Niioka, H.; Miyake, J.; Hashimoto, M. Improvement of nerve imaging speed with coherent anti-Stokes Raman scattering rigid endoscope using deep-learning noise reduction. Sci. Rep. 2020, 10, 15212. [Google Scholar] [CrossRef]
  18. Cheng, J.X.; Volkmer, A.; Book, L.D.; Xie, X.S. Multiplex coherent anti-stokes Raman scattering microspectroscopy and study of lipid vesicles. J. Phys. Chem. B 2002, 106, 8493–8498. [Google Scholar] [CrossRef]
  19. Müller, M.; Schins, J.M. Imaging the Thermodynamic State of Lipid Membranes with Multiplex CARS Microscopy. J. Phys. Chem. B 2002, 106, 3715–3723. [Google Scholar] [CrossRef]
  20. Petrov, G.I.; Arora, R.; Yakovlev, V.V.; Wang, X.; Sokolov, A.V.; Scully, M.O. Comparison of coherent and spontaneous Raman microspectroscopies for noninvasive detection of single bacterial endospores. Proc. Natl. Acad. Sci. USA 2007, 104, 7776–7779. [Google Scholar] [CrossRef] [Green Version]
  21. Kano, H.; Hamaguchi, H.-O. Dispersion-compensated supercontinuum generation for ultrabroadband multiplex coherent anti-Stokes Raman scattering spectroscopy. J. Raman Spectrosc. 2006, 37, 411–415. [Google Scholar] [CrossRef]
  22. Lee, Y.J.; Liu, Y.; Cicerone, M.T. Characterization of three-color CARS in a two-pulse broadband CARS spectrum. Opt. Lett. 2007, 32, 3370–3372. [Google Scholar] [CrossRef] [PubMed]
  23. Cheng, J.X.; Book, L.D.; Xie, X.S. Polarization coherent anti-Stokes Raman scattering microscopy. Opt. Lett. 2001, 26, 1341–1343. [Google Scholar] [CrossRef] [PubMed]
  24. Oron, D.; Dudovich, N.; Silberberg, Y. Femtosecond phase-and-polarization control for background-free coherent anti-Stokes Raman spectroscopy. Phys. Rev. Lett. 2003, 90, 213902. [Google Scholar] [CrossRef] [PubMed]
  25. Pestov, D.; Murawski, R.K.; Ariunbold, G.O.; Wang, X.; Zhi, M.; Sokolov, A.V.; Sautenkov, V.A.; Rostovtsev, Y.V.; Dogariu, A.; Huang, Y. Optimizing the laser-pulse configuration for coherent Raman spectroscopy. Science 2007, 316, 265–268. [Google Scholar] [CrossRef] [PubMed]
  26. Camp, C.H., Jr.; Lee, Y.J.; Heddleston, J.M.; Hartshorn, C.M.; Hight Walker, A.R.; Rich, J.N.; Lathia, J.D.; Cicerone, M.T. High-Speed Coherent Raman Fingerprint Imaging of Biological Tissues. Nat. Photonics 2014, 8, 627–634. [Google Scholar] [CrossRef] [PubMed] [Green Version]
  27. Kim, H.; Bryant, G.W.; Stranick, S.J. Superresolution four-wave mixing microscopy. Opt. Express 2012, 20, 6042–6051. [Google Scholar] [CrossRef] [Green Version]
  28. Gong, L.; Lin, J.; Hao, C.; Zheng, W.; Wu, S.Q.Y.; Teng, J.; Qiu, C.W.; Huang, Z. Supercritical focusing coherent anti-Stokes Raman scattering microscopy for high-resolution vibrational imaging. Opt. Lett. 2018, 43, 5615–5618. [Google Scholar] [CrossRef]
  29. Wang, D.; Fu, W.; Lei, Y.; Cai, H.; Liu, J. A theoretical study of diffraction limit breaking via coherent control of the relative phase in coherent anti-Stokes Raman scattering microscopy. Opt. Express 2019, 27, 5005–5013. [Google Scholar] [CrossRef]
  30. Gong, L.; Zheng, W.; Ma, Y.; Huang, Z. Higher-order coherent anti-Stokes Raman scattering microscopy realizes label-free super-resolution vibrational imaging. Nat. Photonics 2019, 14, 115–122. [Google Scholar] [CrossRef]
  31. Dorosz, A.; Grosicki, M.; Dybas, J.; Matuszyk, E.; Rodewald, M.; Meyer, T.; Popp, J.; Malek, K.; Baranska, M. Eosinophils and Neutrophils-Molecular Differences Revealed by Spontaneous Raman, CARS and Fluorescence Microscopy. Cells 2020, 9, 2041. [Google Scholar] [CrossRef] [PubMed]
  32. Nuriya, M.; Yoneyama, H.; Takahashi, K.; Leproux, P.; Couderc, V.; Yasui, M.; Kano, H. Characterization of Intra/Extracellular Water States Probed by Ultrabroadband Multiplex Coherent Anti-Stokes Raman Scattering (CARS) Spectroscopic Imaging. J. Phys. Chem. A 2019, 123, 3928–3934. [Google Scholar] [CrossRef] [PubMed]
  33. Dufresne, E.R.; Corwin, E.I.; Greenblatt, N.A.; Ashmore, J.; Wang, D.Y.; Dinsmore, A.D.; Cheng, J.X.; Xie, X.S.; Hutchinson, J.W.; Weitz, D.A. Flow and fracture in drying nanoparticle suspensions. Phys. Rev. Lett. 2003, 91, 224501. [Google Scholar] [CrossRef] [PubMed] [Green Version]
  34. Nan, X.; Yang, W.Y.; Xie, X.S. CARS Microscopy Lights up Lipids in Living Cells. Biophotonics Int. 2004, 11, 44–47. [Google Scholar]
  35. Potma, E.O.; Xie, X.S. Direct visualization of lipid phase segregation in single lipid bilayers with coherent anti-Stokes Raman scattering microscopy. Chemphyschem 2005, 6, 77–79. [Google Scholar] [CrossRef] [PubMed]
  36. Jurna, M.; Korterik, J.P.; Otto, C.; Offerhaus, H.L. Shot noise limited heterodyne detection of CARS signals. Opt. Express 2007, 15, 15207–15213. [Google Scholar] [CrossRef] [PubMed]
  37. Nishiyama, H.; Takamuku, S.; Iiyama, A.; Inukai, J. Dynamic Distribution of Chemical States of Water Inside a Nafion Membrane in a Running Fuel Cell Monitored by Operando Time-Resolved CARS Spectroscopy. J. Phys. Chem. C 2020, 124, 19508–19513. [Google Scholar] [CrossRef]
  38. Roy, S.; Gord, J.R.; Patnaik, A.K. Recent advances in coherent anti-Stokes Raman scattering spectroscopy: Fundamental developments and applications in reacting flows. Prog. Energy Combust. Sci. 2010, 36, 280–306. [Google Scholar] [CrossRef]
  39. Koivistoinen, J.; Myllyperkio, P.; Pettersson, M. Time-Resolved Coherent Anti-Stokes Raman Scattering of Graphene: Dephasing Dynamics of Optical Phonon. J. Phys. Chem. Lett. 2017, 8, 4108–4112. [Google Scholar] [CrossRef]
  40. Ling, J.; Miao, X.; Sun, Y.; Feng, Y.; Zhang, L.; Sun, Z.; Ji, M. Vibrational Imaging and Quantification of Two-Dimensional Hexagonal Boron Nitride with Stimulated Raman Scattering. ACS Nano 2019, 13, 14033–14040. [Google Scholar] [CrossRef]
  41. Li, R.; Wang, L.; Mu, X.; Chen, M.; Sun, M. Nonlinear optical characterization of porous carbon materials by CARS, SHG and TPEF. Spectrochim. Acta A 2019, 214, 58–66. [Google Scholar] [CrossRef] [PubMed]
  42. Virga, A.; Ferrante, C.; Batignani, G.; De Fazio, D.; Nunn, A.D.G.; Ferrari, A.C.; Cerullo, G.; Scopigno, T. Coherent anti-Stokes Raman spectroscopy of single and multi-layer graphene. Nat. Commun. 2019, 10, 3658. [Google Scholar] [CrossRef] [PubMed] [Green Version]
  43. Freudiger, C.W.; Min, W.; Saar, B.G.; Lu, S.; Holtom, G.R.; He, C.; Tsai, J.C.; Kang, J.X.; Xie, X.S. Label-free biomedical imaging with high sensitivity by stimulated Raman scattering microscopy. Science 2008, 322, 1857–1861. [Google Scholar] [CrossRef] [Green Version]
  44. Eckhardt, G.; Hellwarth, R.W.; McClung, F.J.; Schwarz, S.E.; Weiner, D.; Woodbury, E.J. Stimulated Raman Scattering from Organic Liquids. Phys. Rev. Lett. 1962, 9, 455–457. [Google Scholar] [CrossRef]
  45. Hellwarth, R.W. Theory of Stimulated Raman Scattering. Phys. Rev. 1963, 130, 1850–1852. [Google Scholar] [CrossRef]
  46. Ploetz, E.; Laimgruber, S.; Berner, S.; Zinth, W.; Gilch, P. Femtosecond stimulated Raman microscopy. Appl. Phys. B 2007, 87, 389–393. [Google Scholar] [CrossRef]
  47. Liao, C.-S.; Huang, K.-C.; Hong, W.; Chen, A.J.; Karanja, C.; Wang, P.; Eakins, G.; Cheng, J.-X. Stimulated Raman spectroscopic imaging by microsecond delay-line tuning. Optica 2016, 3, 1377–1380. [Google Scholar] [CrossRef]
  48. Silva, W.R.; Graefe, C.T.; Frontiera, R.R. Toward Label-Free Super-Resolution Microscopy. ACS Photonics 2015, 3, 79–86. [Google Scholar] [CrossRef]
  49. Bi, Y.; Yang, C.; Chen, Y.; Yan, S.; Yang, G.; Wu, Y.; Zhang, G.; Wang, P. Near-resonance enhanced label-free stimulated Raman scattering microscopy with spatial resolution near 130 nm. Light Sci. Appl. 2018, 7, 81. [Google Scholar] [CrossRef]
  50. Gong, L.; Zheng, W.; Ma, Y.; Huang, Z. Saturated Stimulated-Raman-Scattering Microscopy for Far-Field Superresolution Vibrational Imaging. Phys. Rev. Appl. 2019, 11, 034041. [Google Scholar] [CrossRef]
  51. Chen, X.; Zhang, C.; Lin, P.; Huang, K.C.; Liang, J.; Tian, J.; Cheng, J.X. Volumetric chemical imaging by stimulated Raman projection microscopy and tomography. Nat. Commun. 2017, 8, 15117. [Google Scholar] [CrossRef] [PubMed] [Green Version]
  52. Wei, M.; Shi, L.; Shen, Y.; Zhao, Z.; Guzman, A.; Kaufman, L.J.; Wei, L.; Min, W. Volumetric chemical imaging by clearing-enhanced stimulated Raman scattering microscopy. Proc. Natl. Acad. Sci. USA 2019, 116, 6608–6617. [Google Scholar] [CrossRef] [PubMed] [Green Version]
  53. Hu, F.; Shi, L.; Min, W. Biological imaging of chemical bonds by stimulated Raman scattering microscopy. Nat. Methods 2019, 16, 830–842. [Google Scholar] [CrossRef]
  54. Bae, K.; Zheng, W.; Huang, Z. Spatial light-modulated stimulated Raman scattering (SLM-SRS) microscopy for rapid multiplexed vibrational imaging. Theranostics 2019, 10, 312–322. [Google Scholar] [CrossRef]
  55. Freudiger, C.W.; Pfannl, R.; Orringer, D.A.; Saar, B.G.; Ji, M.; Zeng, Q.; Ottoboni, L.; Wei, Y.; Waeber, C.; Sims, J.R.; et al. Multicolored stain-free histopathology with coherent Raman imaging. Lab. Investig. 2012, 92, 1492–1502. [Google Scholar] [CrossRef] [PubMed]
  56. Yue, S.; Li, J.; Lee, S.Y.; Lee, H.J.; Shao, T.; Song, B.; Cheng, L.; Masterson, T.A.; Liu, X.; Ratliff, T.L.; et al. Cholesteryl ester accumulation induced by PTEN loss and PI3K/AKT activation underlies human prostate cancer aggressiveness. Cell Metab. 2014, 19, 393–406. [Google Scholar] [CrossRef] [Green Version]
  57. Lu, F.K.; Basu, S.; Igras, V.; Hoang, M.P.; Ji, M.; Fu, D.; Holtom, G.R.; Neel, V.A.; Freudiger, C.W.; Fisher, D.E.; et al. Label-free DNA imaging in vivo with stimulated Raman scattering microscopy. Proc. Natl. Acad. Sci. USA 2015, 112, E5902. [Google Scholar] [CrossRef] [Green Version]
  58. Ji, M.; Orringer, D.A.; Freudiger, C.W.; Ramkissoon, S.; Liu, X.; Lau, D.; Golby, A.J.; Norton, I.; Hayashi, M.; Agar, N.Y.; et al. Rapid, label-free detection of brain tumors with stimulated Raman scattering microscopy. Sci. Transl. Med. 2013, 5, 201ra119. [Google Scholar] [CrossRef] [Green Version]
  59. Ji, M.; Arbel, M.; Zhang, L.; Freudiger, C.W.; Hou, S.S.; Lin, D.; Yang, X.; Bacskai, B.J.; Xie, X.S. Label-free imaging of amyloid plaques in Alzheimer’s disease with stimulated Raman scattering microscopy. Sci. Adv. 2018, 4, eaat7715. [Google Scholar] [CrossRef] [Green Version]
  60. Saar, B.G.; Zeng, Y.; Freudiger, C.W.; Liu, Y.S.; Himmel, M.E.; Xie, X.S.; Ding, S.Y. Label-free, real-time monitoring of biomass processing with stimulated Raman scattering microscopy. Angew. Chem. Int. Ed. Engl. 2010, 49, 5476–5479. [Google Scholar] [CrossRef]
  61. Ding, S.Y.; Liu, Y.S.; Zeng, Y.; Himmel, M.E.; Baker, J.O.; Bayer, E.A. How does plant cell wall nanoscale architecture correlate with enzymatic digestibility? Science 2012, 338, 1055–1060. [Google Scholar] [CrossRef] [PubMed]
  62. Ozeki, Y.; Dake, F.; Kajiyama, S.; Fukui, K.; Itoh, K. Analysis and experimental assessment of the sensitivity of stimulated Raman scattering microscopy. Opt. Express 2009, 17, 3651–3658. [Google Scholar] [CrossRef] [PubMed]
  63. Ozeki, Y.; Umemura, W.; Otsuka, Y.; Satoh, S.; Hashimoto, H.; Sumimura, K.; Nishizawa, N.; Fukui, K.; Itoh, K. High-speed molecular spectral imaging of tissue with stimulated Raman scattering. Nat. Photonics 2012, 6, 845–851. [Google Scholar] [CrossRef]
  64. Nandakumar, P.; Kovalev, A.; Volkmer, A. Vibrational imaging based on stimulated Raman scattering microscopy. New J. Phys. 2009, 11, 033026. [Google Scholar] [CrossRef]
  65. Saar, B.G.; Freudiger, C.W.; Reichman, J.; Stanley, C.M.; Holtom, G.R.; Xie, X.S. Video-rate molecular imaging in vivo with stimulated Raman scattering. Science 2010, 330, 1368–1370. [Google Scholar] [CrossRef] [Green Version]
  66. Pantazis, P.; Maloney, J.; Wu, D.; Fraser, S.E. Second harmonic generating (SHG) nanoprobes for in vivo imaging. Proc. Natl. Acad. Sci. USA 2010, 107, 14535–14540. [Google Scholar] [CrossRef] [Green Version]
  67. Franken, P.A.; Hill, A.E.; Peters, C.W.; Weinreich, G. Generation of Optical Harmonics. Phys. Rev. Lett. 1961, 7, 118–119. [Google Scholar] [CrossRef] [Green Version]
  68. Hellwarth, R.; Christensen, P. Nonlinear optical microscopic examination of structure in polycrystalline ZnSe. Opt. Commun. 1974, 12, 318–322. [Google Scholar] [CrossRef]
  69. Sivaguru, M.; Durgam, S.; Ambekar, R.; Luedtke, D.; Fried, G.; Stewart, A.; Toussaint, K.C., Jr. Quantitative analysis of collagen fiber organization in injured tendons using Fourier transform-second harmonic generation imaging. Opt. Express 2010, 18, 24983–24993. [Google Scholar] [CrossRef]
  70. Freund, I.; Deutsch, M. Second-harmonic microscopy of biological tissue. Opt. Lett. 1986, 11, 94. [Google Scholar] [CrossRef]
  71. Bouevitch, O.; Lewis, A.; Pinevsky, I.; Wuskell, J.P.; Loew, L.M. Probing membrane potential with nonlinear optics. Biophys. J. 1993, 65, 672–679. [Google Scholar] [CrossRef] [Green Version]
  72. Campagnola, P.J.; Wei, M.-D.; Lewis, A.; Loew, L.M. High-Resolution Nonlinear Optical Imaging of Live Cells by Second Harmonic Generation. Biophys. J. 1999, 77, 3341–3349. [Google Scholar] [CrossRef] [Green Version]
  73. Bianchini, P.; Diaspro, A. Three-dimensional (3D) backward and forward second harmonic generation (SHG) microscopy of biological tissues. J. Biophoton. 2008, 1, 443–450. [Google Scholar] [CrossRef] [PubMed]
  74. Yeh, C.H.; Tan, C.Z.; Cheng, C.A.; Hung, J.T.; Chen, S.Y. Improving resolution of second harmonic generation microscopy via scanning structured illumination. Biomed. Opt. Express 2018, 9, 6081–6090. [Google Scholar] [CrossRef]
  75. Hashimoto, M.; Niioka, H.; Ashida, K.; Yoshiki, K.; Araki, T. High-sensitivity and high-spatial-resolution imaging of self-assembled monolayer on platinum using radially polarized beam excited second-harmonic-generation microscopy. Appl. Phys. Express 2015, 8, 112401. [Google Scholar] [CrossRef]
  76. Bautista, G.; Huttunen, M.J.; Makitalo, J.; Kontio, J.M.; Simonen, J.; Kauranen, M. Second-harmonic generation imaging of metal nano-objects with cylindrical vector beams. Nano Lett. 2012, 12, 3207–3212. [Google Scholar] [CrossRef] [PubMed]
  77. Wang, W.; Wu, B.; Liu, P.; Liu, J.; Tan, J. Calculations of second harmonic generation with radially polarized excitations by elliptical mirror focusing. J. Microsc. 2019, 273, 36–45. [Google Scholar] [CrossRef] [PubMed] [Green Version]
  78. Tian, N.; Fu, L.; Gu, M. Resolution and contrast enhancement of subtractive second harmonic generation microscopy with a circularly polarized vortex beam. Sci. Rep. 2015, 5, 13580. [Google Scholar] [CrossRef] [PubMed] [Green Version]
  79. Sheppard, C.J.R.; Castello, M.; Tortarolo, G.; Deguchi, T.; Koho, S.V.; Vicidomini, G.; Diaspro, A. Pixel reassignment in image scanning microscopy: A re-evaluation. J. Opt. Soc. Am. A 2020, 37, 154–162. [Google Scholar] [CrossRef]
  80. Wang, W.; Wu, B.; Zhang, B.; Zhang, Z.; Li, X.; Zheng, S.; Fan, Z.; Tan, J. Second harmonic generation microscopy using pixel reassignment. J. Microsc. 2021, 281, 97–105. [Google Scholar] [CrossRef]
  81. Chen, X.; Nadiarynkh, O.; Plotnikov, S.; Campagnola, P.J. Second harmonic generation microscopy for quantitative analysis of collagen fibrillar structure. Nat. Protoc. 2012, 7, 654–669. [Google Scholar] [CrossRef] [PubMed]
  82. Keikhosravi, A.; Bredfeldt, J.S.; Sagar, A.K.; Eliceiri, K.W. Second-harmonic generation imaging of cancer. Methods Cell Biol. 2014, 123, 531–546. [Google Scholar]
  83. Ducourthial, G.; Affagard, J.S.; Schmeltz, M.; Solinas, X.; Lopez-Poncelas, M.; Bonod-Bidaud, C.; Rubio-Amador, R.; Ruggiero, F.; Allain, J.M.; Beaurepaire, E.; et al. Monitoring dynamic collagen reorganization during skin stretching with fast polarization-resolved second harmonic generation imaging. J. Biophotonics 2019, 12, e201800336. [Google Scholar] [CrossRef] [Green Version]
  84. Nadiarnykh, O.; LaComb, R.B.; Brewer, M.A.; Campagnola, P.J. Alterations of the extracellular matrix in ovarian cancer studied by Second Harmonic Generation imaging microscopy. BMC Cancer 2010, 10, 94. [Google Scholar] [CrossRef] [PubMed] [Green Version]
  85. Wu, S.; Huang, Y.; Tang, Q.; Li, Z.; Horng, H.; Li, J.; Wu, Z.; Chen, Y.; Li, H. Quantitative evaluation of redox ratio and collagen characteristics during breast cancer chemotherapy using two-photon intrinsic imaging. Biomed. Opt. Express 2018, 9, 1375–1388. [Google Scholar] [CrossRef] [Green Version]
  86. Tsafas, V.; Gavgiotaki, E.; Tzardi, M.; Tsafa, E.; Fotakis, C.; Athanassakis, I.; Filippidis, G. Polarization-dependent second-harmonic generation for collagen-based differentiation of breast cancer samples. J. Biophotonics 2020, 13, e202000180. [Google Scholar] [CrossRef] [PubMed]
  87. Tokarz, D.; Cisek, R.; Joseph, A.; Golaraei, A.; Mirsanaye, K.; Krouglov, S.; Asa, S.L.; Wilson, B.C.; Barzda, V. Characterization of Pancreatic Cancer Tissue Using Multiphoton Excitation Fluorescence and Polarization-Sensitive Harmonic Generation Microscopy. Front. Oncol. 2019, 9, 272. [Google Scholar] [CrossRef]
  88. Olivier, N.; Luengo-Oroz, M.A.; Duloquin, L.; Faure, E.; Savy, T.; Veilleux, I.; Solinas, X.; Debarre, D.; Bourgine, P.; Santos, A.; et al. Cell Lineage Reconstruction of Early Zebrafish Embryos Using Label-Free Nonlinear Microscopy. Science 2010, 329, 967–971. [Google Scholar] [CrossRef] [PubMed] [Green Version]
  89. Zeitoune, A.A.; Luna, J.S.; Salas, K.S.; Erbes, L.; Cesar, C.L.; Andrade, L.A.; Carvahlo, H.F.; Bottcher-Luiz, F.; Casco, V.H.; Adur, J. Epithelial Ovarian Cancer Diagnosis of Second-Harmonic Generation Images: A Semiautomatic Collagen Fibers Quantification Protocol. Cancer Inform. 2017, 16, 1176935117690162. [Google Scholar] [CrossRef] [Green Version]
  90. Wang, G.; Sun, Y.; Chen, Y.; Gao, Q.; Peng, D.; Lin, H.; Zhan, Z.; Liu, Z.; Zhuo, S. Rapid identification of human ovarian cancer in second harmonic generation images using radiomics feature analyses and tree-based pipeline optimization tool. J. Biophotonics 2020, 13, e202000050. [Google Scholar] [CrossRef]
  91. Wen, B.; Campbell, K.R.; Tilbury, K.; Nadiarnykh, O.; Brewer, M.A.; Patankar, M.; Singh, V.; Eliceiri, K.W.; Campagnola, P.J. 3D texture analysis for classification of second harmonic generation images of human ovarian cancer. Sci. Rep. 2016, 6, 35734. [Google Scholar] [CrossRef] [PubMed] [Green Version]
  92. Nylander, C.; Liedberg, B.; Lind, T. Gas detection by means of surface plasmon resonance. Sens. Actuator 1982, 3, 79–88. [Google Scholar] [CrossRef]
  93. Liedberg, B.; Nylander, C.; Lunström, I. Surface plasmon resonance for gas detection and biosensing. Sens. Actuator 1983, 4, 299–304. [Google Scholar] [CrossRef]
  94. Liedberg, B.; Nylander, C.; Lundström, I. Biosensing with surface plasmon resonance—How it all started. Biosens. Bioelectron. 1995, 10, i–ix. [Google Scholar] [CrossRef]
  95. Watanabe, K.; Matsuura, K.; Kawata, F.; Nagata, K.; Ning, J.; Kano, H. Scanning and non-scanning surface plasmon microscopy to observe cell adhesion sites. Biomed. Opt. Express 2012, 3, 354–359. [Google Scholar] [CrossRef] [Green Version]
  96. Kano, H.; Knoll, W. A scanning microscope employing localized surface-plasmon-polaritons as a sensing probe. Opt. Commun. 2000, 182, 11–15. [Google Scholar] [CrossRef]
  97. Homola, J.; Yee, S.S.; Gauglitz, G. Surface plasmon resonance sensors: Review. Sens. Actuators B Chem. 1999, 54, 3–15. [Google Scholar] [CrossRef]
  98. Yeatman, E.M. Resolution and sensitivity in surface plasmon microscopy and sensing. Biosens. Bioelectron. 1996, 11, 635–649. [Google Scholar] [CrossRef]
  99. Kano, H.; Mizuguchi, S.; Kawata, S. Excitation of surface-plasmon polaritons by a focused laser beam. J. Opt. Soc. Am. B 1998, 15, 1381–1386. [Google Scholar] [CrossRef]
  100. Kano, H.; Knoll, W. Locally excited surface-plasmon-polaritons for thickness measurement of LBK films. Opt. Commun. 1998, 153, 235–239. [Google Scholar] [CrossRef]
  101. Watanabe, K.; Horiguchi, N.; Kano, H. Optimized measurement probe of the localized surface plasmon microscope by using radially polarized illumination. Appl. Opt. 2007, 46, 4985–4990. [Google Scholar] [CrossRef] [PubMed]
  102. Kreysing, E.; Seyock, S.; Hassani, H.; Brauweiler-Reuters, E.; Neumann, E.; Offenhäusser, A. Correlating Surface Plasmon Resonance Microscopy of Living and Fixated Cells with Electron Microscopy Allows for Investigation of Potential Preparation Artifacts. Adv. Mater. Interfaces 2020, 7, 1901991. [Google Scholar] [CrossRef] [Green Version]
  103. Kreysing, E.; Hassani, H.; Hampe, N.; Offenhausser, A. Nanometer-Resolved Mapping of Cell-Substrate Distances of Contracting Cardiomyocytes Using Surface Plasmon Resonance Microscopy. ACS Nano 2018, 12, 8934–8942. [Google Scholar] [CrossRef] [PubMed]
  104. Hassani, H.; Kreysing, E. Noninvasive measurement of the refractive index of cell organelles using surface plasmon resonance microscopy. Opt. Lett. 2019, 44, 1359–1362. [Google Scholar] [CrossRef] [PubMed]
  105. Wei, S.C.; Yang, P.T.; Wu, T.H.; Lu, Y.L.; Gu, F.; Sung, K.B.; Lin, C.W. Characteristic investigation of scanning surface plasmon microscopy for nucleotide functionalized nanoarray. Opt. Express 2015, 23, 20104–20114. [Google Scholar] [CrossRef] [PubMed]
  106. Berguiga, L.; Orobtchouk, R.; Elezgaray, J.; Arneodo, A.; Argoul, F. High-resolution-scanning waveguide microscopy: Spatial refractive index and topography quantification. Opt. Lett. 2017, 42, 2523–2526. [Google Scholar] [CrossRef] [Green Version]
  107. Somekh, M.G.; Liu, S.G.; Velinov, T.S.; See, C.W. Optical V(z) for high-resolution 2pi surface plasmon microscopy. Opt. Lett. 2000, 25, 823–825. [Google Scholar] [CrossRef]
  108. Zhang, B.; Pechprasarn, S.; Zhang, J.; Somekh, M.G. Confocal surface plasmon microscopy with pupil function engineering. Opt. Express 2012, 20, 7388–7397. [Google Scholar] [CrossRef] [Green Version]
  109. Watanabe, K.; Miyazaki, R.; Terakado, G.; Okazaki, T.; Morigaki, K.; Kano, H. High resolution imaging of patterned model biological membranes by localized surface plasmon microscopy. Appl. Opt. 2010, 49, 887–891. [Google Scholar] [CrossRef]
  110. Giebel, K.; Bechinger, C.; Herminghaus, S.; Riedel, M.; Leiderer, P.; Weiland, U.; Bastmeyer, M. Imaging of cell/substrate contacts of living cells with surface plasmon resonance microscopy. Biophys. J. 1999, 76 Pt 1, 509–516. [Google Scholar] [CrossRef] [Green Version]
  111. Wang, W.; Yang, Y.; Wang, S.; Nagaraj, V.J.; Liu, Q.; Wu, J.; Tao, N. Label-free measuring and mapping of binding kinetics of membrane proteins in single living cells. Nat. Chem. 2012, 4, 846–853. [Google Scholar] [CrossRef] [PubMed]
  112. Liu, X.W.; Yang, Y.; Wang, W.; Wang, S.; Gao, M.; Wu, J.; Tao, N. Plasmonic-Based Electrochemical Impedance Imaging of Electrical Activities in Single Cells. Angew. Chem. Int. Ed. 2017, 56, 8855–8859. [Google Scholar] [CrossRef] [PubMed]
  113. Vo-Dinh, T.; Lakowicz, J.R.; Streppa, L.; Berguiga, L.; Boyer Provera, E.; Ratti, F.; Goillot, E.; Martinez Torres, C.; Schaeffer, L.; Elezgaray, J.; et al. Tracking in real time the crawling dynamics of adherent living cells with a high resolution surface plasmon microscope. Plasmon. Biol. Med. XIII 2016, 9724, 97240G. [Google Scholar]
  114. Berguiga, L.; Streppa, L.; Boyer-Provera, E.; Martinez-Torres, C.; Schaeffer, L.; Elezgaray, J.; Arneodo, A.; Argoul, F. Time-lapse scanning surface plasmon microscopy of living adherent cells with a radially polarized beam. Appl. Opt. 2016, 55, 1216–1227. [Google Scholar] [CrossRef] [PubMed] [Green Version]
  115. Toma, K.; Kano, H.; Offenhausser, A. Label-free measurement of cell-electrode cleft gap distance with high spatial resolution surface plasmon microscopy. ACS Nano 2014, 8, 12612–12619. [Google Scholar] [CrossRef] [PubMed]
  116. Icha, J.; Weber, M.; Waters, J.C.; Norden, C. Phototoxicity in live fluorescence microscopy, and how to avoid it. Bioessays 2017, 39, 1700003–1700015. [Google Scholar] [CrossRef] [Green Version]
  117. Combs, C.A. Comparing phototoxicity during the development of a zebrafish craniofacial bone using confocal and light sheet fluorescence microscopy techniques. J. Biophotonics 2013, 6, 920–927. [Google Scholar]
  118. Fu, Y.; Wang, H.; Shi, R.; Cheng, J.X. Characterization of photodamage in coherent anti-Stokes Raman scattering microscopy. Opt. Express 2006, 14, 3942–3951. [Google Scholar] [CrossRef]
  119. Tong, L.; Lu, Y.; Lee, R.J.; Cheng, J.X. Imaging receptor-mediated endocytosis with a polymeric nanoparticle-based coherent anti-stokes Raman scattering probe. J. Phys. Chem. B 2007, 111, 9980. [Google Scholar] [CrossRef]
  120. De Oliveira, M.A.; Smith, Z.J.; Knorr, F.; De Araujo, R.E.; Wachsmann-Hogiu, S. Long term Raman spectral study of power-dependent photodamage in red blood cells. Appl. Phys. Lett. 2014, 104, 1517. [Google Scholar] [CrossRef] [Green Version]
  121. Lombardini, A.; Berto, P.; Duboisset, J.; Andresen, E.R.; Heuke, S.; Büttner, E.; Rimke, I.; Vergnole, S.; Shinkar, V.; de Bettignies, P.; et al. Background-suppressed SRS fingerprint imaging with a fully integrated system using a single optical parametric oscillator. Opt. Express 2020, 28, 14490–14502. [Google Scholar] [CrossRef] [PubMed]
  122. Chu, S.W.; Liu, T.M.; Sun, C.K.; Lin, C.Y.; Tsai, H.J. Real-time second-harmonic-generation microscopy based on a 2-GHz repetition rate Ti:sapphire laser. Opt. Express 2003, 11, 933. [Google Scholar] [CrossRef] [PubMed] [Green Version]
  123. Chu, S.W.; Chen, I.H.; Liu, T.M.; Chen, P.C.; Sun, C.K.; Lin, B.L. Multimodal nonlinear spectral microscopy based on a femtosecond Cr: Forsterite laser. Opt. Lett. 2001, 26, 1909–1911. [Google Scholar] [CrossRef] [PubMed]
  124. Sarri, B.; Canonge, R.; Audier, X.; Simon, E.; Wojak, J.; Caillol, F.; Cador, C.; Marguet, D.; Poizat, F.; Giovannini, M.; et al. Fast stimulated Raman and second harmonic generation imaging for intraoperative gastro-intestinal cancer detection. Sci. Rep. 2019, 9, 10052. [Google Scholar] [CrossRef]
  125. Xiong, H.; Shi, L.; Wei, L.; Shen, Y.; Long, R.; Zhao, Z.; Min, W. Stimulated Raman Excited Fluorescence Spectroscopy and Imaging. Nat. Photonics 2019, 13, 412–417. [Google Scholar] [CrossRef]
  126. Adams, W.R.; Mehl, B.; Leiser, E.; Wang, M.; Mahadevan-Jansen, A. Multimodal Nonlinear Optical and Thermal Imaging Platform for Label-Free Characterization of Biological Tissue. bioRxiv 2020, 023820. [Google Scholar] [CrossRef] [Green Version]
Figure 1. (a) Principle of coherent anti-Stokes Raman scattering (CARS) shown by Jablonski diagram (energy level diagram) [12] (reprinted with permission from [12], Copyright 2014 SPIE). (b) Diagram of a collinear laser-scanning CARS microscopy [13] (reprinted with permission from [13], Copyright 2018 SPIE).
Applsci 11 01002 g001
Figure 2. (a) Energy diagram for Stimulated Raman Scattering (SRS). (b) Input and output spectra of SRS. SRS leads to an intensity increase with a gain Δ I s (stimulated Raman gain (SRG)) in the Stokes beam and an intensity decrease with a loss Δ I p (stimulated Raman loss (SRL)) in the pump beam. (c) Detection scheme of SRL. (d) Stimulated Raman Scattering Microscopy (SRSM) with both forward and epi detection. (e) Linear dependence of SRL on concentrations of retinol in ethanol at 1595 cm−1 [43] (reprinted with permission from [43], Copyright 2008 AAAS).
Applsci 11 01002 g002
Figure 3. (a) SRS images of regions in the same white matter region before and after tissue-clearing [52] (reprinted with permission from [52], Copyright 2019 PNAS). (b) In Vivo SRSM images of human glioblastoma multiforme xenografts [58] (reprinted with permission from [58], Copyright 2013 AAAS). (c) Individual SRS images of a 1-mm-thick fresh mouse brain section at (i) 1658 cm−1, (ii) 1670 cm−1, and (iii) 1680 cm−1 and (iv) the composite three-color image showing the distribution of lipid (green), normal protein (blue), and amyloid plaque (magenta) [59] (reprinted with permission from [59], Copyright 2019 AAAS). (d) SRSM of untreated cell walls [61] (reprinted with permission from [61], Copyright 2012 AAAS).
Applsci 11 01002 g003
Figure 4. (a) Energy-level diagram of SHG [66] (reprinted with permission from [66], Copyright 2010 PNAS). (b) Experimental setup of SHGM with both forward and backward collection geometries [69] (reprinted with permission from [69], © The Optical Society).
Applsci 11 01002 g004
Figure 5. (a) 3D Second Harmonic Generation (SHG) renderings (left panels) and hematoxylin and eosin (H&E) staining (center panels) of normal (top) and malignant ovarian biopsies (bottom). Averaged forward/backward SHG intensities as a function of depth for normal (blue circles) and malignant (red squares) ovaries (right panels) [84] (reprinted with permission from [84], Copyright 2010 Springer Nature). (b) SHG images and correcting autofluorescence (AF) images of the collagen in different tissues status (left panels). SHG images of (A) normal stroma, (B) invasive ductal carcinoma, (C) post-chemotherapy. AF images of (D) normal stroma, (E) invasive ductal carcinoma, (F) post-chemotherapy. The ratio of SHG/AF and the collagen density of the three status of breast tissues (right panels) [85] (reprinted with permission from [85], © The Optical Society).
Applsci 11 01002 g005
Figure 6. (a) Representative examples of FFT analysis for benign (grade 0), grade I, grade II and grade III breast tissues [86] (reprinted with permission from [86], Copyright 2020 Wiley-VCH). (b) PIPO (polarization-in, polarization-out) SHGM of collagen in (A1–A8) Periductal, (B1–B8) Lobular, (C1–C8), Parenchymal in pancreas tissues, and (D1–D8) Tumor with (A1, B1, C1, D1) Bright-field images, (A2, B2, C2, D2) SHG intensity images, (A3, B3, C3, D3) Color-coded maps of the fitted R values, (A4, B4, C4, D4) Occurrence histograms of the R values, (A5, B5, C5, D5) Color-coded maps of the fitted C values, (A6, B6, C6, D6) Occurrence histograms, (A7, B7, C7, D7) Degree of linear polarization values, and (A8, B8, C8, D8) Occurrence histograms [87] (reprinted with permission from [87], Copyright 2019 Frontiers Media SA).
Applsci 11 01002 g006
Figure 7. (a) The entire back focal plane (BFP) is illuminated with radially polarized light resulting in an illumination of the sample with a broad range of angles. (b) Illuminating the sample under surface plasmon polaritons (SPP) excitation angles induces the SPP evanescent field penetrating the cytosol. (c) The BFP imaging at each scanning point allows for the extraction of (d) reflectance curve [102] (reprinted with permission from [102], Copyright 2020 Wiley-VCH).
Applsci 11 01002 g007
Figure 8. (a) a, d, Correlation of scanning localized surface plasmon microscopy (SLSPM) and electron microscope (EM) for two individual cells. b, e, The cell substrate distances are evaluated along the cross-section with surface plasmon resonance microscopy (SPRM). c, f, Focused ion beam milling combined with scanning electron microscopy (FIB-SEM) for the same cells, [102] (reprinted with permission from [102], Copyright 2020 Wiley-VCH). (b) (i)–(vi) SLSPM images of living C2C12 cells at different times. The arrows have the following meaning: filopodia (F), lamellipodia (L), nucleus (N) and fronts (B) [114] (reprinted with permission from [114], © The Optical Society). (c) Nanometer-resolved mapping of cell-substrate distances of contracting Cardiomyocytes. Cell image under live-imaging mode and scanned area (white rectangular box) (left), cell−substrate distance and refractive index change over time (middle), morphology distribution under SLSPM [103] (reprinted with permission from [103], Copyright 2018 ACS Publications).
Applsci 11 01002 g008
Table 1. Comparison of three laser scanning microscopic technologies.
TypeWork
Principle
Work
Wavelength (nm)
Repetition RateLaser PowerLateral Resolution (nm)Axial ResolutionRef.
CRSCARSMsupercritical focusing CARS835 (pump)
1107 (Stokes)
76 MHz3 mW (pump)
10 mW (Stokes)
2953.32 μm[28]
coherent controlling of the relative phase785 (Stokes)
727.8 (pump)
--130-[29]
higher-order CARS1041 (Stokes)
680–1300 (pump)
80 MHz2.0 × 109–3.6 × 10¹² W/cm2 (pump)
1.8 × 10⁹–4.7 × 10¹² W/cm2 (Stokes)
196-[30]
SRSMnear-resonance enhancement45080 MHz4.2 mW (pump)
2.6 mW (Stokes) (brain tissue)
130-[49]
Saturated SRS--227 × 109 W/cm2 (pump)
214 × 109 W/cm2 (Stokes)
2553 μm[50]
SHGMstructured illumination106440 MHz30 mW235693 nm[74]
subtractive imaging80080 MHz-210-[78]
pixel reassignment840--300-[80]
SLSPMscanning localized SPP632.8--1862.3 nm[103]
scanning localized SPP632.8--1700.33 nm[109]
Publisher’s Note: MDPI stays neutral with regard to jurisdictional claims in published maps and institutional affiliations.