Article

A Macro–Micro Damage Model for Rock under Compression Loading

School of Civil Engineering, Wuhan University, Wuhan 430072, China
*
Author to whom correspondence should be addressed.
Appl. Sci. 2021, 11(24), 12154; https://doi.org/10.3390/app112412154
Submission received: 15 November 2021 / Revised: 7 December 2021 / Accepted: 14 December 2021 / Published: 20 December 2021
(This article belongs to the Section Civil Engineering)

Abstract

:
Rock damage caused by its microcrack growth has a great influence on the deformation and strength properties of rock under compressive loading. Considering the interaction of wing cracks and the additional stress caused by rock bridge damage, a new calculation model for the mode-I stress intensity factor at wing crack tip was proposed in this study. The proposed calculation model for the stress intensity factor can not only accurately predict the cracking angle of wing crack, but can also simulate the whole range of variation of wing crack length from being extremely short to very long. Based on the modified stress intensity factor, a macro–micro damage model for rock materials was also established by combining the relationship between microcrack growth and macroscopic strain. The proposed damage model was verified with the results from the conventional triaxial compression test of sandstone sample. The results show that the proposed damage model can not only continuously simulate the stress-strain curves under different confining pressures, but also can better predict the peak strength. Furthermore, the sensitivities of initial crack size, crack friction coefficient, fracture toughness, initial damage and parameter m on the stress-strain relationship are discussed. The results can provide a theoretical reference for understanding the effect of microcrack growth on the progressive failure of rock under the compressive loading.

1. Introduction

Rock materials are heterogeneous bodies that composed of a variety of mineral grains, cements, microcracks. The essential reason for rock failure is the initiation, propagation and coalescence of internal microcracks. When there is no confining pressure or the confining pressure is small, rock materials generally show axial splitting failure. The failure mode is brittle failure. With the increase of confining pressure, the failure mode of rock materials gradually changes from brittle failure to ductile failure. During this period, the initiation, propagation, interaction and coalescence of microcracks are generally considered to be the micro-mechanical mechanism that controls the macroscopic failure of rock materials. The wing crack models proposed by Horri and Nemat-Nasser [1,2] and Ashby and Hallam [3] can better describe the initiation and propagation process of cracks, and are gradually used to study the mechanical and deformation properties of rock materials. The above models assume that there is friction between compression-shear crack surfaces. The friction and normal pressure satisfy the Mohr–Coulomb theorem. When the shear stress caused by the far-field stress exceeds the friction, the crack surface will slide over each other, resulting in the initiation and propagation of open wing crack. Wing crack model is the basis for studying the initiation, propagation, interaction and coalescence of compression–shear crack in rock materials.
The mechanical behavior and constitutive relationship in the failure process of rock materials have been a hot issue in the field of rock mechanics. Many scholars have studied the stress–strain relationship of rock through experimental and theoretical methods, and analyzed the damage and deformation characteristics in different stages of rock compression failure process [4,5,6]. In recent decades, the theory of fracture mechanics has become one of the widely used method to study progressive failure of rock materials. By introducing the theory of fracture mechanics and damage mechanics, Zhu and Zhang [7] established an elastoplastic damage model, and successfully applied it to evaluate the stability of high slope. Chen et al. [8] and Li et al. [9] established a fracture damage coupled model to analyze the stability of surrounding rock, which provides a good reference for the practical engineering. Wu et al. [10] investigated the micromechanics of compressive failure in Darley Dale sandstone under the optical and scanning electron microscopes, and analyzed the damage evolution process by using wing crack model. Above studies provide guidance for establishing micromechanics-based damage model to study the mechanical behaviors of rock materials.
So far, many researchers have studied the deformation failure mechanism and mechanical properties of rock materials by using different wing crack models. Zhu et al. [11] investigated evolution process of microcracks at different stages by employing the internal variable thermodynamics theory and frictional kinking crack model, and established quantitative relationship between nonelastic strain (induced by microcracks) and stress. Based on the strain energy density factor approach and a micromechanics model, Zhou [12] established a micromechanics-based model to investigate the condition and direction of shear failure for brittle rock subjected to triaxial compressive loads. Although previous models have been shown to accurately estimate the stress–strain curve for rock, they usually divide the stress–strain curve into multiple stages to study its mechanical mechanism and constitutive relationship, respectively, and cannot realize the simple and unified description of the full curves of stress–strain. At the same time, it should be noted that they have complicated implicit equations and numerous parameters, which increases the consumption of technological resources when used practically. Huang et al. [13] proposed the corresponding compression damage constitutive model that combines damage evolution theory with propagation of wing crack, and systematically studied the influences of model parameters on stress–strain response and failure strength. Based on sliding crack model and energy balance during crack growth, Li et al. [14] and Li et al. [15] studied deformation and strength properties under different confining pressures. Although the above models can well simulate the rock stress–strain curve before the peak strength, it cannot well simulate the rock stress–strain curve after the peak strength. From the above, it can be concluded that a damage constitutive model that can describe both the macro- and micromechanical behavior of rock materials and is easy to apply in practice is hard to build using the approaches described above. Therefore, a macroscopic damage model based on micromechanics is of great interest to researchers. Based on the wing crack model proposed by Ashby and Sammis [16], Li et al. [17] and Li et al. [18] established the stress–strain relationship by using the correlation between the micromechanical and macroscopic definition of damage, which provides a new research idea for studying the mechanical properties and failure mechanism of rock. Although the above wing crack propagation model can reflect the propagation law of wing crack to a certain extent, the deviation of the calculation results is still large for some cases, which limits its application.
In order to better investigate the effects of microcrack growth on the mechanical properties of rock in compression, a new expression for stress intensity factor (i.e., KI) at wing crack tip was proposed in this study. Based on this, combining the relationship between microcrack growth and macroscopic strain, a practical macro–micro damage model that can continuously describe the relationship between stress–strain curve for rock materials was established. Rationality of this proposed damage model was verified by comparing the experimental data.

2. Wing Crack Model Analysis

The wing crack model has been widely applied in the damage and fracture analysis of rock-like materials under compressive load, as shown in Figure 1. When rock materials are subjected to the external load, its internal crack surface will slide over each other, resulting in the initiation and propagation of wing cracks. The stress intensity factor at the wing crack tip decreases with the propagation of wing crack. If the external load does not increase, the wing crack reaches a stable state. When the external load continues to increase, the stress intensity factor at the wing crack tip increases. When the stress intensity factor reaches or exceeds the fracture toughness KIC, the wing crack will continue to grow and gradually bend in the direction which is consistent with the maximum principal stress. However, because the real wing crack is not a simple straight line, complex numerical calculation has to be carried out in order to obtain the accurate solution of stress intensity factor at the wing crack tip. This is not convenient for practical application. Therefore, based on assumption that the real curved wing crack is replaced by a straight one (an approximated wing crack) by connecting the tip of curved wing crack with the tip of compressive-shear main crack, many scholars have proposed several common approximate solutions [16,19,20]. Due to the limited space of this paper, this paper only lists three calculation models that were widely used in compression-shear fracture and damage analysis of rock materials.
Horri and Nemat-Nasser [1] analyzed propagation process of the wing crack by using the complex function analysis method. However, the calculation process is complex, which brings inconvenience to practical application. Therefore, Horri and Nemat-Nasser [2] proposed an approximate equation for calculating stress intensity factor K I wing (HN model):
K I wing = 2 a τ e f f sin θ π ( l + 0.27 a ) σ n π l
where θ is the orientation of straight wing crack against main crack, τeff is the effective shear stress acting on the main crack surface, σ n is the normal stress acting on the single isolated crack of length 2l (see Figure 2b).
τ e f f = τ μ σ n = ( σ 1 σ 3 ) sin ( 2 β ) / 2 μ [ ( σ 1 + σ 3 ) + ( σ 1 σ 3 ) cos ( 2 β ) ] / 2
σ n = { ( σ 1 + σ 3 ) + ( σ 1 σ 3 ) cos [ 2 ( θ + β ) ] } / 2
where μ is the friction coefficient of the main crack surface, β is the main crack inclination angle, τ and σn are the shear stress and normal stress acting on the main crack surface.
The calculation results show that when the wing crack length l is rather short (l→0), the cracking angle θc corresponding to the extreme value of the stress intensity factor K I wing is inconsistent with the theoretical cracking angle of wing crack. Nevertheless, Equation (1) generally has high accuracy in most cases, and has also been used by many researchers to analyze the mechanical and deformation properties of rock materials [21,22].
By simplifying the curved wing crack into a straight wing crack with a length of 2l, Steif [19] derived expression of stress intensity factor K I wing (S model) at the wing crack tip with the assumption that the middle of the straight wing crack is affected by the relative sliding displacement of the initial main crack.
K I wing = 3 4 π / 2 τ e f f ( sin θ 2 + sin 3 θ 2 ) ( 2 a + l l ) σ n π l / 2
Considering the two limit cases of rather short wing crack (l→0) and extremely long wing crack (l→∞), Lehner and Kachanov [20] proposed an approximate calculation equation of stress intensity factor K I wing (LK model) at the wing crack tip for the case where the wing cracks are aligned in the direction of the principal compressive stress.
K I wing = 2 a τ e f f cos β π ( l + 3 a cos 2 β π 2 ) σ n π l

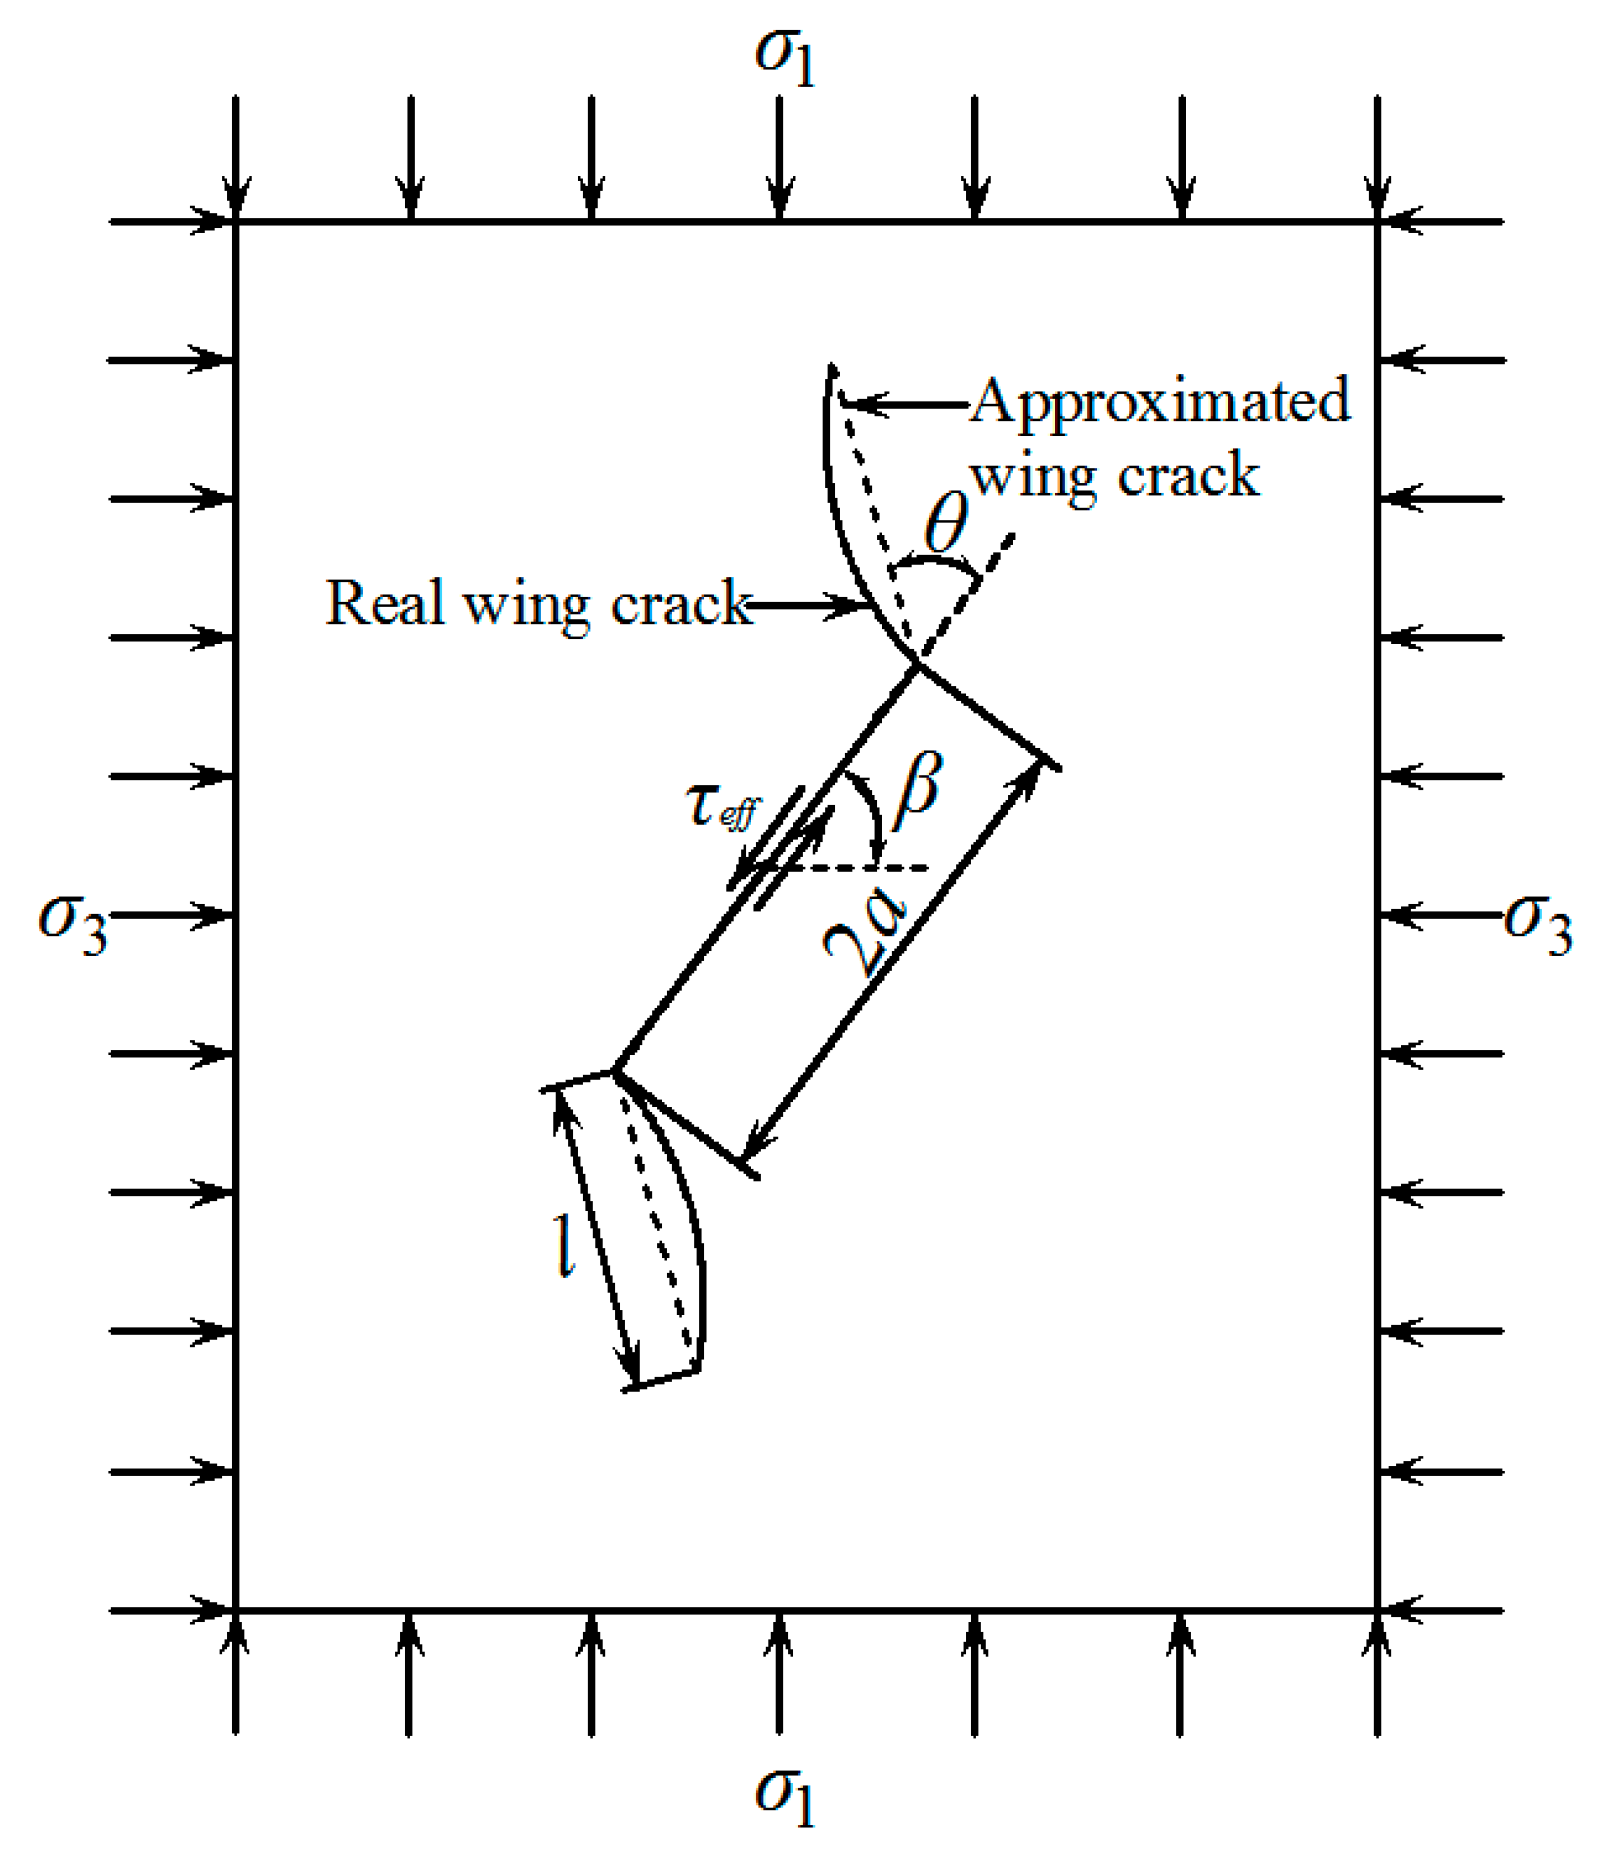
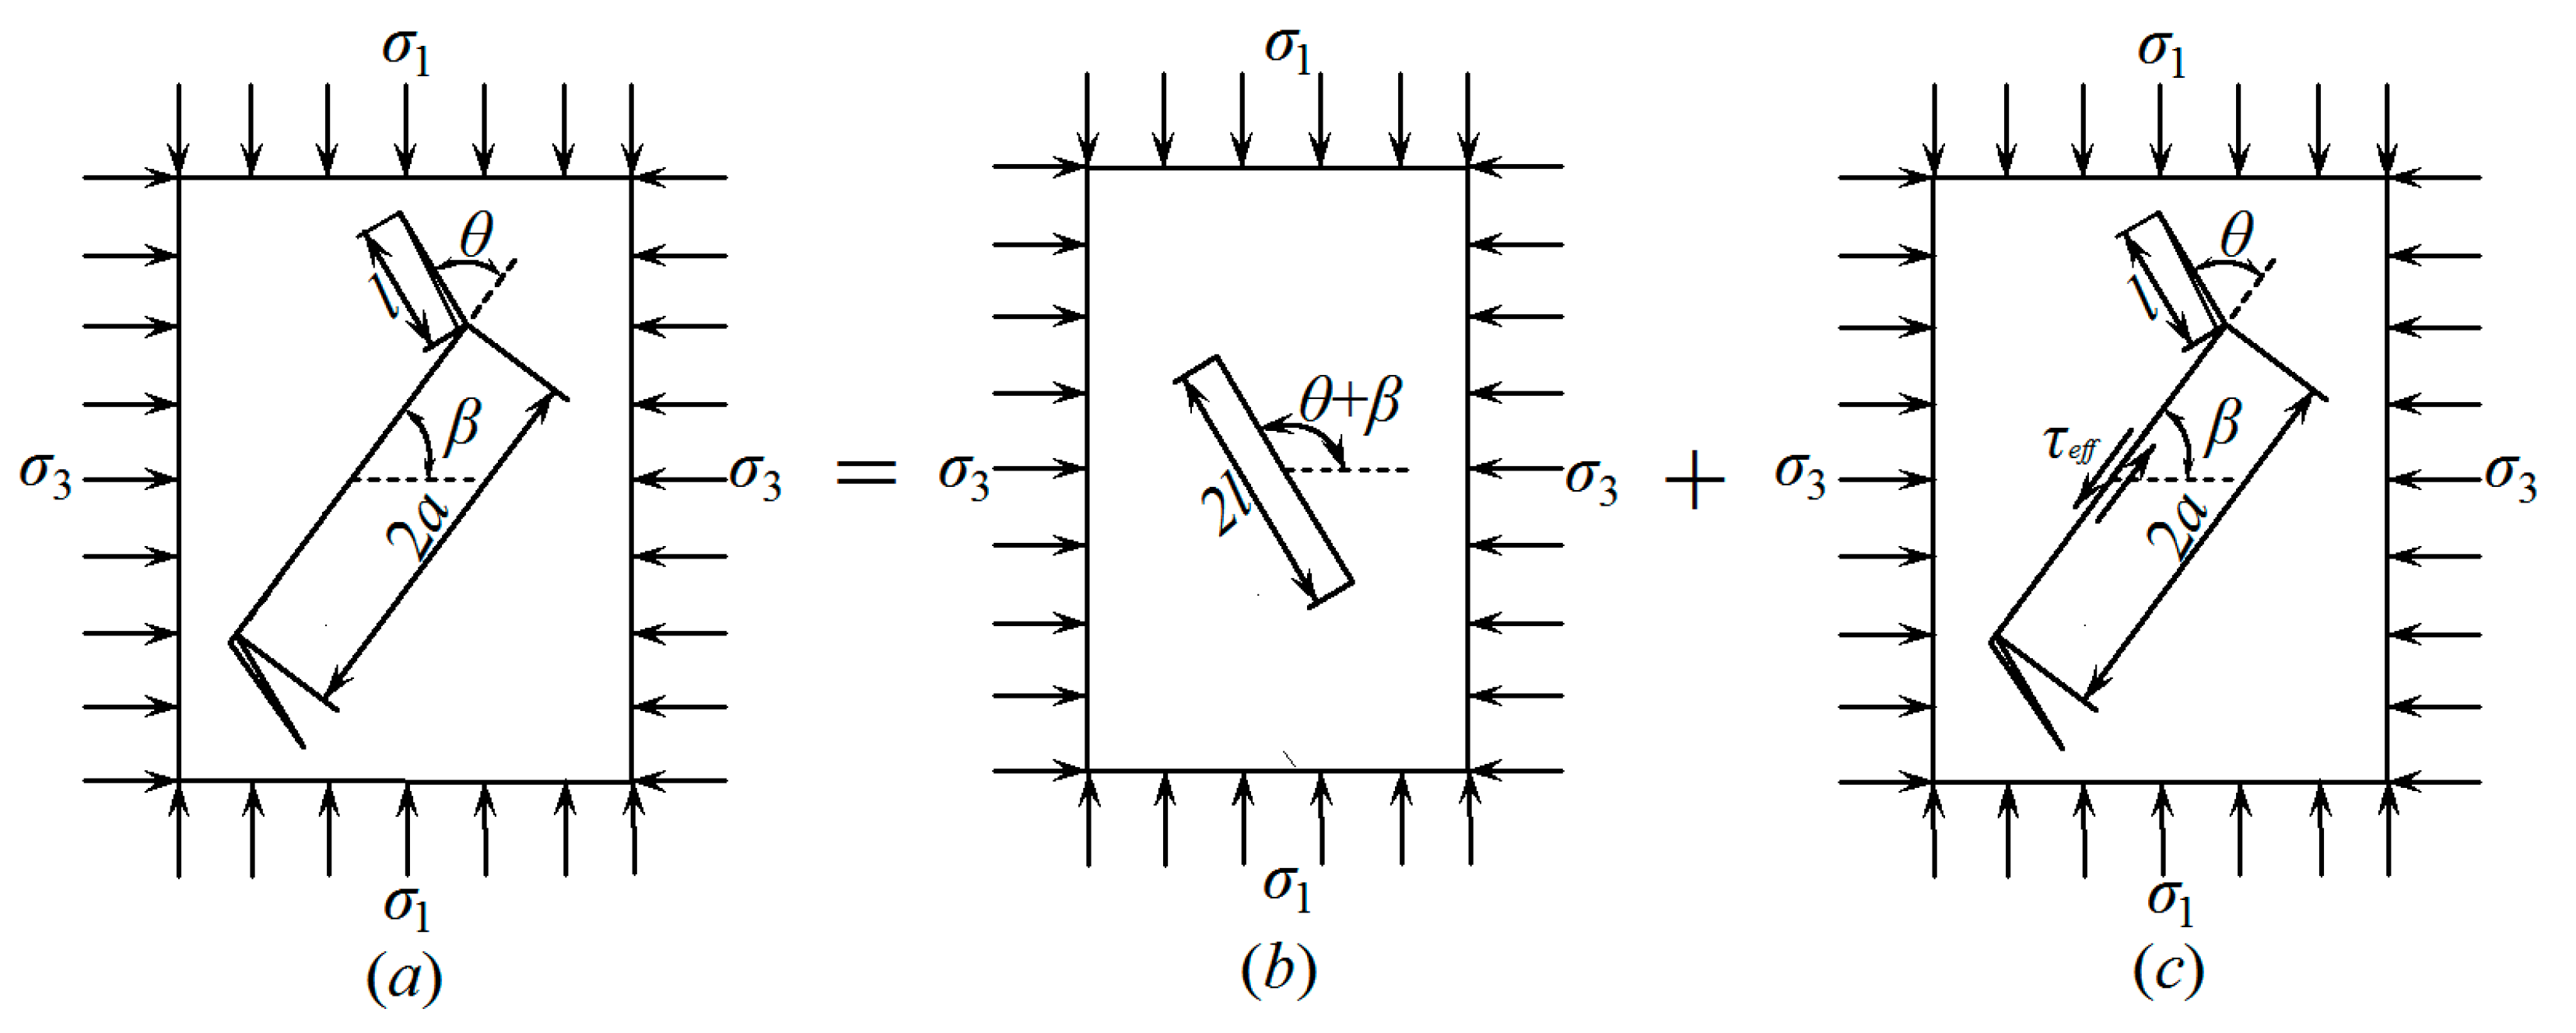
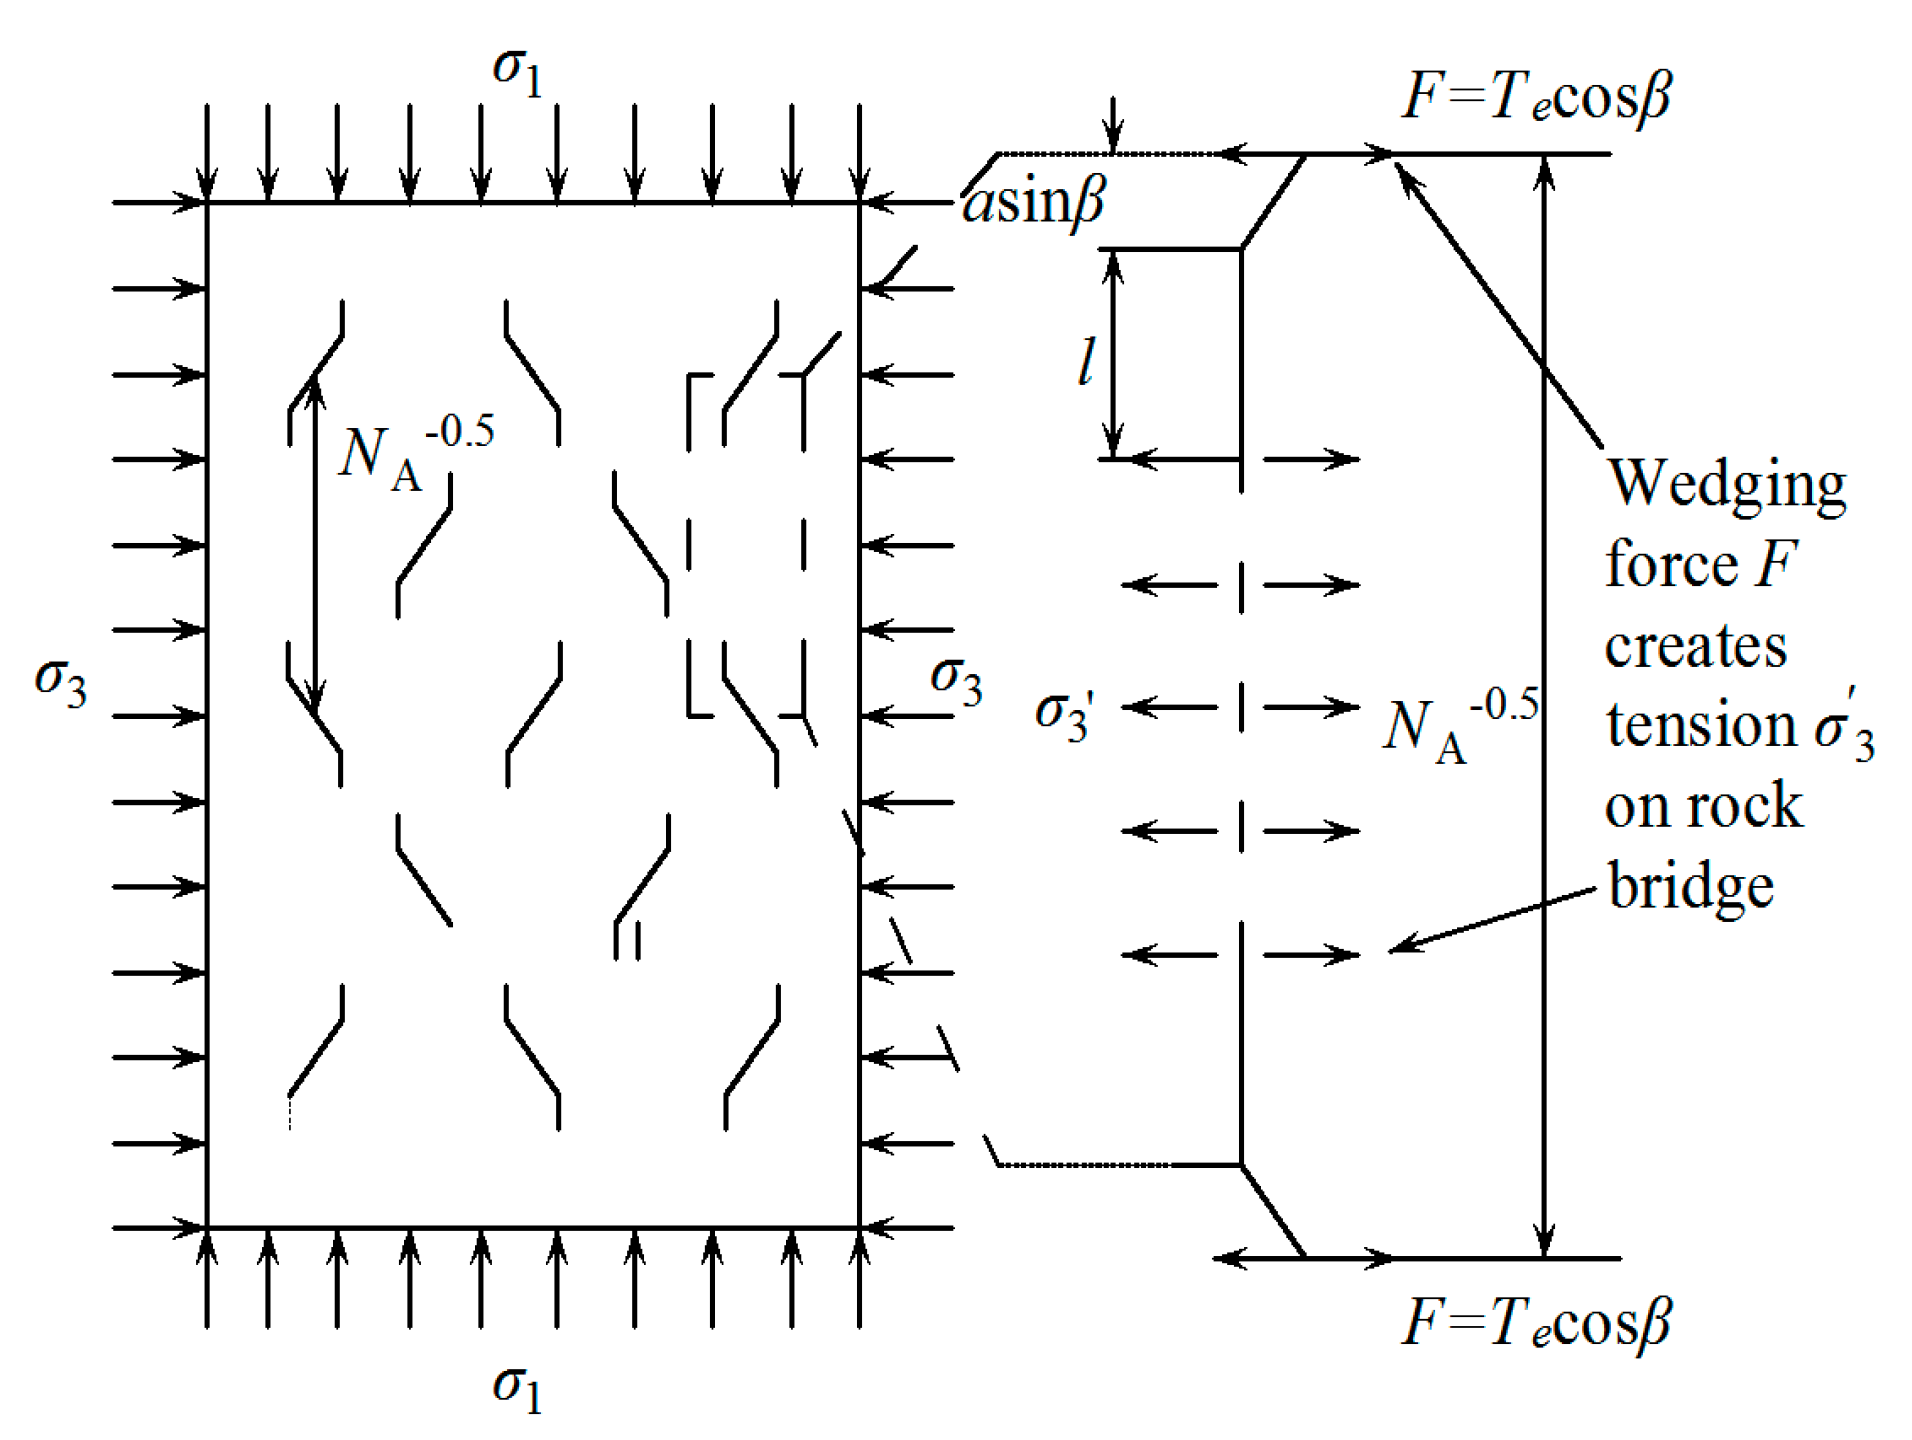
2.1. Improved Wing Crack Model

In the process of deriving expression of the stress intensity factor K I wing , the stress intensify factor K I wing at the wing crack tip can be simplified into the superposition of the two terms, as showed in Figure 2.
(1)
A component K I i sol for the two straight wing cracks of common length l, regarded as a single isolated straight crack of length 2l, and subjected to the far field stresses.
(2)
A component K I infl due to effective shear stress induced by the presence of the main crack subjected to the far field stresses.
The stress intensify factor K I wing at wing crack tip can be expressed as:
K I wing = K I i sol + K I infl  
It can be seen from Figure 2b the K I i sol is determined by the following equation [23]:
K I i sol = 1 2 { ( σ 1 + σ 3 ) + ( σ 1 σ 3 ) cos [ 2 ( θ + β ) ] } π l
The calculation expression of K I infl is derived as below. By rotating main crack θ angle, equivalent straight crack of length 2(a + l) is obtained, the direction of which is the same as that of the wing crack, as shown in Figure 3. Equivalent straight crack of length 2(a + l) consists of main crack of length 2a in the middle and straight wing crack of length 2l where a straight wing crack of length l is attached to the left side of main crack, and another l in the right side of main crack. The main crack is subjected to the normal stress σeq and the shear stress τeq.
The stress intensity factor of the equivalent straight crack in Figure 3b induced by the normal stress σeq is given [24].
K I infl = 2 σ eq a + l π arc sin ( a a + l )
When wing crack length is rather short (l→0), explicit form for K I infl for vanishingly small wing crack has been developed by Cotterell and Rice [25].
K I infl = 3 4 ( π a ) 1 2 τ e f f ( sin θ 2 + sin 3 θ 2 )
Considering that wing length is rather short (l→0), the expression of Equation (8) is given as:
K I infl = σ eq π a
Comparing Equation (9) with (10), the following equation can be obtained.
σ eq = 3 4 τ e f f ( sin θ 2 + sin 3 θ 2 )
Considering wing crack length is extremely long (l→∞), equivalent straight crack can be considered to be subjected to a pair of concentrated force 2aσeq. The length of equivalent straight crack is about 2l. The expression of K I infl is given as [24]:
K I infl = 2 a σ eq π l
As l→∞, the above equation can also be obtained from Equation (8) by taking l→∞, The following equation can be obtained.
σ eq = τ e f f sin θ
To satisfy Equations (11) and (13), by introducing a factor e l a , the normal stress σeq can be set as:
σ eq = τ e f f [ 3 4 ( sin θ 2 + sin 3 θ 2 )   e l a + sin θ ( 1 e l a ) ]
By substituting Equation (14) into (8), the K I wing at the wing crack tip subjected to far field stresses can be obtained.
K I wing = 2 τ e f f [ 3 4 ( sin θ 2 + sin 3 θ 2 )   e l a + sin θ ( 1 e l a ) ]   a + l π arc sin ( a a + l ) σ n π l

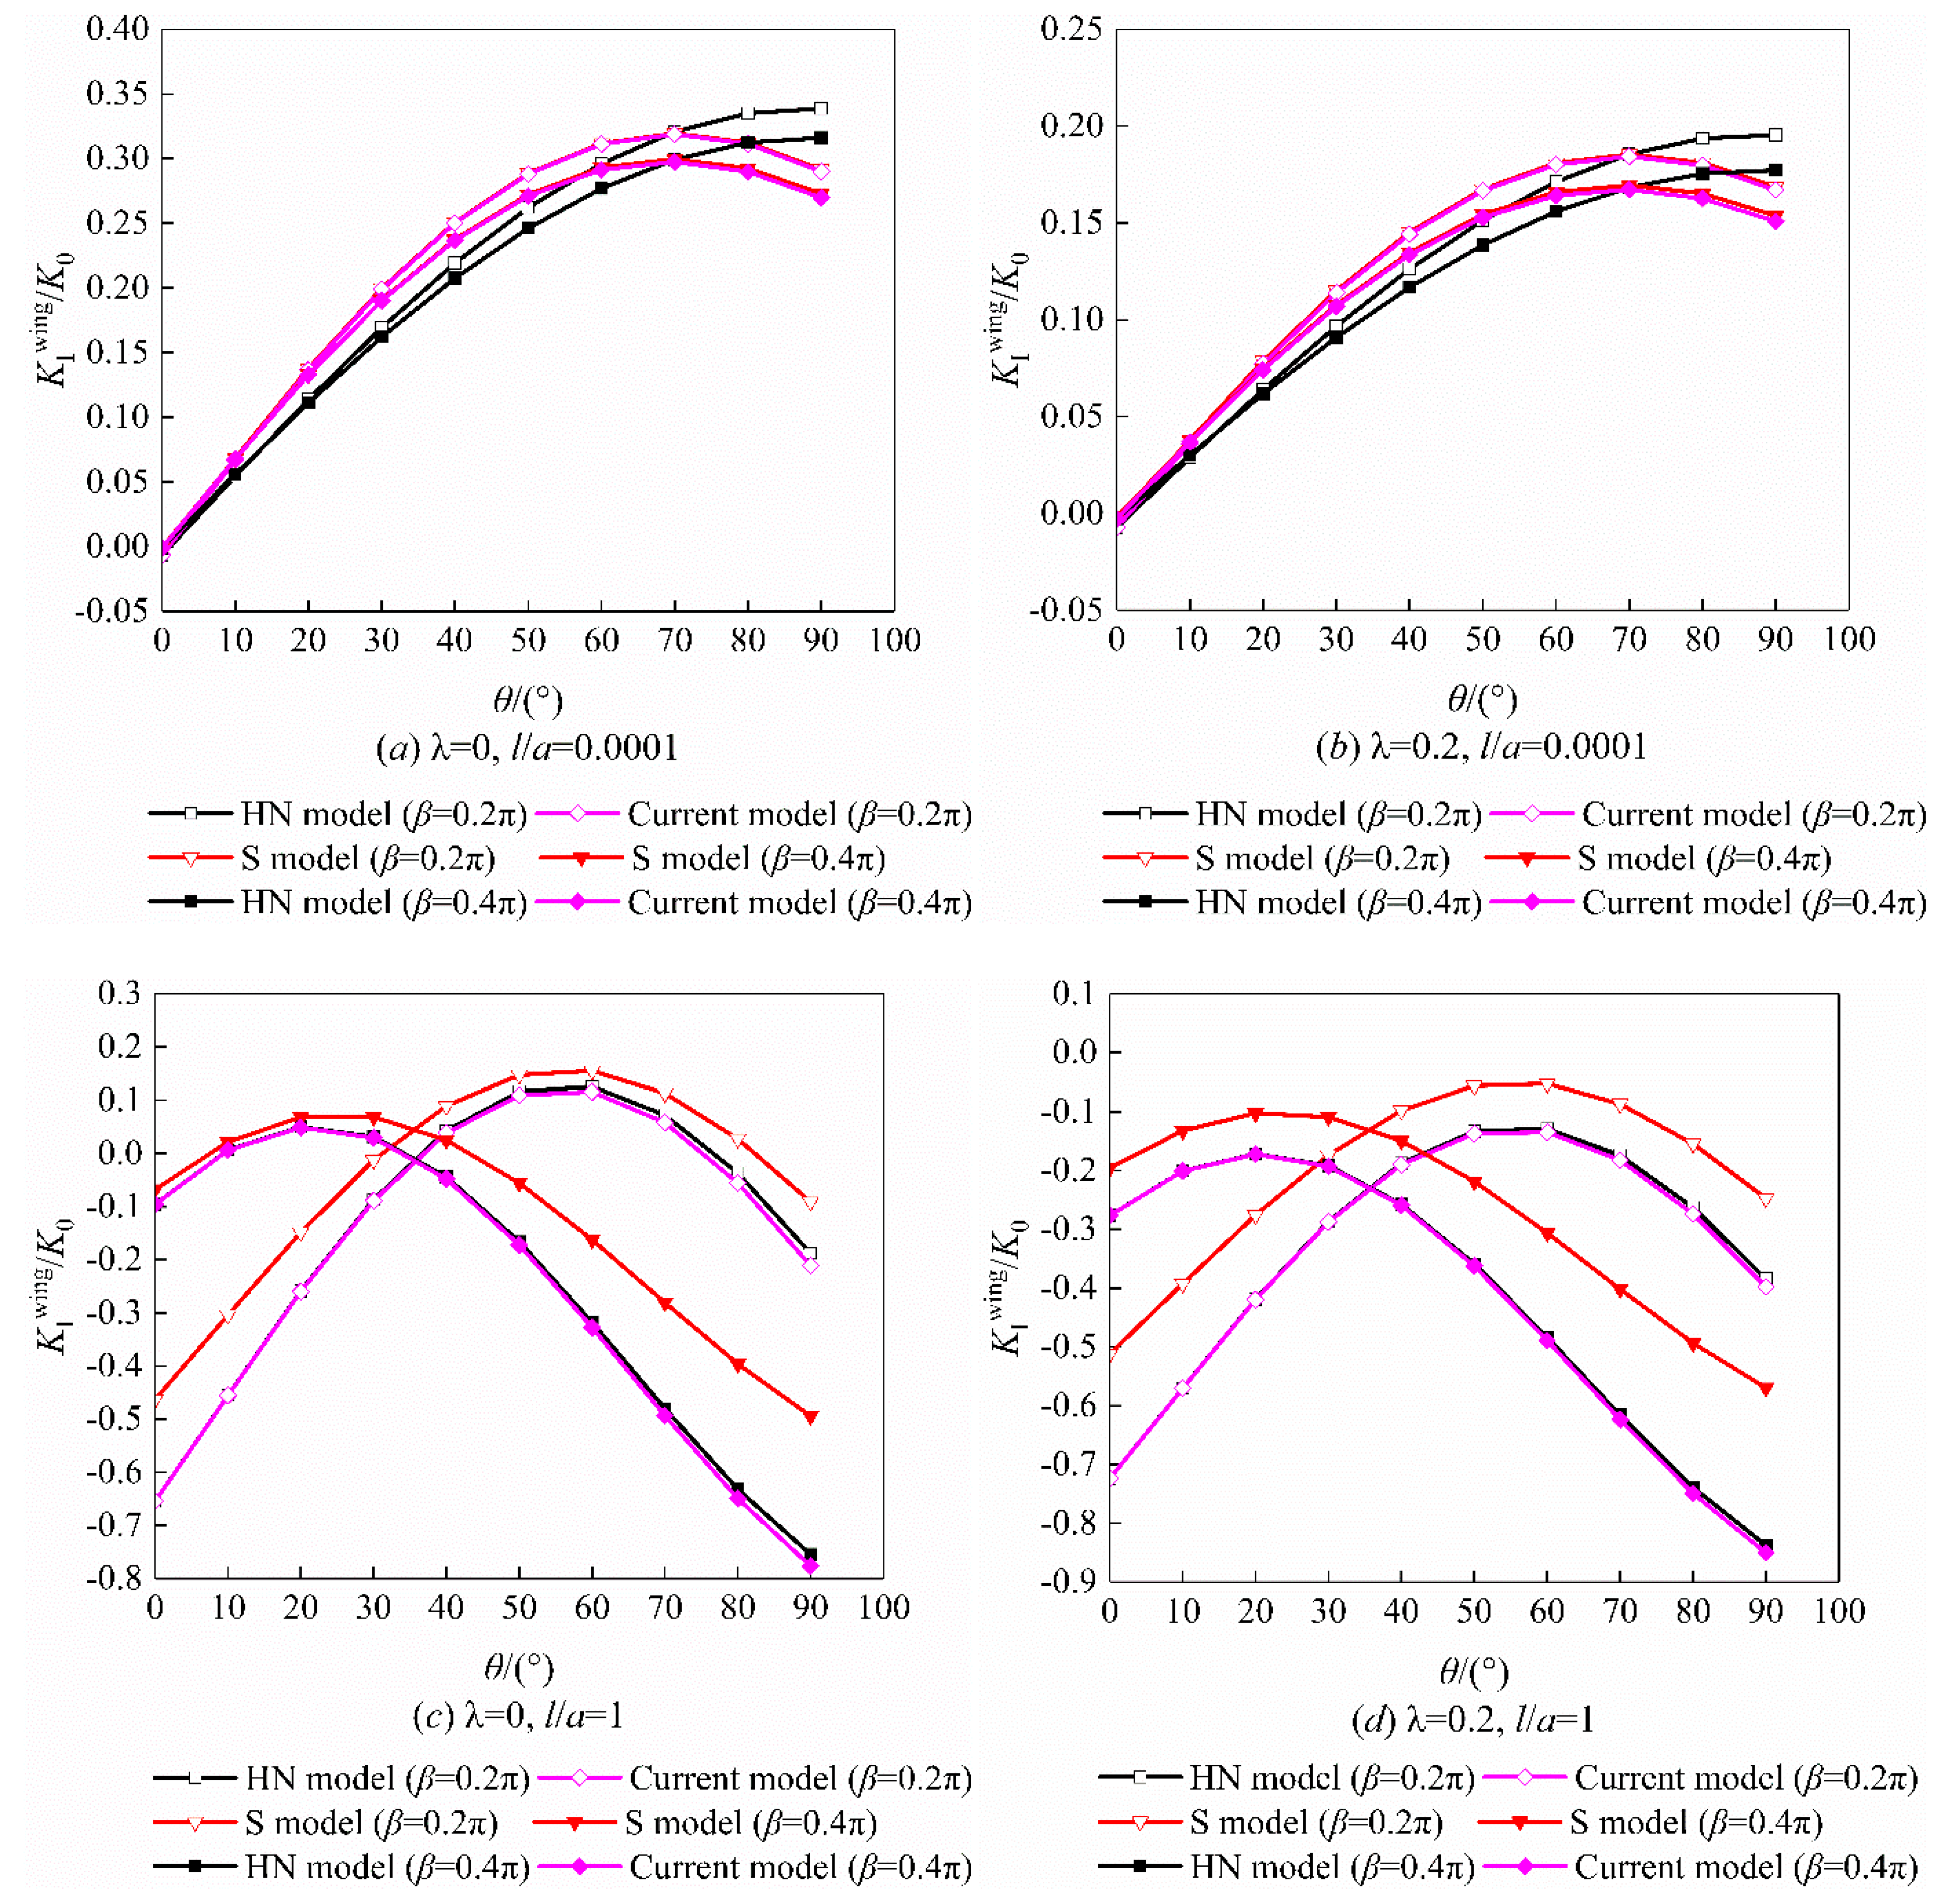
2.2. Comparative Analysis of Models

In order to verify the effectiveness of the modified stress intensify factor K I wing proposed in this paper, the calculation results of each model (Equations (1), (4), (5) and (15)) are compared and analyzed. Since Equation (5) is only applicable to the situation that the wing crack have a fixed orientation parallel to maximum principal stress (i.e., θ = π/2 − β), the other three equations are compared first. Figure 4 shows the relationship between the dimensionless stress intensity factor at the crack tip and the orientation θ of straight wing crack. The crack friction coefficient μ = 0.3 and K 0 = σ 1 π a in this study.
(1)
Main crack inclination angle β: 0.2π and 0.4π;
(2)
Stress ratio λ = σ3/σ1: 0 and 0.2 (uniaxial compression and biaxial compression);
(3)
The equivalent crack propagation length l/a: 0.0001 and 1 (rather short wing crack and long wing crack).
The following conclusions can be drawn from Figure 4:
(1)
When l/a = 0.0001, that is, the wing crack length is rather short. The calculation results of the S model and current model are basically consistent. Of course, deviation of the results given by the HN model is also small. However, it can be seen from Figure 4a,b that when θ is equal to about 70.5°, the stress intensity factors predicted by the S model and the current model in this study all reach the maximum value except for the HN model. This is consistent with the theoretical cracking angle θc (i.e., θc = 70.5°) of wing crack [3], while the predicted cracking angle of HN model is 90°.
(2)
When l/a = 1, that is, the wing crack length is long. It can be seen from Figure 4c,d that the calculation results of the HN model and current model are basically consistent. The results given by S model are generally too large, indicating that S model is not suitable for the case of long wing crack. With the increase of confining pressure and the main crack inclination angle β, the deviation of the result given by the S model becomes more obvious. However, the large deviation mainly occurs when the stress intensity factor is negative. The negative stress intensity factor indicates that the wing crack has been closed and would not propagate.
When the external load continues to increase, the stress intensity factor at the wing crack tip increases. When the stress intensity factor exceeds the fracture toughness, the wing crack will continue to grow and quickly bend in the direction which is consistent with the maximum principal stress. It is assumed that the winged cracks are aligned in the direction of the principal compressive stress (i.e., θ = π/2 − β) in order to be convenient for computation and implementation in practice. The above assumptions have been accepted by many scholars to study the effect of microcrack growth on progressive damage and failure of rock, and can achieve good results from the perspective of engineering application [14,15,21]. Based on this, the relationship between the dimensionless stress intensity factor at the crack tip and the equivalent crack propagation length is showed in the Figure 5. As can be observed in Figure 5, all models predict that with the increase of the equivalent crack propagation length, the dimensionless stress intensity factor becomes smaller. When there is no confining pressure, the calculation results of HN model and the current model are almost consistent. However, when the equivalent crack propagation length is short (l/a < 1), the results given by LK model are obviously larger. With the increase of the equivalent crack propagation length, the results given by LK model gradually approach the results of HN model and current model, as showed in Figure 5a,b. When there is a certain confining pressure, the calculation results of HN model, LK model and current model are almost consistent, as showed in Figure 5c,d. Moreover, the dimensionless stress intensity factor is generally smaller than that under uniaxial compression. This indicates that the confining pressure can inhibit the propagation of wing crack and is conducive to the stability of the rock materials. The results given by the S model are generally too large.
Based on the above analysis, we can get that the prediction results of the current model in this study are very close to the prediction results of classical model proposed by Horii and Nemat-Nasser [2] (i.e., Equation (1)) in general. At the same time, the current model also overcomes internal limitation of Equation (1) at the wing crack initiation. Compared with the S model and LK model, the wing crack propagation model established in this study has higher accuracy and clear physical meaning. It can be concluded that the current model can simulate the whole range of variation of wing crack length from being extremely short to very long. Therefore, the current model can provide a theoretical reference for investigating progressive damage and failure of rock from the perspective of engineering application.

3. Description of the Damage Model

3.1. Relationship between Stress and Crack Growth in Compression

At present, many scholars have carried out relevant research on rock with multi-cracks. However, little consideration was given to interaction between the microcracks. Assuming that the propagation direction of wing crack is parallel to maximum principal stress, the stress intensity factor at the wing crack tip could be calculated by Equation (16) when the crack spacing is large. As the crack spacing decreases, the interaction between the cracks will lead to a damaged connection and result in a break of the rock bridge. The rock bridge interaction mechanical model of the multi-cracks rock as the wing crack expands is shown in Figure 6.
The crack interaction is considered by drawing the internal stress σ 3 in the rock bridge. It is noteworthy that the internal stress σ 3 has a great significance for evaluating the rock failure from crack interaction. This internal stress σ 3 is determined as [16]:
σ 3 = T e cos β N A 1 / 2 2 ( l + a sin β )
where NA is the number of initial compression-shear cracks per unit area; F = Tecosβ = 2aτeff cosβ is a wedging force acting at the midpoint of each crack.
Acting on the wing crack, the internal stress σ 3 produces an additional intensity factor at the crack tip.
K 1 = 2 a τ e f f cos β N A 1 / 2 2 ( l + a sin β ) π l
Considering the damage to the rock bridge by the wing crack interaction, the stress intensity factor at the wing crack tip is obtained by Equations (15) and (17) for the case where the wing cracks are aligned in the direction of the principal compressive stress.
K I = K I wing + K 1 = 2 τ e f f [ 3 4 ( sin θ 2 + sin 3 θ 2 )   e l a + sin θ ( 1 e l a ) ] a + l π arc sin ( a a + l ) σ 3 π l + 2 a τ e f f cos β N A 1 / 2 2 ( l + a sin β ) π l
Based on Equation (18), it can be seen that the interaction of multiple wing cracks resulting in rock bridge damage makes the stress intensity factor at the crack tip larger than that of a single wing crack.
Based on the fracture mechanics criterion, it is well known that wing crack will propagate when the mode-I stress intensity factor KI at the wing crack tip reaches rock fracture toughness KIC. According to the Equation (18), the linkage of stress state (σ1, σ3) and crack growth is obtained as:
σ 1 = { 2 B C + π l ( 1 + B E ) } σ 3 + K IC 2 A C + A E π l
where
A = sin ( 2 β ) μ { 1 + cos ( 2 β ) } 2
B = sin ( 2 β ) + μ { 1 cos ( 2 β ) } 2
C = [ 3 4 ( sin θ 2 + sin 3 θ 2 )   e l a + sin θ ( 1 e l a ) ]   a + l π arc sin ( a a + l )
E = 2 a cos β N A 1 / 2 2 ( l + a sin β )

3.2. Relationship between Microcrack Growth and Macroscopic Strain

For rock materials, microcrack extension triggers the increasing damage, which causes the degradation of mechanical properties. Based on Weibull distribution [26], the damage can be expressed as [27]:
D = 1 exp ( m ε 1 )
where m is the material constant, ε1 is the axial strain.
According to the density and size of the microcracks, the damage can be defined as [16]:
D = π ( l + a sin β ) 2 N A
D 0 = π ( a sin β ) 2 N A
where NA is postulated as a constant in the given rock sample in this study, which can be obtained by using the initial damage D0.
In single rock sample, the identical value of damage can be achieved from Equations (24) and (25). Combining the Equations (24) and (25), the relationship between microcrack length and macroscopic strain can be obtained.
ε 1 = 1 m ln [ 1 D 0 ( l a sin β + 1 ) 2 ]
l = a sin β { [ 1 exp ( m ε 1 ) ] 1 / 2 D 0 1 / 2 1 }

3.3. Stress–Strain Relationship during Progressive Failure

Substituting Equation (28) into Equation (19), the expression of stress–strain relationship during progressive failure can be obtained.
σ 1 ( ε 1 ) = [ 2 B J 1 + π J 3 ( 1 + B J 2 ) ] σ 3 + K IC 2 A J 1 + A J 2 π J 3
where
J 1 = [ 3 4 ( sin θ 2 + sin 3 θ 2 )   e J 3 a + sin θ ( 1 e J 3 a ) ] a ( 1 + J 3 / a ) π arc sin ( 1 1 + J 3 / a )
J 2 = 2 cot β D 0 1 / 2 π 1 / 2 2 [ J 3 / ( a sin β ) + 1 ]
J 3 = a sin β { [ 1 exp ( m ε 1 ) ] 1 / 2 D 0 1 / 2 1 }
The contributions of the mode-II and mode-III stress intensity factors to wing crack growth are much less than that of mode-I stress intensity factor [28,29]. Therefore, these contributions to the axial strain of rock are negligible in this study.

4. Results

4.1. Triaxial Tests and Parameters Determination

The macro–micro damage model for rock materials has been established, and its feasibility and rationality still need to be verified by example analysis. A series of conventional triaxial compression tests were carried out to verify the proposed damage constitutive model in this study. The rock used in this study is red sandstone collected from a mining area in Hunan Province, China. The mineral components of the sandstone samples were detected by X-ray detection. The red sandstone samples are mainly composed of quartz, anorthite, gismondine and clay cements. The average dry density of the sandstone samples was 2.31 g/cm3 at room temperature. The selected rock samples belong to the same rock block, which ensures the reliability of the test results. To ensure homogeneity of the sandstone samples, the sandstone samples were taken from a great thickness of sandstone strata, and have no obvious defects. The sandstone samples have good uniformity of appearance, no obvious stratigraphic structure, and no weak layers visible to the naked eye. At the same time, the P-wave of the sandstone samples was measured to single out the specimens with velocities which were too small or large. The rock samples have been processed as cylinders, with the height of 100 mm and the diameter of 50 mm according to size requirements of the International Society for Rock Mechanics (ISRM). The conventional triaxial compression tests were carried out on the RMT-301 material test system from Wuhan University in China. The machine’s maximum axial compressive force is 1500 kN, and the maximum confining pressure is 70 MPa. The triaxial tests were conducted under the displacement control mode to capture the post peak behavior. During the test, the system directly records the load and the displacement. The conventional triaxial tests were conducted, which was divided into two steps. First, σ1 and σ3 were applied to a predetermined value (the confining pressure) by the hydrostatic pressure conditions. The predetermined value remained unchanged for 15 s. Second, σ3 remained unchanged. Then, the loading was switched to an axial displacement control, and the axial loading rate was set as 0.002 mm/s until rock fails. As shown in Figure 7, the failure modes of the red sandstone samples are mainly splitting failure (uniaxial compression) and compression shear failure (triaxial compression).
Some micro-parameters in the current damage model were hardly measured directly by experiment. Therefore, the specific values of micro-parameters were obtained by comparing the experimental and theoretical data, which provides an important help for applying the proposed analytical model to real rock. This process was repeated until the theoretical results achieved a good agreement with the experimental results. The specific method for selection of model parameters is as follows.
At low-stress levels, the initial crack does not slide when shear does not overcome friction (i.e., μ | σ n | ). The rock is in the elastic stage. When axial stress σ1 reaches the crack initiation stress σ1c, wing cracks start to form from the initial main crack tips. Substituting cracking angle θc = 0.392π = 70.5° and the effective shear stress τeff acting on the main crack surface into Equation (9), the most dangerous crack is that lying at the main crack inclination angle β which maximizes K I infl . Then, it can be found that tan(2β) = −1. Therefore, the crack initiation stress σ1c can be obtained:
σ 1 c = 1 + μ 2 + μ 1 + μ 2 μ σ 3 + 3 1 + μ 2 μ K IC π a
There is a statistical relationship between rock uniaxial compressive strength σc and fracture toughness KIC: σc = (55~82)KIC [30]. For the red sandstone sample with σc = 73 MPa, it is assumed that the fracture toughness KIC = 73/82 = 0.9 MPa·m−1/2 can be obtained. The crack initiation stress is about 40% of the peak stress [31]. Therefore, a linear relationship between confining pressure σ3 and axial crack initiation stress σ1c was suggested as σ 1 c = 1.44 σ 3 + 30.5 MPa based on the triaxial compressive test results. Combining this experimental relationship and Equation (33), the parameters a and μ can be obtained (i.e., μ = 0.18, a = 1.2 mm). At the same time, the main crack inclination angle β is also obtained (i.e., β = 50°). It is noted that since the length and orientation of microcracks in the rock are arbitrarily distributed, numerical simulation of this propagation of every microcrack is not practical. Therefore, a homogenization method is used to investigate the deformation and mechanical properties of rock, that is, microcracks inclination angle β and size a are assumed as an average value for numerous and randomly distributed initial microcrack in natural rock. This method provides an assistance in applying the current model to analysis the strength and failure in rock. The initial damage D0 of rock is generally between 0.01–0.1. D0 = 0.046 is selected by comparison with theoretical and experimental results. The material constant m = 16, which can be approximately determined according to the shape of stress–strain test curve and peak strain value. The sensitivity of parameters is discussed in detail in the following section.

4.2. Verification of the Present Model

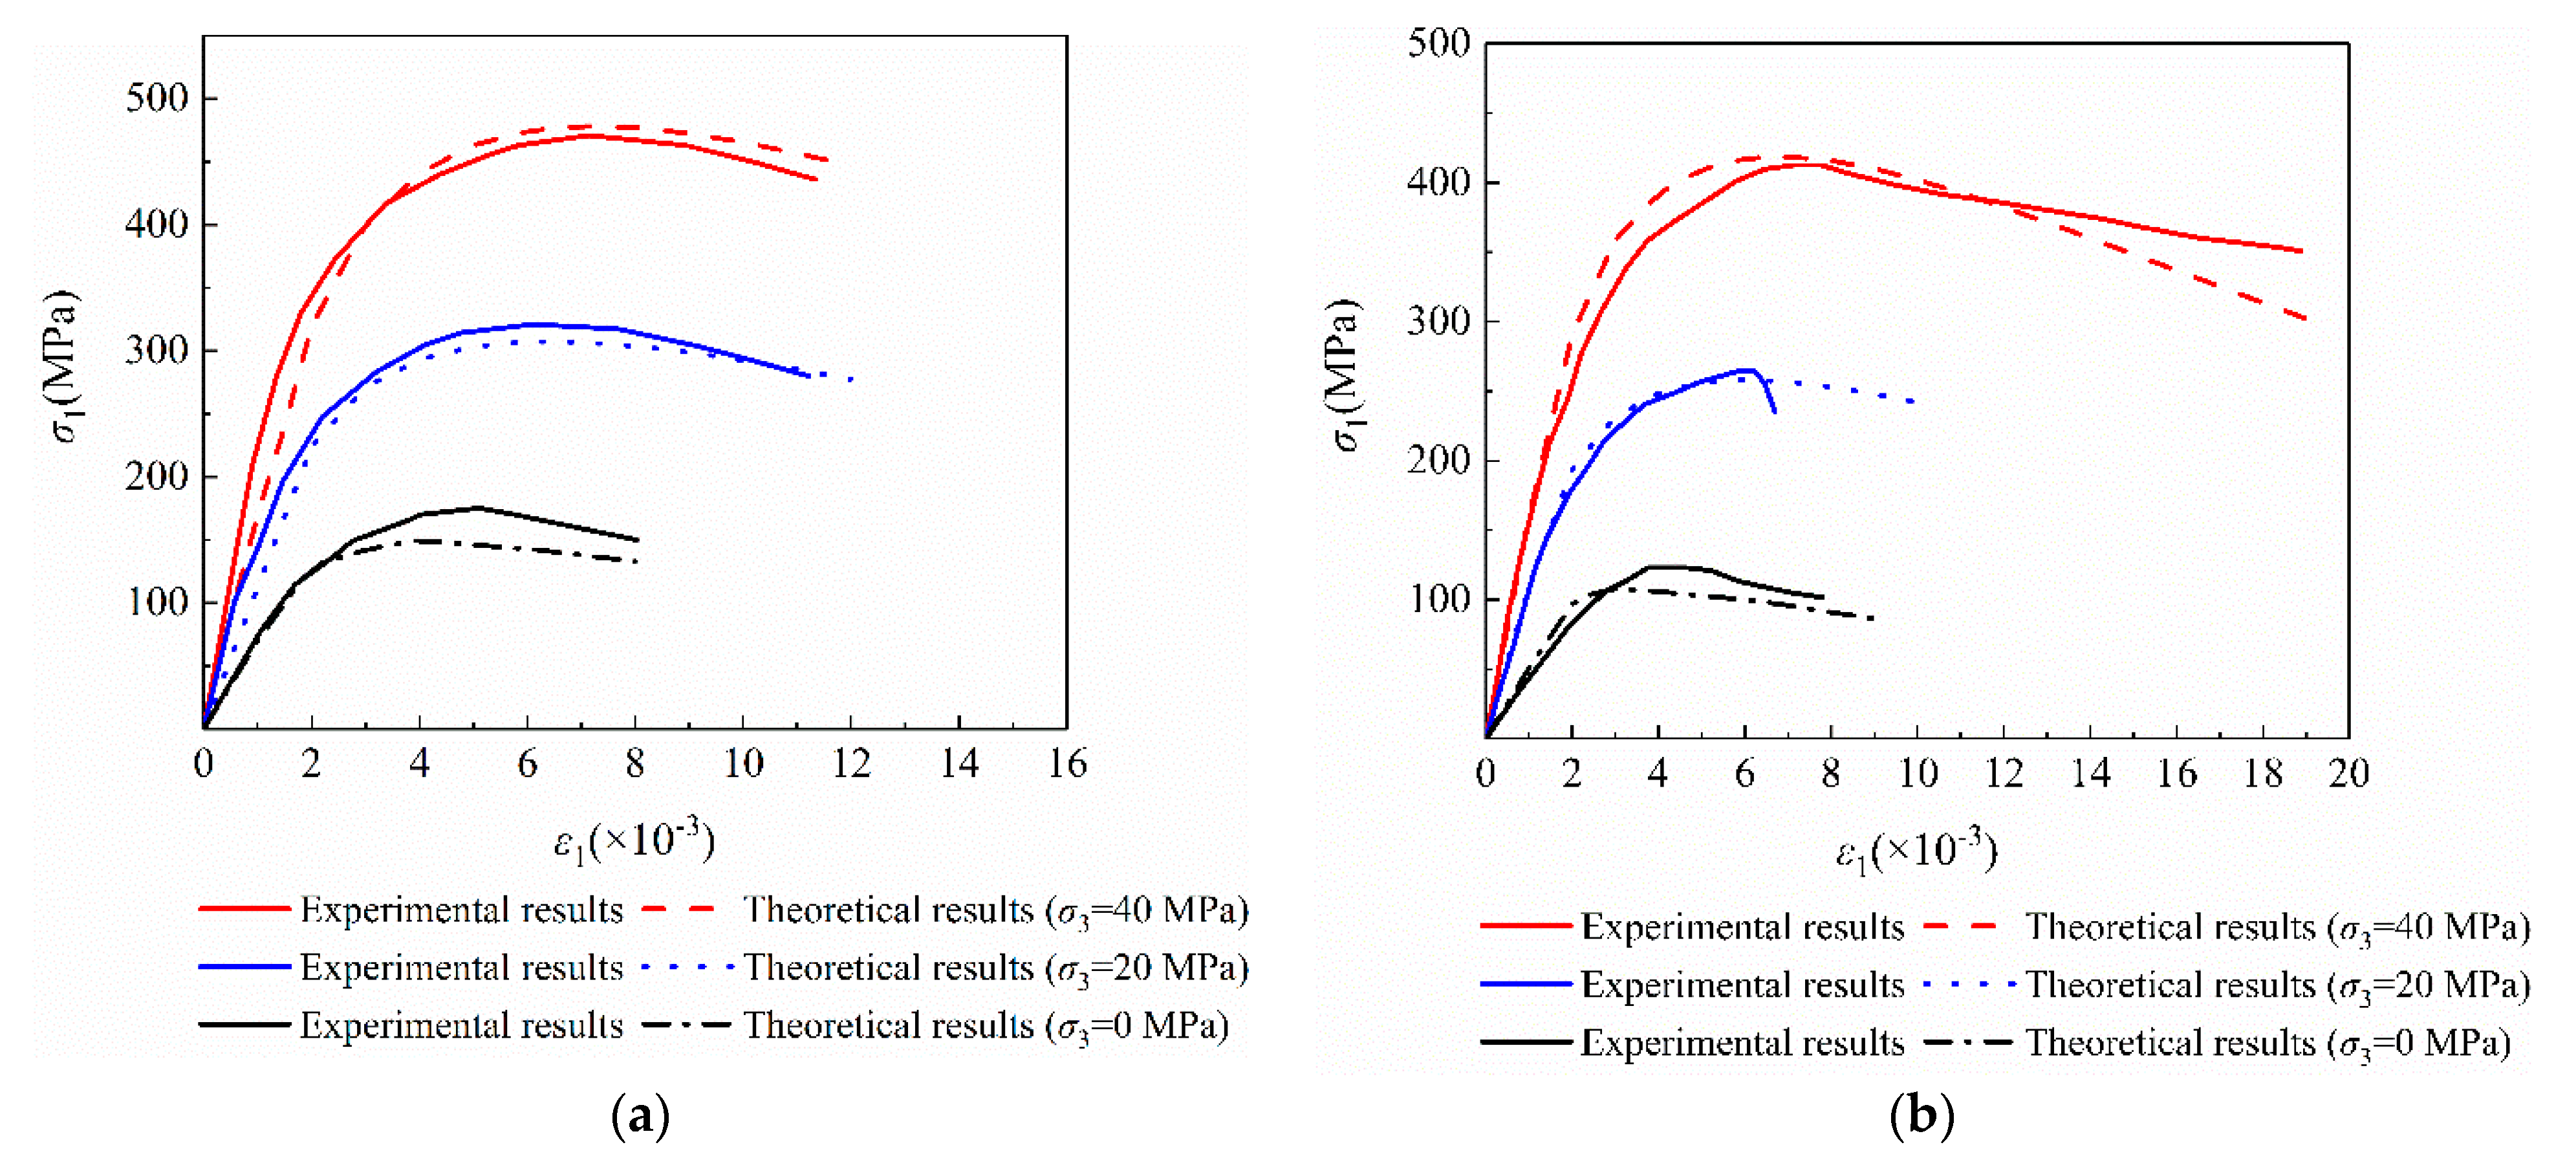
4.2.1. Verification of Current Model by the Sandstone Triaxial Experiment Results

As shown in Figure 8, the theoretical stress–strain curves are obtained. The changing trend of experimental curves and theoretical curves are consistent. With the increase of axial strain, the axial stress first increases to a peak value, and then decreases gradually. It can be seen that the proposed damage constitutive model can simulate the stress–strain response in the failure process of the sandstone samples well. Especially in the stage before peak stress, the simulation results are very similar to the experimental results, and can objectively characterize the constitutive relationship of sandstone samples before peak stress. For the stress–strain curve at lower pressure, there is a certain deviation between the theoretical curves and the experimental curves in the post-peak stress stage. The reasons for deviation could be as follows. First, the failure from strain localization is approximately studied by global failure of the wing crack model. The global failure is achieved by considering the interaction of the adjacent wing cracks and the additional stress caused by rock bridge damage. Second, the model parameter m is a constant value, which is used to determine the stress–strain curves under different confining pressures. With the increase of confining pressure, theoretical curves are more consistent with experimental curves of sandstone samples. The peak stress and corresponding peak strain also increase with the increase of confining pressure. It can be observed from Figure 9 that the crack initiation stress and peak stress predicted by the proposed model are in good agreement with the test results. Both of them increase with the increase of confining pressure. Furthermore, the difference between crack initiation stress and peak stress also increased with the increment of confining pressure.

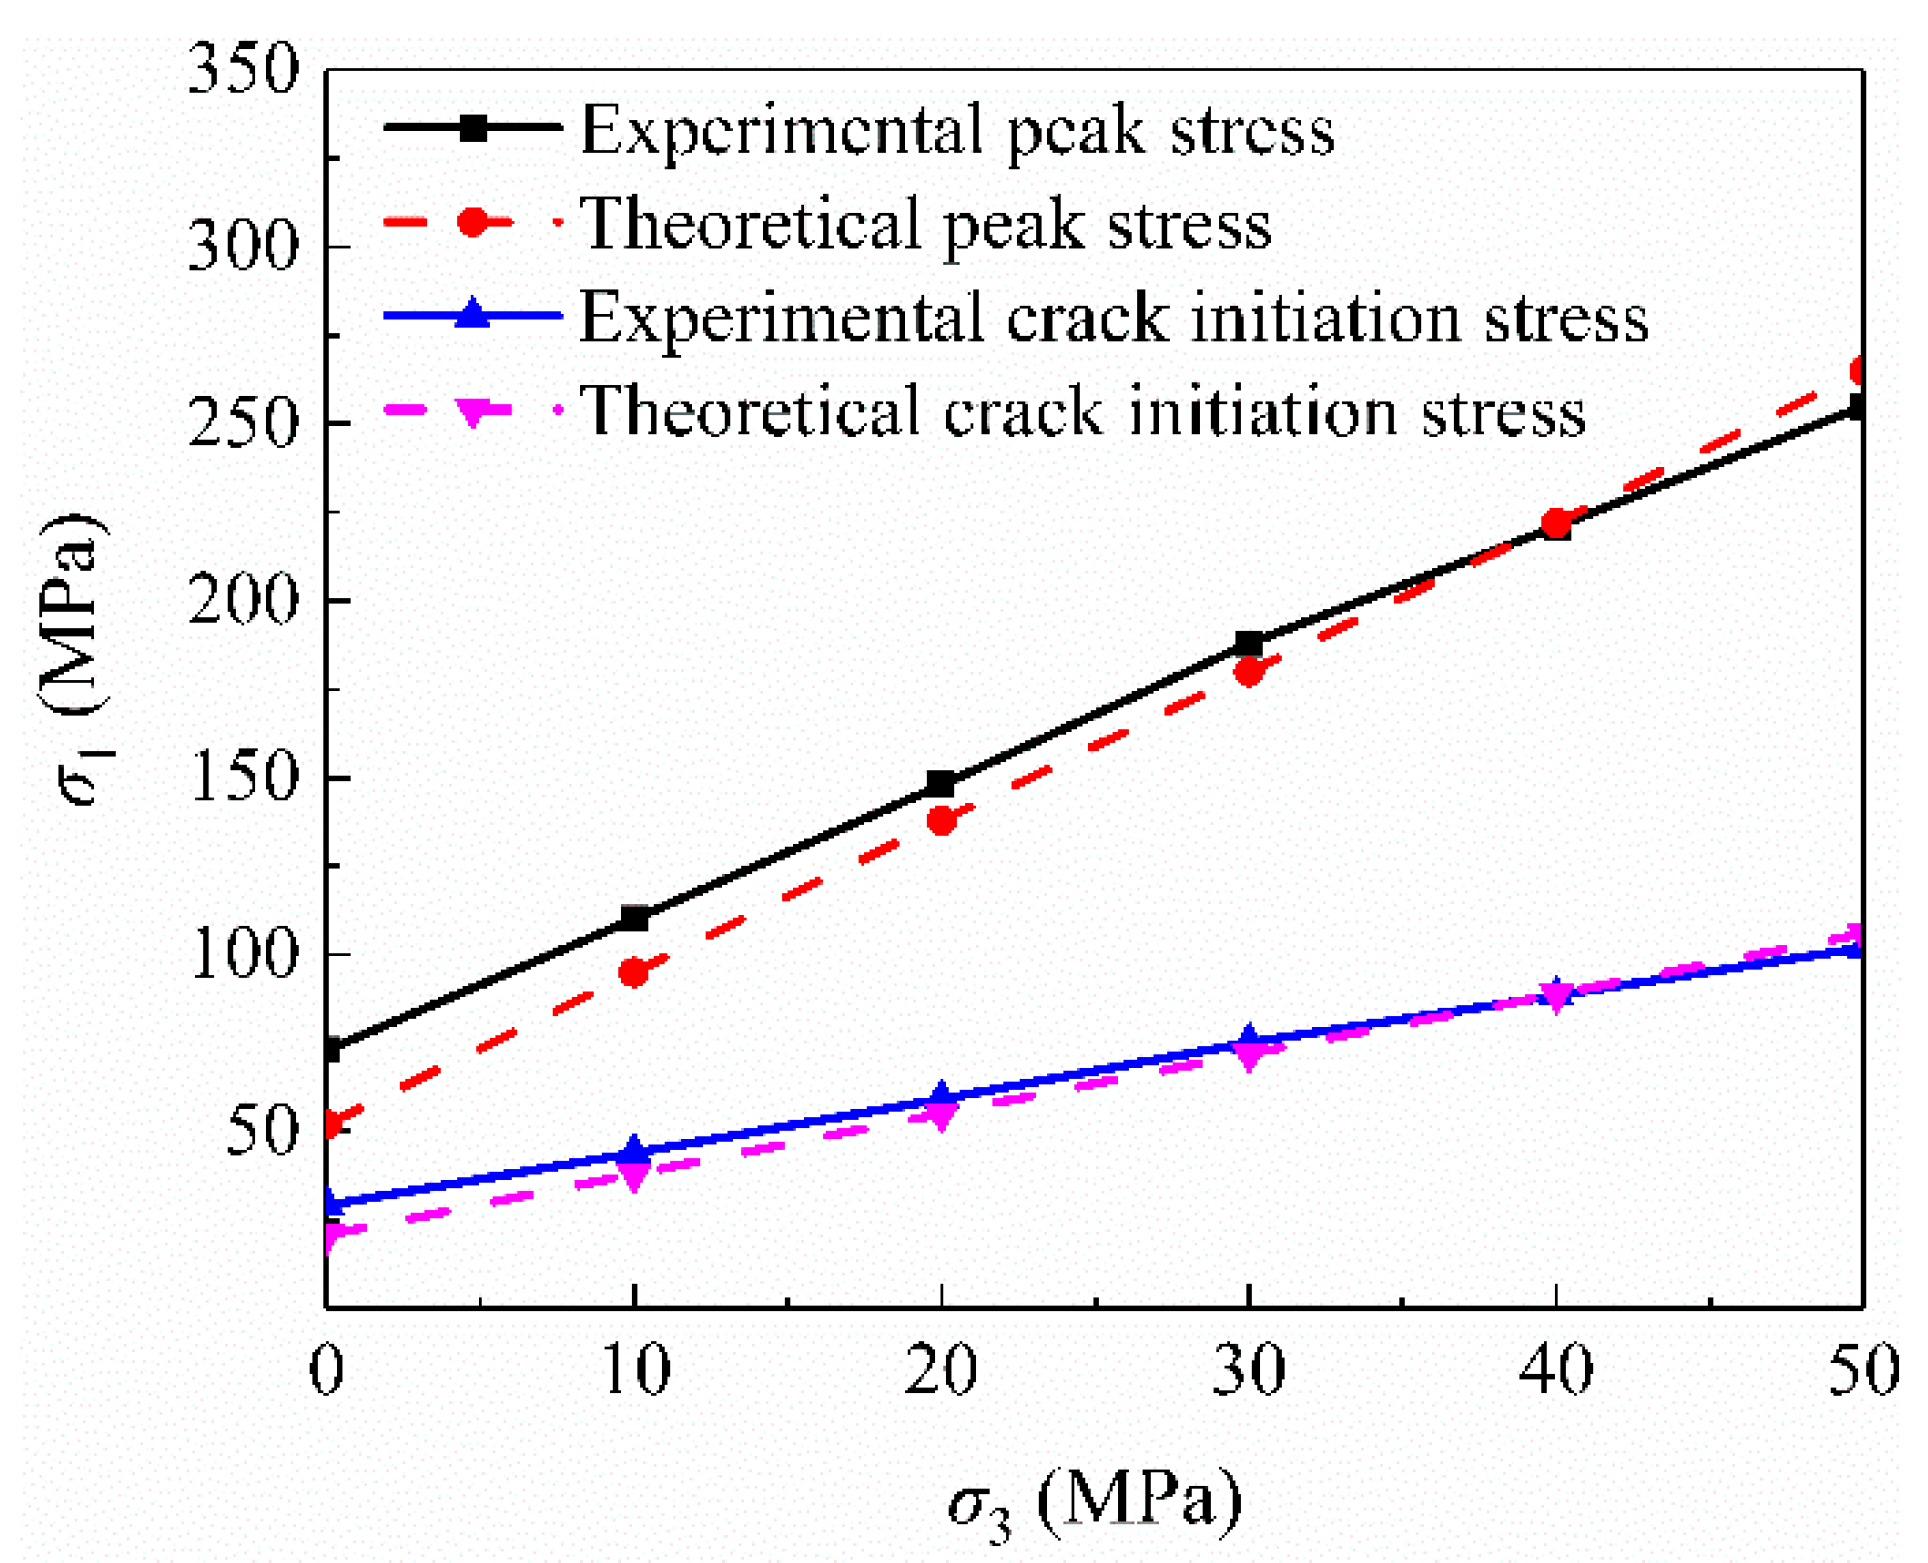
4.2.2. Reliability Verification of Current Model

In order to verify the reliability of the proposed damage constitutive model, it is necessary to use the test data of different types of rock to verify the proposed model in this study. Therefore, the test data of granite [32] and Jinping marble [33] triaxial compression, used by other authors [34,35], are also used here for verification and comparison. The fitting results simulated by the proposed damage constitutive model and the stress–strain curves of the testing results are shown in Figure 10. It can be observed that the axial stress increases with the increment of strain before it reaches peak value. The axial stress would decrease with the increment of strain after peak value. These theoretical results are consistent with published experimental results. It indicates that the proposed damage constitutive model in this study can simulate the mechanical behavior of different types of rock and has good applicability.

5. Discussion

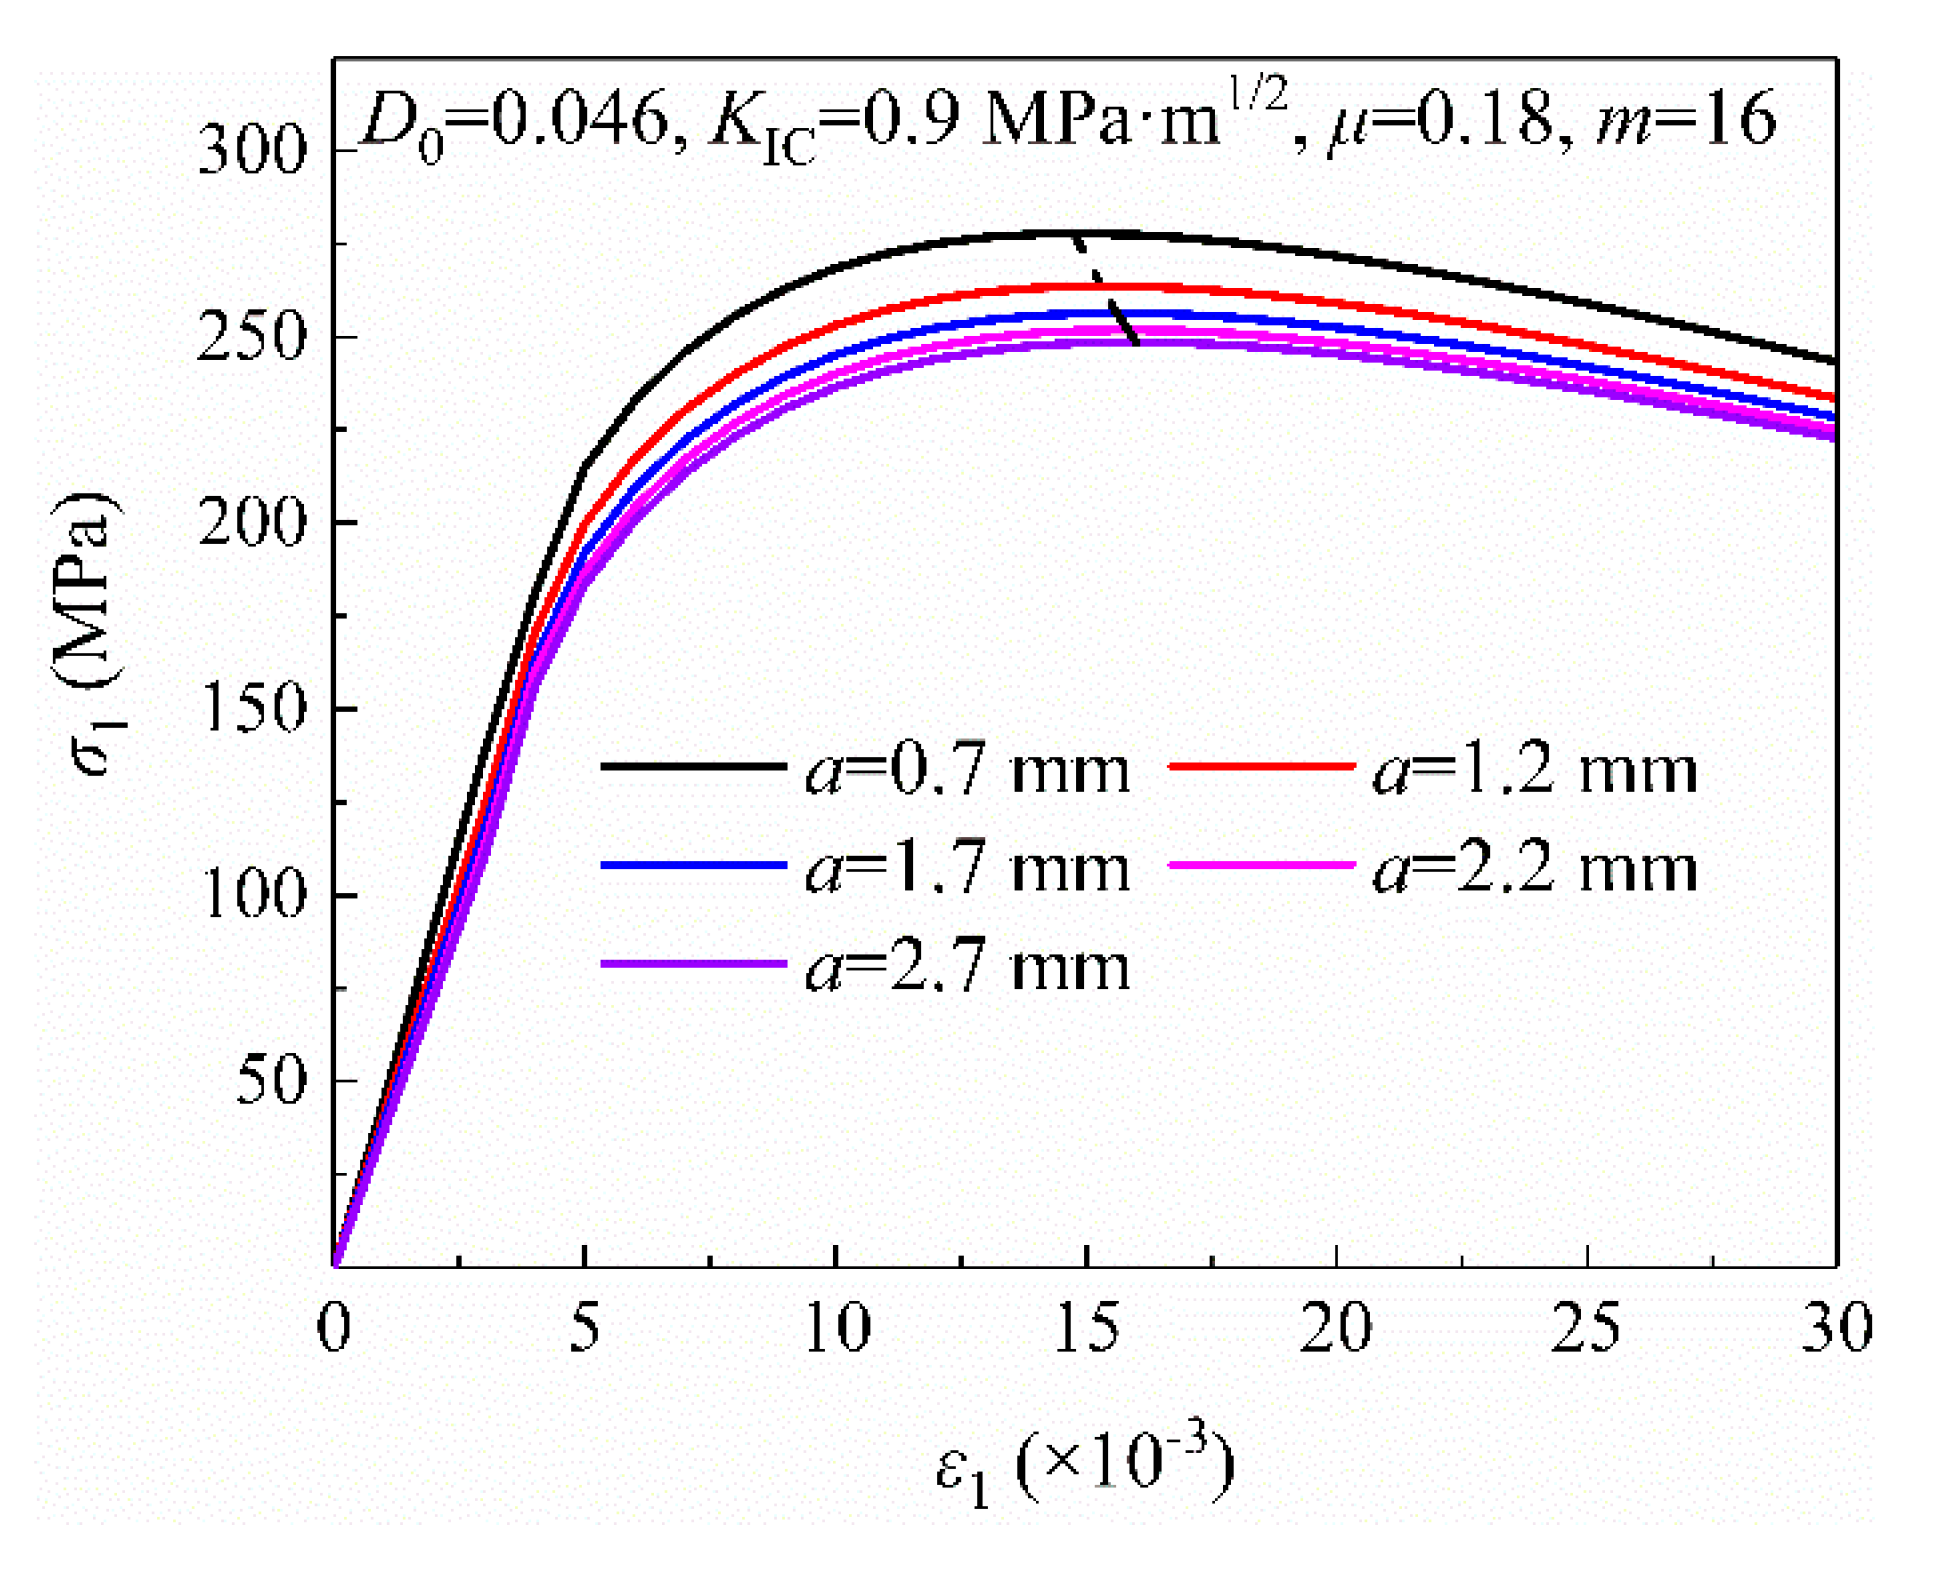
5.1. Effects of Initial Microcrack Size a and Friction Coefficient μ on Stress–Strain Relationship

It can be observed from Figure 11 that when the number of microcracks in rock sample remains unchanged, the larger initial microcrack crack size, the smaller the corresponding axial stress under the condition of an identical strain value. It indicates that the increment of initial microcrack crack size (i.e., initial damage) reduces the compressive strength. The reasons are as follows. The stress intensity factor KI at the wing crack tip increases with the increase of initial microcrack size, which can be clearly seen from Equation (15) and Figure 5. However, the fracture toughness of rock remains unchanged. Therefore, a small external force can make the microcrack propagate, resulting in the reduction of compressive strength. The peak strain corresponding to the peak stress increases with the increase of the initial crack size.
It can be observed from Figure 12 that the axial stress increases with the increase of friction coefficient at the given strain. It means that the increment of friction coefficient enhances rock the compressive strength. The reasons are as follows. With the increase of friction coefficient, the ability of microcrack to resist shear slip increases. Under the same normal stress, the effective shear stress acting on the microcrack surface decreases, resulting in the decrease of stress intensity factor KI at the wing crack tip. Because the fracture toughness of rock remains unchanged, it needs larger external force to make the microcrack propagate. Therefore, the compressive strength of rock increases.

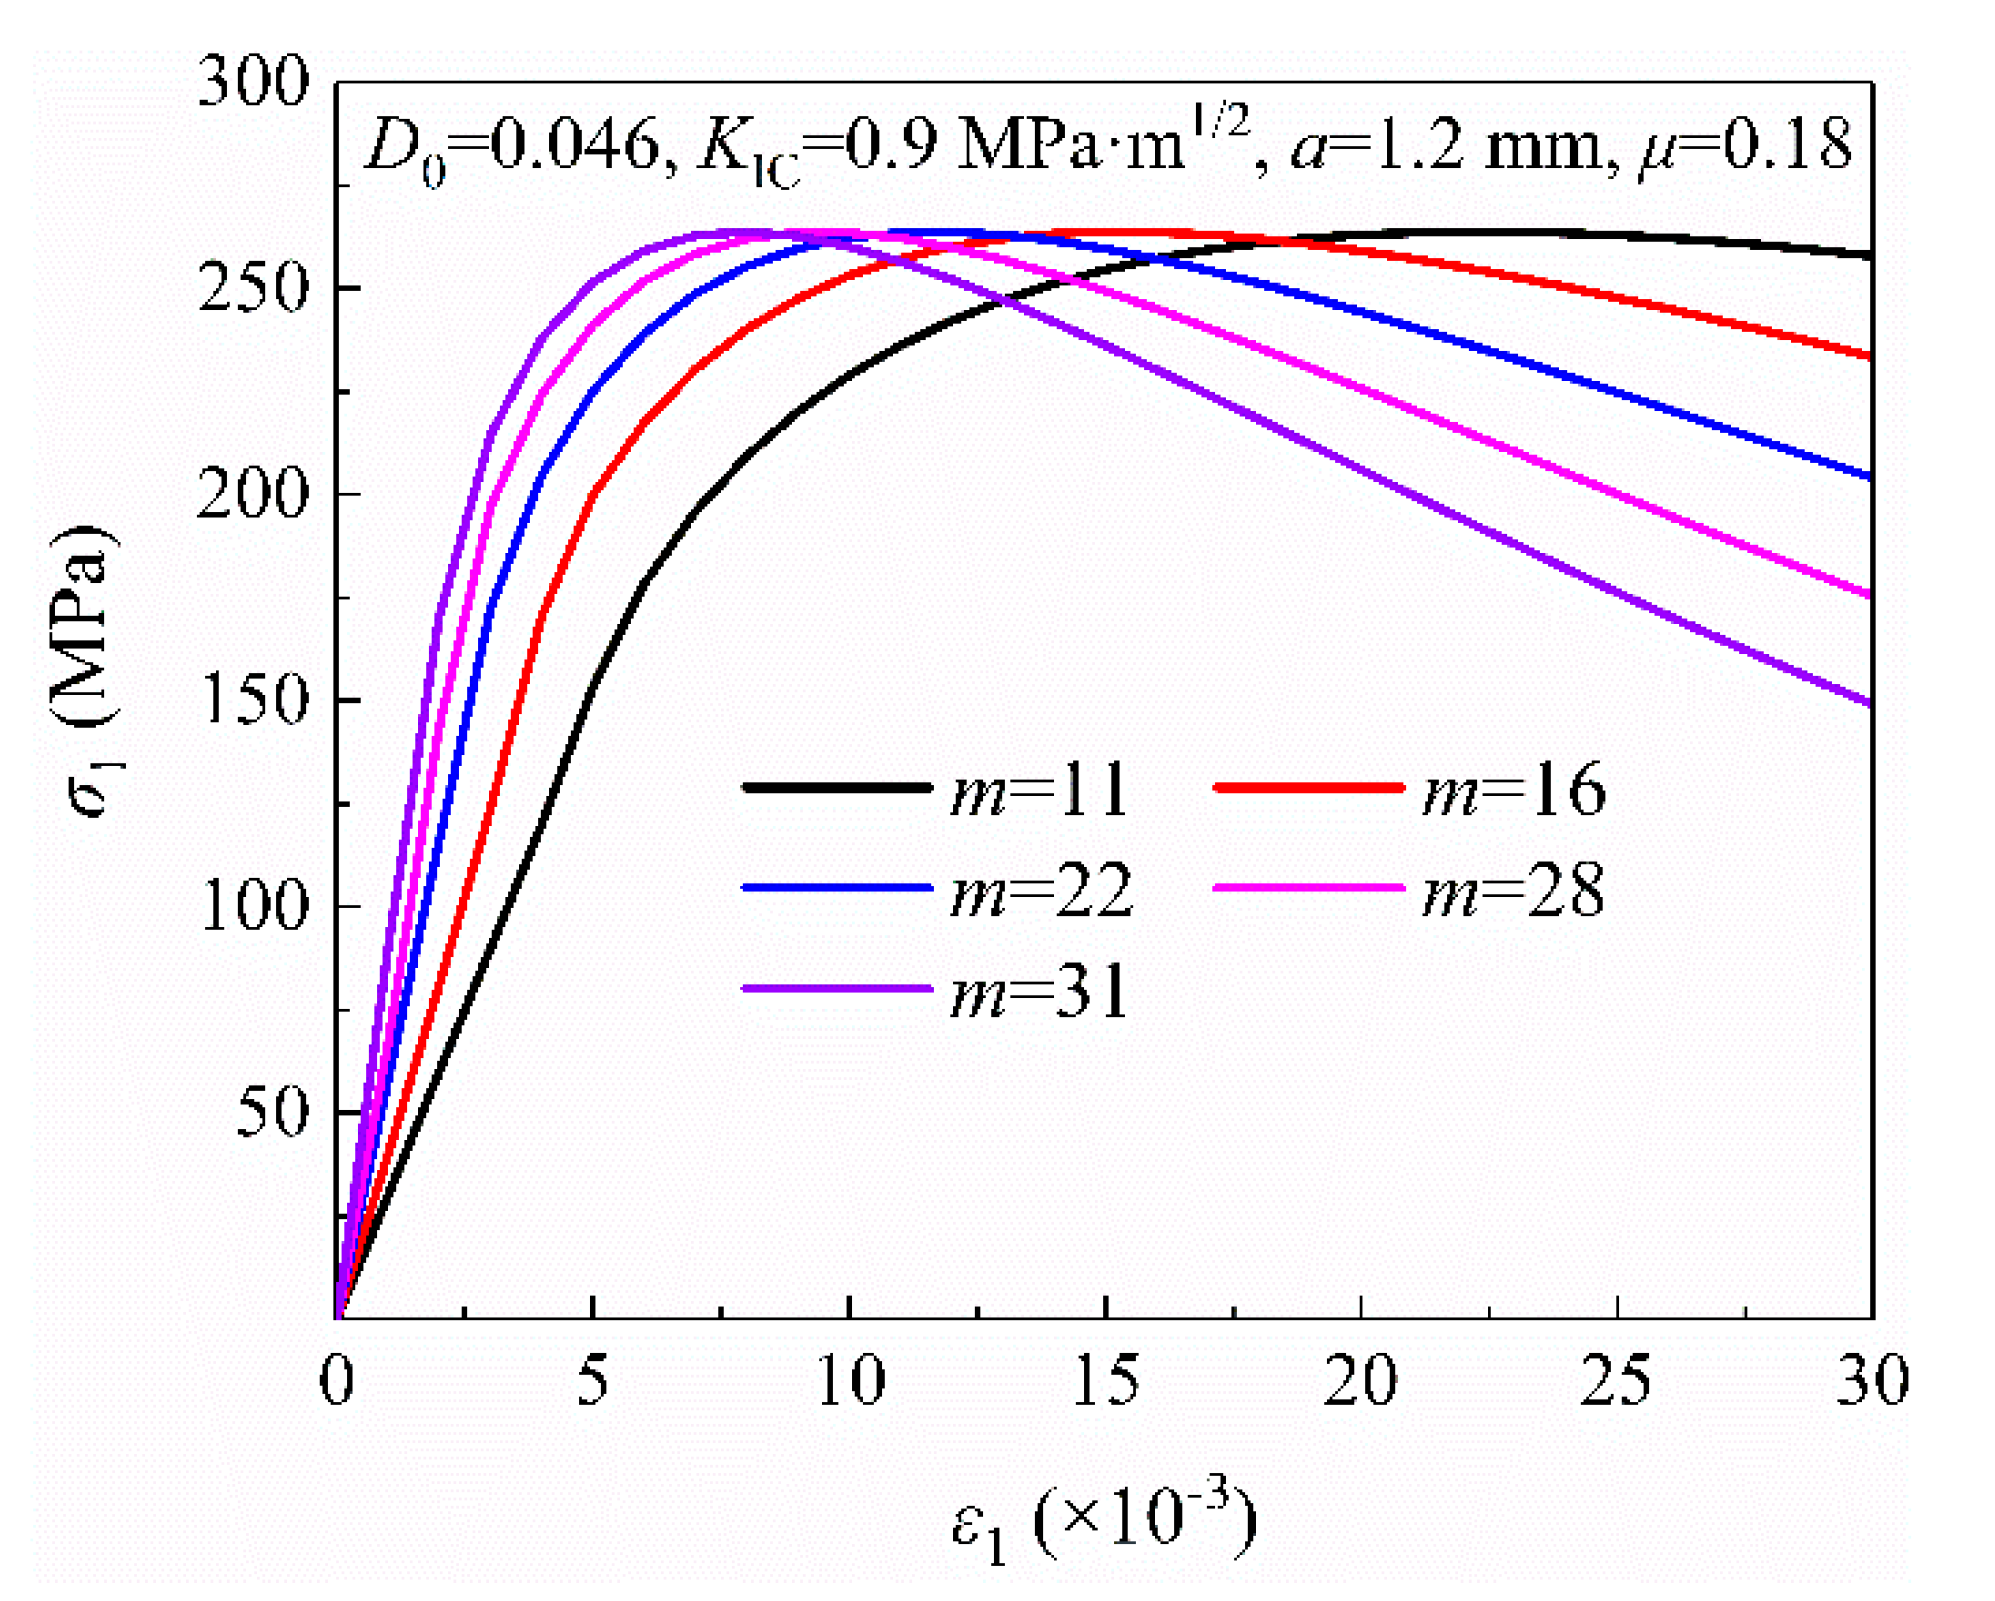
5.2. Effect of Parameter m on Stress–Strain Relationship

It can be observed from Figure 13 that the change of parameter m has little effect on the peak stress. The peak strain corresponding to the peak stress decreases gradually with the increase in the value m. The change in the value m has a great influence on the shape of the stress–strain curves. The slope of the stress–strain curve before the peak stress gradually increases with the increase in the value m, indicating that rate of increase in the axial stress gradually increase. Moreover, the stress–strain curves after the peak stress gradually become steeper, indicating that the rate of decrease in the axial stress gradually increase. Therefore, the parameter m can be used to reflect the brittleness and ductility of rock materials to a certain extent. The larger the parameter m, the more brittle the rock becomes.

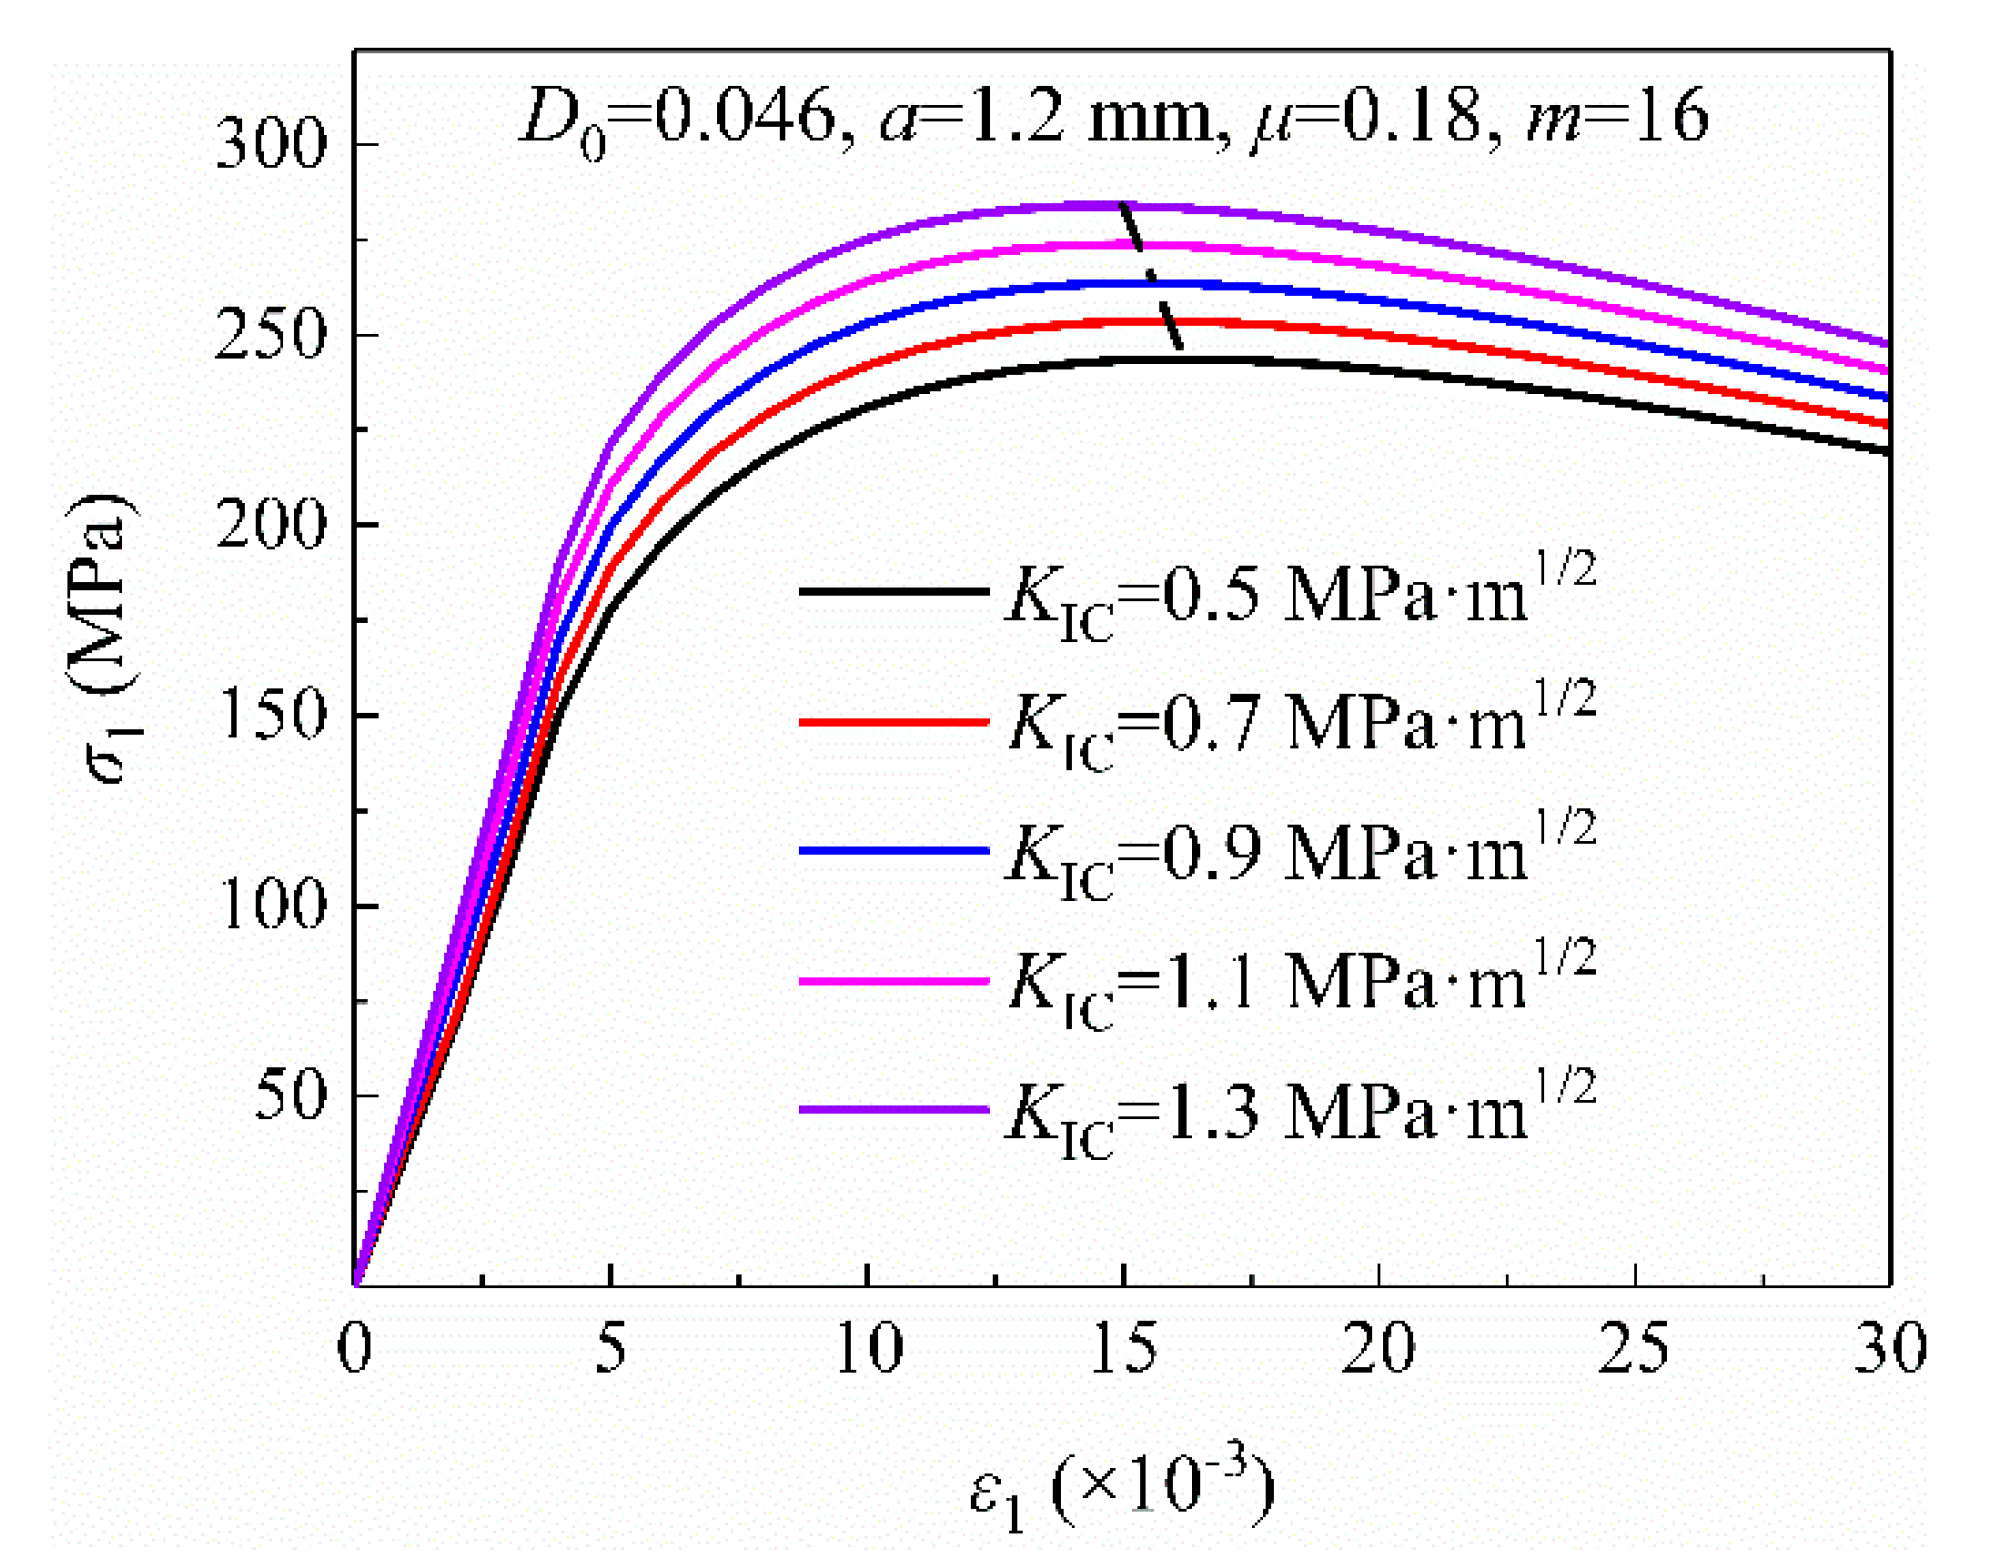
5.3. Effect of Fracture Toughness KIC on Stress–Strain Relationship

It can be observed from Figure 14 that the axial stress increases with the increase of fracture toughness KIC at the given strain. According to fracture mechanics, when the fracture toughness KIC of rock increases, the stress intensity factor KI at the wing crack tip must increase in order to make microcrack propagate. Therefore, the compressive stress must increase accordingly, that is, the peak strength of rock increases. The peak strain corresponding to the peak stress decreases with the increase of the fracture toughness KIC.

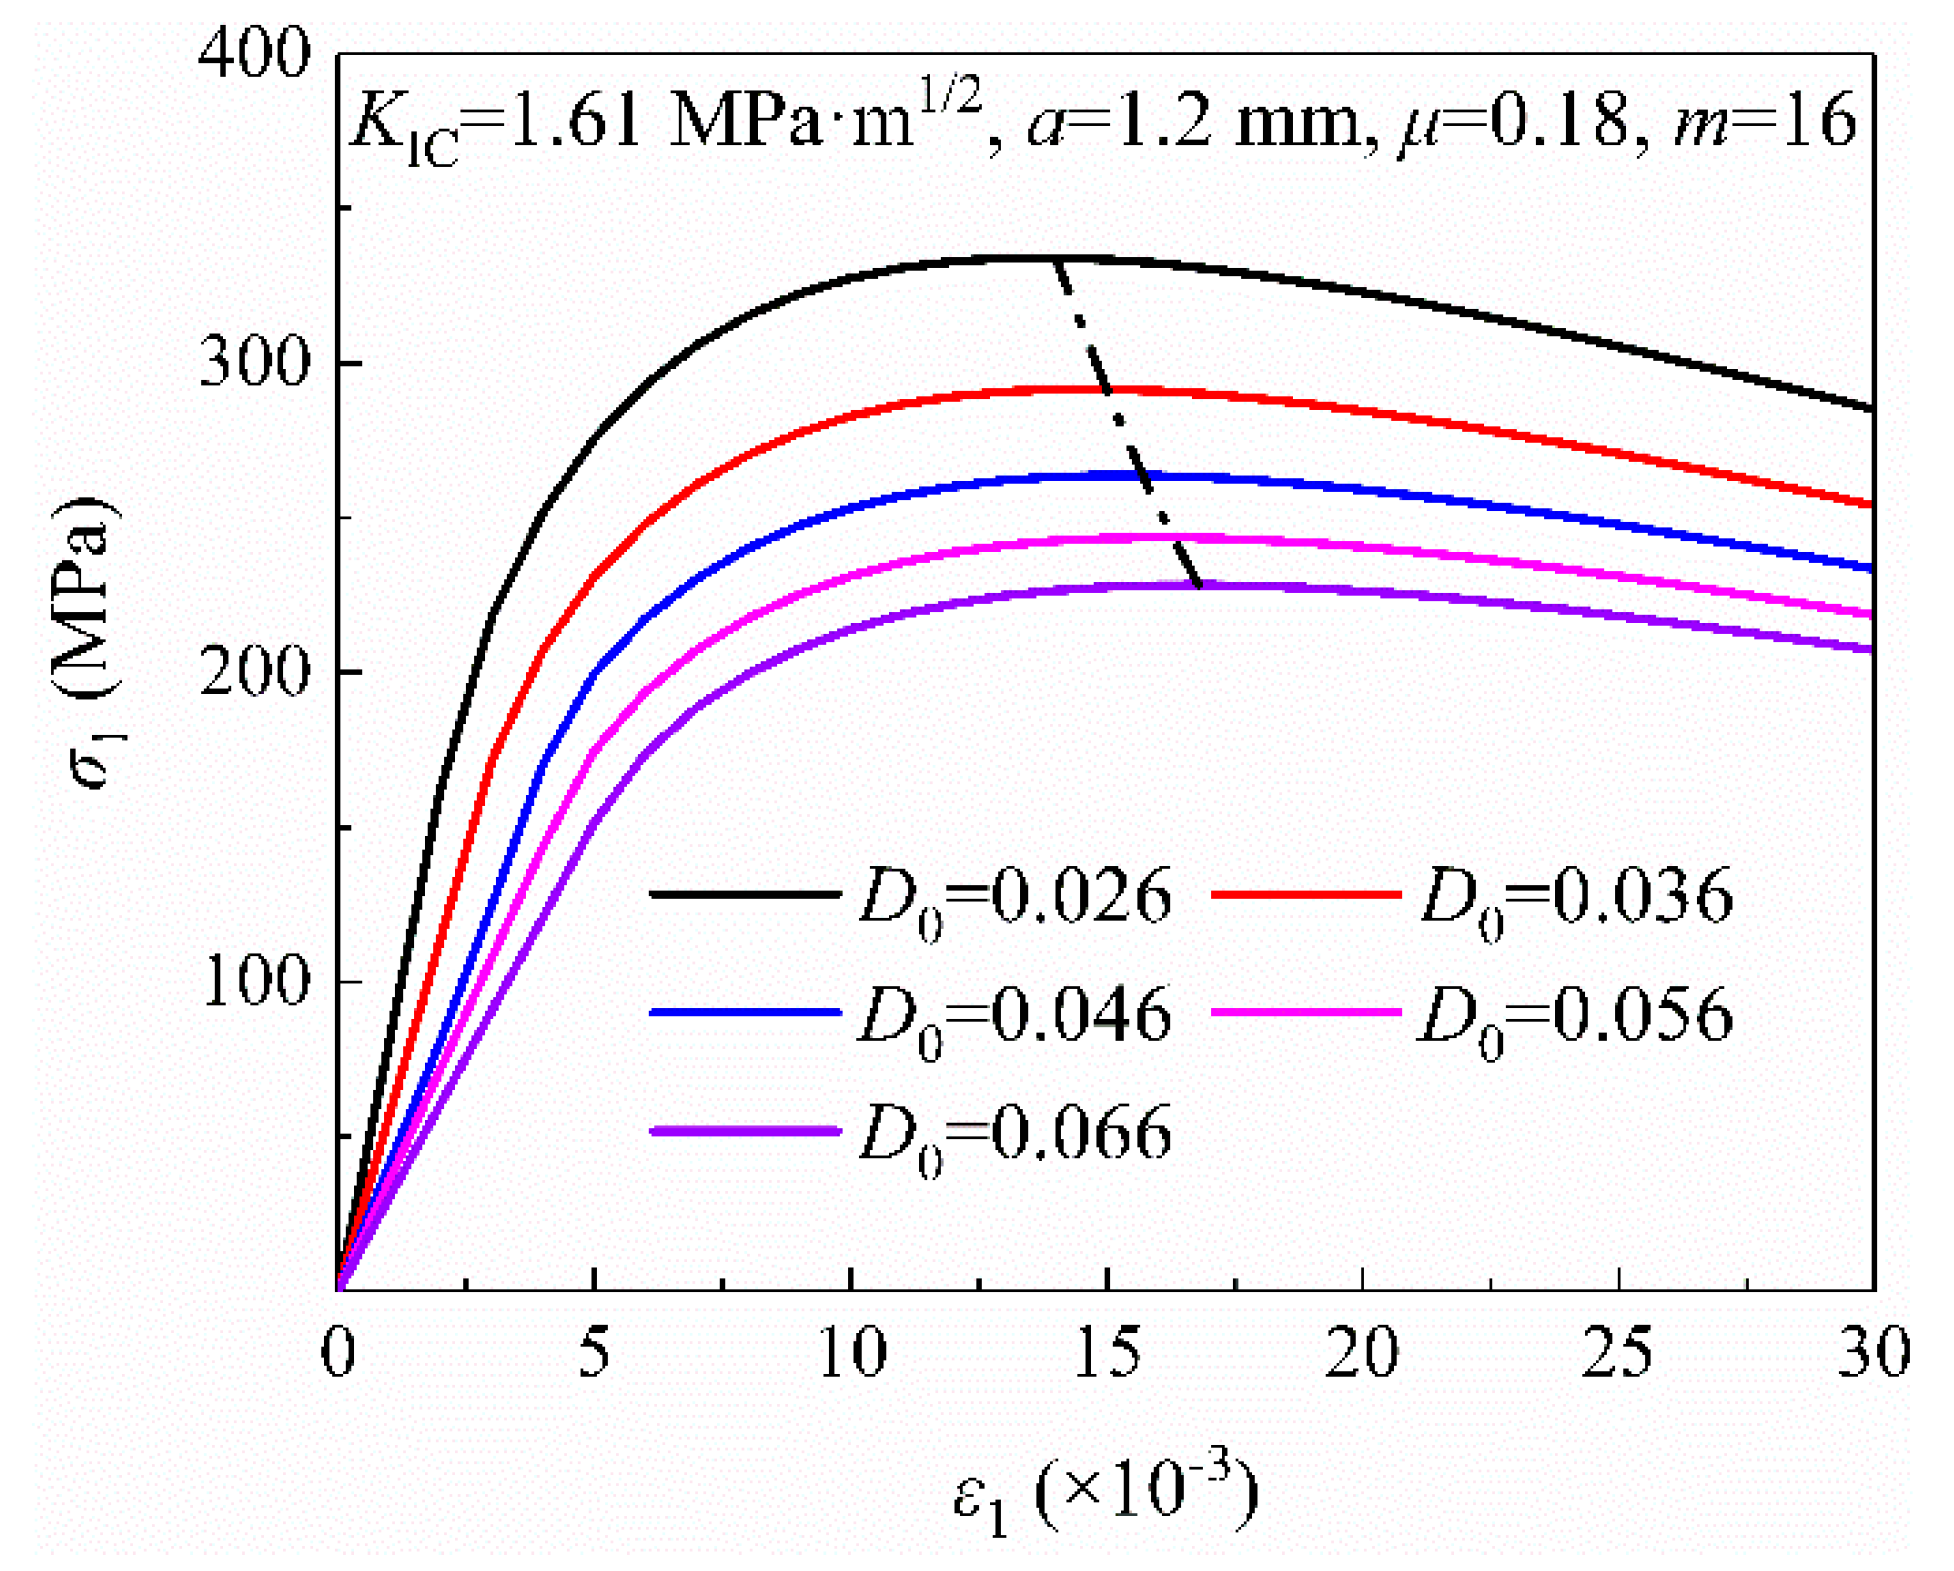
5.4. Effect of Initial Damage D0 on Stress–Strain Relationship

It can be observed from Figure 15 that the axial stress decreases with the increase of initial damage D0 at the given strain. As is known, rock materials contain numerous initial microcracks, which makes it have initial damage. When the initial microcrack size is constant, the greater the number of microcracks in rock sample, the larger initial damage. With the increase of initial damage D0, the bearing capacity of rock gradually decrease. Therefore, the compressive strength of rock decreases. The peak strain corresponding to the peak stress increases with the increase of the initial damage D0.

6. Conclusions

In this work, a new calculation model for the mode-I stress intensity factor KI at wing crack tip was proposed and a corresponding damage constitutive model was also established. Based on theoretical and experimental studies, the following conclusions can be drawn:
(1)
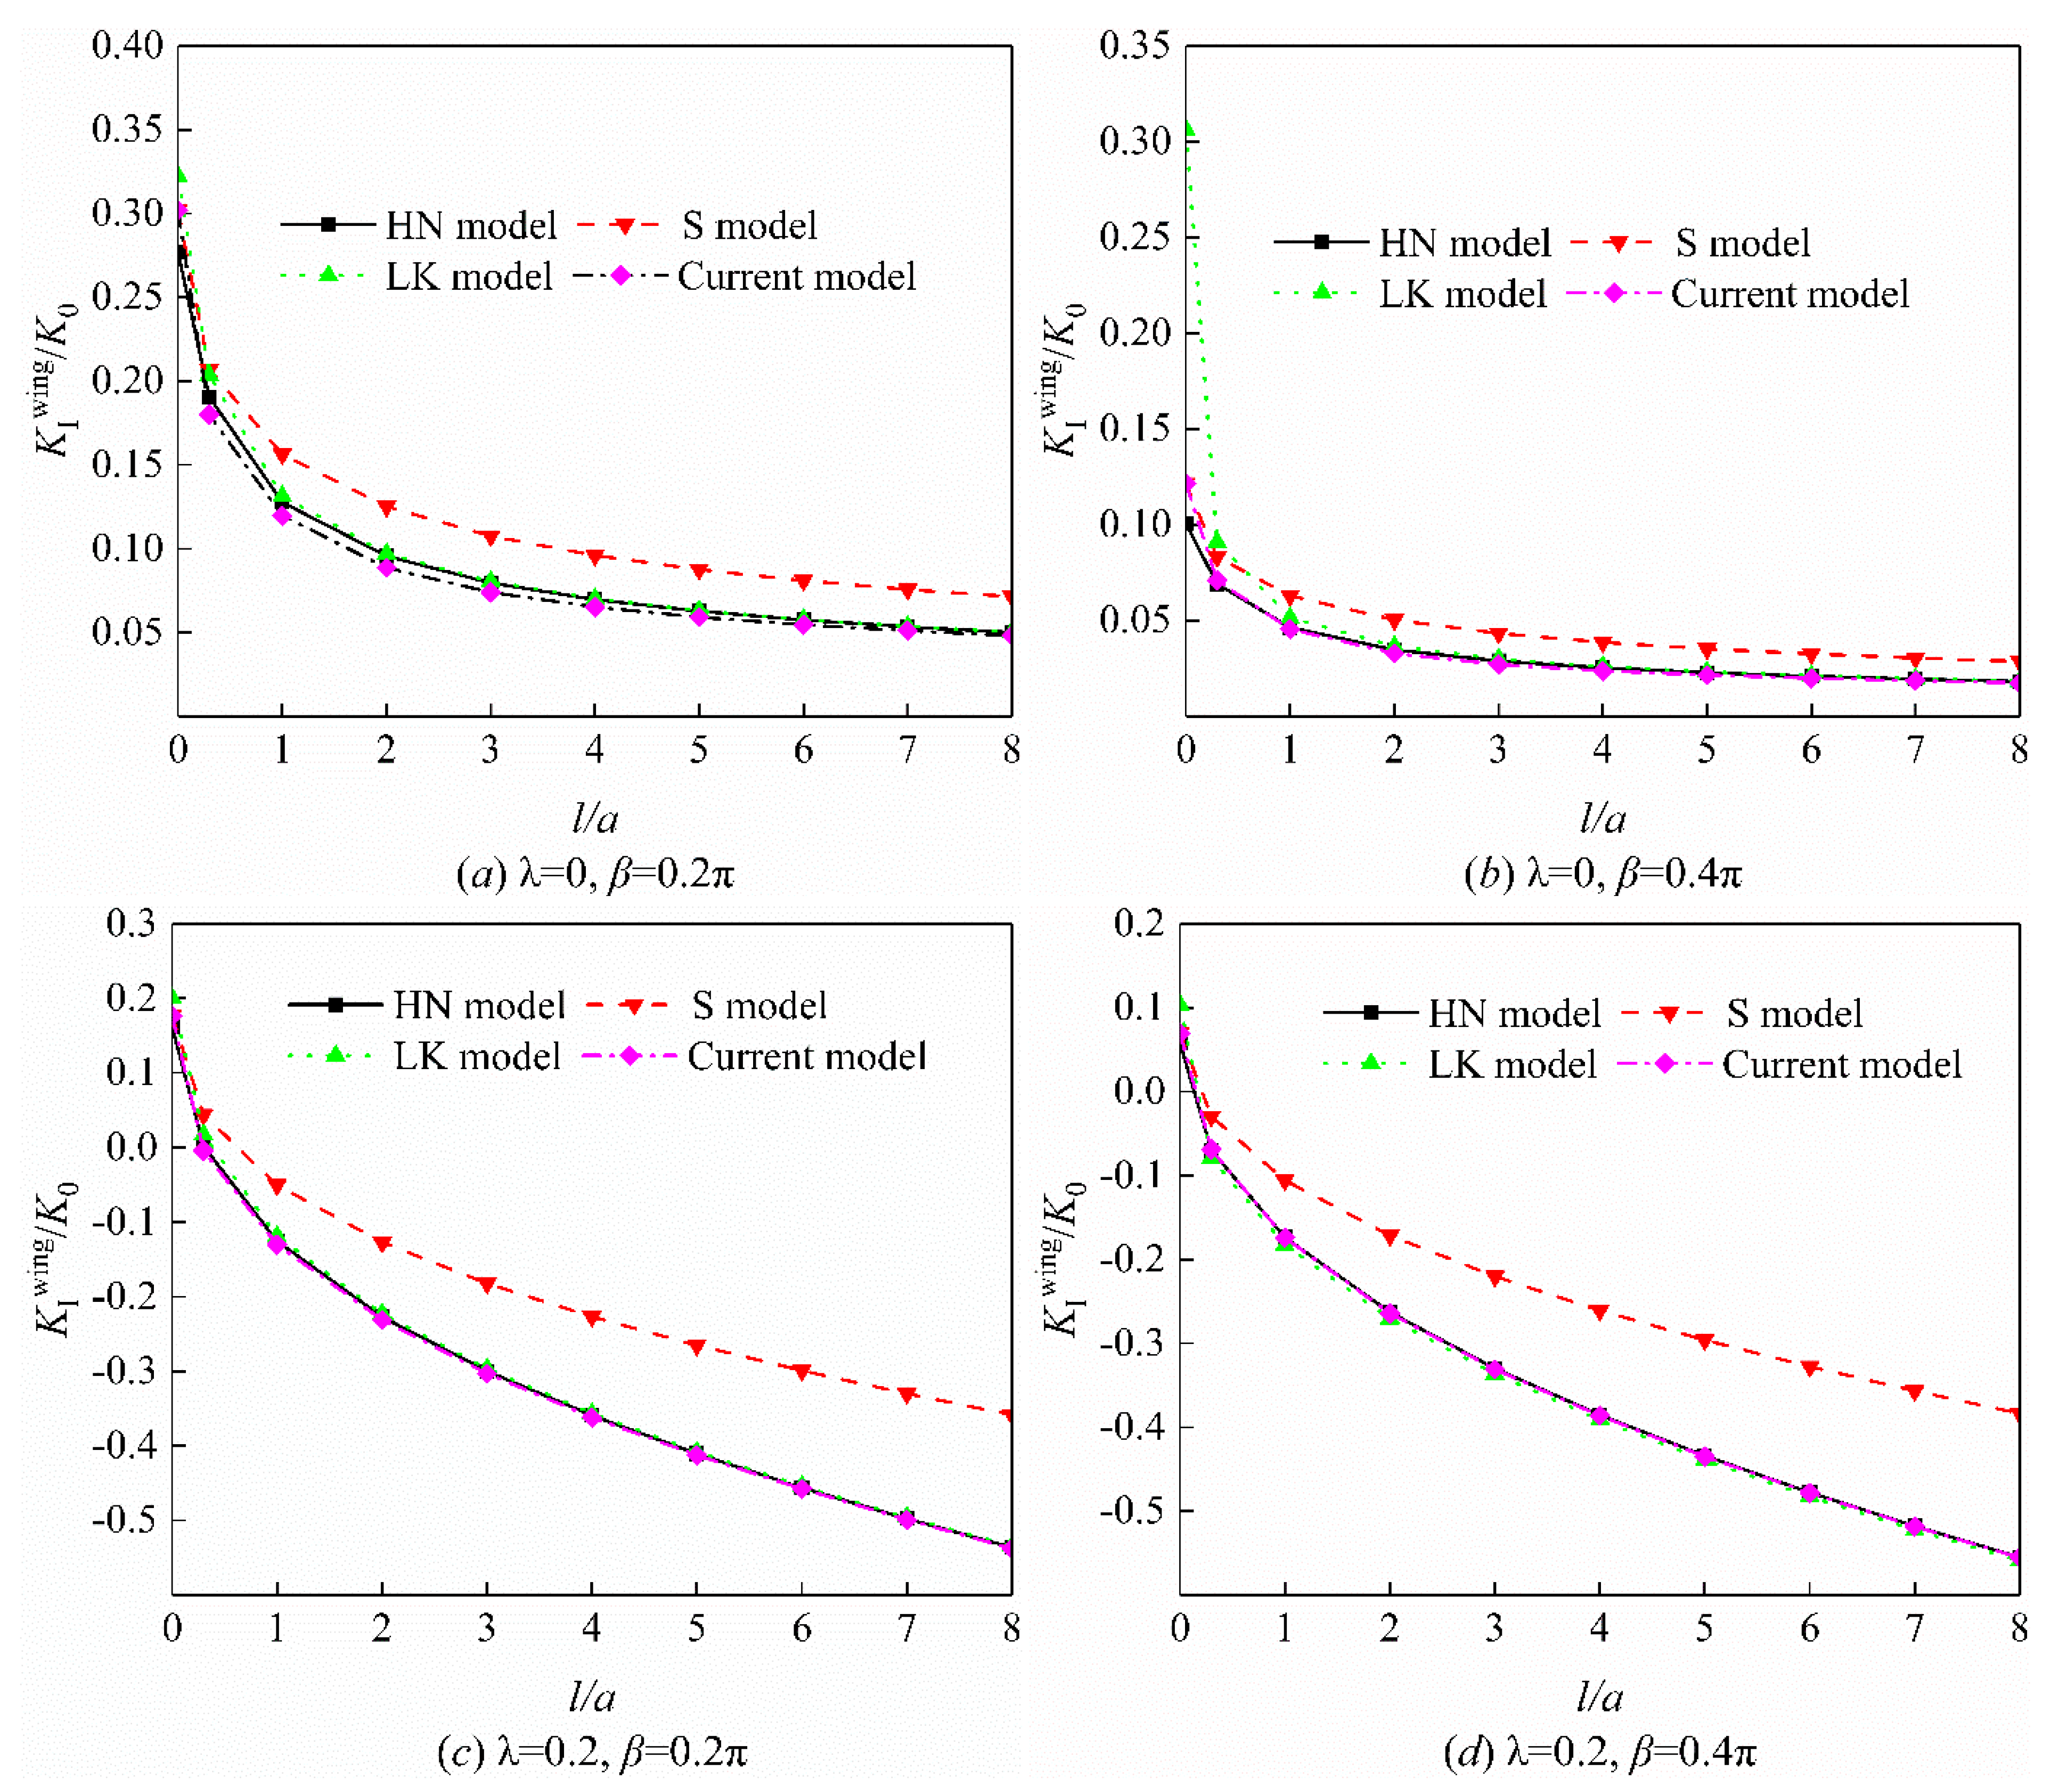
Through studying the cracking and propagation laws of compressive–shear rock cracks under remote stress field, a new calculation model for the mode-I stress intensity factor KI at wing crack tip was proposed considering the interaction of wing cracks and the additional stress caused by rock bridge damage. The results showed that compared with the classical model proposed by Horii and Nemat-Nasser [2] (i.e., Equation (1)), the proposed calculation model can accurately predict the cracking angle of wing crack. Compared with S model (i.e., Equation (4)), when the equivalent crack propagation length is long, the proposed criterion has a higher accuracy than the Equation (4). Compared with LK model (i.e., Equation (5)), when the equivalent crack propagation length is short (l/a < 1), the prediction accuracy of this model is higher than that of Equation (5). In conclusion, the proposed calculation model can simulate the whole range of variation of wing crack length from being extremely short to very long.
(2)
Based on the modified calculation model for the mode-I stress intensity factor KI, a homogenization method is used to establish the macro–micro damage model for rock materials by combining the relationship between microcrack growth and macroscopic strain. By comparing the test curves with the theoretical curves, the results show that the proposed damage constitutive model can both simulate stress–strain response in the failure process of the sandstone samples, and identify the peak strength of rock well. Furthermore, comparing experimental and theoretical relations between crack initiation stress and confining pressure, model parameters (i.e., μ, a, and β) hardly measured by test are solved. The proposed macro–micro damage model based on micromechanics can continuously describe the relationship between stress–strain curve for rock materials, which provides a simple and easy method to study the effect of microcrack growth on the progressive failure process of rock under compression loading.
(3)
Effects of initial microcrack size, microcrack friction coefficient, fracture toughness, initial damage and parameter m on the stress–strain relationship are studied. It was found that with the increase in the value m, the peak compressive strength of rock remains unchanged, and the corresponding peak strain decreases gradually. Parameter m can be used to reflect the brittleness and ductility of rock materials to a certain extent. The peak compressive strength of rock increases with the increase of microcrack friction coefficient and fracture toughness. However, the peak strength of rock decreases with the increase of initial microcrack size and initial damage.

Author Contributions

Conceptualization, Z.P.; and Y.Z.; methodology, Z.P.; software, Z.P. and S.C.; validation, Z.P. and X.C.; formal analysis, Z.P.; investigation, Z.P.; resources, Z.P. and Y.Z.; data curation, Z.P.; writing—original draft preparation, Z.P.; writing—review and editing, Z.P. and Y.Z.; visualization, Z.P.; supervision, Z.P. and Y.Z.; project administration, Y.Z.; funding acquisition, Y.Z.; All authors have read and agreed to the published version of the manuscript.

Funding

This study was financially funded by “The National Natural Science Foundation of China (No. 41772308)”. We would like to express our sincere appreciations to the anonymous reviewers for many valuable suggestions.

Institutional Review Board Statement

Not applicable.

Informed Consent Statement

Not applicable.

Data Availability Statement

Data are available upon request.

Conflicts of Interest

The authors declare no conflict of interest.

References

  1. Horri, H.; Nemat-Nasser, S. Compression-induced micro-crack growth in brittle solids. Axial splitting and shear failure. J. Geophys. Res. 1985, 90, 3105–3125. [Google Scholar] [CrossRef]
  2. Horii, H.; Nemat-Nasser, S. Brittle Failure in Compression: Splitting, Faulting and Brittle-Ductile Transition. Phil. Trans. Roy. Soc. 1986, 319, 337–374. [Google Scholar]
  3. Ashby, M.F.; Hallam, S.D. The failure of brittle solids containing small cracks under compressive stress states. Acta. Metall. 1986, 34, 497–510. [Google Scholar] [CrossRef]
  4. Cao, W.G.; Tan, X.; Zhang, C.; He, M. Constitutive model to simulate full deformation and failure process for rocks considering initial compression and residual strength behaviors. Can. Geotech. J. 2019, 37, 649–661. [Google Scholar] [CrossRef]
  5. Liu, G.; Jiang, Q.H.; Xiong, F. Experimental study of crack propagation and deformation failure of multiple-jointed rock mass. Rock Soil Mech. 2016, 37, 151–158. [Google Scholar]
  6. Zhang, H.M.; Meng, X.Z.; Yang, G.S. A study on mechanical properties and damage model of rock subjected to freeze-thaw cycles and confining pressure. Cold Reg. Sci. Technol. 2020, 174, 103056. [Google Scholar] [CrossRef]
  7. Zhu, W.S.; Zhang, Q.Y. Brittle elastic fracture damage constitutive model of jointed rockmass and its application to engineering. Chin. J. Rock Mech. Eng. 1990, 18, 245–249. [Google Scholar]
  8. Chen, W.Z.; Li, S.C.; Qiu, X.B.; Zhu, W.S. Fracture-damage coupled model of jointed rock mass and its application to stability of large underground caverns. Rock Soil Mech. 2002, 23, 288–291. [Google Scholar]
  9. Li, S.C.; Li, S.C.; Zhu, W.S.; Chen, W.Z.; Qiu, X.B. Fracture-damage stability analysis of underground powerhouse in right bank of Three Gorges. Rock Soil Mech. 2000, 21, 193–197. [Google Scholar]
  10. Wu, X.Y.; Baud, P.; Wong, T.F. Micromechanics of compressive failure and spatial evolution of anisotropic damage in Darley Dale sandstone. Int. J. Rock Mech. Min. Sci. 2000, 37, 143–160. [Google Scholar] [CrossRef]
  11. Zhu, Z.D.; Huang, Q.; Wang, J.B.; Shao, J.F.; Wang, W. Mesoscopic experiment on degradation evolution of rock deformation and its meso-damage mechanical model. Chin. J. Rock Mech. Eng. 2013, 32, 1167–1175. [Google Scholar]
  12. Zhou, X.P. Triaxial compressive behavior of rock with mesoscopic heterogenous behavior: Strain energy density factor approach. Theor. Appl. Fract. Mech. 2006, 45, 46–63. [Google Scholar] [CrossRef]
  13. Huang, C.; Subhash, G.; Vitton, S.J. A dynamic damage growth model for uniaxial compressive response of rock aggregates. Mech. Mater. 2002, 34, 267–277. [Google Scholar] [CrossRef]
  14. Li, H.B.; Zhao, J.; Li, T.J. Micromechanical modelling of the mechanical properties of a granite under dynamic uniaxial compressive loads. Int. J. Rock Mech. Min. Sci. 2000, 37, 923–935. [Google Scholar] [CrossRef]
  15. Li, H.B.; Zhao, J.; Li, T.J.; Yuan, J.X. Analytical simulation of the dynamic compressive strength of a granite using the sliding crack model. Int. J. Numer. Anal. Meth. Geomech. 2001, 25, 853–869. [Google Scholar] [CrossRef]
  16. Ashby, M.F.; Sammis, C.G. The damage mechanics of brittle solids in compression. Pure. Appl. Geophys. 1990, 133, 489–521. [Google Scholar] [CrossRef]
  17. Li, X.Z.; Shao, Z.S.; Fan, L.F. A micro-macro method for predicting the shear strength of brittle rock under compressive loading. Mech. Res. Commun. 2016, 75, 13–19. [Google Scholar] [CrossRef]
  18. Li, X.Z.; Qi, C.Z.; Shao, Z.S.; Xia, C. Effects of crack inclination on shear failure of brittle geomaterials under compression. Arab. J. Geosci. 2017, 10, 529. [Google Scholar] [CrossRef]
  19. Steif, P.S. Crack extension under compressive loading. Eng. Fract. Mech. 1984, 20, 463–473. [Google Scholar] [CrossRef]
  20. Lehner, F.; Kachanov, M. On modeling of "winged" cracks forming under compression. Int. J. Fract. 1996, 77, 65–75. [Google Scholar] [CrossRef]
  21. Zhou, J.W.; Xu, W.Y.; Yang, X.G. A microcrack damage model for brittle rocks under uniaxial compression. Mech. Res. Commun. 2010, 37, 399–405. [Google Scholar] [CrossRef]
  22. Zhou, X.P.; Yang, H.Q. Micromechanical modeling of dynamic compressive responses of mesoscopic heterogenous brittle rock. Theor. Appl. Fract. Mech. 2007, 48, 1–20. [Google Scholar] [CrossRef]
  23. Baud, P.; Reuschle, T.; Charlez, P. An improved wing crack model for the deformation and failure of rock in compression. Int. J. Rock Mech. Min. Sci. 1996, 33, 539–542. [Google Scholar] [CrossRef]
  24. Sih, G. Handbook of Stress Intensity Factors; Lehigh University: Bethlehem, PA, USA, 1973. [Google Scholar]
  25. Cotterell, B.; Rice, J.R. Slightly curved or kinked cracks. Int. J. Fract. 1980, 16, 155–169. [Google Scholar] [CrossRef]
  26. Weibull, W. A statistical distribution function of wide applicability. J. Appl. Mech. 1951, 18, 293–297. [Google Scholar] [CrossRef]
  27. Chen, Z.H.; Tang, C.A.; Huang, R.Q. A double rock sample model for rockbursts. Int. J. Rock Mech. Min. Sci. 1997, 34, 991–1000. [Google Scholar] [CrossRef]
  28. Kachanov, M.L. A microcrack model of rock inelasticity part II: Propagation of microcracks. Mech. Mater. 1982, 1, 29–41. [Google Scholar] [CrossRef]
  29. Bhat, H.S.; Sammis, C.G.; Rosakis, A.J. The micromechanics of Westerley granite at large compressive loads. Pure. Appl. Geophys. 2011, 168, 2181–2198. [Google Scholar] [CrossRef] [Green Version]
  30. Yang, J.H.; Zhang, W.J.; Lu, W.B.; Chen, M.; Yan, P. Cracking mechanism of surrounding rock induced by release of excavation load in deep tunnel. Chin. J. Rock Mech. Eng. 2013, 32, 1222–1228. [Google Scholar]
  31. Martin, C.D.; Chandler, N.A. The progressive fracture of Lac du Bonnet granite. Int. J. Rock Mech. Min. Sci. 1944, 31, 643–659. [Google Scholar] [CrossRef]
  32. Zhu, Z.Q.; Sheng, Q.; Leng, X.L.; Zhang, Z.R. Study on crack initiation mechanism of three gorges granite. Chin. J. Rock Mech. Eng. 2007, 26, 2570–2575. [Google Scholar]
  33. Wang, B.; Zhu, J.B.; Wu, A.Q.; Hu, J.M.; Xiong, Z.M. Experimental study on mechanical properties of jinping marble under loading and unloading stress paths. Chin. J. Rock Mech. Eng. 2008, 27, 2138–2145. [Google Scholar]
  34. Li, X.Z.; Shao, Z.S. Micro–macro modeling of brittle creep and progressive failure subjected to compressive loading in rock. Environ. Earth Sci. 2016, 75, 583. [Google Scholar] [CrossRef]
  35. Li, X.Z.; Shao, Z.S. Investigation of Macroscopic Brittle Creep Failure Caused by Microcrack Growth under Step Loading and Unloading in Rocks. Rock Mech. Rock Eng. 2016, 49, 2581–2593. [Google Scholar] [CrossRef]
Figure 1. Wing crack model.
Applsci 11 12154 g001
Figure 2. Schematic diagram of the superposition technique used to calculate the K I wing at wing crack tip subjected to far field stress: (a) K I wing at the wing crack tip; (b) K I i sol for the straight wing crack of common length 2l; and (c) K I infl due to effective shear stress.
Applsci 11 12154 g002
Figure 3. Simplification of the wing crack with τeff acting on the main crack; (a) K I infl due to effective shear stress; (b) corresponding simplified diagram.
Applsci 11 12154 g003
Figure 4. Stress intensity factors computed by different models; (a) λ=0, l/a=0.0001; (b) λ=0.2, l/a=0.0001; (c) λ=0, l/a=1; (d) λ=0.2, l/a=1.
Applsci 11 12154 g004
Figure 5. Relationships between dimensionless stress intensity factor and equivalent crack propagation length: (a) λ = 0, β = 0.2π; (b) λ = 0, β = 0.4π; (c) λ = 0.2, β = 0.2π; (d) λ = 0.2, β = 0.4π.
Applsci 11 12154 g005
Figure 6. Sketch of interaction of multiple-cracks.
Applsci 11 12154 g006
Figure 7. Failure modes of the red sandstone samples: (a) uniaxial compression; (b) triaxial compression.
Applsci 11 12154 g007
Figure 8. Theoretical and experimental stress-strain curves under different confining pressures.
Applsci 11 12154 g008
Figure 9. Relationships between crack initiation stress, peak stress and confining pressures in experimental and theoretical results.
Applsci 11 12154 g009
Figure 10. Comparison of theoretical and experimental stress-strain curves under different confining pressures. (a) Theoretical and experimental stress-strain curves of granite. (b) Theoretical and experimental stress-strain curves of Jinping marble.
Applsci 11 12154 g010
Figure 11. Effects of initial crack size on stress-strain relationship.
Applsci 11 12154 g011
Figure 12. Effects of friction coefficient on stress-strain relationship.
Applsci 11 12154 g012
Figure 13. Effects of parameter m on stress-strain relationship.
Applsci 11 12154 g013
Figure 14. Effects of fracture toughness KIC on stress-strain relationship.
Applsci 11 12154 g014
Figure 15. Effect of initial damage D0 on stress-strain relationship.
Applsci 11 12154 g015
Publisher’s Note: MDPI stays neutral with regard to jurisdictional claims in published maps and institutional affiliations.

