Article

A Test Method for Acoustic Emission Properties of Natural Cellulose Fiber-Reinforced Composites

1
Department of Technical Textiles, College of Textiles, Donghua University, Shanghai 201620, China
2
Department of Vehicle Engineering, School of Mechanical and Automotive Engineering, Shanghai University of Engineering Science, Shanghai 201620, China
3
Department of Textile Engineering, College of Textiles and Apparel, Quanzhou Normal University, Quanzhou 362000, China
*
Author to whom correspondence should be addressed.
Appl. Sci. 2021, 11(24), 12067; https://doi.org/10.3390/app112412067
Submission received: 31 October 2021 / Revised: 11 December 2021 / Accepted: 13 December 2021 / Published: 17 December 2021

Abstract

:
To test the acoustic performance of fiber-reinforced composites for replacing wood, an acoustic vibration test method is developed. For evaluation of the test method, composites are manufactured using hemp and ramie embedded in epoxy, through vacuum-assisted resin infusion molding. The effects of the most important factors, i.e., impulse, relative humidity (RH), and specimen thickness, on the acoustic vibration response of the composites are systematically studied. The magnitudes of the impulses, represented by different masses of the dropping balls, seem to have little influence on the shapes of the acoustic vibration curves, although the intensity of the spectra increases as the impulse increases. The RH influences the spectrum shape significantly due to variation in the Young’s modulus and density of the material upon absorption of moisture. The specimen thickness also greatly affects the testing results. The specific dynamic modulus, acoustic radiation damping coefficient, and acoustic impedance change a little as the impulse magnitude and RH change, but decrease substantially as the specimen thickness increases. The specific dynamic modulus can be linearly correlated with the flexural modulus of a material.

1. Introduction

The acoustic properties of fibrous materials and fiber-reinforced composites have been extensively studied for the purpose of sound insulation and absorption [1,2,3,4,5,6,7]. Dunne et al. [8] give a thorough review on the sound absorption properties and available empirical models for fibrous materials. Rosa and coworkers [9] published a literature review on acoustic emission for monitoring the mechanical behavior of natural fiber composites. Reboul and coworkers [10] used acoustic emission monitoring to conduct research on textile-reinforced cementitious composites (TRC). Kalteremidou and coworkers [11] used digital image correlation and acoustic emission technology to test the carbon fiber epoxy hollow beam components. Liang and coworkers [12] used a combination of X-ray micro-computed tomography (Micro-CT), acoustic emission (AE), and digital image correlation (DIC) techniques to evaluate the damage initiation/evolution of hybrid 3D woven composites. However, these all use acoustic emission to evaluate the damage process of the materials. Few studies have focused on the acoustic performance of materials themselves. Due to environmental concerns, wood harvesting is more and more restrictively regulated around the world [13,14]. Therefore, much effort has been made to develop alternative materials, especially fiber-reinforced composites, to replace wood for musical instruments [13,14,15,16,17,18], for which acoustic emission properties are critically important. Jalili and coworkers [16] have studied the acoustic emissions from carbon, glass, and hemp fiber-reinforced composites for the purpose of manufacturing musical instruments. They reported that the hemp fiber-reinforced unsaturated polyester composites had acoustic properties closest to those of poplar, walnut and beech wood specimens. However, no scientifically sound method has been reported for testing the acoustic emission properties of composite materials, specifically for percussion musical instruments, which are often assessed by musicians’ subjective evaluations. Two types of testing methods are adopted in the literature [16,17], which used hammers and a steel ball for inducing vibration to the specimens. The material of the hammer and the impact magnitude of the steel ball are not well defined, thus the results may not be reproducible. Therefore, designing a scientifically sound, easy-to-use, and highly repeatable method for acoustic vibration tests of composites for percussion musical instruments could be critically important for material evaluation, selection, and improvement. In this study, a simple and repeatable acoustic vibration test method is proposed and systematically studied. Hemp and ramie fiber-reinforced epoxy-based composites were selected as typical materials for studying how the impulse magnitude, relative humidity (RH), and specimen thickness influence the experimental results. For most of the physical test methods, the dimensions of the specimen and the test environment are the most important factors that have to be defined or fixed for comparison purposes. Thus, we have to determine how these factors may influence the test results. Other factors, such as temperature, may also influence the results, but may not be as important as the former factors. In fact, the influence of temperature on the mechanical properties of a hygroscopic material can be equivalent to that of moisture absorption with a ratio of 15 °C/% [19]. Hemp and ramie are selected as reinforcing materials and epoxy is used as the matrix to prepare cellulose fabric/epoxy composites by vacuum-assisted resin infusion molding (VARIM), for evaluation of the test method. Cellulose fibers have the closest physical and mechanical properties to wood among all the reinforcement fibers in the composite industry.

2. Experiments

2.1. Materials

Hemp and ramie fabrics were provided by Yuyue Home Textile Co., Ltd. (Shandong, China). The fundamental parameters of these two fabrics are listed in Table 1. The epoxy resin (ML-5417A) and the curing agent (ML-5417B) were provided by Huibai New Materials Technology Co., Ltd. (Shanghai, China). The fabrics were impregnated in the resin using VARIM and then cured at 80 °C for 4 h. The mass ratio of the epoxy resin to the curing agent was 10:3. The cross-sections of the composite specimens of different layers are shown in Figure 1.

2.2. Acoustic Vibration Test Device

The schematic of the testing system is illustrated in Figure 2. The key issues in the testing system design are specimen fixing and vibration impulsion selection.

2.2.1. Specimen Fixing

Two typical methods for fixing the specimen are one with free boundary conditions and the other with fixed boundary conditions. If the test specimen is large, fixed boundary conditions are preferred, while for a small specimen, free boundary conditions are preferable due to potential external factors that can influence testing results. In the current study, small specimens were used for development of materials and thus, free boundary conditions were adopted.
For the case of free boundary conditions, the specimen should be completely isolated from the environment by hanging it with a string such that the specimen can vibrate in all modes. Two factors are considered for the system, namely, the positions of the hanging strings on the specimen and the natural frequency of the system determined by the length and the stiffness of the string. The position where the string was tied to the suspended specimen should not interfere with any form of vibration. The distance between the hanging points and the near end of the specimen must be 0.224 L, in which L is the length of the specimen (Figure 2) according to the literature [20]. If the whole system is considered as a spring with the mass of the specimen, the spring constant, K, is inversely proportional to the length and positively proportional to the stiffness of the string as follows [21]:
K = F Δ x = 2 π R 2 σ σ E L 0 = 2 π R 2 E L 0
where F is the force applied, Δx is the extension of the string, σ is the stress, R is the radius of the string, E is the Young’s modulus of the string and L0 is the length of the string.
The natural frequency, f0, of the system is as follows:
f 0 = 1 2 π K m = E R 2 π L 0 m
where m is the mass of the specimen. The criteria for selection of the string length and stiffness are in place to ensure that the natural frequency of the system is far away from the vibrational frequency of the specimen being tested. In the current study, a polylactic acid string (19.5 tex) with a Young’s modulus of about 3 GPa and a length of 150 mm was used to hang the specimen. The calculated system natural frequency was in the range of 30–50 Hz, which is indeed far away from the frequency of the acoustic waves (200–5000 Hz) emitted from the composite samples.

2.2.2. Induction of Vibration

There are two ways to impose vibration to the specimen: forced vibration and free vibration. The end use of the composites is for drums or percussion instruments in which the vibration is induced by a stick knocking at the wall or the membrane, which is closer to a free vibration condition. In free vibration, the test specimen is excited by an impact force and vibrates until all the energy is consumed. The stimulation method for this purpose is usually knocking the specimen with a hammer, which could be hard to control. In order to improve the consistency of the test, in the current study, a small steel ball with a constant mass was dropped from a fixed height to induce free vibration of the specimen [22].

2.2.3. Acoustic Signal Collection and Processing

In this study, the sound signal near the other end of the specimen was received by a microphone and converted into an electrical signal, as shown in Figure 2. The converted electrical signal was fast Fourier transformed (FFT) into a frequency spectrum.

2.2.4. Acoustic Vibration Characteristics

The most important acoustic characteristics for a specimen are the dynamic elastic modulus Ed, the specific dynamic modulus Ed/ρ, the acoustic radiation damping coefficient R, and the acoustic impedance Z [23], among which Ed is calculated as follows:
E d = 48 π   2   f   n   2 L 4 ρ h 2   β n 4   ×   10 9
where L is the specimen length, h is the specimen thickness, v is the sound transmission speed of the specimen, ρ is the specimen density, and fn is the fundamental vibration frequency [20], βn is the constant corresponding to the fundamental frequency fn, and βn = (n + 1/2) π, n = 1, 2, 3, n. In practice, fn is determined from the frequency spectrum recorded by the acoustic testing system.
The specific dynamic modulus, Ed/ρ, characterizes the dynamic rigidity of the material and is related to the intrinsic properties of the material, namely, flexural modulus and specific density, and extrinsic properties, such as cross-sectional shape and dimensions of the material [23]. Acoustic radiation damping coefficient (R) represents the intensity of the acoustic energy radiated into the air and is expressed as follows:
R = E d ρ 3
The acoustic impedance Z is expressed as follows:
Z = ρ v = ρ E d
The lower the acoustic energy loss due to internal friction, the higher the acoustic energy transferred into the air, leading to louder and longer-lasting sound emitted by the specimen, resulting in a higher conversion efficiency of sound vibration energy. Acoustic impedance (Z) is also called characteristic impedance. From the perspective of sound vibration efficiency, materials with good acoustic performance should have a larger specific dynamic modulus, a larger acoustic radiation damping coefficient, and smaller acoustic impedance, which facilitates the efficient conversion of sound energy and the improvement in response speed [24].

2.3. Flexural Test

The flexural properties of the composites and ailanthus wood, the wood typically used for traditional percussion drums in China, were tested using a universal testing machine (INSTRON CMT 5204) according to ASTM D7264 at a constant loading speed of 2 mm min−1, a specimen size of 80 mm × 13 mm, and a span 16 times that of the specimen thickness. For each sample, at least 5 valid specimens were tested.
The flexural modulus Ef (MPa) was calculated as follows:
E f = L 3 m 4 b h 3  
where L is the support span (mm), m is the slope of the force-deflection curve, b is the width of specimen (mm), h is the thickness of specimen (mm).

3. Results and Discussion

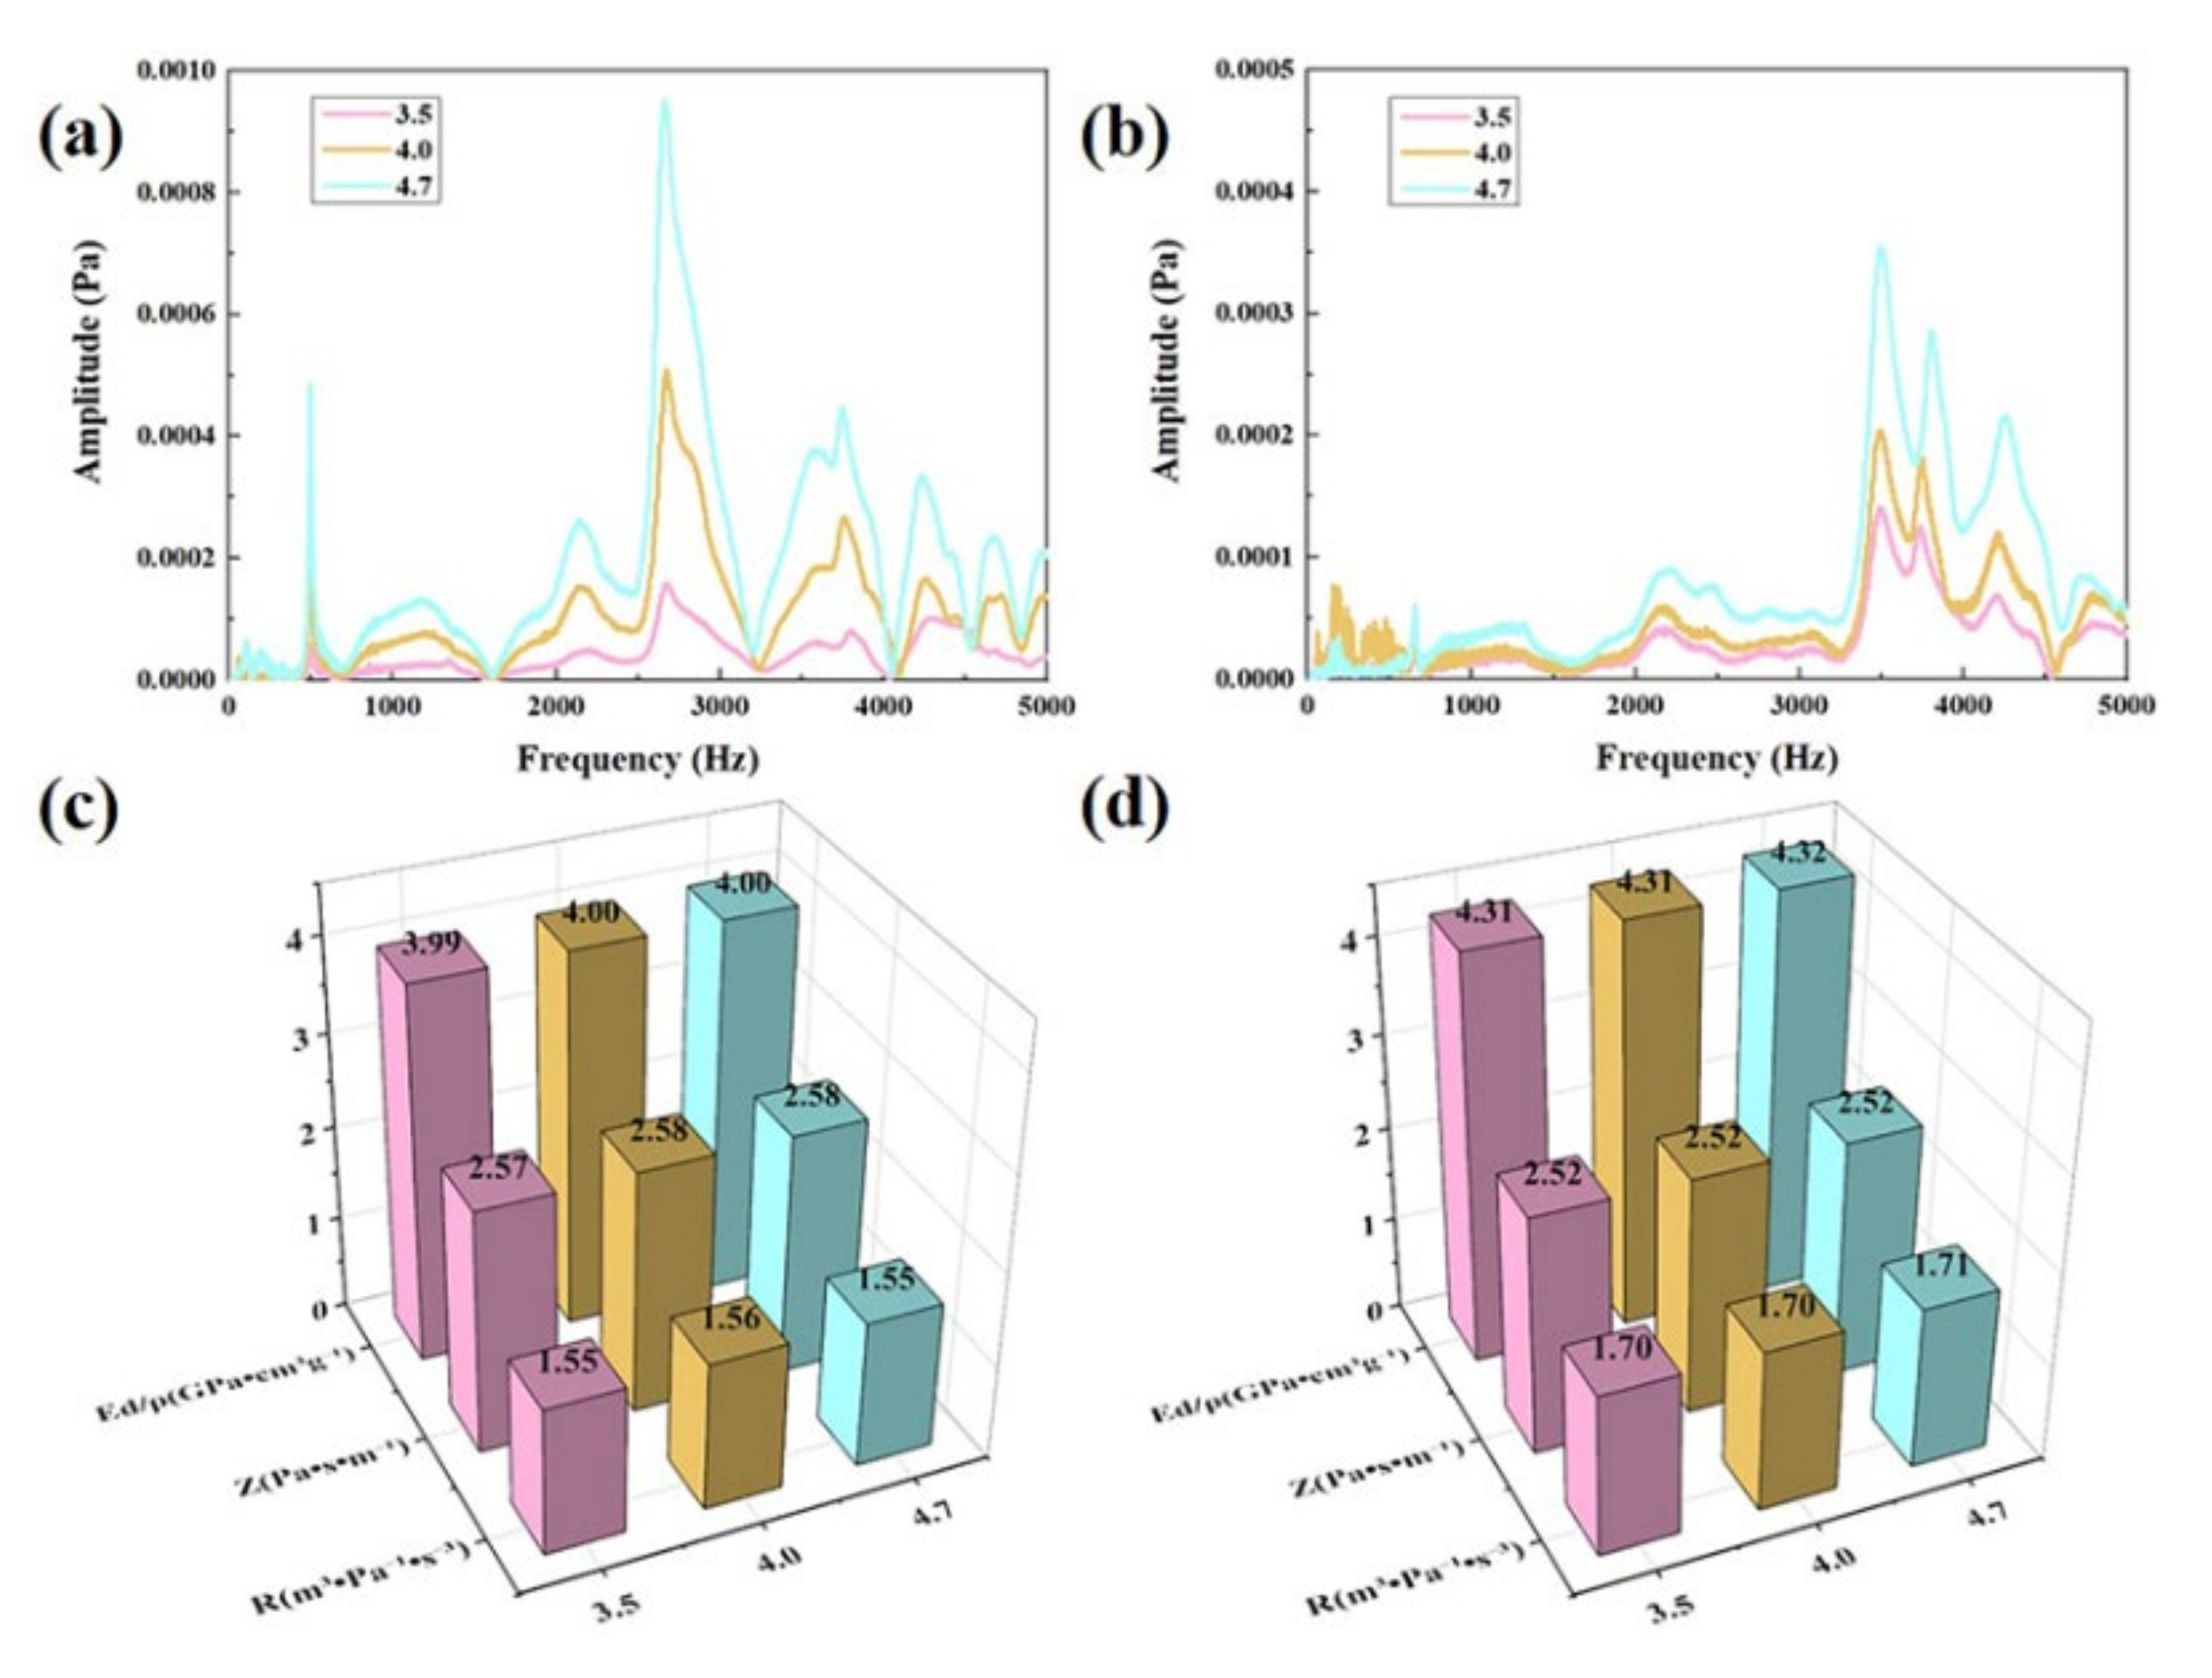
3.1. Effect of Different Vibration Stimulation Impulses

In the acoustic vibration test, choosing a proper vibration stimulation impulse to induce vibration or generate sound waves is one of the key parameters to be considered. Three steel balls, with diameters of 3.5, 4.0, and 4.7 mm, and masses of 0.17, 0.25, and 0.45 g, respectively, were chosen to be dropped at the same height. The test results are shown in Figure 3.
In Figure 3, it can be observed that for both the hemp/epoxy and ramie/epoxy composites, when the mass of the impact steel ball increased, the acoustic wave spectra were highly similar in shape, but the amplitudes of the peaks were proportionally increased. This is because, with the increased masses, the impact energy applied to the specimen was raised.
By analyzing the peak frequencies of the spectra, the average values of the acoustic vibration parameters, the specific dynamic modulus Ed/ρ, the acoustic radiation damping coefficient R, and the acoustic impedance Z were obtained, as shown in Figure 3c,d. The three acoustic vibration parameters of either the hemp- or the ramie-reinforced epoxy composites, obtained by stimulation with the steel balls of different masses, were virtually the same. This is because the peak positions did not change with the change in the impact energy, which means that one may use almost any reasonable mass of the impactor for this type of test, without significant variation in the resultant acoustic vibration parameters.

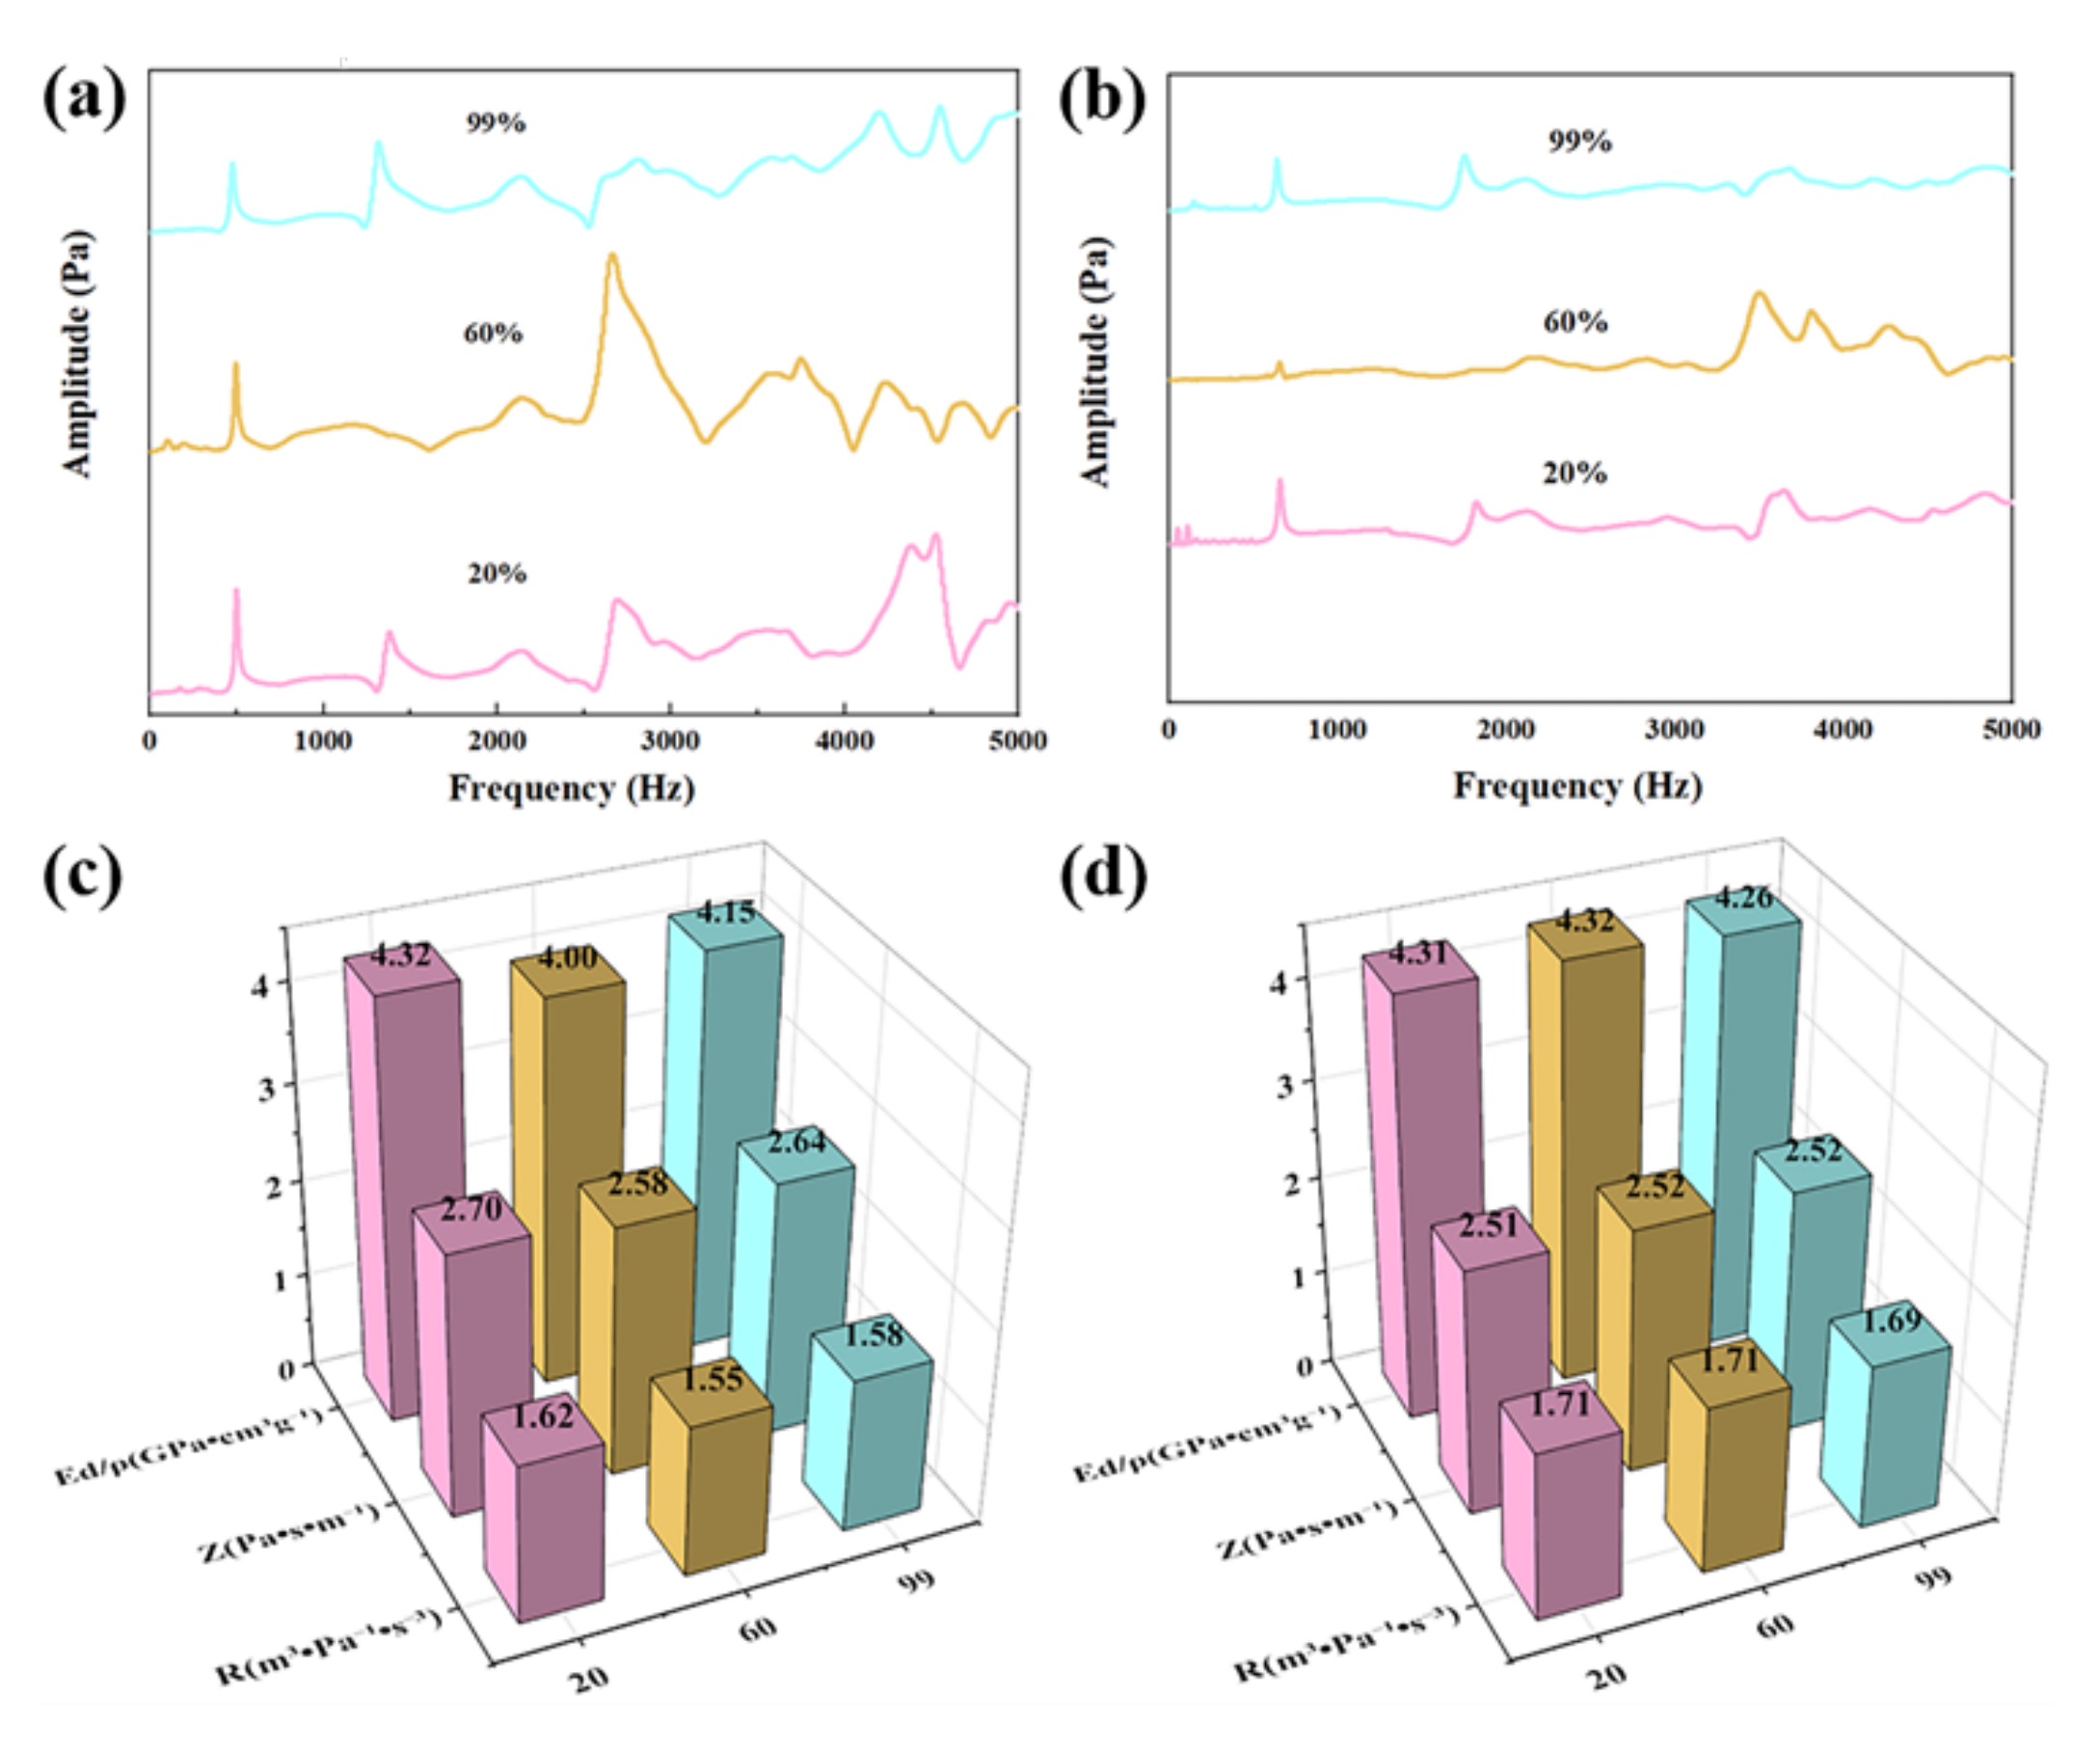
3.2. Influence of Environmental Relative Humidity

The two types of composites were conditioned for 24 h in three RHs, namely, 20%, 60%, and 99%, prior to the acoustic vibration test. The results are shown in Figure 4.
The acoustic vibration spectra of three specimens of hemp and ramie composites conditioned in different RHs were somewhat different. It was found that the spectra with RHs of 99% and 20% have a high degree of similarity, but the second characteristic peak of the curve with 60% RH disappeared. However, the specimens in 60% RH had significantly higher third and fourth peaks compared with the specimens conditioned in the other two RHs. The change in the frequency spectra with the change in RHs could be explained as a result of moisture absorption of the composite, since both the cellulose fibers and the epoxy matrix are hygroscopic. The moisture absorption of hygroscopic materials follows an inversed S-shape isotherm [25], in which the moisture absorption is fast at the beginning and then slows down in intermediate RH, due to less and less available intermolecular space for water molecules to diffuse in if the volumetric change is not allowed. As the RH increases to a high level, the replacement of the hydrogen bonds with water molecules will eventually liberate the neighboring molecules and create larger intermolecular spaces, allowing a large number of water molecules to enter, leading to a volumetric increase [26]. Thus, if the RH is around 60%, the density of the composite will be larger than that conditioned at 20%. However, the density of the composite could be lowered when it is conditioned at 99%, due to swelling. The modulus of the composite should always be decreased as the RH is increased, since water is a good plasticizer for hygroscopic materials. The resonant frequency of a composite positively depends on the modulus and negatively on the density of the composite. The net outcome for the change in the frequency spectrum is determined by the balance of the two factors.
The calculated acoustic parameters are shown in Figure 4. It can be observed that the Ed/ρ, R, and Z of the composites did not change significantly, since they were calculated from the first peak, which did not change much when the RH varied. Among the three RHs, 60% seems to give the most distinctive spectrum, and this is also close to the standard testing conditions for textiles and composites [27]. Therefore, we would recommend using an RH of around 60% for this kind of test.

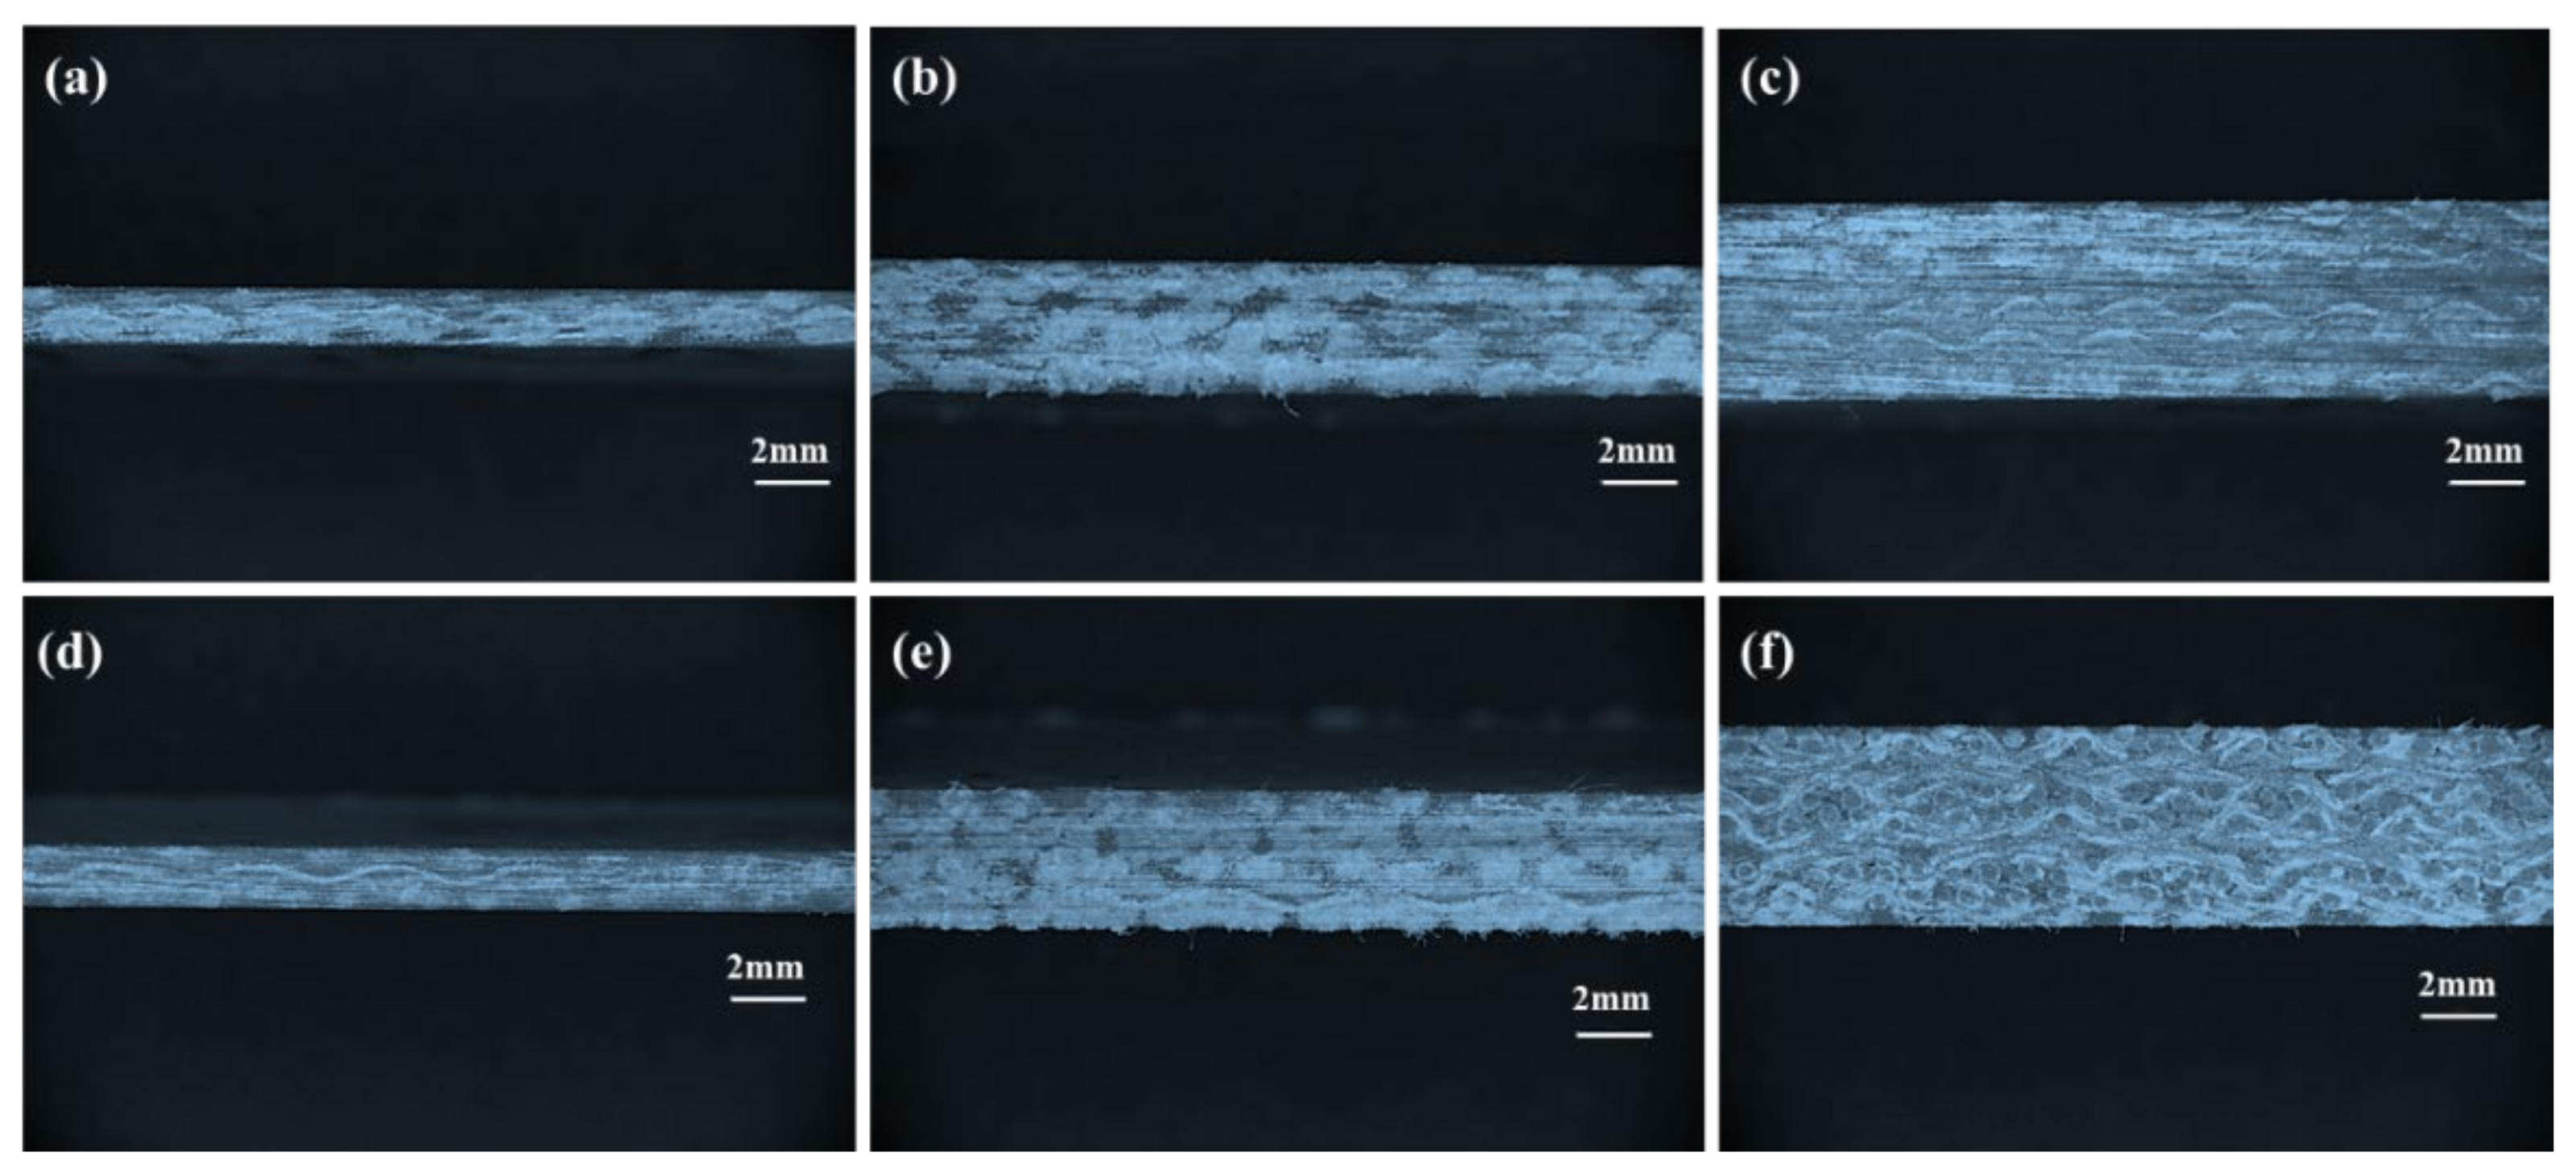
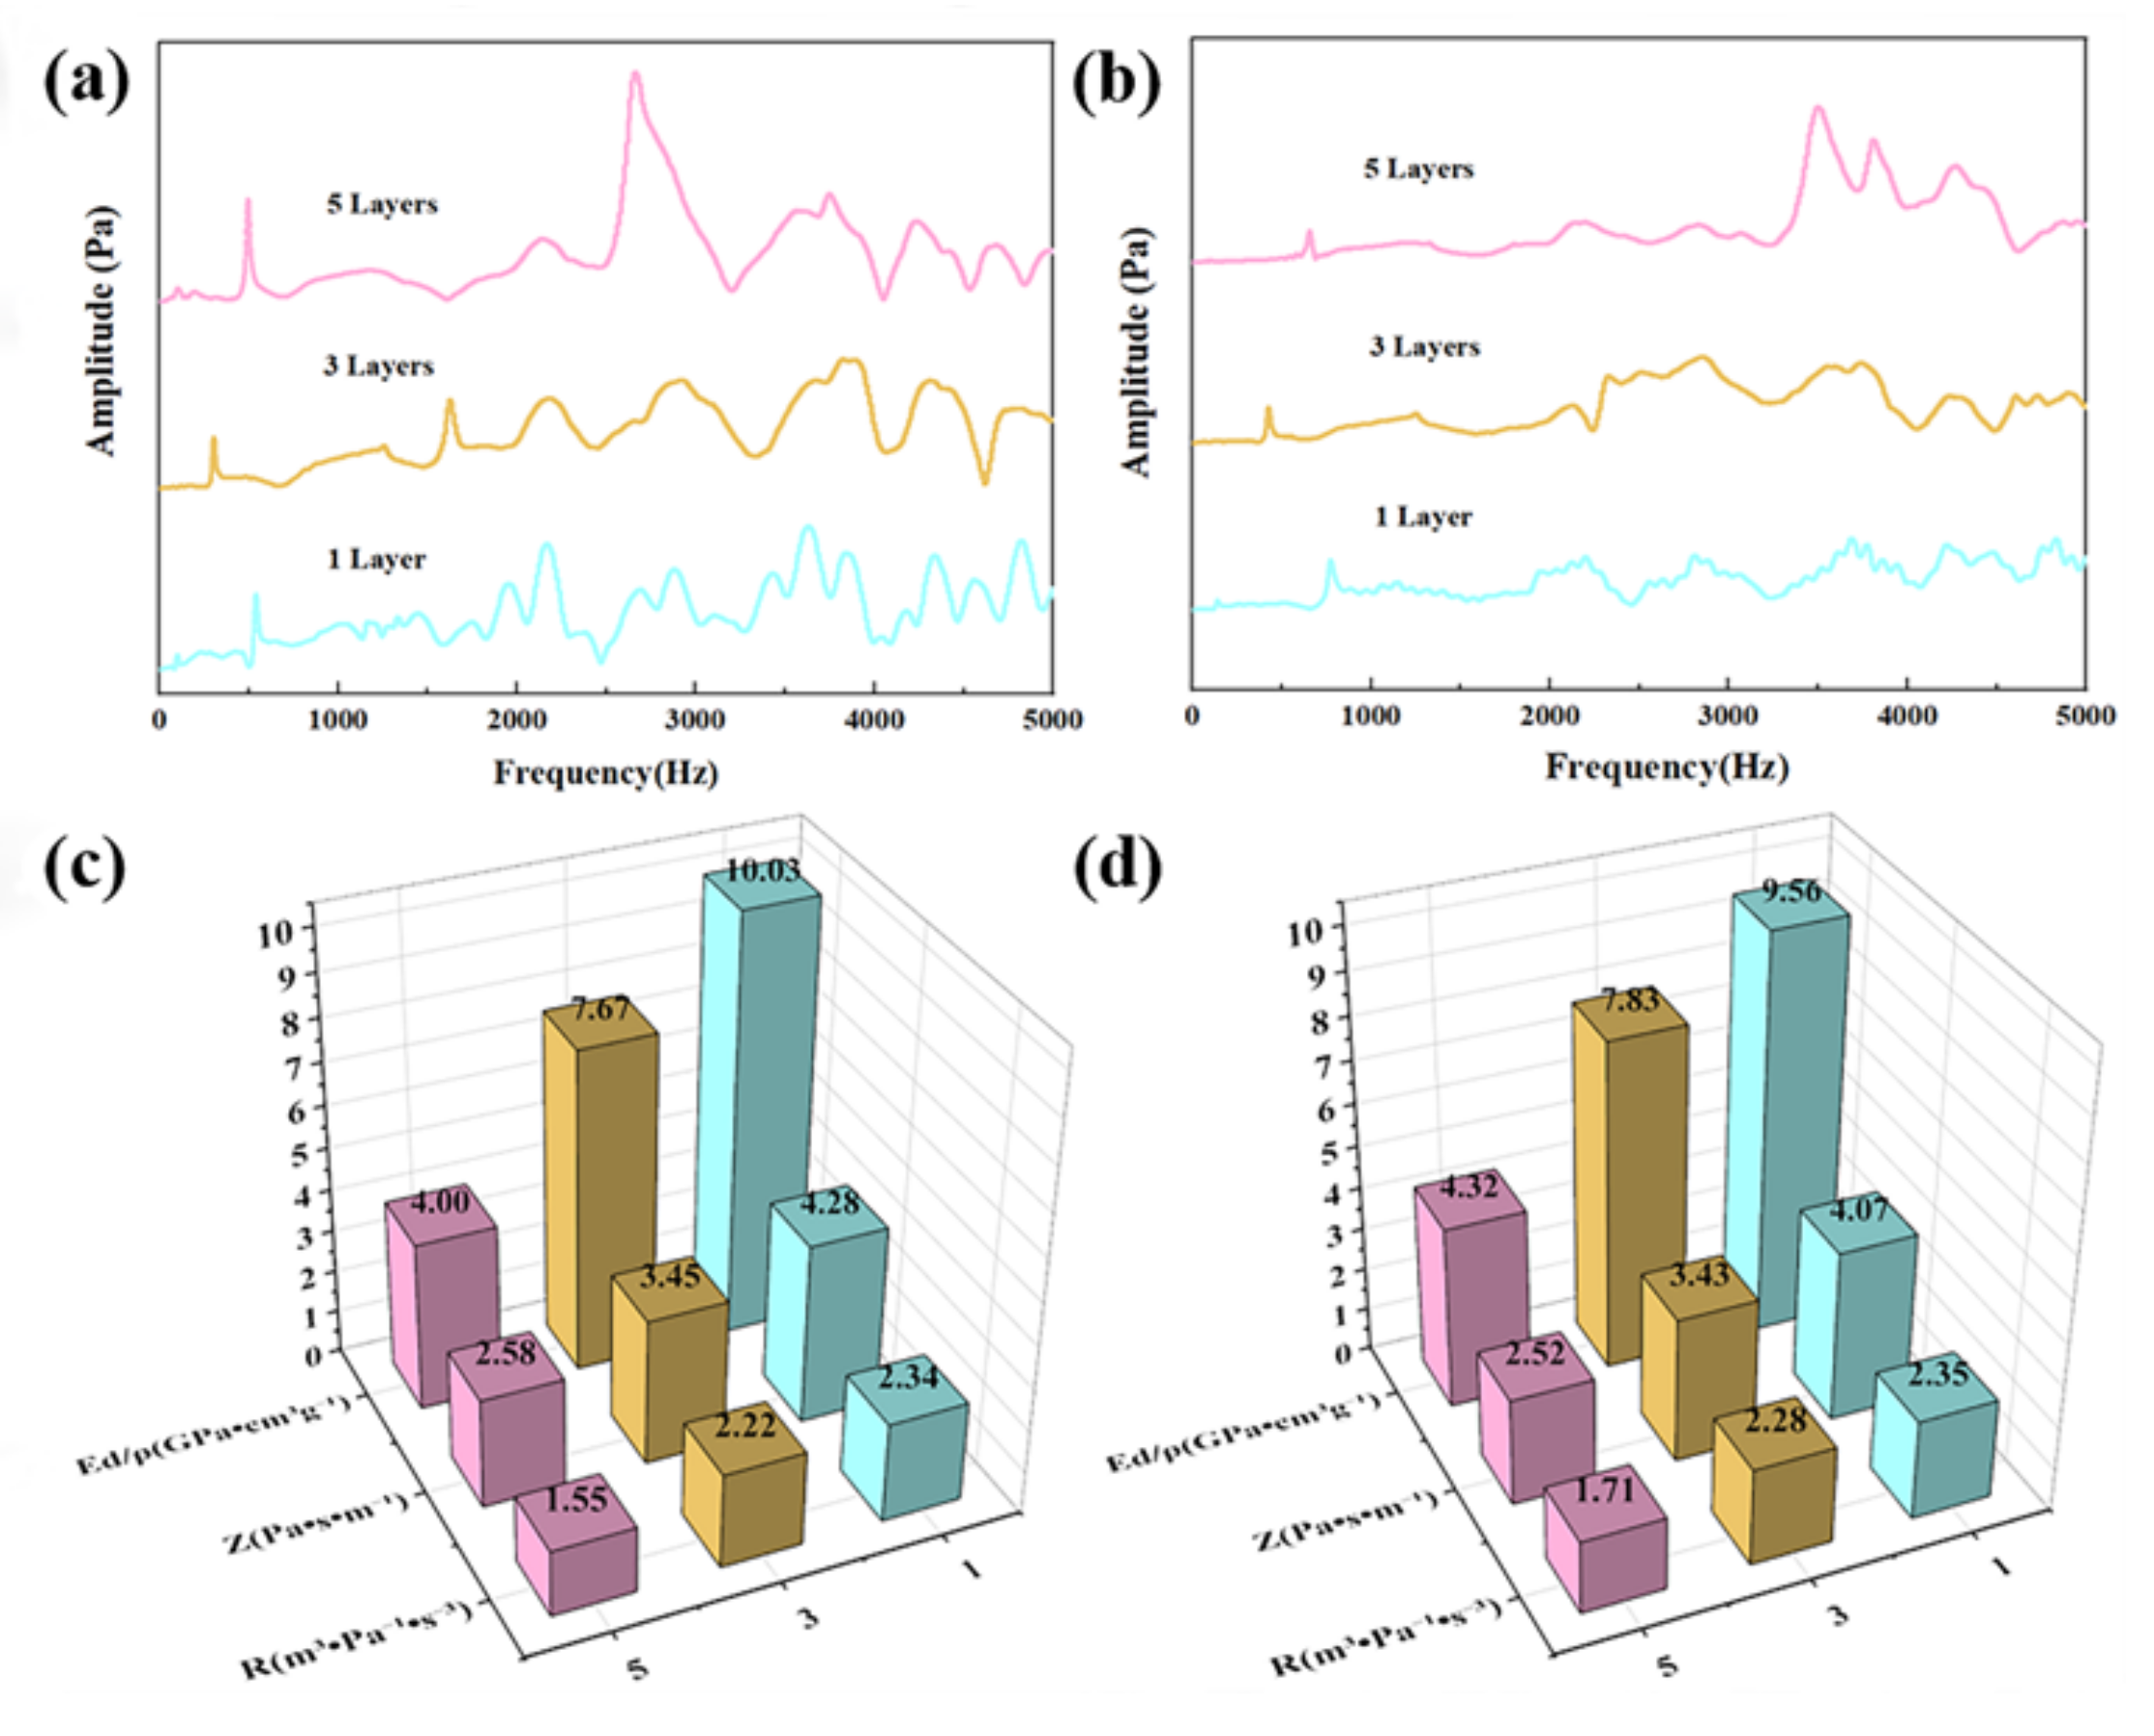
3.3. Effects of Specimen Thickness

The effect of the thickness of the composites on the acoustic properties is evaluated for the composites reinforced with one, three and five fabric layers at 60% RH. The acoustic spectra and the acoustic vibration performance parameters are presented in Figure 5. The specimen thickness has a limited impact on the frequency of the first peak in the spectra. However, the specific dynamic elastic modulus, Ed, of the material is inversely proportional to h2 [23]. Thus, a small increase in thickness, h, could result in a large reduction in Ed, which will, in turn, reduce the three acoustic vibration parameters. Therefore, to ensure consistency in the testing results, the thickness of the specimen has to be strictly controlled.
Another influential factor is the composite-specific density. When the number of fabric layers increases, the void content could be increased, since more fiber surfaces need to be wetted by the resin, and, thus, the fabrics may not be thoroughly infiltrated. Indeed, the specific density of the single-layer composites made of both hemp and ramie fabrics was the highest, compared with those with three and five layers of fabrics.

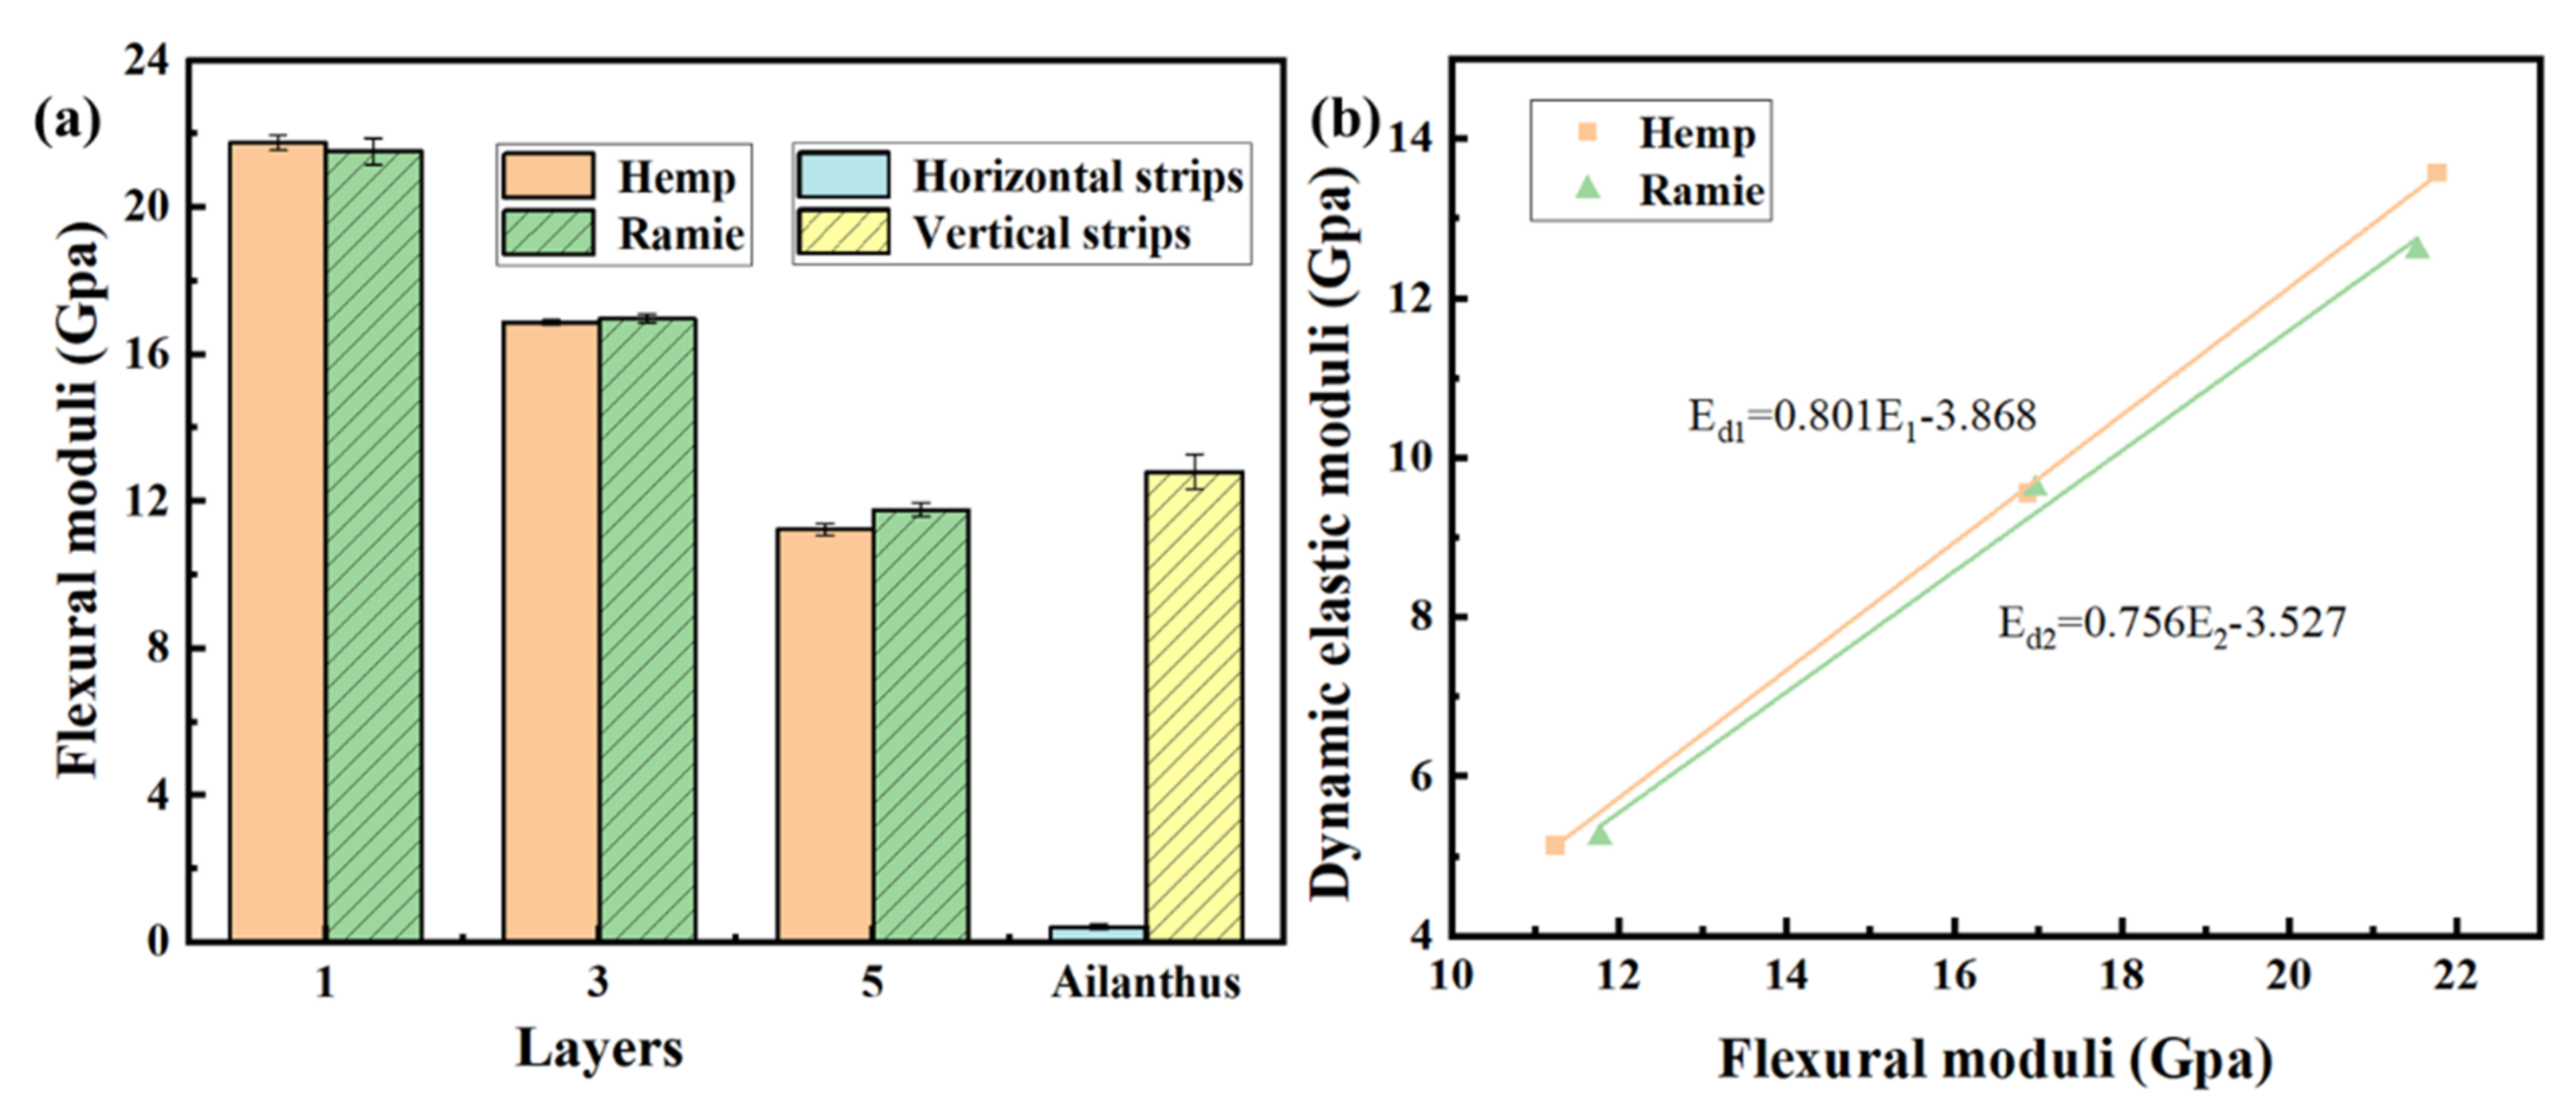
3.4. The Relation between Dynamic Elastic Modulus and Flexural Modulus

For some specific circumstances, nondestructive tests of the materials are preferred. The acoustic vibration test proposed here could be a nondestructive testing method for the estimation of the modulus of a material. The flexural moduli of the composites were determined using regular flexural tests, and were compared with those using the current acoustic vibration test, as shown in Figure 6a. For comparison purposes, we also tested ailanthus, a natural wood with obvious anisotropy. The modulus of its vertical strips was 29.8 times as much as that of its horizontal strips. The dynamic elastic moduli of the horizontal strips and vertical strips were 1.36 GPa and 8.54 GPa, respectively, which were close to their corresponding flexural moduli of 0.43 GPa and 12.81 GPa, respectively. This is also close to the elastic modulus of similar wood reported in the literature [28], which proved that our test method can generate results comparable to those produced using other methods. The modulus of the composite materials decreased as the number of layers increased.
As shown in Figure 6b, the measured dynamic elastic moduli and flexural moduli were correlated and analyzed, and the Pearson correlation coefficient of hemp (R12) and ramie (R22) were 0.999 and 0.995, respectively, indicating that the two are highly correlated. The correlation between the flexural and dynamic elastic modulus can be expressed by the following linear regression equations:
Ed1 = 0.801E1 − 3.868, R12 = 0.999
Ed2 = 0.756E2 − 3.527, R22 = 0.995
where Ed1 and Ed2 are the dynamic elastic moduli of hemp and ramie composites, respectively, and E1 and E2 are the corresponding flexural moduli. Therefore, the dynamic elastic moduli are proportional to the flexural moduli, and, thus, may be used to predict one another if necessary.

4. Conclusions

The following conclusions are drawn using the proposed acoustic vibration test method. The magnitudes of the impulses have little influence on the shapes of the acoustic vibration curves, although the intensity of the spectra increased proportionally as the dropping ball mass increased. The influence of RH is rather significant in terms of spectrum shape, due to the moisture-induced variation in Young’s modulus and the material density. The specimen thickness greatly influences the testing results. The specific dynamic modulus (Ed/ρ), acoustic radiation damping coefficient (R), and acoustic impedance (Z) changed a little as the impulse magnitude and RH changed, but decreased substantially as the specimen thickness increased. Therefore, one has to select a proper dropping ball and around 60% RH to carry out the test. It is not possible to simply compare the results of specimens with different thicknesses, and, thus, specimen thickness has to be fixed for comparison purposes. The acoustic properties of the samples tested using the current method correspond well to their mechanical properties, indicating reasonable reliability of the test method. In addition, the results obtained using the current method are also comparable to those produced using other methods.

Author Contributions

Conceptualization, F.L. and Y.Q.; methodology, Q.G., H.G. and Y.Q.; validation, F.L. and Q.G.; formal analysis, F.L. and Q.G.; investigation, F.L. and Q.G.; resources, C.L. and Y.Q.; data curation, F.L.; writing—original draft preparation, F.L. and Q.G.; writing—review and editing, J.J. and Y.Q.; visualization, F.L.; supervision, H.G.; project administration, Jinhua Jiang; funding acquisition, C.L. and Y.Q. All authors have read and agreed to the published version of the manuscript.

Funding

This research was funded by National Natural Science Foundation of China (Grant No. 51803108); Natural Science Foundation of Fujian Province, China (Grant No. 2019J05106); Quanzhou City Science & Technology Program of China (Grant No. 2018G011); Quanzhou Home-bay Recruitment Program of Global Talents (Grant No. 2017ZT002).

Conflicts of Interest

The authors declare no conflict of interest.

References

  1. Cherradi, Y.; Rosca, I.C.; Cerbu, C.; Kebir, H.; Guendouz, A.; Benyoucef, M. Acoustic properties for composite materials based on alfa and wood fibers. Appl. Acoust. 2021, 174, 107759. [Google Scholar] [CrossRef]
  2. Balakrishnan, B.; Raja, S.; Rajagopal, A. Influence of MWCNT fillers on vibroacoustic characteristics of polymer nanocomposite and coated aircraft panels. Appl. Acoust. 2021, 172, 107604. [Google Scholar] [CrossRef]
  3. Olcay, H.; Kocak, E.D. Rice plant waste reinforced polyurethane composites for use as the acoustic absorption material. Appl. Acoust. 2021, 173, 107733. [Google Scholar] [CrossRef]
  4. Shen, H.; Yang, Y.; Wang, P.; Hong, Y.; Legrand, X.; Yang, X.; Wu, J. Effect of tufting technique on sound insulation of multi-layer glass woven fabrics. Mater. Res. Express 2020, 7, 095510. [Google Scholar] [CrossRef]
  5. Shin, P.-S.; Kim, J.-H.; DeVries, K.L.; Park, J.-M. Manufacturing and qualitative properties of glass fiber/epoxy composite boards with added air bubbles for airborne and solid-borne sound insulation. Compos. Sci. Technol. 2020, 194, 108166. [Google Scholar] [CrossRef]
  6. Hariharan, A.; Prabunathan, P.; Kumaravel, A.; Manoj, M.; Alagar, M. Bio-based polybenzoxazine composites for oil-water separation, sound absorption and corrosion resistance applications. Polym. Test. 2020, 86, 106443. [Google Scholar] [CrossRef]
  7. Barile, C.; Casavola, C.; Pappalettera, G.; Kannan, V.P. Application of different acoustic emission descriptors in damage assessment of fiber reinforced plastics: A comprehensive review. Eng. Fract. Mech. 2020, 235, 107083. [Google Scholar] [CrossRef]
  8. Dunne, R.; Desai, D.; Sadiku, R. A Review of the Factors that Influence Sound Absorption and the Available Empirical Models for Fibrous Materials. Acoust. Aust. 2017, 45, 453–469. [Google Scholar] [CrossRef]
  9. Ide Rosa, M.; Santulli, C.; Sarasini, F. Acoustic emission for monitoring the mechanical behaviour of natural fibre composites: A literature review. Compos. Part A Appl. Sci. Manuf. 2009, 40, 1456–1469. [Google Scholar] [CrossRef]
  10. Reboul, N.R.; Saidi, M.; Gabor, A. Using acoustic emission to assess the tensile behaviour of textile reinforced, cementitious (TRC) matrix composites. Constr. Build. Mater. 2021, 310, 125216. [Google Scholar] [CrossRef]
  11. Kalteremidou, K.A.; Murray, B.R.; Carrella-Payan, D. Failure analysis of CF/epoxy hollow beam components using digital image correlation and acoustic emission analyses. Compos. Struct. 2021, 275, 114481. [Google Scholar] [CrossRef]
  12. Liang, Q.; Liu, J.; Wang, X. Flexural progressive failure mechanism of hybrid 3D woven composites: Combination of X-ray tomography, acoustic emission and digital image correlation. Compos. Struct. 2022, 280, 114894. [Google Scholar] [CrossRef]
  13. Wegst, U.G.K. Wood for sound. Am. J. Bot. 2006, 93, 1439–1448. [Google Scholar] [CrossRef]
  14. Damodaran, A.; Lessard, L.; Babu, A.S. An Overview of Fibre-Reinforced Composites for Musical Instrument Soundboards. Acoust. Aust. 2015, 43, 117–122. [Google Scholar] [CrossRef]
  15. Ibanez-Arnal, M.; Domenech-Ballester, L.; Sanchez-Lopez, F. A Study of the Dynamic Response of Carbon Fiber Reinforced Epoxy (CFRE) Prepregs for Musical Instrument Manufacturing. Appl. Sci. 2019, 9, 4615. [Google Scholar] [CrossRef] [Green Version]
  16. Jalili, M.M.; Mousavi, S.Y.; Pirayeshfar, A.S. Investigating the Acoustical Properties of Carbon Fiber-, Glass Fiber-, and Hemp Fiber-Reinforced Polyester Composites. Polym. Compos. 2014, 35, 2103–2111. [Google Scholar] [CrossRef] [Green Version]
  17. Phillips, S.; Lessard, L. Application of natural fiber composites to musical instrument top plates. J. Compos. Mater. 2012, 46, 145–154. [Google Scholar] [CrossRef]
  18. Wu, Z.H.; Li, J.H. Carbon fiber material in musical instrument making. Mater. Des. 2016, 89, 660–664. [Google Scholar] [CrossRef]
  19. Howard, W.H.; Williams, M.L. Viscoelastic Properties of Oriented Nylon 66 Fibers Part II: Moisture Dependence of Creep. Text. Res. J. 1966, 36, 691–695. [Google Scholar] [CrossRef]
  20. Ma, L. Study on Relationships between Wood Structures and Acoustic Vibration Properties; Anhui Agriculture University: Anhui, China, 2005. [Google Scholar]
  21. Yu, W.; Chu, C. Textile Physics; China Textile & Apparel Press: Shanghai, China, 2001. [Google Scholar]
  22. Liu, F.; Wang, K.; Lang, C.; Guan, F.; Jiang, J.; Qiu, Y. Mechanical and acoustic emission properties of vegetable fiber-reinforced epoxy composites for percussion instrument drums. Polym. Compos. 2021, 42, 2864–2871. [Google Scholar] [CrossRef]
  23. Liu, Z. Study on Vibration Property of Spruce Resonance Board and Acoustical Quality Evaluation of Piano; Northeast Forestry University: Harbin, China, 2007. [Google Scholar]
  24. Lei, F.; Huang, T.; Chen, G. The main factors affecting acoustic quality of soundboard and the methods to evaluate the acoustic quality of soundboard. Shaanxi For. Sci. Technol. 2017, 5, 85–89, 94. [Google Scholar]
  25. Yu, W. Textile Materials; China Textile & Apparel Press: Beijing, China, 2018. [Google Scholar]
  26. Nissan, A.H. H-Bond Dissociation in Hydrogen Bond Dominated Solids. Macromolecules 1976, 9, 840–850. [Google Scholar] [CrossRef]
  27. Yu, X.; Bao, Y.; Wu, Z.; Liu, R. Textile Material Experimental Technology; China Textile & Apparel Press: Beijing, China, 2004. [Google Scholar]
  28. Zhang, H.; Shen, S.; Cui, Y. Measuring elastic modulus of wood using vibration method. J. Beijing For. Univ. 2005, 27, 91–94. [Google Scholar]
Figure 1. Cross-sections of composite specimens: (a) 1 layer, (b) 3 layers, (c) 5 layers of hemp composites; (d) 1 layer, (e) 3 layers, (f) 5 layers of ramie composites.
Applsci 11 12067 g001
Figure 2. Schematic diagram and real image of lateral free vibration testing system. The dimensions in the figure are all in mm.
Applsci 11 12067 g002
Figure 3. Frequency spectra induced by different impulses in composites: (a) hemp; (b) ramie. Acoustic vibration performance parameters under different vibration impulses: (c) hemp; (d) ramie.
Applsci 11 12067 g003
Figure 4. Frequency spectra for composites, conditioned in different RHs, reinforced with: (a) hemp; (b) ramie. Acoustic vibration performance parameters for composites reinforced with: (c) hemp; (d) ramie.
Applsci 11 12067 g004
Figure 5. Frequency spectra of composites with different number of layers: (a) hemp; (b) ramie. Acoustic vibration performance of composites with different layers: (c) hemp; (d) ramie.
Applsci 11 12067 g005
Figure 6. (a) The flexural moduli of different layers of composites and ailanthus; (b) the relation between dynamic elastic moduli and flexural moduli.
Applsci 11 12067 g006
Table 1. Parameters of the fabrics.
FabricsFabric Count
(end × pick/10 cm)
Weight
(g/m2)
Thickness
(mm)
Hemp108 × 885380.96
Ramie100 × 1266191.136
Publisher’s Note: MDPI stays neutral with regard to jurisdictional claims in published maps and institutional affiliations.

