Development of a Gaussian Process Model as a Surrogate to Study Load Bridging Performance in Racked Pallets


Abstract
:1. Introduction
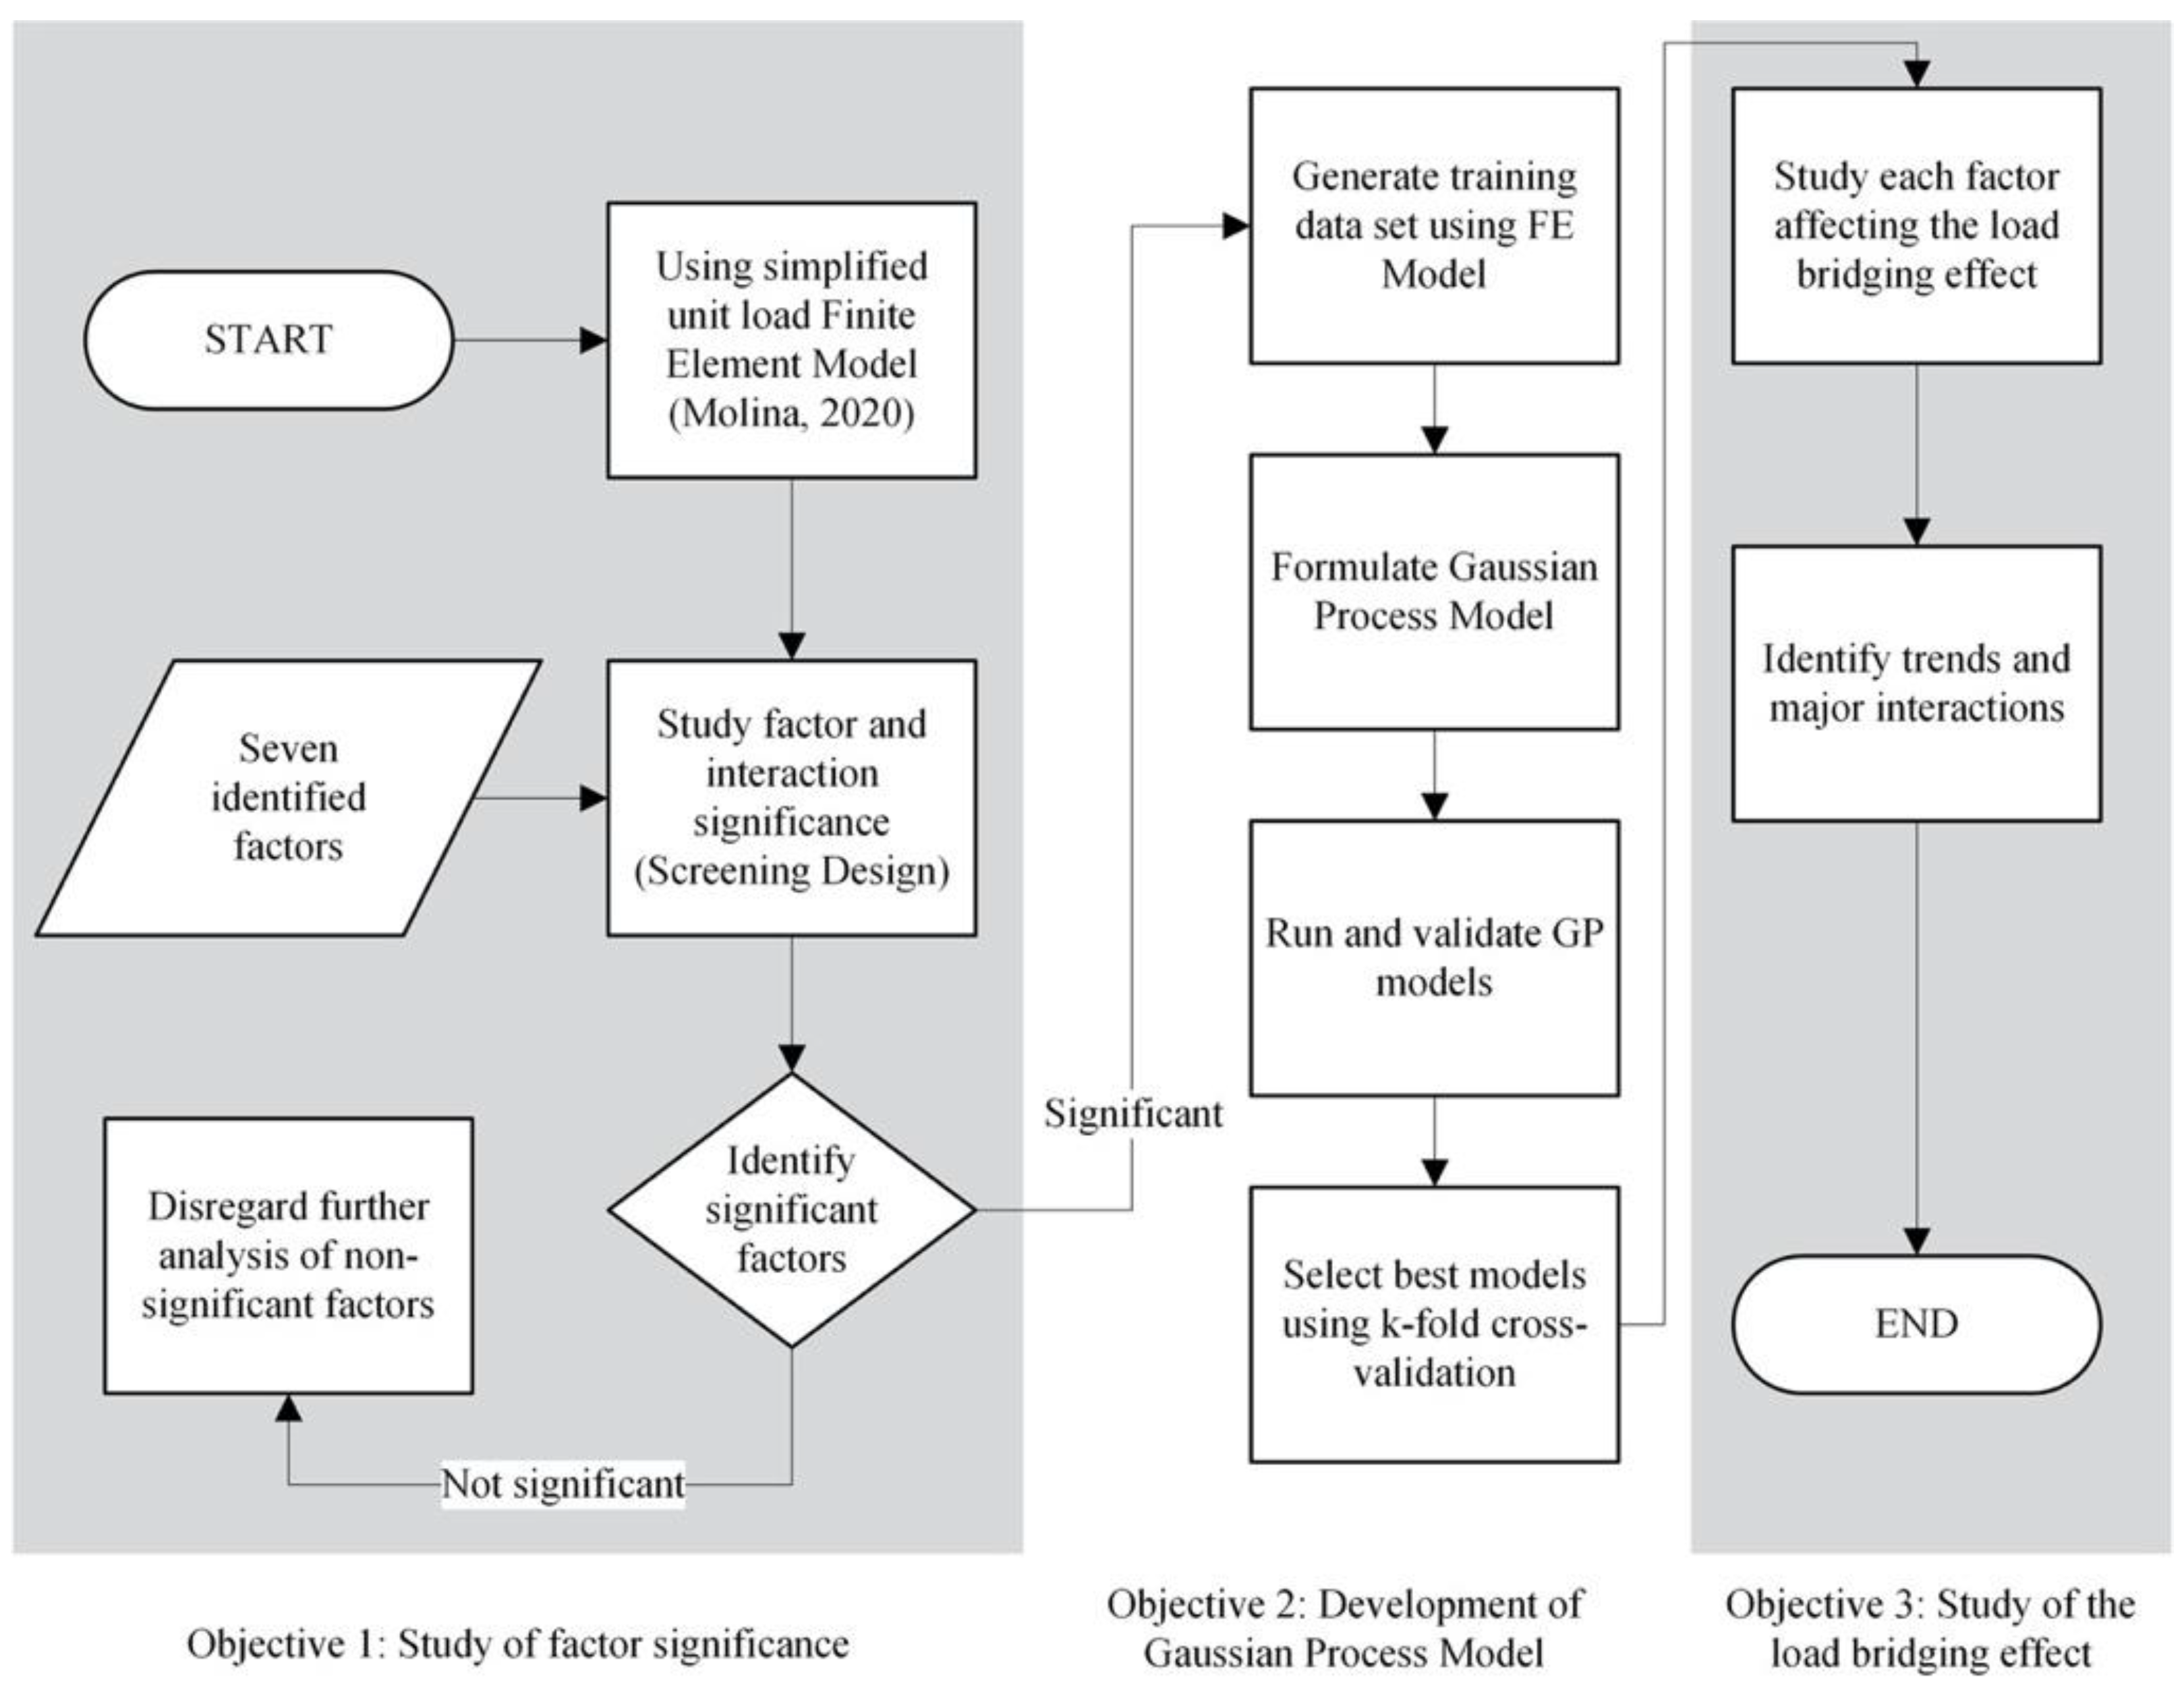
Objectives
- To evaluate the significance of the seven identified factors and their interactions that influence load bridging for unit loads of stacked corrugated boxes on warehouse racking support.
- To develop and validate a Gaussian process regression model that can efficiently and accurately replicate the finite element simulations.
- To quantify and describe the effect of all identified significant load bridging factors influencing pallet bending, as well as the interactions between them.
2. Materials and Methods
2.1. Screening of the Significant Factors in the Load Bridging Model
2.2. Design of Experiments for the Screening of the Factors
2.3. Development and Cross Validation of a Gaussian Process Model to Predict Unit Load Segment Bending
2.4. Study of the Significant Factors Influencing Load Bridging
3. Results
3.1. Results for the Screening of the Factors
3.2. Gaussian Process Model Results
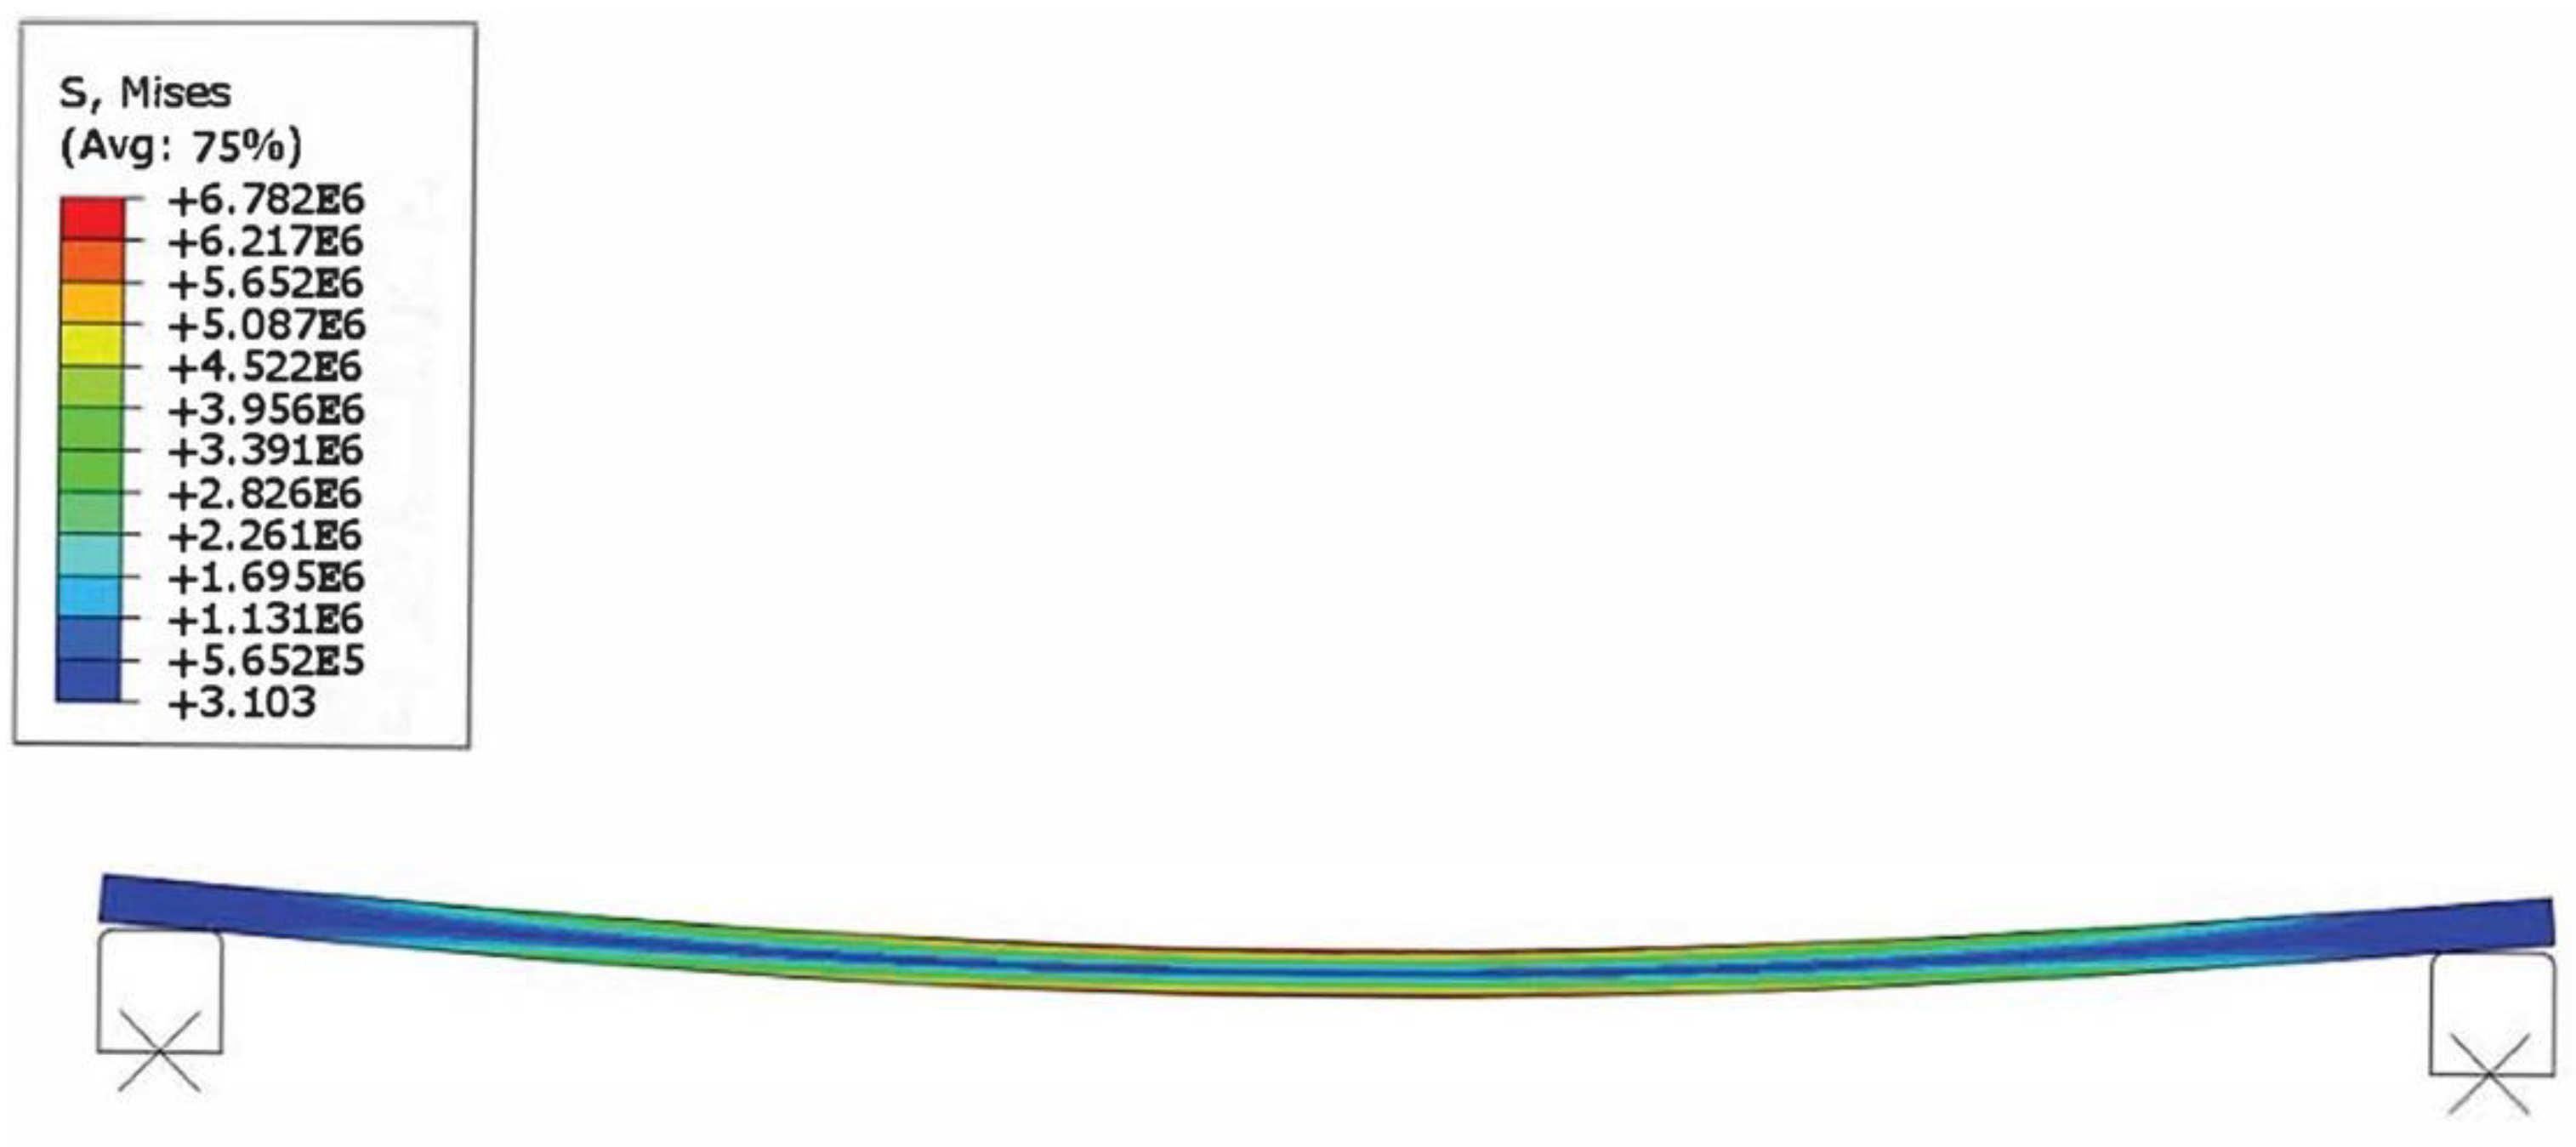
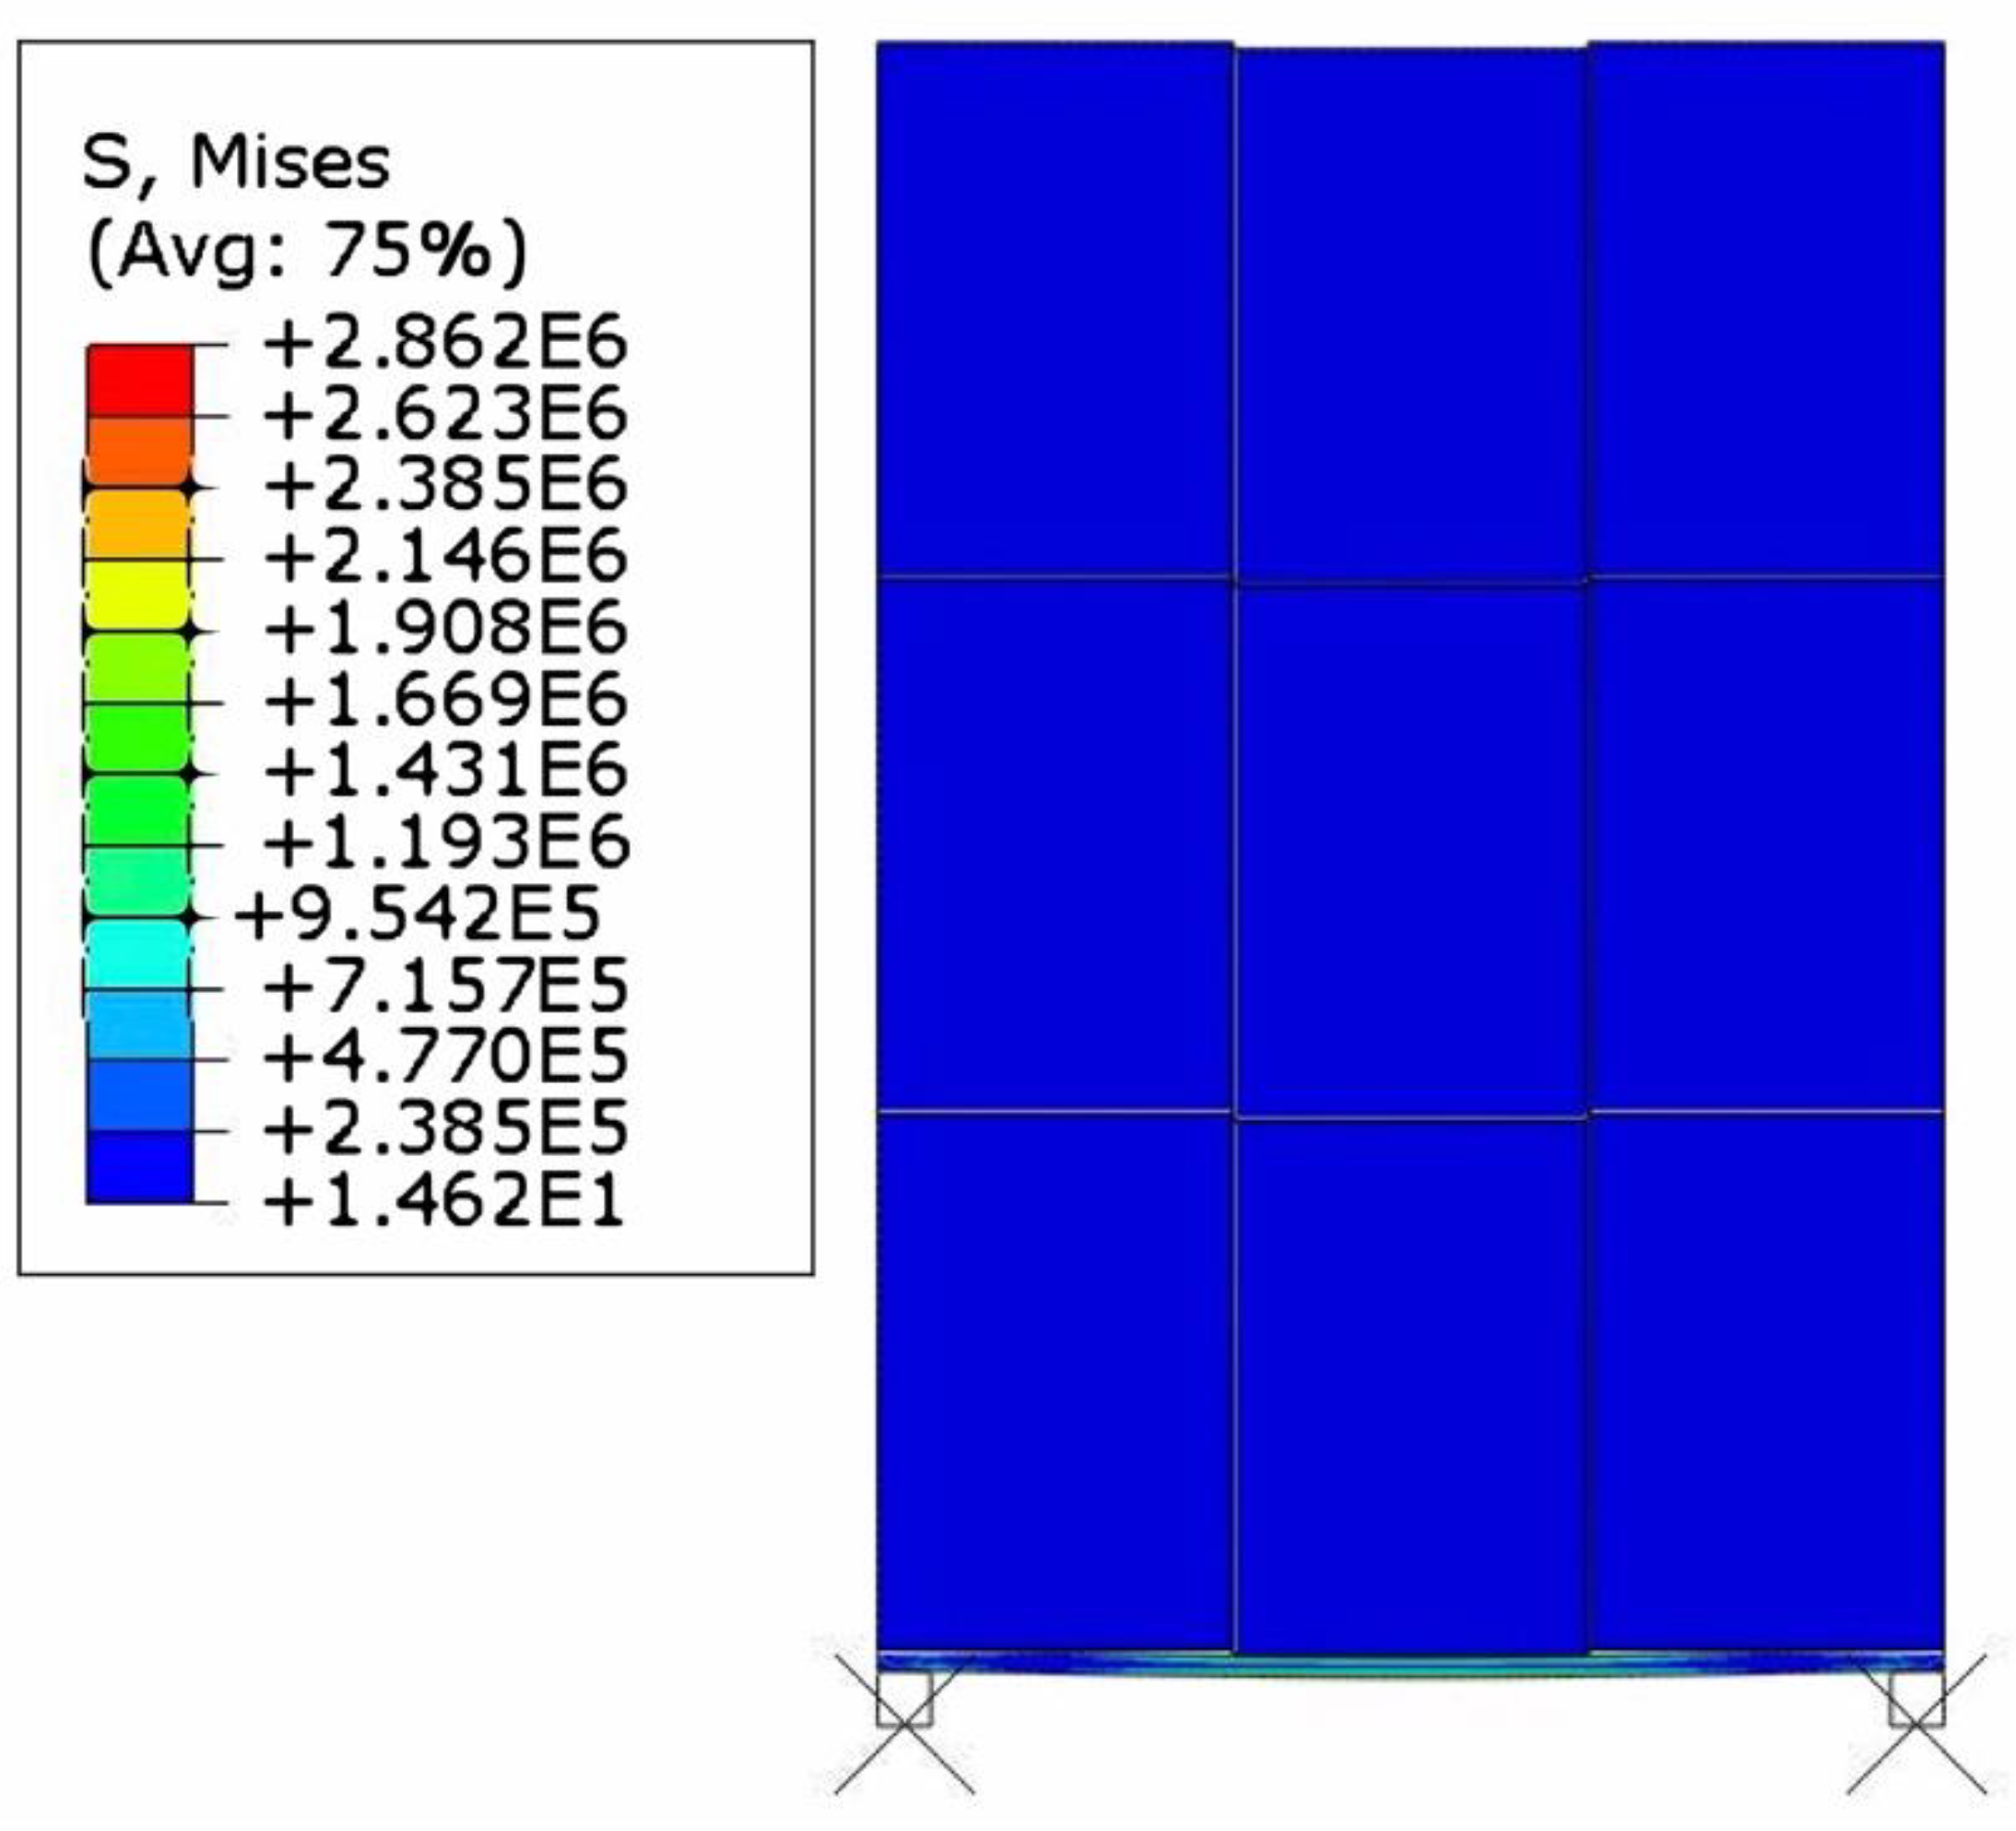
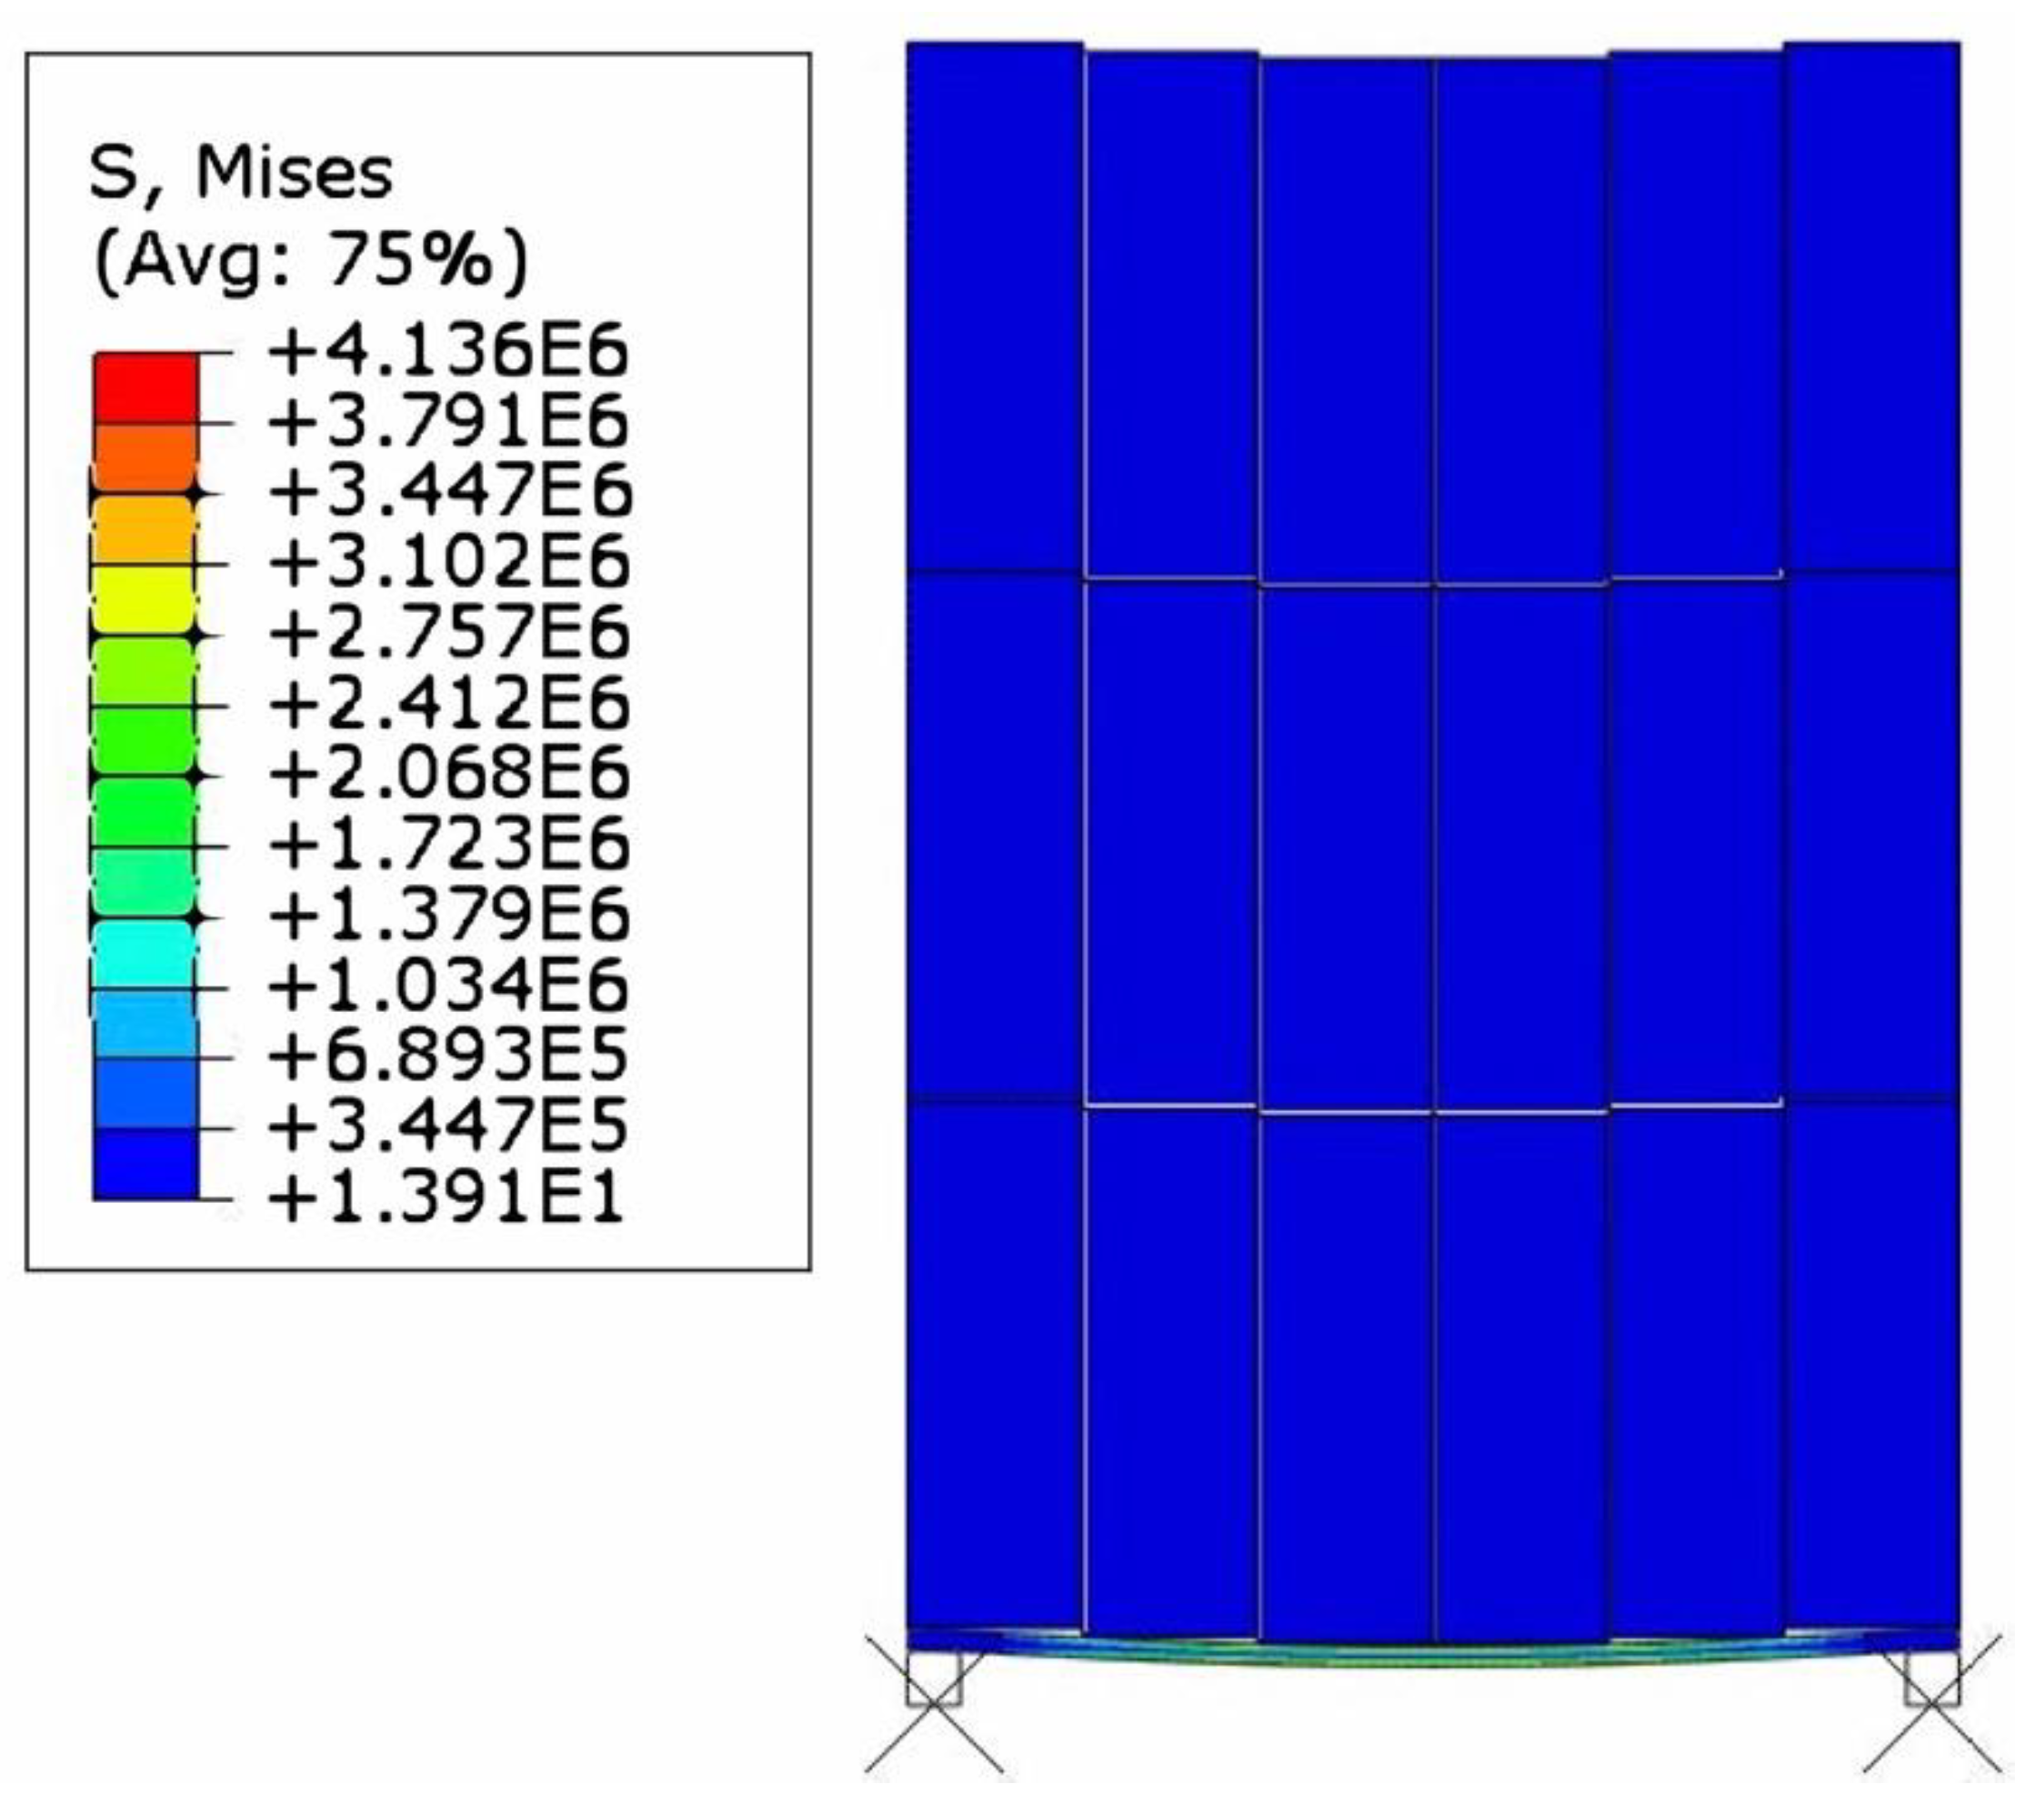
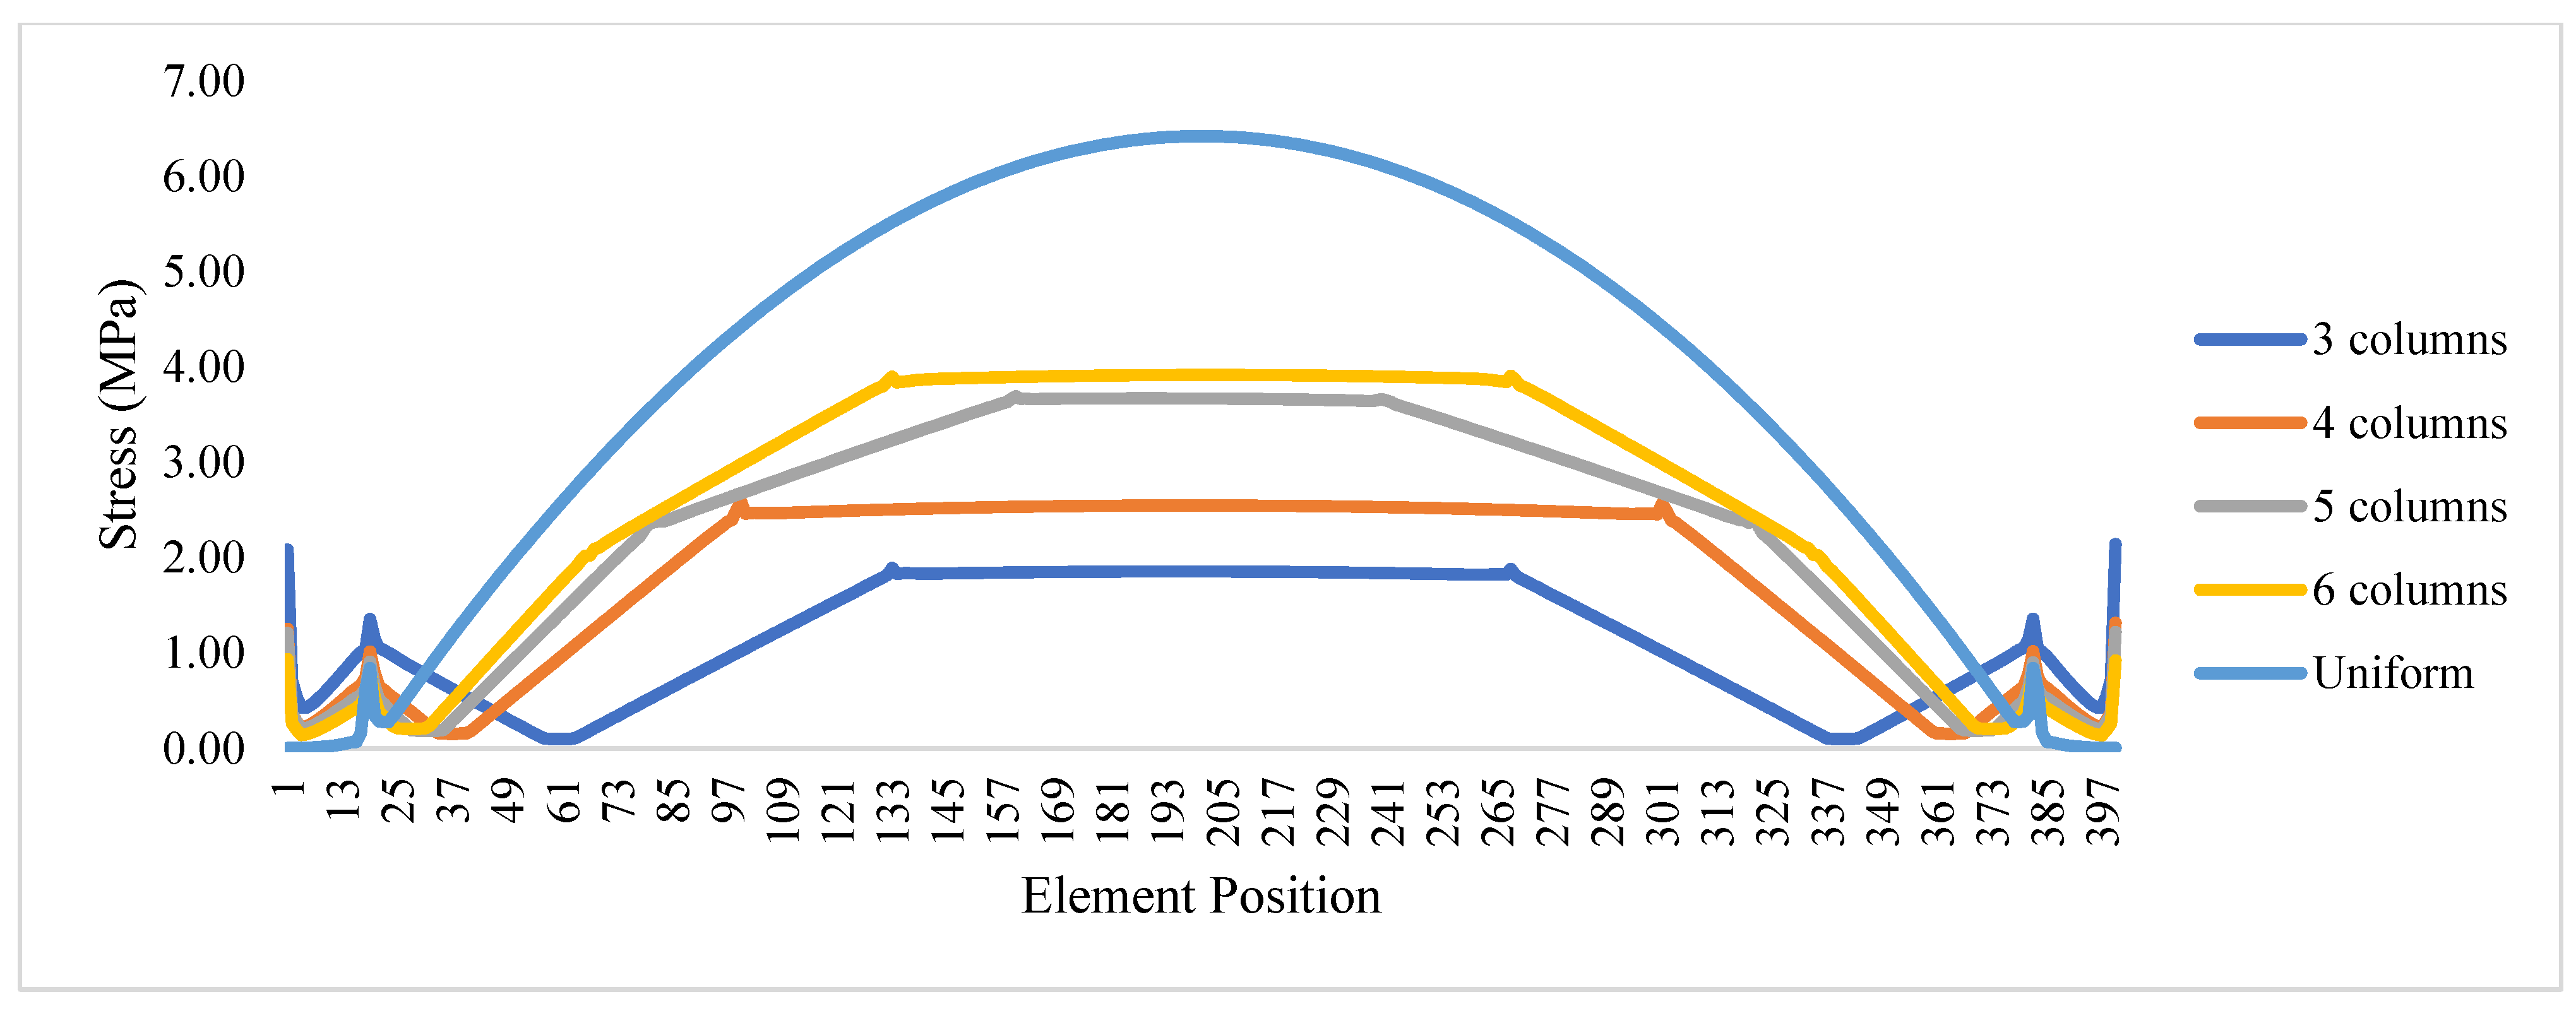
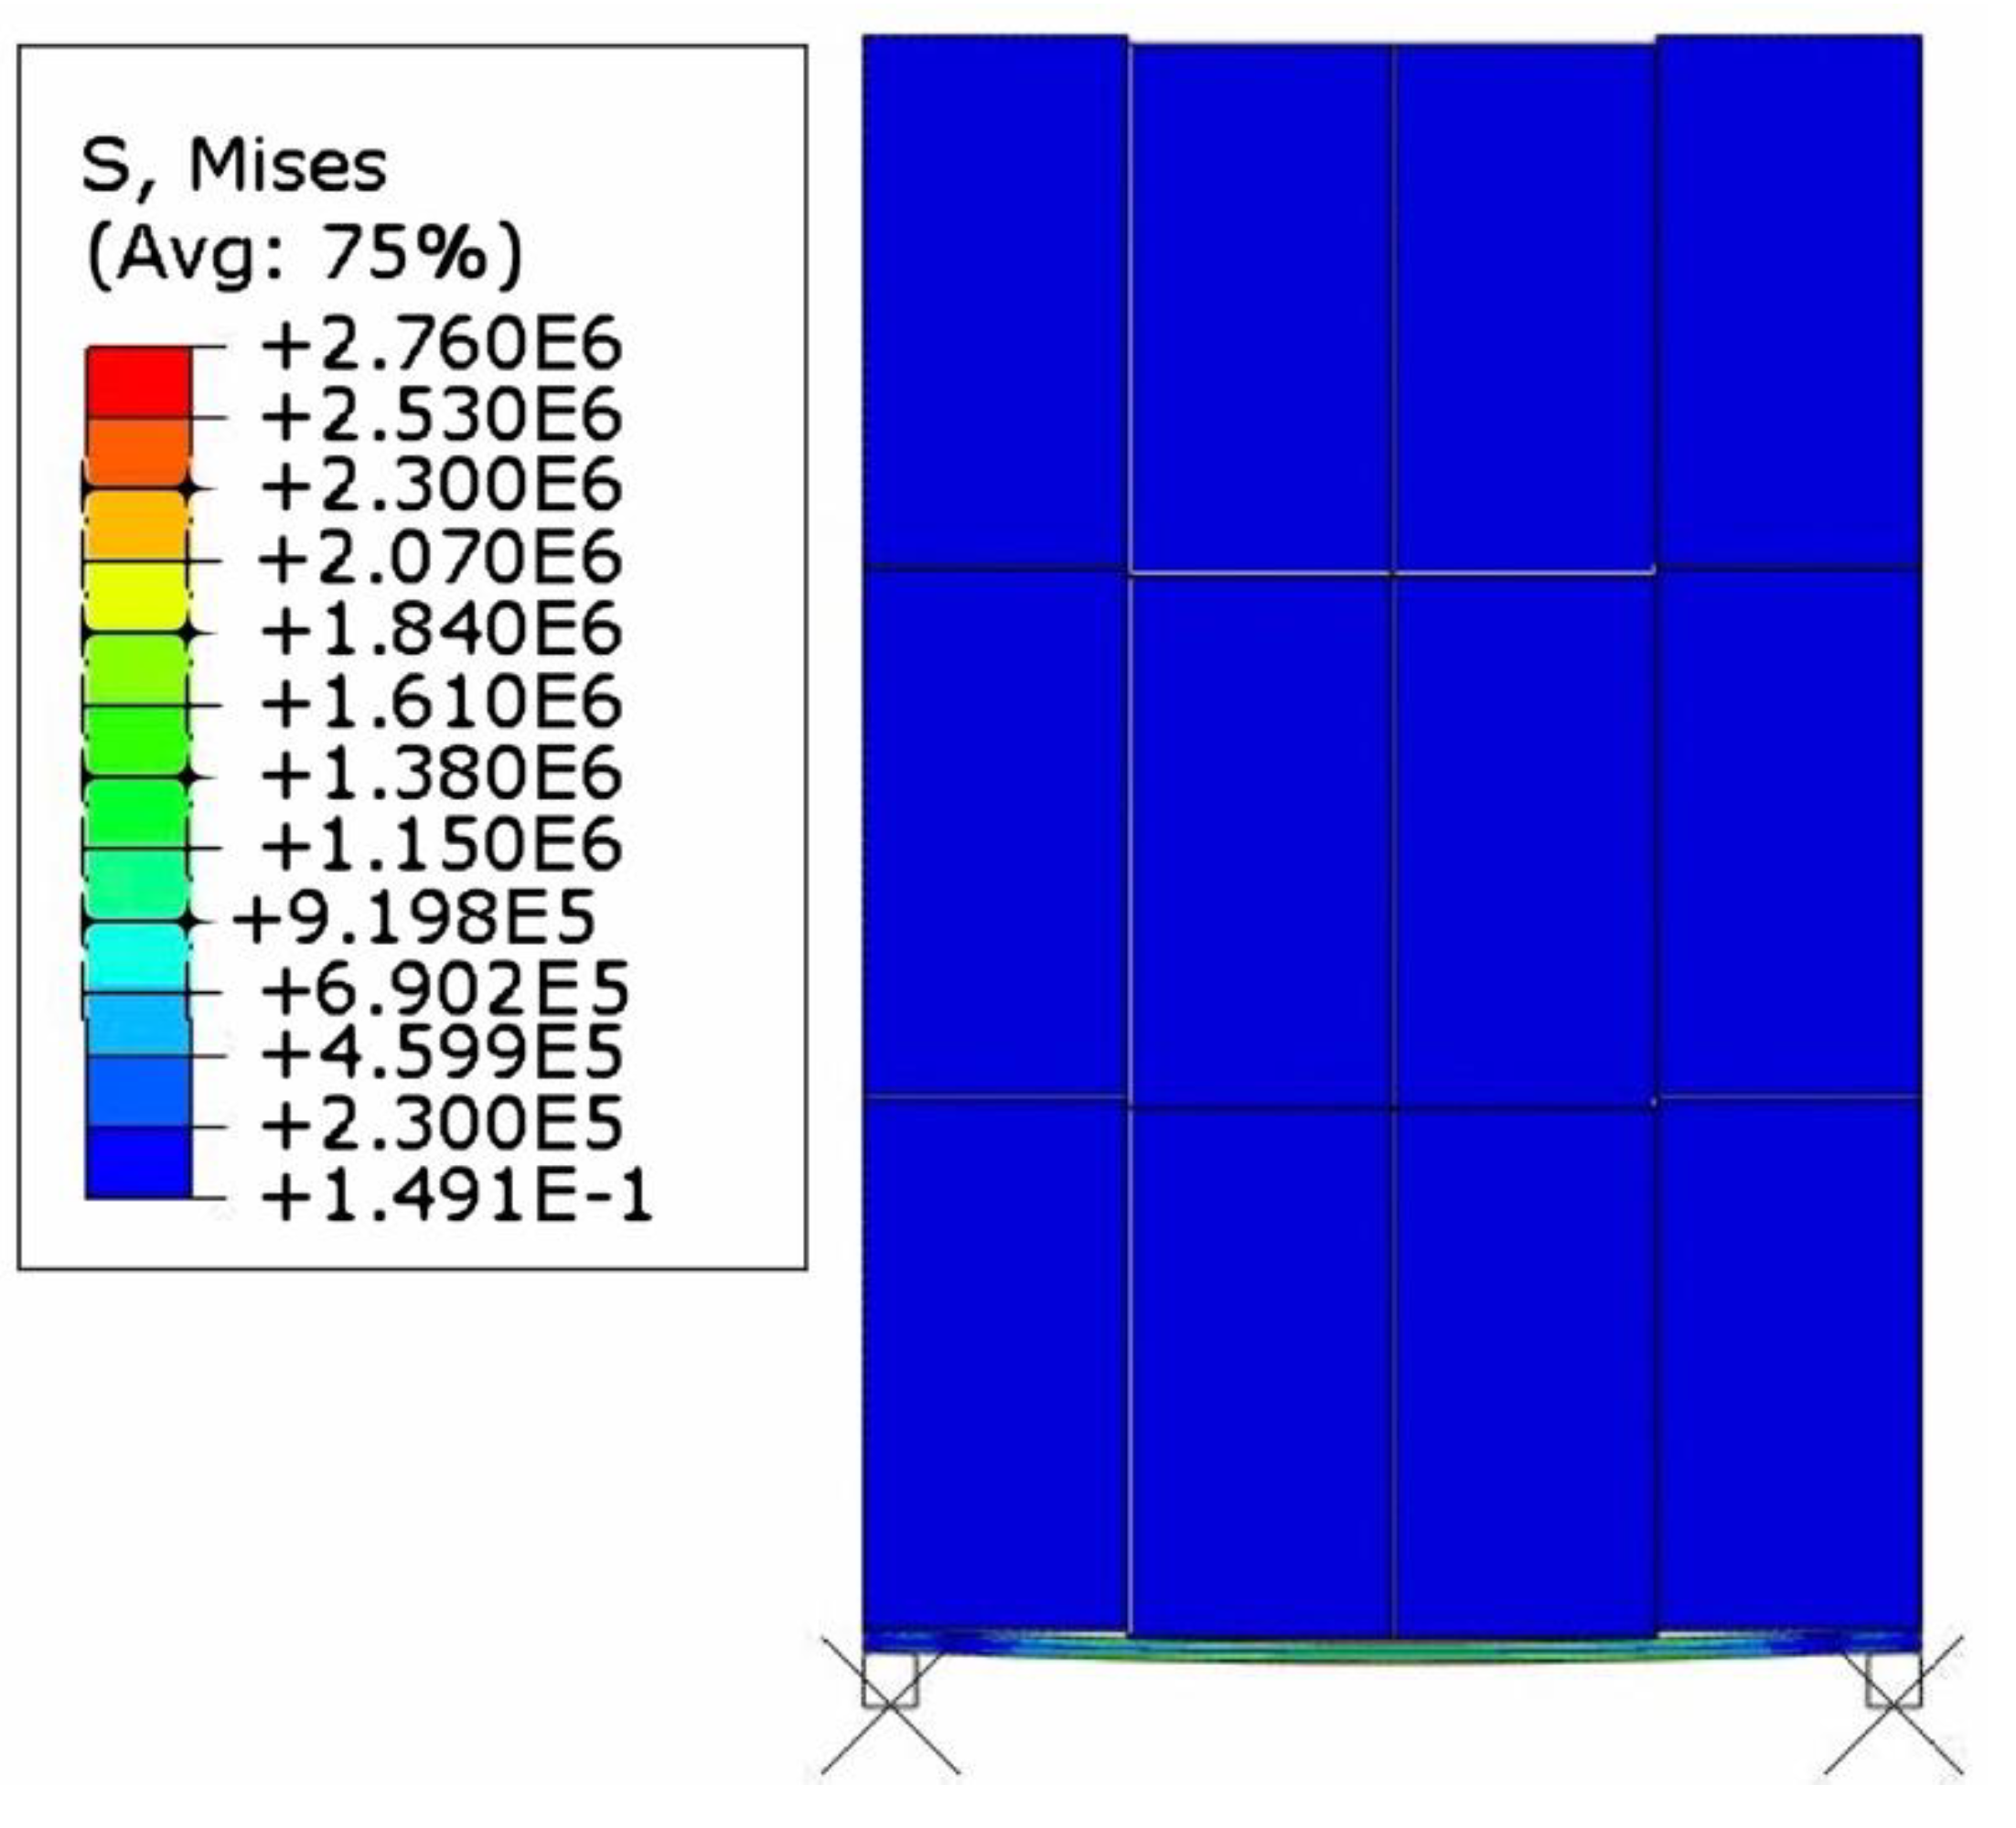
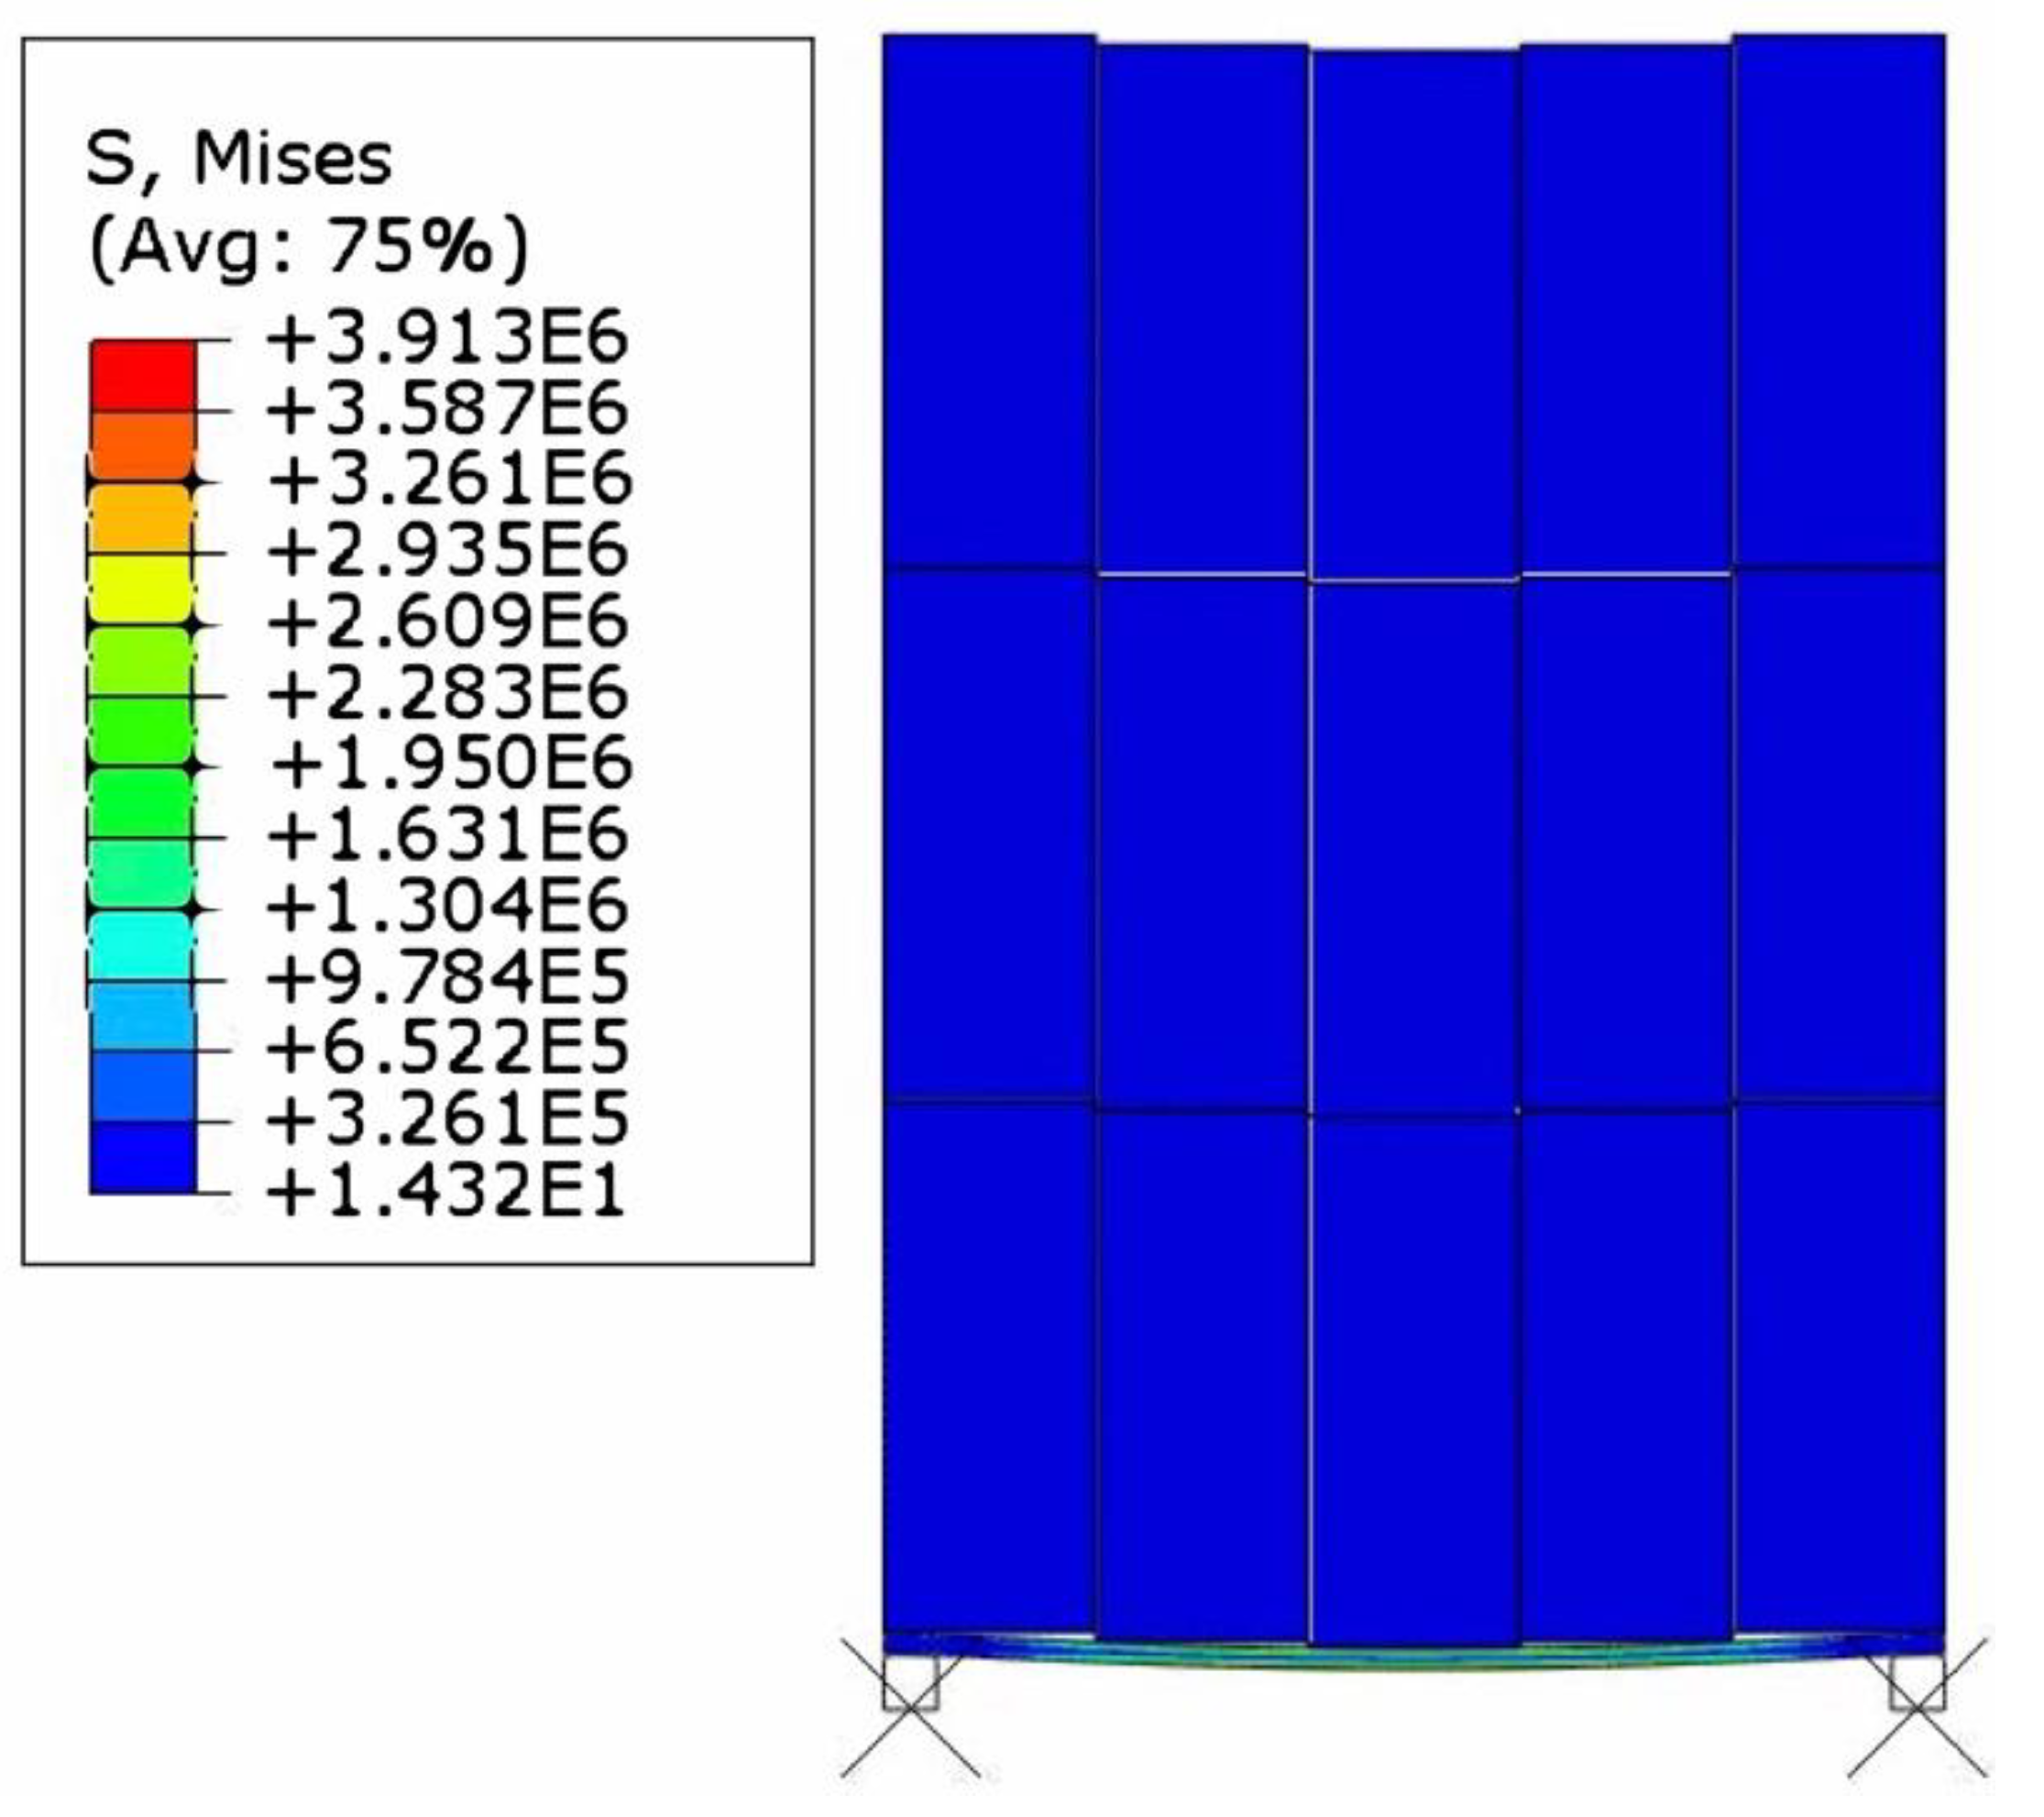
3.3. Results of the Internal Stresses’ Distribution and Trends
4. Discussion
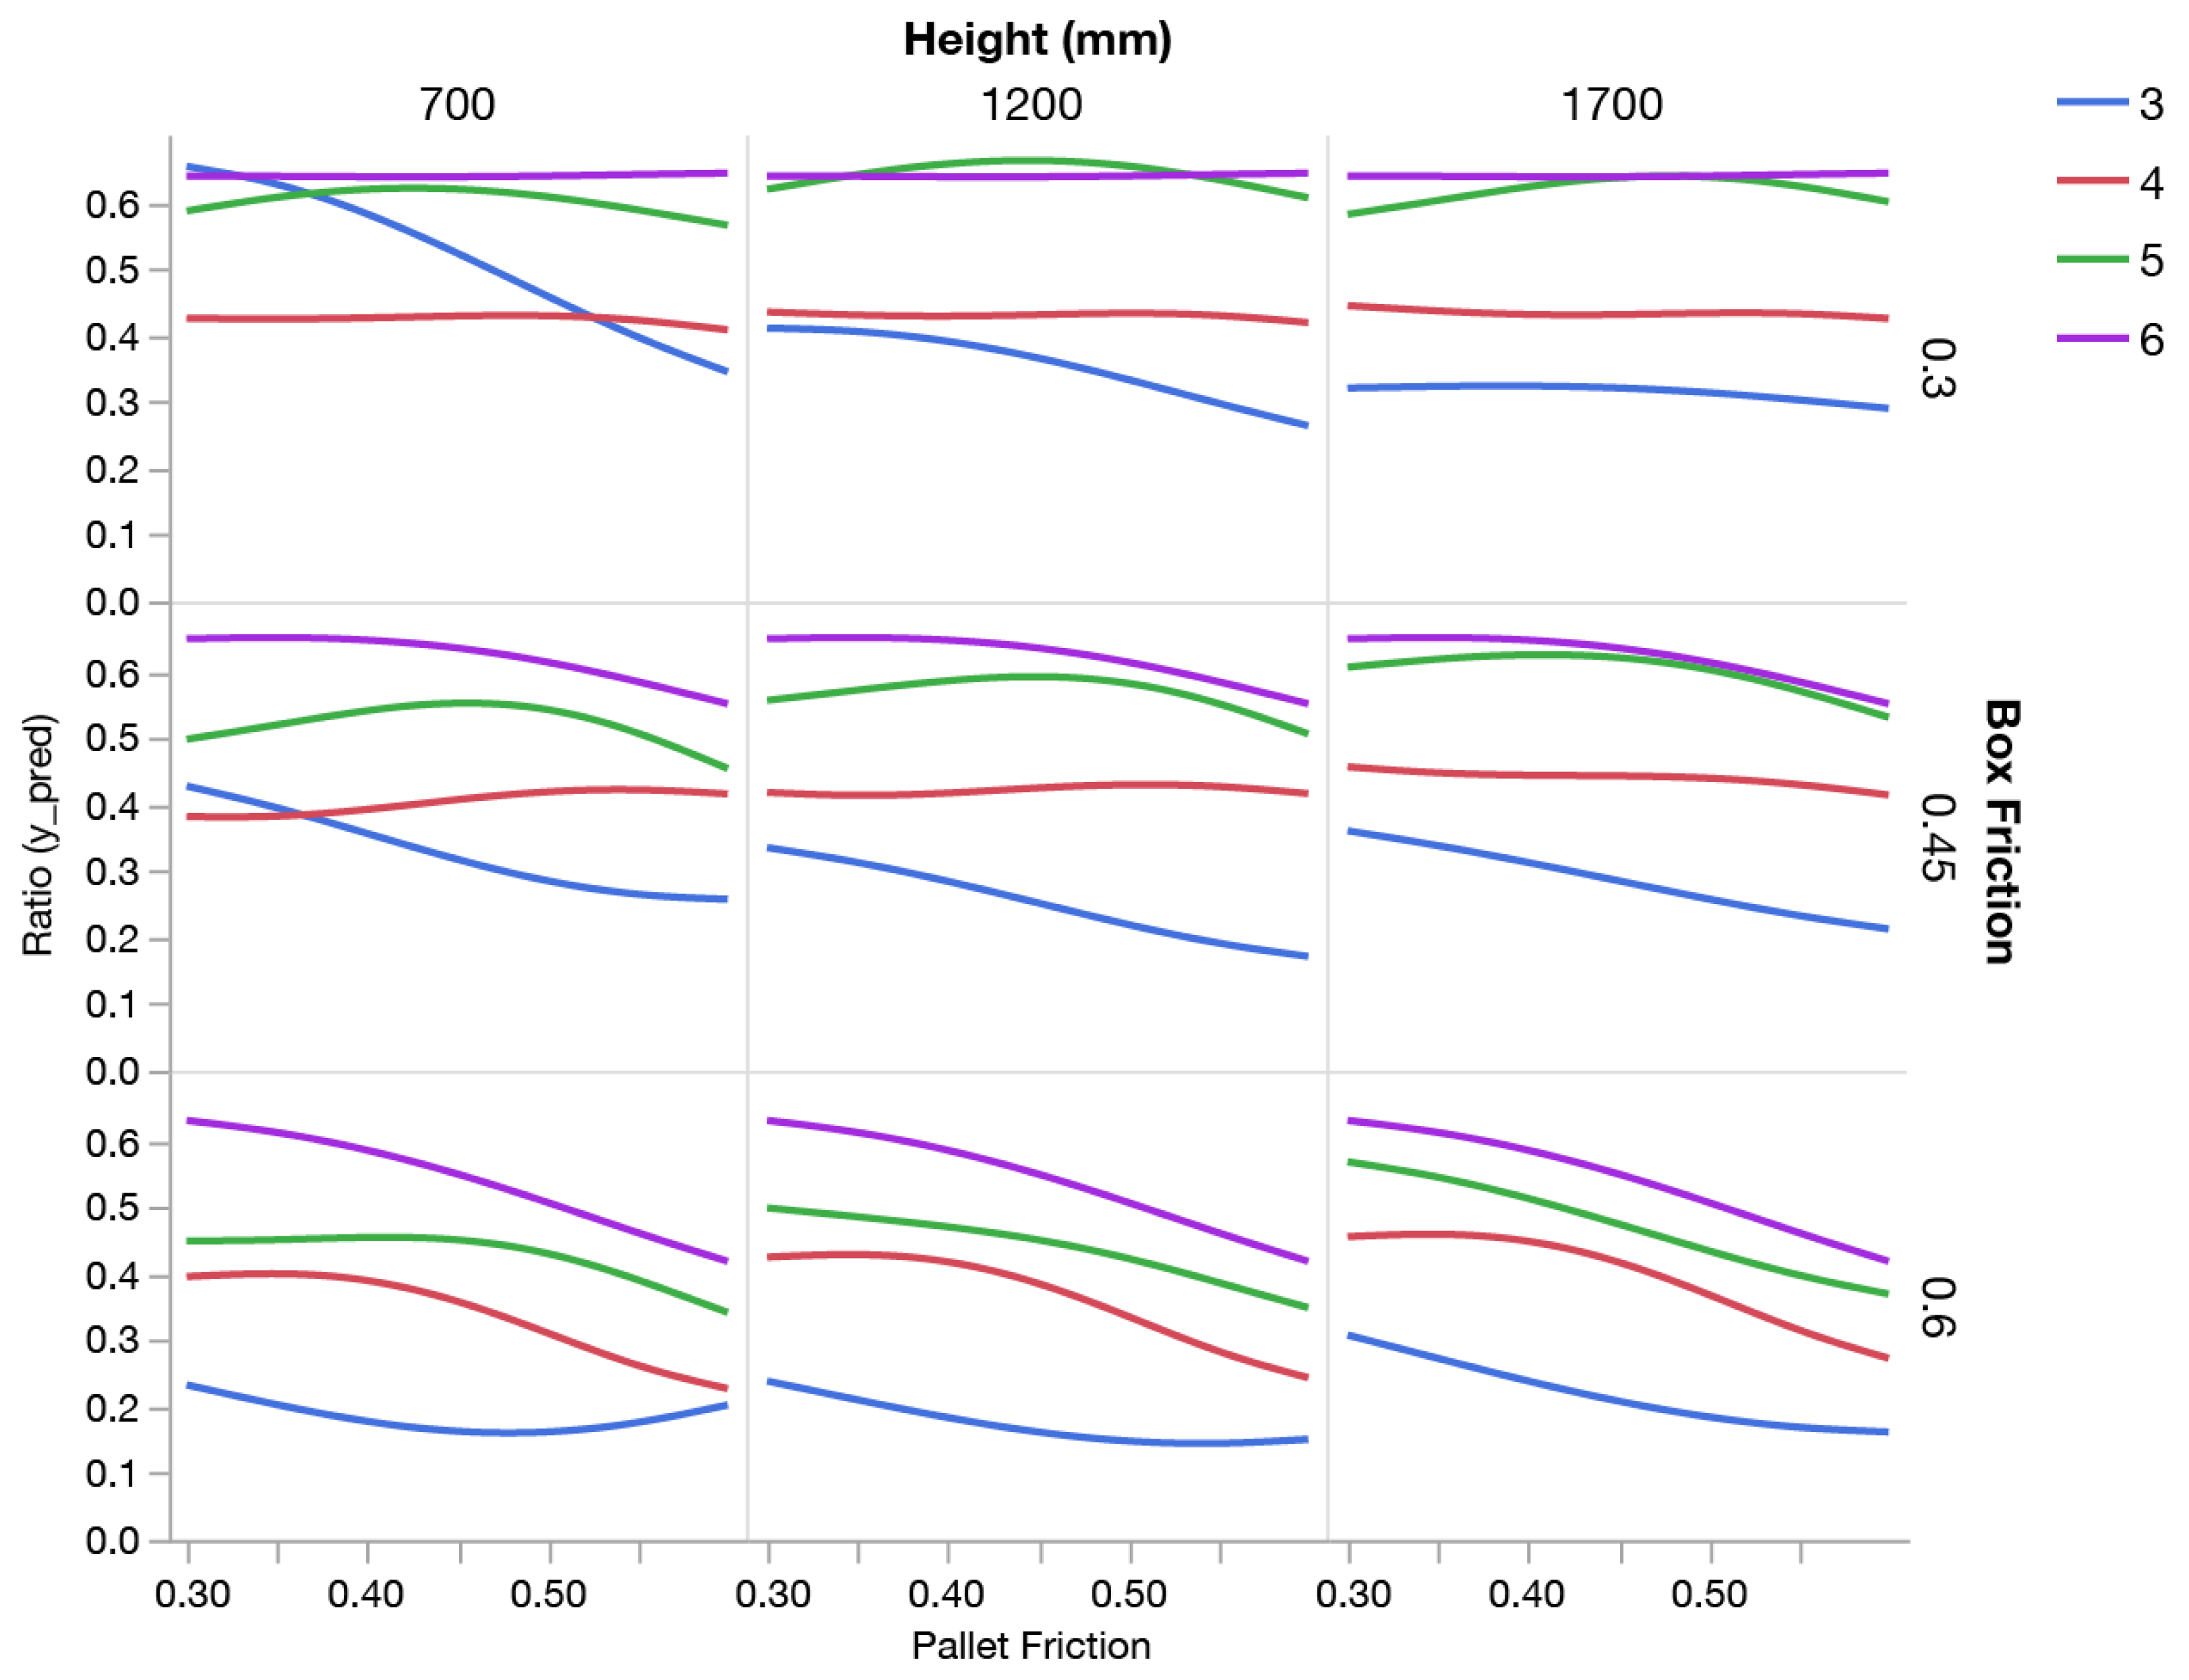
4.1. Discussion on the Load Bridging Effects and Trends by Each Significant Factor
4.1.1. Effect of Number of Columns on the Bending of a Board
4.1.2. Effect of the Payload Height on the Bending Ratio of a Board
4.1.3. Effect of the Pallet Friction Coefficient on the Bending Ratio of a Board
4.1.4. Effect of the Package Friction Coefficients on the Bending Ratio of a Board
4.2. Discussion on the Factor Interactions
4.3. Model Limitations
4.4. Model Implications and Wider Adoption Potential
5. Conclusions
- The number of columns in a unit load, the height of the payload, the friction coefficients of the payload’s contact with the pallet deck, and the contact friction between packages were all found to be significant factors influencing the bending response of pallet analogs loaded with stacked boxes.
- The Gaussian process model can act as a surrogate model for the finite element simulation with a prediction error of five percentage points of the estimated deflection ratio.
- Aside from the significance of each studied factor, the interactions between them were found to be of high relevance to the study of load bridging. Load bridging on unit loads must be studied as a system, where variations in any characteristic will potentially influence its effect on the bending response of the remaining factors.
- The number of columns in a unit load affects the bending response. Increased package size reduces unit load bending in most scenarios, but columns’ interactions with friction forces and payload height can cause an opposite change in deflection.
- Change in payload height translates to a change in the bending of the boards when supporting large boxes with low payload friction. The deflection of unit loads with smaller boxes tends not to be affected by payload height.
- Pallet top deck friction can influence the bending response of certain unit loads, providing a potentially simple method to improve pallet performance.
- The frictional forces of the packages significantly influence the bending responses of the pallet segments, but the addition of containment methods could potentially restrict this slipping behavior. This shows that containment could limit the effect of package friction on unit load deflection.
Author Contributions
Funding
Data Availability Statement
Conflicts of Interest
References
- Research and Markets. Pallet Market: Global Industry Trends, Share, Size, Growth, Opportunity and Forecast 2021–2026. Research and Markets. June 2019. Available online: https://www.researchandmarkets.com/reports/5330942 (accessed on 15 August 2019).
- Twede, D.; Selke, S.E.M.; Kamdem, D.-P.; Shires, D. Cartons, Crates and Corrugated Board: Handbook of Paper and Wood Packaging Technology, 2nd ed.; DEStech Publications, Inc.: Lancaster, PA, USA, 2014. [Google Scholar]
- Quesenberry, C.; Horvath, L.; Bouldin, J.; White, M.S. The effect of pallet top deck stiffness on the compression strength of asymmetrically supported corrugated boxes. Packag. Technol. Sci. 2020, 33, 547–558. [Google Scholar] [CrossRef]
- Kellicut, K.Q. Effect of contents and load bearing surface on compressive strength and stacking life of corrugated containers. Tappi 1963, 46, 151A–154A. [Google Scholar]
- Monaghan, J.; Marcondes, J. Technical Notes: Overhang and Pallet Gap Effects on the Performance of Corrugated Fiberboard Boxes. Trans. ASAE 1992, 35, 1945–1947. [Google Scholar] [CrossRef]
- Baker, M. Effect of Pallet Deckboard Stiffness and Unit Load Factors on Corrugated Box Compression Strength. Ph.D. Thesis, Virginia Tech, Blacksburg, VA, USA, 12 February 2016. [Google Scholar]
- Fagan, B. Load-Support Conditions and Computerized Test Apparatus for Wood Pallets. Master’s Thesis, Virginia Tech, Blacksburg, VA, USA, 5 November 1982. [Google Scholar]
- Loferski, J.R. A Reliability Based Design Procedure for Wood Pallets. Ph.D. Thesis, Virginia Tech, Blacksburg, VA, USA, 7 June 1985. [Google Scholar]
- Hamner, P.; White, M. How to Design Around a Unit Load. Pallet Enterprise. Magazine 2005, 11, 40–42. [Google Scholar]
- Wallin, W.B. Analysis for Safe Load and Deflection for Wooden Pallets and Related Structures; Report; Northeastern Forest Experiment Station, Forestry Sciences Laboratory: Princeton, WV, USA, 1979. [Google Scholar]
- Morrissette, S.M.; Horvath, L.; Delack, K. Investigation into the load bridging effect for block class pallets as a function of package size and pallet stiffness. Packag. Technol. Sci. 2021, 34, 51–69. [Google Scholar] [CrossRef]
- Clayton, A.P.; Horvath, L.; Bouldin, J.; Gething, B. Investigation of the effect of column stacked corrugated boxes on load bridging using partial four-way stringer class wooden pallets. Packag. Technol. Sci. 2019, 32, 423–439. [Google Scholar] [CrossRef]
- Molina, E.; Horvath, L.; White, M.S. Investigation of pallet stacking pattern on unit load bridging. Packag. Technol. Sci. 2018, 31, 653–663. [Google Scholar] [CrossRef]
- Collie, S.T. Laboratory Verification of Pallet Design Procedures. Master’s Thesis, Virginia Tech, Blacksburg, VA, USA, 14 June 1984. [Google Scholar]
- Park, J. Investigation of Fundamental Relationships to Improve the Sustainability of Unit Loads. Ph.D. Thesis, Virginia Tech, Blacksburg, VA, USA, 1 May 2015. [Google Scholar]
- Park, J.; Horvath, L.; White, M.S.; Phanthanousy, S.; Araman, P.; Bush, R.J. The Influence of Package Size and Flute Type of Corrugated Boxes on Load Bridging in Unit Loads. Packag. Technol. Sci. 2017, 30, 33–43. [Google Scholar] [CrossRef] [Green Version]
- Phanthanousy, S. The Effect of the Stiffness of Unit Load Components on Pallet Deflection and Box Compression Strength. Master’s Thesis, Virginia Tech, Blacksburg, VA, USA, 2 May 2017. [Google Scholar]
- Yoo, J. Modeling Compressive Stress Distributions at the Interface between a Pallet Deck and Distribution Packaging. Ph.D. Thesis, Virginia Tech, Blacksburg, VA, USA, 8 September 2011. [Google Scholar]
- Han, J.; White, M.; Hamner, P. Development of a Finite Element Model of Pallet Deformation and Compressive Stresses on Packaging within Pallet Loads. J. Appl. Packag. Res. 2007, 1, 149–162. [Google Scholar]
- Molina, E.; Horvath, L.; West, R. Development of a Friction-Driven Finite Element Model to Simulate the Load Bridging Effect of Unit Loads Stored in Warehouse Racks. Appl. Sci. 2021, 11, 3029. [Google Scholar] [CrossRef]
- Keprate, A.; Ratnayake, R.M.C.; Sankararaman, S. Experimental Validation of the Adaptive Gaussian Process Regression Model Used for Prediction of Stress Intensity Factor as an Alternative to Finite Element Method. J. Offshore Mech. Arct. Eng. 2019, 141, 1–11. [Google Scholar] [CrossRef]
- Maatouk, H.; Bay, X. Gaussian Process Emulators for Computer Experiments with Inequality Constraints. Math. Geol. 2017, 49, 557–582. [Google Scholar] [CrossRef] [Green Version]
- Jones, B.; Johnson, R.T. Design and analysis for the Gaussian process model. Qual. Reliab. Eng. Int. 2009, 25, 515–524. [Google Scholar] [CrossRef] [Green Version]
- Vasudevan, S.; Ramos, F.; Nettleton, E.; Durrant-Whyte, H. Gaussian process modeling of large-scale terrain. J. Field Robot. 2009, 26, 812–840. [Google Scholar] [CrossRef]
- Daud, H.; Aris, M.M.; Noh, K.M.; Dass, S. A Novel Methodology for Hydrocarbon Depth Prediction in Seabed Logging: Gaussian Process-Based Inverse Modeling of Electromagnetic Data. Appl. Sci. 2021, 11, 1492. [Google Scholar] [CrossRef]
- Huang, H.; Qin, A.; Mao, H.; Fu, J.; Huang, Z.; Yang, Y.; Li, X.; Huang, H. The Prediction Method on the Early Failure of Hydropower Units Based on Gaussian Process Regression Driven by Monitoring Data. Appl. Sci. 2020, 11, 153. [Google Scholar] [CrossRef]
- Rong, Y.; Shen, Z.-J.; Yano, C.A. Cheaper by the pallet? Multi-item procurement with standard batch sizes. IIE Trans. 2012, 44, 405–418. [Google Scholar] [CrossRef]
- O’Dell, R.; Clarke, J.W.; White, M.S. Relationship of friction characteristics and pallet performance. Va. Tech. Cent. Unit Load Des. 1998, 1, 1–20. [Google Scholar]
- Altuglas International. Plexiglass General Information and Physical Properties. 2006. Available online: http://www.plexiglas.com/export/sites/plexiglas/.content/medias/downloads/sheet-docs/plexiglas-general-information-and-physical-properties.pdf (accessed on 28 May 2019).
- ISO. ISO 8611-1:2011(E) Pallets for Materials Handling—Flat Pallets. 2011. Available online: https://www.iso.org/standard/50114.html (accessed on 26 October 2021).
- ASTM D-1185. Standard Test Methods for Pallets and Related Structures Employed in Materials Handling and Shipping; ASTM: West Conshohocken, PA, USA, 2009; Published online. [Google Scholar] [CrossRef]


| Variable | Name | Levels | |
|---|---|---|---|
| Low (−) | High (+) | ||
| Payload Weight | 109 kg | 218 kg | |
| Unit Load Columns | 3 | 5 | |
| Unit Load Layers | 3 | 5 | |
| Pallet Friction | 0.20 | 0.60 | |
| Box Friction | 0.20 | 0.60 | |
| Pallet Stiffness | 2.76 GPa | 8.27 GPa | |
| Payload Height | 0.762 m | 1.778 m | |
| ID | Height (mm) | Pallet Friction | Box Vertical Friction | Box Horizontal Friction | Deflection Ratio by Model | |||
|---|---|---|---|---|---|---|---|---|
| 3 Columns | 4 Columns | 5 Columns | 6 Columns | |||||
| Run 001 | 508.00 | 0.66 | 0.48 | 0.41 | 0.38 | 0.36 | 0.33 | 0.39 |
| Run 002 | 547.08 | 0.47 | 0.26 | 0.64 | 0.35 | 0.42 | 0.56 | 0.64 |
| Run 003 | 586.15 | 0.61 | 0.24 | 0.34 | 0.35 | 0.37 | 0.53 | 0.64 |
| Run 004 | 625.23 | 0.43 | 0.39 | 0.43 | 0.37 | 0.42 | 0.61 | 0.64 |
| Run 005 | 664.31 | 0.33 | 0.67 | 0.61 | 0.20 | 0.44 | 0.48 | 0.65 |
| Run 006 | 703.38 | 0.46 | 0.52 | 0.23 | 0.48 | 0.41 | 0.46 | 0.65 |
| Run 007 | 742.46 | 0.28 | 0.30 | 0.30 | 0.65 | 0.43 | 0.58 | 0.62 |
| Run 008 | 781.54 | 0.48 | 0.61 | 0.44 | 0.15 | 0.33 | 0.44 | 0.49 |
| Run 009 | 820.62 | 0.25 | 0.34 | 0.55 | 0.36 | 0.42 | 0.56 | 0.65 |
| Run 010 | 859.69 | 0.70 | 0.29 | 0.53 | 0.26 | 0.47 | 0.55 | 0.64 |
| Run 011 | 898.77 | 0.24 | 0.57 | 0.25 | 0.60 | 0.38 | 0.55 | 0.65 |
| Run 012 | 937.85 | 0.65 | 0.64 | 0.29 | 0.10 | 0.20 | 0.30 | 0.34 |
| Run 013 | 976.92 | 0.56 | 0.44 | 0.60 | 0.22 | 0.43 | 0.55 | 0.62 |
| Run 014 | 1016.00 | 0.69 | 0.62 | 0.52 | 0.14 | 0.24 | 0.30 | 0.34 |
| Run 015 | 1055.08 | 0.35 | 0.49 | 0.69 | 0.29 | 0.43 | 0.62 | 0.63 |
| Run 016 | 1094.15 | 0.60 | 0.41 | 0.33 | 0.20 | 0.45 | 0.55 | 0.66 |
| Run 017 | 1133.23 | 0.52 | 0.66 | 0.67 | 0.17 | 0.31 | 0.41 | 0.57 |
| Run 018 | 1172.31 | 0.29 | 0.65 | 0.46 | 0.27 | 0.44 | 0.57 | 0.66 |
| Run 019 | 1211.38 | 0.42 | 0.25 | 0.56 | 0.32 | 0.43 | 0.58 | 0.64 |
| Run 020 | 1250.46 | 0.20 | 0.43 | 0.39 | 0.34 | 0.46 | 0.59 | 0.64 |
| Run 021 | 1289.54 | 0.38 | 0.42 | 0.24 | 0.29 | 0.42 | 0.63 | 0.63 |
| Run 022 | 1328.62 | 0.41 | 0.47 | 0.48 | 0.28 | 0.43 | 0.57 | 0.64 |
| Run 023 | 1367.69 | 0.30 | 0.23 | 0.37 | 0.32 | 0.45 | 0.59 | 0.64 |
| Run 024 | 1406.77 | 0.53 | 0.20 | 0.32 | 0.34 | 0.45 | 0.60 | 0.64 |
| Run 025 | 1445.85 | 0.49 | 0.70 | 0.38 | 0.14 | 0.32 | 0.42 | 0.66 |
| Run 026 | 1484.92 | 0.64 | 0.32 | 0.49 | 0.27 | 0.43 | 0.59 | 0.65 |
| Run 027 | 1524.00 | 0.23 | 0.33 | 0.58 | 0.32 | 0.44 | 0.58 | 0.64 |
| Run 028 | 1563.08 | 0.67 | 0.51 | 0.20 | 0.18 | 0.32 | 0.40 | 0.43 |
| Run 029 | 1602.15 | 0.34 | 0.69 | 0.62 | 0.24 | 0.47 | 0.55 | 0.64 |
| Run 030 | 1641.23 | 0.62 | 0.53 | 0.47 | 0.17 | 0.32 | 0.42 | 0.43 |
| Run 031 | 1680.31 | 0.58 | 0.35 | 0.70 | 0.27 | 0.45 | 0.62 | 0.64 |
| Run 032 | 1719.38 | 0.21 | 0.55 | 0.51 | 0.39 | 0.46 | 0.58 | 0.65 |
| Run 033 | 1758.46 | 0.26 | 0.56 | 0.28 | 0.33 | 0.45 | 0.58 | 0.63 |
| Run 034 | 1797.54 | 0.39 | 0.46 | 0.65 | 0.29 | 0.45 | 0.63 | 0.64 |
| Run 035 | 1836.62 | 0.37 | 0.28 | 0.21 | 0.31 | 0.44 | 0.58 | 0.64 |
| Run 036 | 1875.69 | 0.55 | 0.38 | 0.35 | 0.26 | 0.45 | 0.62 | 0.64 |
| Run 037 | 1914.77 | 0.44 | 0.21 | 0.57 | 0.34 | 0.45 | 0.59 | 0.65 |
| Run 038 | 1953.85 | 0.32 | 0.37 | 0.42 | 0.36 | 0.45 | 0.59 | 0.65 |
| Run 039 | 1992.92 | 0.57 | 0.60 | 0.66 | 0.19 | 0.32 | 0.40 | 0.46 |
| Run 040 | 2032.00 | 0.51 | 0.58 | 0.26 | 0.19 | 0.39 | 0.54 | 0.51 |
| Factor | Factor Range | |
|---|---|---|
| Minimum | Maximum | |
| Unit Load Columns | 3 | 6 |
| Pallet Friction | 0.20 | 0.70 |
| Box Friction | 0.20 | 0.70 |
| Payload Height (mm) | 508 | 2030 |
| Pallet Segment | Stiffness (GPa) | Deflection (mm) | |
|---|---|---|---|
| 108 kg | 218 kg | ||
| Low stiffness | 2.76 | 22.7 | 44.9 |
| High stiffness | 8.27 | 7.51 | 14.7 |
| Response: Deflection (mm) | Response: Deflection Ratio | ||
|---|---|---|---|
| Term | p-Value | Term | p-Value |
| Pallet Stiffness | <0.0001 | Pallet Friction | <0.0001 |
| Pallet Friction | <0.0001 | Columns | <0.0001 |
| Weight | 0.0001 | Height × Pallet Friction | <0.0001 |
| Pallet Stiffness × Weight | 0.0001 | Height | <0.0001 ^ |
| Box Friction | 0.0002 | Columns × Height | 0.0001 |
| Height | 0.0002 | Box Friction | 0.0001 |
| Box Friction × Pallet Stiffness | 0.0009 | Height × Box Friction | 0.0006 |
| Columns | 0.0010 | Columns × Pallet Friction | 0.0309 |
| Pallet Friction × Pallet Stiffness | 0.0015 | Pallet Friction × Box Friction | 0.0693 |
| Columns × Height | 0.0017 | Box Friction × Pallet Stiffness | 0.1511 |
| Height × Pallet Friction | 0.0023 | Layers × Box Friction | 0.2088 |
| Columns × Pallet Stiffness | 0.0104 | Columns × Box Friction | 0.2088 |
| Height × Box Friction | 0.0134 | Weight | 0.2789 |
| Pallet Friction × Weight | 0.0328 | Columns × Layers | 0.3396 |
| Pallet Friction × Box Friction | 0.0397 | Layers | 0.3489 ^ |
| Height × Pallet Stiffness | 0.0432 | Height × Weight | 0.4402 |
| Columns × Weight | 0.0695 | Layers × Pallet Friction | 0.4586 |
| Box Friction × Weight | 0.1127 | Height × Pallet Stiffness | 0.4966 |
| Layers × Pallet Friction | 0.1460 | Pallet Stiffness × Weight | 0.6204 |
| Columns × Box Friction | 0.2057 | Layers × Pallet Stiffness | 0.6424 |
| Columns × Pallet Friction | 0.2075 | Layers × Height | 0.7101 |
| Height × Weight | 0.5336 | Pallet Friction × Weight | 0.8768 |
| Layers × Pallet Stiffness | 0.6632 | Layers × Weight | 0.9013 |
| Layers × Height | 0.7221 | Box Friction × Weight | 0.9013 |
| Layers × Weight | 0.8300 | Pallet Stiffness | 0.9714 ^ |
| Layers × Box Friction | 0.8668 | Columns × Pallet Stiffness | 0.9753 |
| Columns × Layers | 0.9477 | Columns × Weight | 1.0000 |
| Layers | 0.9577 ^ | Pallet Friction × Pallet Stiffness | 1.0000 |
| Source | p-Value |
|---|---|
| Pallet Friction | <0.0001 |
| Columns | <0.0001 |
| Height | <0.0001 |
| Box Friction | <0.0001 |
| Height × Pallet Friction | <0.0001 |
| Columns × Height | <0.0001 |
| Height × Box Friction | <0.0001 |
| Columns × Height × Pallet Friction | 0.0002 |
| Columns × Height × Box Friction | 0.0013 |
| Columns × Pallet Friction | 0.0025 ^ |
| Height × Pallet Friction × Box Friction | 0.0032 |
| Columns × Box Friction | 0.0749 ^ |
| Columns × Pallet Friction × Box Friction | 0.2725 |
| Pallet Friction × Box Friction | 0.2773 ^ |
| Columns × Height × Pallet Friction × Box Friction | 0.5086 |
| Cross Validation Index (k) | Error Measurement | Model | ||||
|---|---|---|---|---|---|---|
| 3 Columns | 4 Columns | 5 Columns | 6 Columns | Model Average | ||
| 1 | MAPE | 0.26 | 0.06 | 0.10 | 0.05 | 0.12 |
| 2 | 0.22 | 0.17 | 0.07 | 0.04 | 0.12 | |
| 3 | 0.24 | 0.06 | 0.07 | 0.07 | 0.11 | |
| 4 | 0.13 | 0.06 | 0.09 | 0.03 | 0.08 | |
| 5 | 0.12 | 0.09 | 0.08 | 0.17 | 0.11 | |
| 1 | RMSE | 0.06 | 0.04 | 0.05 | 0.05 | 0.05 |
| 2 | 0.05 | 0.07 | 0.04 | 0.02 | 0.05 | |
| 3 | 0.08 | 0.03 | 0.04 | 0.06 | 0.06 | |
| 4 | 0.05 | 0.04 | 0.06 | 0.03 | 0.05 | |
| 5 | 0.10 | 0.05 | 0.06 | 0.09 | 0.08 | |
| Deflection (mm) | Change | V. Mises Stress (MPa) | Change | |
|---|---|---|---|---|
| Uniform | 22.70 | - | 6.42 | - |
| 3 columns | 7.72 | −66% | 1.85 | −67% |
| 4 columns | 10.44 | −54% | 2.55 | −57% |
| 5 columns | 13.39 | −41% | 3.67 | −41% |
| 6 columns | 14.53 | −36% | 3.92 | −37% |
Publisher’s Note: MDPI stays neutral with regard to jurisdictional claims in published maps and institutional affiliations. |
© 2021 by the authors. Licensee MDPI, Basel, Switzerland. This article is an open access article distributed under the terms and conditions of the Creative Commons Attribution (CC BY) license (https://creativecommons.org/licenses/by/4.0/).
Share and Cite
Molina, E.; Horvath, L. Development of a Gaussian Process Model as a Surrogate to Study Load Bridging Performance in Racked Pallets. Appl. Sci. 2021, 11, 11865. https://doi.org/10.3390/app112411865
Molina E, Horvath L. Development of a Gaussian Process Model as a Surrogate to Study Load Bridging Performance in Racked Pallets. Applied Sciences. 2021; 11(24):11865. https://doi.org/10.3390/app112411865
Chicago/Turabian StyleMolina, Eduardo, and Laszlo Horvath. 2021. "Development of a Gaussian Process Model as a Surrogate to Study Load Bridging Performance in Racked Pallets" Applied Sciences 11, no. 24: 11865. https://doi.org/10.3390/app112411865
APA StyleMolina, E., & Horvath, L. (2021). Development of a Gaussian Process Model as a Surrogate to Study Load Bridging Performance in Racked Pallets. Applied Sciences, 11(24), 11865. https://doi.org/10.3390/app112411865