
Machine Learning Model to Estimate Net Joint Moments during Lifting Task Using Wearable Sensors: A Preliminary Study for Design of Exoskeleton Control System


 ,
,
Abstract
:1. Introduction
2. Materials and Methods
2.1. Subjects, Apparatus, and Lifting Experiments
2.2. Data Processing
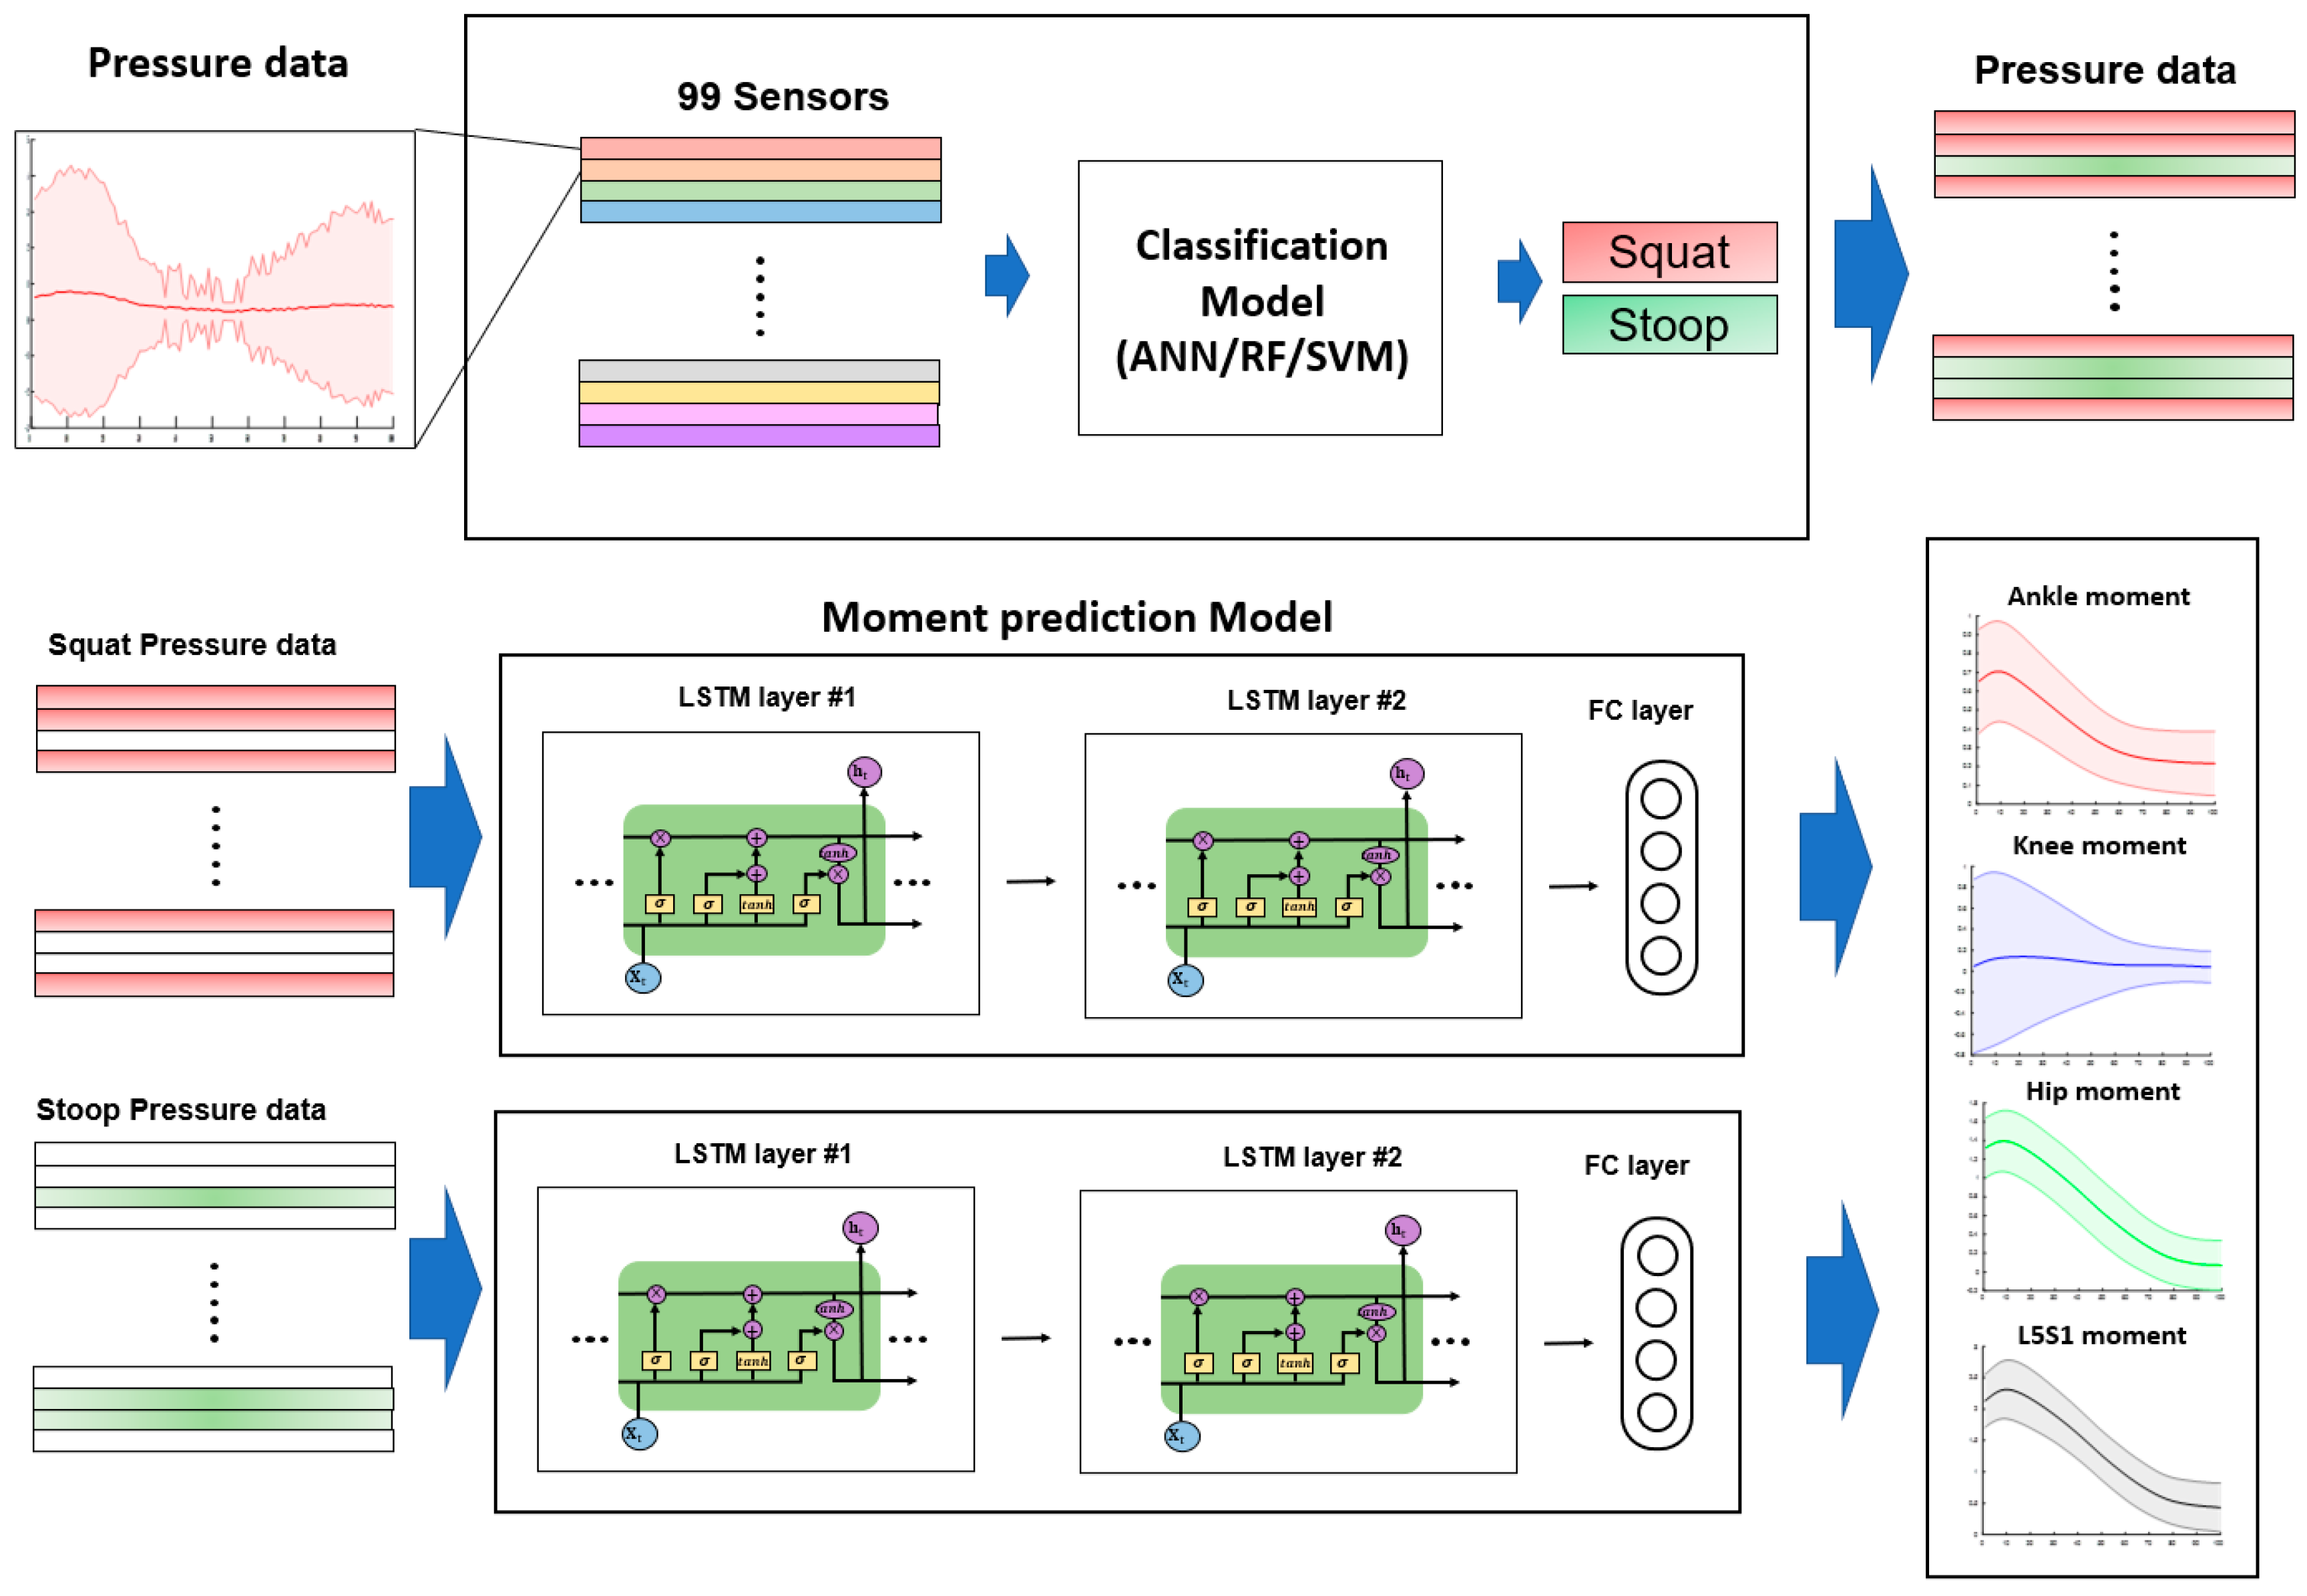
2.3. Neural Network Architecture
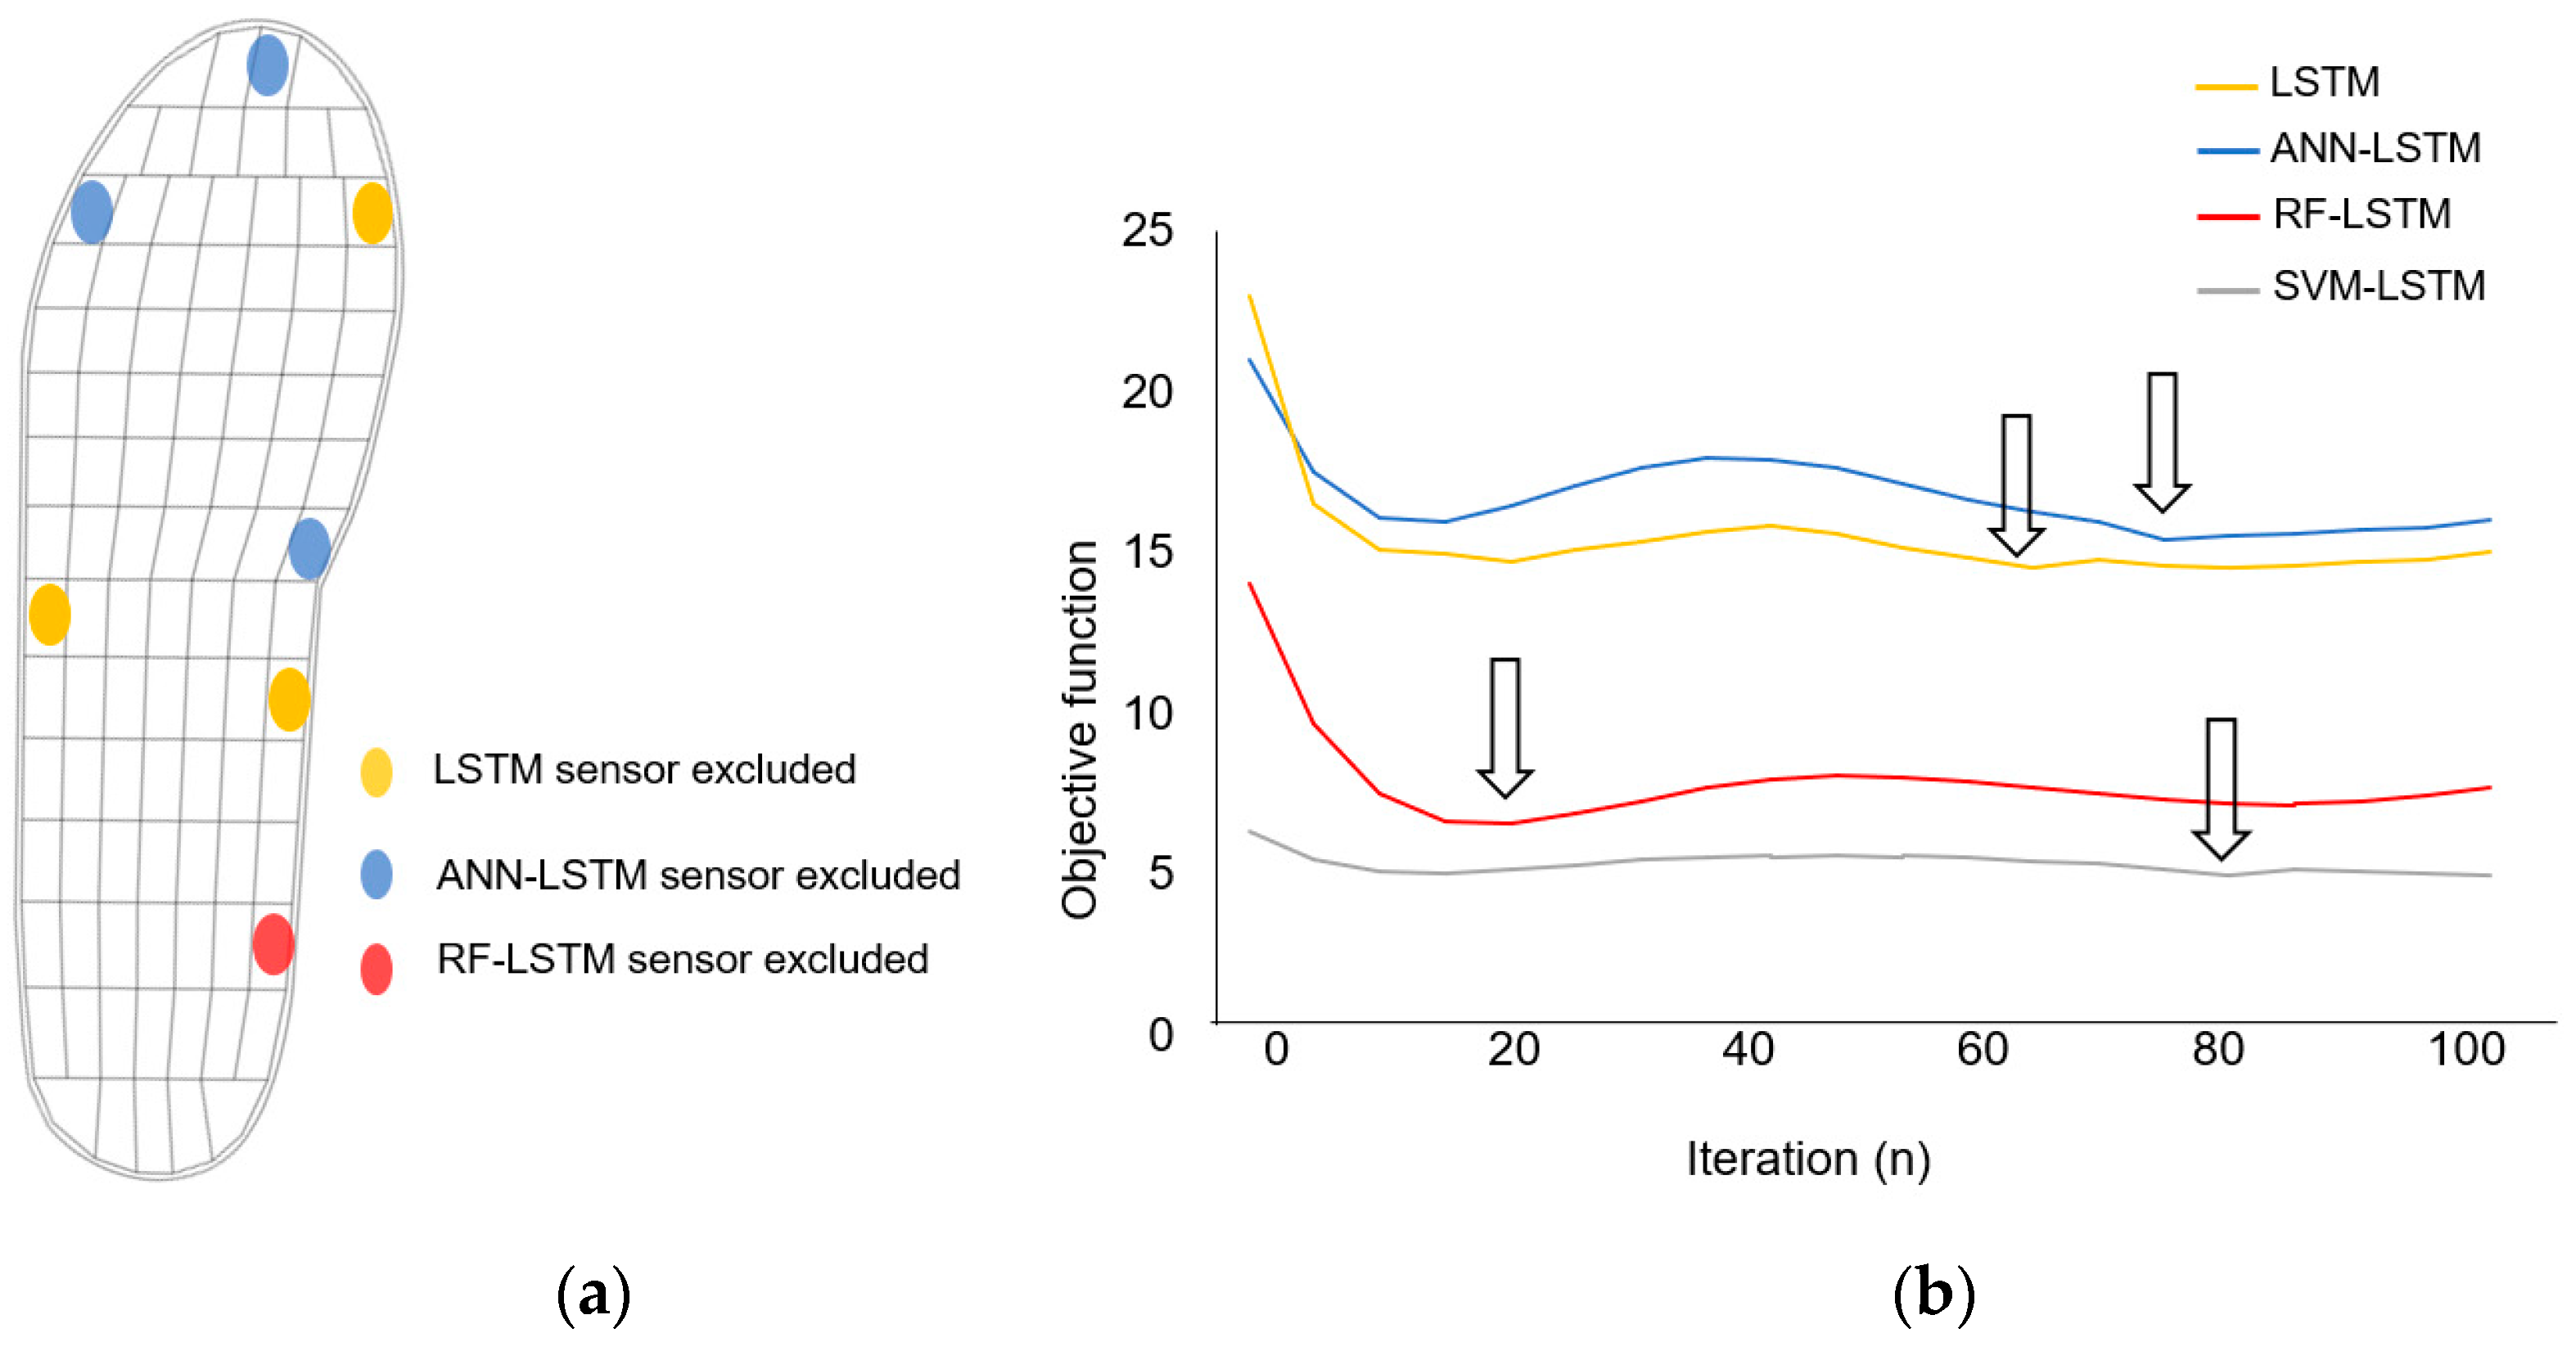
2.4. Hyperparameter Optimization
2.5. Data Analysis
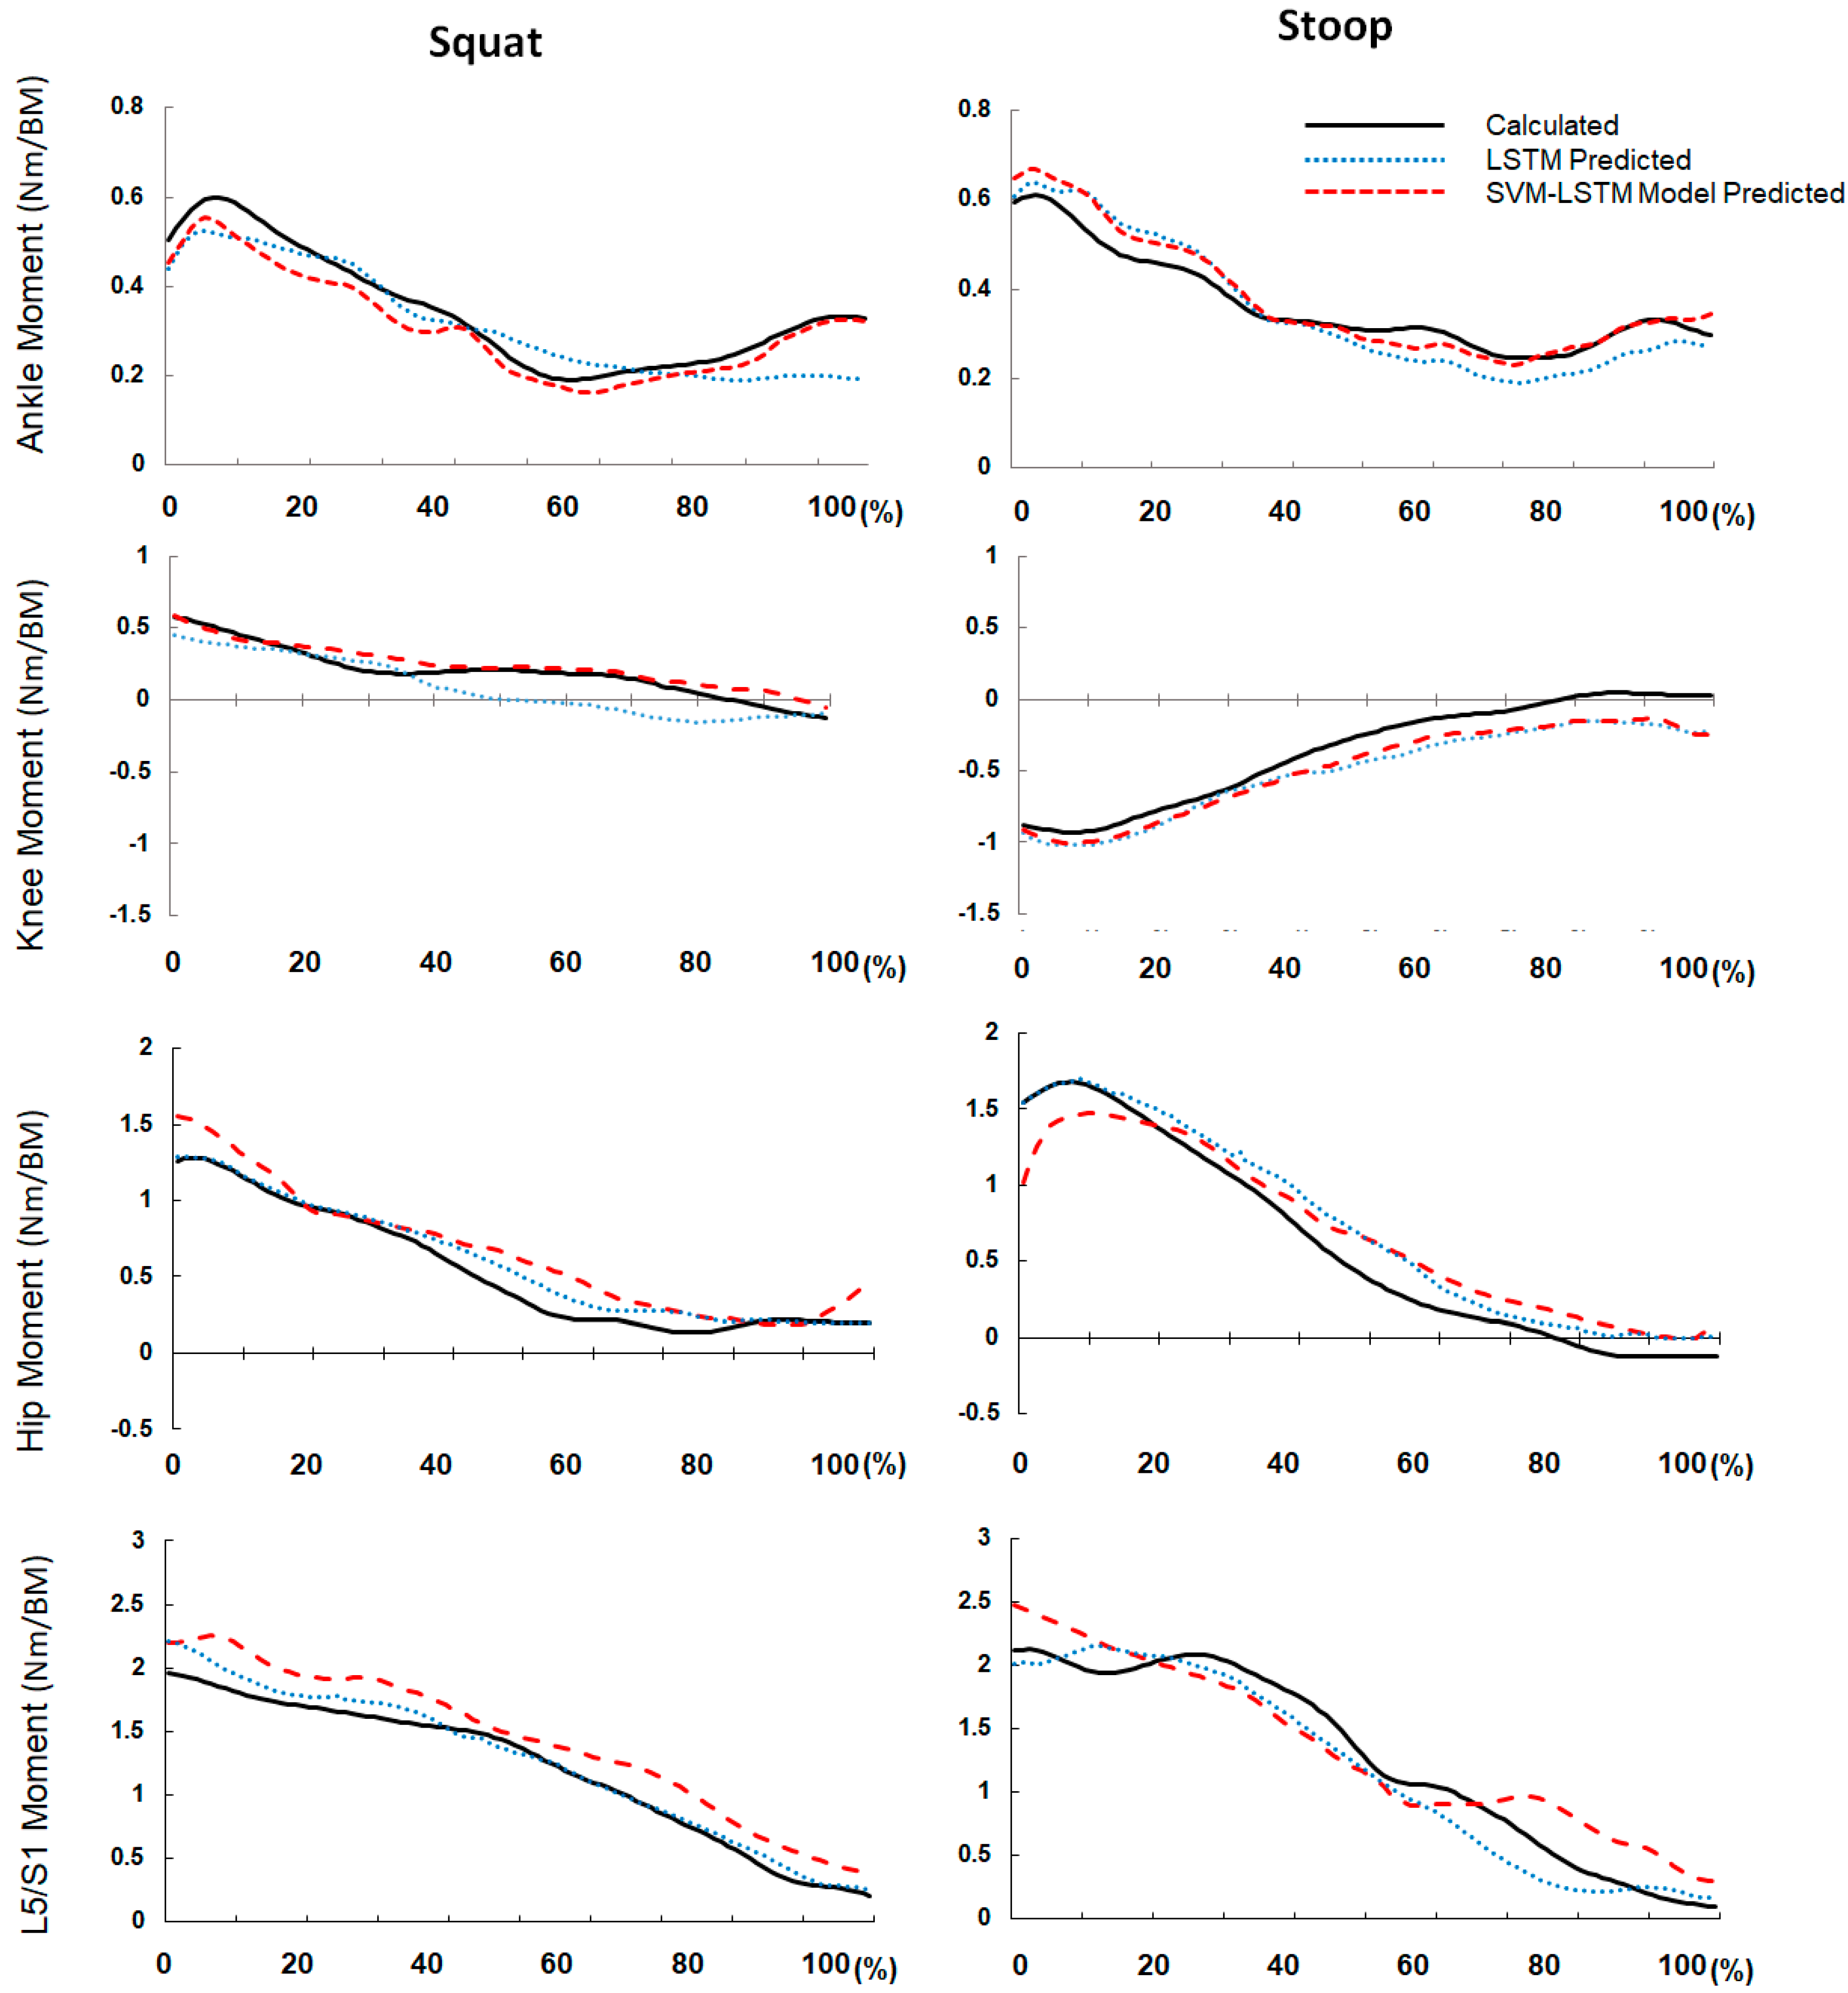
3. Results
4. Discussion
Author Contributions
Funding
Institutional Review Board Statement
Informed Consent Statement
Data Availability Statement
Conflicts of Interest
References
- Van Der Have, A.; Van Rossom, S.; Jonkers, I. Squat lifting imposes higher peak joint and muscle loading compared to stoop lifting. Appl. Sci. 2019, 9, 3794. [Google Scholar] [CrossRef] [Green Version]
- Bernard, B. Musculoskeletal Disorders (MSDs) and Workplace Factors; US Department of Health and Human Services: Cincinnati, OH, USA, 1997.
- Kingma, I.; De Looze, M.P.; Toussaint, H.M.; Klijnsma, H.G.; Bruijnen, T.B.M. Validation of a full body 3-D dynamic linked segment model. Hum. Mov. Sci. 1996, 15, 833–860. [Google Scholar] [CrossRef]
- Shimokochi, Y.; Yong Lee, S.; Shultz, S.J.; Schmitz, R.J. The relationships among sagittal-plane lower extremity moments: Implications for landing strategy in anterior cruciate ligament injury prevention. J. Athl. Train. 2009, 44, 33–38. [Google Scholar] [CrossRef] [PubMed] [Green Version]
- Lavender, S.A.; Andersson, G.B.J.; Schipplein, O.D.; Fuentes, H.J. The effects of initial lifting height, load magnitude, and lifting speed on the peak dynamic L5/S1 moments. Int. J. Ind. Ergon. 2003, 31, 51–59. [Google Scholar] [CrossRef]
- Hwang, S.; Kim, Y.; Kim, Y. Lower extremity joint kinetics and lumbar curvature during squat and stoop lifting. BMC Musculoskelet. Disord. 2009, 10, 15. [Google Scholar] [CrossRef] [Green Version]
- Faber, G.S.; Kingma, I.; van Dieën, J.H. Effect of initial horizontal object position on peak L5/S1 moments in manual lifting is dependent on task type and familiarity with alternative lifting strategies. Ergonomics 2011, 54, 72–81. [Google Scholar] [CrossRef]
- Choi, A.R.; Yun, T.S.; Lee, K.S.; Min, K.K.; Hwang, H.; Lee, K.Y.; Oh, E.C.; Mun, J.H. Asymmetric loading of erector spinae muscles during sagittally symmetric lifting. J. Mech. Sci. Technol. 2009, 23, 64–74. [Google Scholar] [CrossRef]
- Li, G.; Buckle, P. Current techniques for assessing physical exposure to work-related musculoskeletal risks, with emphasis on posture-based methods. Ergonomics 1999, 42, 674–695. [Google Scholar] [CrossRef] [PubMed]
- Schreven, S.; Beek, P.J.; Smeets, J.B.J. Optimising filtering parameters for a 3D motion analysis system. J. Electromyogr. Kinesiol. 2015, 25, 808–814. [Google Scholar] [CrossRef] [Green Version]
- Gallagher, S.; Kotowski, S.; Davis, K.G.; Mark, C.; Compton, C.S.; Huston, R.L.; Connelly, J. External L5–S1 joint moments when lifting wire mesh screen used to prevent rock falls in underground mines. Int. J. Ind. Ergon. 2009, 39, 828–834. [Google Scholar] [CrossRef]
- Kuijer, P.P.F.M.; van Oostrom, S.H.; Duijzer, K.; Van Dieen, J.H. Maximum acceptable weight of lift reflects peak lumbosacral extension moments in a functional capacity evaluation test using free style, stoop and squat lifting. Ergonomics 2012, 55, 343–349. [Google Scholar] [CrossRef]
- Hlucny, S.D.; Novak, D. Characterizing human box-lifting behavior using wearable inertial motion sensors. Sensors 2020, 20, 2323. [Google Scholar] [CrossRef]
- David, G.C. Ergonomic methods for assessing exposure to risk factors for work-related musculoskeletal disorders. Occup. Med. 2005, 55, 190–199. [Google Scholar] [CrossRef] [PubMed] [Green Version]
- Wang, C.; Wang, N.; Ho, S.-C.; Chen, X.; Pan, M.; Song, G. Design of a novel wearable sensor device for real-time bolted joints health monitoring. IEEE Internet Things J. 2018, 5, 5307–5316. [Google Scholar] [CrossRef]
- Faber, G.S.; Chang, C.C.; Kingma, I.; Dennerlein, J.T.; Van Dieën, J.H. Estimating 3D L5/S1 moments and ground reaction forces during trunk bending using a full-body ambulatory inertial motion capture system. J. Biomech. 2016, 49, 904–912. [Google Scholar] [CrossRef] [Green Version]
- Matijevich, E.S.; Volgyesi, P.; Zelik, K.E. A promising wearable solution for the practical and accurate monitoring of low back loading in manual material handling. Sensors 2021, 21, 340. [Google Scholar] [CrossRef]
- Conforti, I.; Mileti, I.; Panariello, D.; Caporaso, T.; Grazioso, S.; Del Prete, Z.; Lanzotti, A.; Di Gironimo, G.; Palermo, E. Validation of a novel wearable solution for measuring L5/S1 load during manual material handling tasks. In Proceedings of the 2020 IEEE International Workshop on Metrology for Industry 4.0 & IoT (IEEE2020), Roma, Italy, 3–5 June 2020; pp. 501–506. [Google Scholar] [CrossRef]
- Faber, G.S.; Kingma, I.; Chang, C.C.; Dennerlein, J.T.; Van Dieen, J.H. Validation of a wearable system for 3D ambulatory L5/S1 moment assessment during manual lifting using instrumented shoes and an inertial sensor suit. J. Biomech. 2020, 102, 109671. [Google Scholar] [CrossRef] [PubMed]
- Jacobs, D.A.; Ferris, D.P. Estimation of ground reaction forces and ankle moment with multiple, low-cost sensors. J. NeuroEng. Rehabil. 2015, 12, 90. [Google Scholar] [CrossRef] [PubMed] [Green Version]
- Sim, T.; Kwon, H.; Oh, S.E.; Joo, S.-B.; Choi, A.; Heo, H.M.; Kim, K.; Mun, J.H. Predicting complete ground reaction forces and moments during gait with insole plantar pressure information using a wavelet neural network. J. Biomech. Eng. 2015, 137, 091001. [Google Scholar] [CrossRef]
- Mundt, M.; Johnson, W.R.; Potthast, W.; Markert, B.; Mian, A.; Alderson, J. A Comparison of Three Neural Network Approaches for Estimating Joint Angles and Moments from Inertial Measurement Units. Sensors 2021, 21, 4535. [Google Scholar] [CrossRef]
- Mundt, M.; Thomsen, W.; Witter, T.; Koeppe, A.; David, S.; Bamer, F.; Potthast, W.; Markert, B. Prediction of lower limb joint angles and moments during gait using artificial neural networks. Med. Biol. Eng. Comput. 2020, 58, 211–225. [Google Scholar] [CrossRef] [PubMed]
- Choi, A.; Jung, H.; Mun, J.H. Single inertial sensor-based neural networks to estimate COM-COP inclination angle during walking. Sensors 2019, 19, 2974. [Google Scholar] [CrossRef] [Green Version]
- Jin, Z.; Wang, D.; Zhang, H.; Liang, J.; Feng, X.; Zhao, J.; Sun, L. Incidence trend of five common musculoskeletal disorders from 1990 to 2017 at the global, regional and national level: Results from the global burden of disease study 2017. Annals of the rheumatic diseases. Ann. Rheum. Dis. 2020, 79, 1014–1022. [Google Scholar] [CrossRef]
- Choi, A.; Lee, I.K.; Choi, M.T.; Mun, J.H. Inter-joint coordination between hips and trunk during downswings: Effects on the clubhead speed. J. Sports Sci. 2016, 34, 1991–1997. [Google Scholar] [CrossRef]
- Choi, A.; Jung, H.; Lee, K.Y.; Lee, S.; Mun, J.H. Machine learning approach to predict center of pressure trajectories in a complete gait cycle: A feedforward neural network vs. LSTM network. Med. Biol. Eng. Comput. 2019, 57, 2693–2703. [Google Scholar] [CrossRef]
- Ramanathan, A.K.; Kiran, P.; Arnold, G.P.; Wang, W.; Abboud, R.J. Repeatability of the Pedar-X® in-shoe pressure measuring system. Foot Ankle Surg. 2010, 16, 70–73. [Google Scholar] [CrossRef]
- Chang, C.-C.; McGorry, R.W.; Lin, J.-H.; Xu, X.; Hsiang, S.M. Prediction accuracy in estimating joint angle trajectories using a video posture coding method for sagittal lifting tasks. Ergonomics 2010, 53, 1039–1047. [Google Scholar] [CrossRef]
- Choi, A.; Sim, T.; Mun, J.H. Quasi-stiffness of the knee joint in flexion and extension during the golf swing. J. Sports Sci. 2015, 33, 1682–1691. [Google Scholar] [CrossRef]
- Joo, S.-B.; Oh, S.E.; Sim, T.; Kim, H.; Choi, C.H.; Koo, H.; Mun, J.H. Prediction of gait speed from plantar pressure using artificial neural networks. Expert Syst. Appl. 2014, 41, 7398–7405. [Google Scholar] [CrossRef]
- Gholipour, A.; Arjmand, N. Artificial neural networks to predict 3D spinal posture in reaching and lifting activities; Applications in biomechanical models. J. Biomech. 2016, 49, 2946–2952. [Google Scholar] [CrossRef]
- Conforti, I.; Mileti, I.; Del Prete, Z.; Palermo, E. Measuring biomechanical risk in lifting load tasks through wearable system and machine-learning approach. Sensors 2020, 20, 1557. [Google Scholar] [CrossRef] [Green Version]
- Wu, C.-C.; Chen, Y.-J.; Hsu, C.-S.; Wen, Y.-T.; Lee, Y.-J. Multiple inertial measurement unit combination and location for center of pressure prediction in gait. Front. Bioeng. Biotechnol. 2020, 8, 1252. [Google Scholar] [CrossRef] [PubMed]
- Zebin, T.; Sperrin, M.; Peek, N.; Casson, A.J. Human activity recognition from inertial sensor time-series using batch normalized deep LSTM recurrent networks. In Proceedings of the 2018 40th Annual International Conference of the IEEE Engineering in Medicine and Biology Society (EMBC), Honolulu, HI, USA, 18 July 2018; pp. 1–4. [Google Scholar] [CrossRef] [Green Version]
- Zaroug, A.; Garofolini, A.; Lai, D.T.H.; Mudie, K.; Begg, R. Prediction of gait trajectories based on the long short term memory neural networks. PLoS ONE 2021, 16, e0255597. [Google Scholar] [CrossRef] [PubMed]
- Kim, H.; Moon, H.; Ha, H.; Lee, J.; Yu, J.; Chae, S.; Mun, J.; Choi, A. Can a deep learning model estimate low back torque during a golf swing? Int. J. Biotechnol. Sports Eng. 2021, 2, 59–65. [Google Scholar]
- Wu, J.; Chen, X.-Y.; Zhang, H.; Xiong, L.-D.; Lei, H.; Deng, S.-H. Hyperparameter optimization for machine learning models based on Bayesian optimization b. J. Electron. Sci. 2019, 17, 26–40. [Google Scholar] [CrossRef]
- Zeiaee, A.; Soltani-Zarrin, R.; Langari, R.; Tafreshi, R. Kinematic Design Optimization of an Eight Degree-of-Freedom Upper-Limb Exoskeleton. Robotica 2019, 37, 2073–2086. [Google Scholar] [CrossRef]
- Kipp, K.; Giordanelli, M.; Geiser, C. Predicting net joint moments during a weightlifting exercise with a neural network model. J. Biomech. 2018, 74, 225–229. [Google Scholar] [CrossRef] [Green Version]
- Antwi-Afari, M.F.; Li, H.; Yu, Y.; Kong, L. Wearable insole pressure system for automated detection and classification of awkward working postures in construction workers. Autom. Constr. 2018, 96, 433–441. [Google Scholar] [CrossRef]
- Khashei, M.; Hamadani, A.Z.; Bijari, M. A novel hybrid classification model of artificial neural networks and multiple linear regression models. Expert Syst. Appl. 2012, 39, 2606–2620. [Google Scholar] [CrossRef]
- Zhang, X.; Li, B. Influence of in-shoe heel lifts on plantar pressure and center of pressure in the medial–lateral direction during walking. Gait Posture 2014, 39, 1012–1016. [Google Scholar] [CrossRef]
- Friedenberg, R.; Kalichman, L.; Ezra, D.; Wacht, O.; Alperovitch-Najenson, D. Work-related musculoskeletal disorders and injuries among emergency medical technicians and paramedics: A comprehensive narrative review. Arch. Environ. Occup. Health 2020, 1–9, in press. [Google Scholar] [CrossRef] [PubMed]
- Jung, H.; Choi, A.; Moon, J.; Chae, S.H.; Lee, K.; Kim, K.; Mun, J.H. Insole system-based neural network model to evaluate force risk in cube method: Application to pepper farming tasks. J. Med. Imaging Health Inform. 2020, 10, 1444–1451. [Google Scholar] [CrossRef]
- Mokarami, H.; Varmazyar, S.; Kazemi, R.; Taghavi, S.M.; Stallones, L.; Marioryad, H.; Farahmand, F. Low cost ergonomic interventions to reduce risk factors for work related musculoskeletal disorders during dairy farming. Work 2019, 64, 195–201. [Google Scholar] [CrossRef] [PubMed]


| ANN Hyperparameter | Neuron | Momentum | Learning Rate | Training Function |
|---|---|---|---|---|
| Range | 20–200 | 10−5–10−2 | 10−6–10−2 | trainscg, trainlm, traingdx |
| Selected Parameter | 35 | 0.0036 | 4.45 × 10⁻⁵ | trainscg |
| RF Hyperparameter | Min Leaf Size | Max Number Splits | Split Criterion | Variables’ Sample |
| Range | 1–240 | 1–479 | gdi, deviance, twoing | 1–99 |
| Selected Parameter | 5 | 177 | Deviance | 99 |
| SVM Hyperparameter | Box Constraint | Kernel Scale | Kernel Function | Polynomial Order |
| Range | 10−5–10−3 | 10−5–103 | Gaussian, linear, polynomial | 2–4 |
| Selected Parameter | 9.75 × 10² | 10−3 | polynomial | 2 |
| Phase | Hyperparameter | Range |
|---|---|---|
| Structure | Bi-LSTM layer1 | 99–990 |
| Dropout layer | 0.5–0.95 | |
| Bi-LSTM layer2 | 99–990 | |
| Dropout layer | 0.5–0.95 | |
| Bi-LSTM layer3 | 99–990 | |
| Fully connected layer1 | 10–50 | |
| Dropout layer | 0.5–0.95 | |
| Fully connected layer2 | Fully connected layer1/2 | |
| Training | Momentum | 0.5–0.95 |
| L2 regularization factor | 10−5–10−2 | |
| Initial learning rate | 10−5–10−2 | |
| Input weights initializer | Glorot, He, Narrow-normal | |
| Gradient threshold method | Global-l2norm, l2norm | |
| Gradient threshold | 1–6 | |
| Number of layers | 1–3 | |
| Number of sensors selected | 3–99 |
| Phase | Hyperparameter | LSTM | ANN-LSTM | RF-LSTM | SVM-LSTM | |||
|---|---|---|---|---|---|---|---|---|
| Squat | Stoop | Squat | Stoop | Squat | Stoop | |||
| Regression Structure | Bi-LSTM layer1 Node | 103 | 610 | 88 | 625 | 211 | 104 | 168 |
| Dropout layer | 0.172 | 0.120 | - | 0.101 | - | - | 0.267 | |
| Bi-LSTM layer2 Node | 103 | 439 | - | 387 | - | - | 167 | |
| Dropout layer | 0.172 | 0.1203 | - | 0.101 | - | - | 0.267 | |
| Bi-LSTM layer3 node | 31 | 316 | - | 240 | - | - | 166 | |
| Fully connected layer1 | 43 | 20 | 50 | 26 | 36 | 17 | 31 | |
| Dropout layer | 0.172 | 0.120 | 0.386 | 0.101 | 0.136 | 0.149 | 0.267 | |
| Fully connected layer2 | 22 | 10 | 25 | 13 | 18 | 9 | 16 | |
| Fully connected layer3 | 4 | 4 | 4 | 4 | 4 | 4 | 4 | |
| Training | Momentum | 0.920 | 0.503 | 0.812 | 0.530 | 0.701 | 0.643 | 0.709 |
| L2 regularization factor | 8.49 × 10⁻⁴ | 6.28 × 10⁻³ | 8.41 × 10⁻³ | 7.16 × 10⁻³ | 9.07 × 10⁻³ | 8.45 × 10⁻³ | 4.84 × 10⁻³ | |
| Initial learning rate | 2.67 × 10⁻³ | 1.87 × 10⁻³ | 8.41 × 10⁻³ | 9.27 × 10⁻⁴ | 4.89 × 10⁻³ | 6.75 × 10⁻³ | 2.78 × 10⁻³ | |
| Input weights initializer | He | Glorot | Glorot | Glorot | Narrow-normal | Glorot | Glorot | |
| Gradient threshold method | l2norm | Global-l2norm | Global-l2norm | Global-l2norm | Global-l2norm | l2norm | l2norm | |
| Gradient threshold | 2 | 1 | 5 | 1 | 3 | 1 | 4 | |
| Number of layers | 3 | 3 | 1 | 3 | 1 | 1 | 3 | |
| 1. ANN | 2. RF | 3. SVM | ANOVA | Post Hoc Test | |
|---|---|---|---|---|---|
| Squat accuracy (%) | 87.06 ± 9.11 | 91.36 ± 7.16 | 92.84 ± 6.00 | - | - |
| Stoop accuracy (%) | 80.26 ± 5.67 | 92.15 ± 5.57 | 94.59 ± 2.93 | - | - |
| Total accuracy (%) | 83.54 ± 4.48 | 91.67 ± 3.40 | 94.00 ± 2.43 | F = 16.1 (p < 0.01) | 2, 3 > 1 |
| Ankle | Knee | Hip | L5S1 | ||||||||||
|---|---|---|---|---|---|---|---|---|---|---|---|---|---|
| r | RMSE (N∙m/BW) | rRMSE (%) | r | RMSE (N∙m/BW) | rRMSE (%) | r | RMSE (N∙m/BW) | rRMSE (%) | r | RMSE (N∙m/BW) | rRMSE (%) | ||
| Squat | LSTM | 0.85 | 0.056 ± 0.007 | 12.19 ± 3.21 | 0.83 | 0.150 ± 0.010 | 18.64 ± 2.18 | 0.94 | 0.127 ± 0.017 | 9.38 ± 1.40 | 0.96 | 0.189 ± 0.021 | 9.95 ± 0.97 |
| NN-LSTM | 0.87 | 0.052 ± 0.005 | 11.72 ± 2.04 | 0.79 | 0.167 ± 0.033 | 20.35 ± 5.80 | 0.95 | 0.121 ± 0.016 | 8.81 ± 3.28 | 0.94 | 0.174 ± 0.024 | 9.23 ± 1.44 | |
| RF-LSTM | 0.92 | 0.050 ± 0.004 | 10.69 ± 0.86 | 0.87 | 0.126 ± 0.032 | 16.33 ± 2.97 | 0.96 | 0.108 ± 0.024 | 8.06 ± 1.51 | 0.95 | 0.167 ± 0.033 | 8.50 ± 1.87 | |
| SVM-LSTM | 0.93 | 0.048 ± 0.007 | 10.48 ± 1.65 | 0.91 | 0.121 ± 0.023 | 14.03 ± 3.23 | 0.96 | 0.112 ± 0.030 | 8.08 ± 1.49 | 0.95 | 0.167 ± 0.026 | 8.44 ± 1.30 | |
| Stoop | LSTM | 0.94 | 0.052 ± 0.005 | 11.58 ± 1.75 | 0.88 | 0.155 ± 0.032 | 18.70 ± 4.01 | 0.94 | 0.128 ± 0.017 | 9.26 ± 1.40 | 0.94 | 0.194 ± 0.029 | 10.04 ± 0.75 |
| NN-LSTM | 0.86 | 0.059 ± 0.009 | 12.66 ± 3.21 | 0.83 | 0.153 ± 0.042 | 18.36 ± 4.32 | 0.95 | 0.136 ± 0.043 | 9.59 ± 1.67 | 0.93 | 0.206 ± 0.036 | 11.20 ± 2.14 | |
| RF-LSTM | 0.93 | 0.049 ± 0.007 | 10.12 ± 2.36 | 0.90 | 0.120 ± 0.034 | 15.36 ± 3.11 | 0.96 | 0.102 ± 0.023 | 7.91 ± 1.90 | 0.95 | 0.176 ± 0.027 | 9.64 ± 1.82 | |
| SVM-LSTM | 0.94 | 0.048 ± 0.009 | 10.22 ± 3.17 | 0.92 | 0.117 ± 0.031 | 13.73 ± 2.51 | 0.96 | 0.113 ± 0.028 | 8.02 ± 2.47 | 0.96 | 0.173 ± 0.021 | 8.81 ± 1.17 | |
| Ankle | Knee | Hip | L5S1 | |
|---|---|---|---|---|
| Reference peak moment (N∙m/BW) | 0.706 ± 0.034 | 0.768 ± 0.041 | 1.399 ± 0.037 | 2.504 ± 0.047 |
| Predicted peak moment (N∙m/BW) | 0.738 ± 0.036 | 0.735 ± 0.067 | 1.414 ± 0.031 | 2.377 ± 0.087 |
| Error rate (%) | 5.20 ± 4.85 | 8.77 ± 6.45 | 3.20 ± 2.33 | 5.19 ± 3.18 |
Publisher’s Note: MDPI stays neutral with regard to jurisdictional claims in published maps and institutional affiliations. |
© 2021 by the authors. Licensee MDPI, Basel, Switzerland. This article is an open access article distributed under the terms and conditions of the Creative Commons Attribution (CC BY) license (https://creativecommons.org/licenses/by/4.0/).
Share and Cite
Chae, S.; Choi, A.; Jung, H.; Kim, T.H.; Kim, K.; Mun, J.H. Machine Learning Model to Estimate Net Joint Moments during Lifting Task Using Wearable Sensors: A Preliminary Study for Design of Exoskeleton Control System. Appl. Sci. 2021, 11, 11735. https://doi.org/10.3390/app112411735
Chae S, Choi A, Jung H, Kim TH, Kim K, Mun JH. Machine Learning Model to Estimate Net Joint Moments during Lifting Task Using Wearable Sensors: A Preliminary Study for Design of Exoskeleton Control System. Applied Sciences. 2021; 11(24):11735. https://doi.org/10.3390/app112411735
Chicago/Turabian StyleChae, Seungheon, Ahnryul Choi, Hyunwoo Jung, Tae Hyong Kim, Kyungran Kim, and Joung Hwan Mun. 2021. "Machine Learning Model to Estimate Net Joint Moments during Lifting Task Using Wearable Sensors: A Preliminary Study for Design of Exoskeleton Control System" Applied Sciences 11, no. 24: 11735. https://doi.org/10.3390/app112411735
APA StyleChae, S., Choi, A., Jung, H., Kim, T. H., Kim, K., & Mun, J. H. (2021). Machine Learning Model to Estimate Net Joint Moments during Lifting Task Using Wearable Sensors: A Preliminary Study for Design of Exoskeleton Control System. Applied Sciences, 11(24), 11735. https://doi.org/10.3390/app112411735