Featured Application
The proposed study can be applied to optimize energy consumption, generation and storage in neighbour communities with distributed energy resources.
Abstract
In reliability studies of isolated energy supply systems for residential buildings, supply failures due to insufficient generation are generally analysed. Recent studies conclude that this kind of analysis makes it possible to optimally design the sizes of the elements of the generation system. However, in isolated communities or rural areas, it is common to find groups of dwellings in which micro-renewable sources, such as photovoltaic (PV) systems, can be installed. In this situation, the generation and storage of several houses can be considered as an interconnected system forming a cooperative microgrid (CoMG). This work analyses the benefits that sharing two autonomous installations can bring to each one, from the point of view of reliability. The method consists of the application of a random sequential Monte Carlo (SMC) simulation to the CoMG to evaluate the impact of a simple cooperative strategy on the reliability of the set. The study considers random failures in the generation systems. The results show that the reliability of the system increases when cooperation is allowed. Additionally, at the design stage, this allows more cost-effective solutions than single sizing with a similar level of reliability.
1. Introduction
The increase in energy demand and dependence on fossil fuels [1] has boosted the integration of renewable energies [2]. This has favoured the development of distributed energy resources (DERs) [3], especially in rural or isolated areas [4].
Small size DERs in Spain are usually implemented through the so-called stand-alone photovoltaic (SAPV) energy systems [5,6,7], which generally include batteries to store energy and supply night demand. These types of systems are currently very attractive in rural areas thanks to the new regulations that have regulated self-consumption since 2019 [8]. In a general case, the energy storage system (ESS) could also be based on renewable energies, as in the case of micro hydroelectric plants or green hydrogen generators [9,10]. The great disadvantage of this type of system is the reliability of supply, since a profitable design usually implies a large number of hours per year of energy not supplied (ENS), increasing indices such as the loss of load probability (LOLP) to inappropriate levels [11]. Due to the high price of ESSs, especially those based on renewable energies, an optimized design of the generation system is of vital importance. In this sense, there are studies that focus on improving the performance of these systems [12,13,14]. On the other hand, other works are focused on improving the management of generation, demand and storage resources to obtain maximum reliability with the lowest possible cost [15,16].
The reliability of these systems can be improved with support systems such as a diesel generator, but it is necessary to manage the use of each resource with the best possible strategy to minimize diesel consumption, due to its price and environmental impact [17,18]. Thus, many studies have focused on the technical feasibility of these systems and their reliability [19]. A group of the developed studies have focused on the assessment of residential SAPV generation plants connected to the electricity distribution network. These allow the users to sell their energy surpluses or demand extra energy as needed. Another type of study has focused in isolated systems [20,21], which is the only available option in most rural areas. As stated before, the optimal design of these systems is very important [22]. To achieve a good design of these systems there have been a large number of methods developed, as can be seen in some review works [23,24].
One of the greatest measurable benefits of using systems based on renewable energy is the increase in the sustainability of the energy supply [25] and its positive impact against climate change [26]. Furthermore, various studies point to a clear correlation between the integration of these energy systems and economic growth [27,28,29]. Among the key elements of this type of system, the importance of the ESSs stands out [30]. On the other hand, one of the challenges that is arousing growing interest is the problem of optimizing these systems considering various realistic scenarios. There are multiple objectives that can be set to study this problem, such as energy supply in rural or isolated areas [31,32], losses minimization [33] or reliability improvement [34]. Among these objectives, reliability is one of the least studied and most important aspects in systems based on renewable energies, especially in rural areas, since in many cases the resources are intermittent [30] and difficult to predict [35]. One of the strategies that should be studied to improve the reliability of supply in systems based on renewable energies is the use of configurations following the architecture of a microgrid (MG) with cooperative behaviour [36], also called CoMG. This configuration can benefit the entire system in the different objectives discussed [37].
In summary, there are numerous papers that address the optimization of energy management based on renewable sources. However, they generally do not analyse the problem from the point of view of reliability and the guarantee of achieving a certain value in continuity of supply [6,9,17,18,20,23,24,32]. One of the few papers that includes reliability as a goal to design the size of an autonomous system with renewable energy is [34]. It optimizes the size of a system with three sources (solar, wind and tide) and an ESS. Reliability is studied from an annual curve for each resource (solar radiation, wind speed, water speed and demand) that reflects the mean values of 16 years. The results depend on the costs assigned to each system, but the advantage of a cooperative operation is not studied, which is the main objective of this paper. This is the main gap identified in the literature, since the published studies do not include, at the same time, a cooperative management strategy including random failures in the system, reliability optimization and optimal design of the facilities.
In a previous study [38], the authors developed a method to evaluate the reliability of an SAPV energy system in an isolated case using an SMC simulation methodology, which provides very useful information to improve the design of these systems. The methodology developed in this study is applicable with various objectives. On the one hand, the method allows us to propose an optimal design of the system to achieve the desired reliability. On the other hand, it allows us to study the reliability with different designs, which facilitates the analysis of the necessary support system (generally, a diesel generator). Finally, the parameterized result obtained with the developed method allows for a complete analysis of the system to be designed, controlling not only aspects related to the reliability of the supply but also the use of the energy generated and the sensitivity analysis of the system to various disturbances. It is important to note that this study aims at optimizing the size of the components of a single facility.
As indicated in the conclusions of this study, the authors consider that it is necessary to study the reliability of this type of system when several installations are connected in an MG. Going one step further, it is very interesting to analyse the impact on the reliability and optimal design of these systems of CoMGs. This will further improve facility designs and assess the reliability of the system as a whole, optimizing energy use and minimizing the use and size of support systems. Thus, in this work, two neighbouring houses whose demand throughout 2019 is known have been selected and a cooperative management strategy has been developed. The main objective of the presented study is to evaluate the reliability of the system and obtain an optimal design that improves the results of the individual design for each participant. The 2020 data have not been considered adequate after some analysis due to the pandemic situation, especially considering that an SMC method will be used to simulate multiple scenarios and draw reliable global conclusions. This study is the basis for evaluating the design and reliability of MGs in which each installation has its own SAPV energy system and its ESS and a connection to the MG. One type of these CoMGs is called a virtual power plant (VPP) in the literature. There are numerous works on VPPs. For an exhaustive review, works such as [39] can be consulted. However, these works focus in optimizing the management strategy of the different resources, which should only be conducted after an optimal design.
In this work, starting from a design based on the method described in [38], a simple cooperative management strategy has been developed and the reliability of the system has been evaluated using an SMC simulation approach. The method used allows the inclusion of random faults in the generation systems, which is one of the most overlooked aspects in reliability studies. The parameterized analysis of the results shows the potential to improve the design considering the cooperative management of the MG, which allows the minimization of costs, the minimization of the size and usage of support systems and a significant improvement in the reliability of the system as a whole. Thus, the main novelty of this work is the possibility of achieving an optimized design of a set of interconnected facilities, studying their reliability through a parameterized analysis. With the results of the analysis, it is possible to select the most appropriate design alternative according to the selected objectives.
The specific objectives that have been addressed in this work and that represent the novelty of the study are detailed below.
- Study the reliability of a set of two dwellings with their respective SAPV energy systems when operating with a cooperative strategy.
- Improve the design of all the systems considering global reliability.
- Analyse the impact of the cooperative strategy on the reliability and design of the systems.
In addition, as another novel aspect in the procedure used in this study, random failures in the generation system are considered to analyse supply reliability, in addition to the use of demand and generation curves with a random combination so that the result is consistent and robust. These random failures are generated following typical distributions extracted from scientific works.
With the presented method the authors try to address the gap identified in the literature of the optimal design and management in microgrids considering costs and reliability as the main targets. The novelty of the presented work relies on the practical application of a simple strategy to a rural area considering real data and random failures of the system to optimise the design of the components and the management with a cooperative strategy. This problem including cooperation between both systems represents a challenge that takes place in many isolated areas in the developed countries. The results of the method provide an economic benefit from the planning stage of the microgrid and an increase in the reliability of the participants’ energy supply, which is one of the main gaps in scientific publications.
The rest of the article has been structured as follows. Section 2 shows the materials and methods, summarizing the individual design of the dwellings using the method developed in [38] and proposing the cooperative management strategy to be used for the SMC in the selected scenarios. Section 3 shows the results of the SMC simulation comparing the system without interconnection with the system as an MG. Next, Section 4 shows the discussion of the results. Finally, Section 5 shows the conclusions of the study.
2. Materials and Methods
For this work, two neighbouring dwellings (D1 and D2) have been selected whose hourly demand has been registered for a whole year. In each of them, an SAPV energy system with an ESS made of batteries has been proposed, using an energy analysis, as described in [38]. Subsequently, using the SMC simulation method described in [38] the initial design has been optimized to achieve an LOLP around 2.6% (approximately between 200 and 240 h per year with energy supply from a diesel generator) in each dwelling.
The SMC consists of a simulation of 100 iterations of the behaviour of the system, each of them consisting of one year (8760 h). For each iteration of the study, an hourly sequence of the demand in each house during one year is used, randomly obtained from the real values measured during 2019.
The solar radiation (and therefore the power production per unit in the PV panels) is assumed to be the same for both dwellings, since they are close to each other. At each iteration, the daily radiation curve is randomized from the real values recorded during 2019.
Additionally, in each iteration, the failures of the generation system are also randomized, using a failure rate per year (). As explained in [40], the time to failure (TTF) of the PV plant and the mean time to repair (TTR) are modelled using an exponential and a Rayleigh distribution, respectively. Then, TTF and TTR are randomly generated with the inverse transform method [41].
From this simulation the mean values of the indices to be estimated are obtained: energy not used (ENU), hours with energy not used (HNU), ENS and LOLP. These indices are obtained every time for each dwelling individually and for the complete system.
The results obtained with the SMC simulation of each dwelling constitute the S1 scenario described in Section 2.1, which corresponds to the reliability of the system working as isolated dwellings. In this initial scenario, there is no interconnection between both houses. This scenario has been compared with a set of scenarios called S2x (for different values of x), which consist of cooperative scenarios in which both dwellings are considered interconnected in an MG and can share their resources, as explained in Section 2.2.
The main objective of defining this set of scenarios is to optimize the cooperation strategy so that both houses can benefit in a similar way. Figure 1 shows a diagram of the scenarios considered.
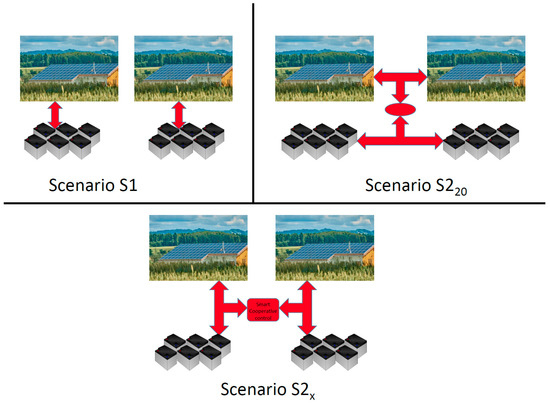
Figure 1.
Description of the scenarios considered.
2.1. Scenario S1
In scenario S1, the energy flows of each house are simple. In batteries, the state of charge (SOC) must be continuously monitored. All batteries have an up to which discharge is allowed. An can also be defined as the maximum SOC that should not be exceeded, which for this study is set at . If generation is greater than demand, the surplus energy is available to charge the ESS with an efficiency corresponding to the charging efficiency. If the ESS cannot be charged because it has reached , the available energy that could have been generated becomes a new amount of ENU. On the other hand, if generation is lower than demand, the deficit of energy being actually demanded can be supplied from the ESS with the efficiency corresponding to the discharging efficiency. Under these conditions, if the ESS cannot be discharged because it reaches , then there is a certain amount of ENS that will affect the studied indices. The operation of this scenario and the different situations that can take place are described in sufficient detail in [38]. Figure 2 shows the different energy lows and efficiencies in this scenario.
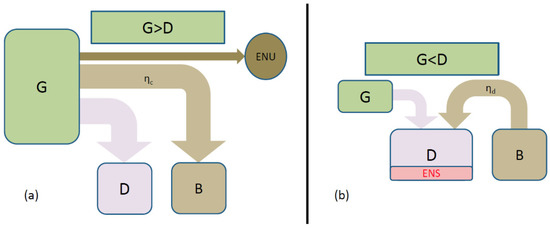
Figure 2.
Possible energy flows in S1 when generation is greater than demand (a) and when generation is lower than demand (b).
2.2. Scenarios S2x
S2x scenarios represent an actual CoMG situation. Each dwelling tries to be self-sufficient with its generation and its ESS, but, under certain conditions, each house can provide energy to the other when needed if it has enough energy surplus. To prevent one dwelling from incurring significant reliability losses when helping the other, a simple strategy has been established: dwellings can share energy if the stored energy is above a threshold, but they stop cooperating if it falls below that limit. Thus, this threshold is the key parameter of the proposed strategy. If the ESS is made up of batteries, the strategy entails allowing power sharing if , with being the SOC value set as the threshold for power sharing. Each scenario will be indicated as an S2x, where , using x as the key parameter of the study. If (which is the lower limit) is chosen, the scenario is equivalent to two houses with shared resources, without a cooperative strategy. This case will be called a shared scenario. In this work, has been set, so the S220 scenario corresponds to the case of the shared scenario but without an intelligent cooperative control, as depicted in Figure 1. In this case, there would be no cooperative strategy and the system would behave as if the resources of both houses were joined together and shared freely by both. For all S2x scenarios, the aforementioned indices have been parameterized as a function of between .
It is easy to verify that the situation in S220 produces unequal results: the home with the worst LOLP and the highest ENS has great benefits, but the one with the best starting indices worsens. This situation would not be admissible for the dwelling with a better initial situation in terms of LOLP and ENS. Therefore, it is necessary to differentiate between this particular case and two dwellings with a cooperative strategy to try to benefit both (S2x scenarios). Therefore, the S2x scenarios are parameterized as a function of x, studying various cases depending on the cooperation capacity of the two dwellings, as described below.
In S2x, the energy flows are slightly more complex, since under certain conditions an energy flow may appear from one dwelling (either from the generation system or ESS) to the other. In these crossed energy flows, the transmission efficiency has to be applied. For the explanation of the method, a superscript j will be used to indicate the dwelling to which each magnitude refers. For the calculation of the energy flows in these scenarios, if generation in a dwelling (Dj) is greater than demand, the surplus is available to charge its own ESS with the charging efficiency . If , the excess between generation and demand would be available to supply energy to the other dwelling with the transmission efficiency . Additionally, the energy stored in the battery of Dj between and could be offered to the other house, with an efficiency , where is the discharging efficiency.
The energy stored in the battery of Dj at each moment is , where is the nominal capacity of housing battery j.
Therefore, the following values are obtained:
- , maximum energy that can be available in battery of Dj.
- , value of energy stored in battery of Dj, below which it is not allowed to export energy to help the other dwelling.
- , minimum value of stored energy that must be maintained at all times to avoid damage to the battery.
The energy that will finally be put into circulation will be the minimum value between the energy available to help the other home and the maximum value required by the other home.
If the generation capacity exceeds the sum of demanded energy, storage capacity and energy transmitted to the other home, there will be an excess of generation capacity that will not be used, resulting in a certain amount of ENU.
Figure 3 shows the energy flows in S2x.
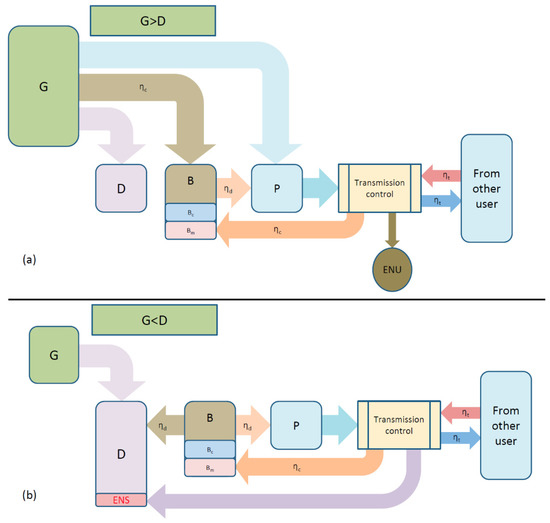
Figure 3.
Possible energy flows in S2x when generation is greater than demand (a) and when generation is smaller than demand (b).
If the generated energy is lower than demand, some demanded energy should be supplied with the energy stored in the ESS, with the efficiency . If the energy available in the ESS () is not enough to cover the demand, a situation with a need for energy from the transmission system is reached. To improve the reliability of the supply, it is also considered the energy needed in the ESS if it does not reach the , which is .
When energy is not demanded from the transmission system, since this energy is subjected to various actions with yields lower than 1 and, therefore, these transfers must be limited.
If the sum of the own generation, the energy available in the battery and the energy received from the cooperative system is not enough to cover the demand, there will be an ENS, which will be counted and will affect the studied indices.
From the demand and generation curves of each house, with the random failures generated and using a step of 1 h, the following set of equations describes the cooperative strategy to apply. The initial data needed for each dwelling are . Then, for each step , the values of must be obtained. Next, the surplus generation is calculated for each dwelling using Equation (1)
where is the usable energy that represents the surplus energy generation. If , there is a net surplus generation, so the next equations must be used
Otherwise, when , Equations (2)–(4) must be substituted by the following expressions, since there is a net generation deficit
After these intermediate calculations have been computed, Equation (8) is used to calculate , which represents the energy needed to supply the demand and to increase the energy stored up to .
The available energy to be sent to another participant, , also called pool energy, can be derived from Equation (9) as
With these values, the following equations must be used.
where is the energy that will be sent from Dj to Dk, and is the energy received by Dj from Dk.
At the end of step , the energy stored in the battery, , in Dj is calculated using Equation (12)
For the next step , the battery level will be updated as . Finally, the following two parameters are computed for each dwelling to evaluate the results of the simulation
2.3. Summary of the Proposed Method
Using the definitions and equations presented in this section, the steps used in the presented work are explained below.
The first stage was to collect the data of the facilities for a whole year. Then, with these data, the method described in [38] was used to obtain the optimal design for both facilities. As a result of this initial design, scenario S1 was simulated. As aforementioned, this scenario consists of two isolated facilities, so there is no possibility to interact or cooperate.
The simulation of a scenario is developed by performing 100 iterations of the yearly operation of both facilities to obtain the average reliability indices once the dispersion has been stabilized. These results are stored to compare all scenarios at the end of the study. This process is based on an SMC simulation to obtain the average reliability indices.
After analysing this scenario, the set of scenarios S2x for are studied. The first scenario in this set is S220, in which the resources are shared between both facilities. After completing the 100 iterations (the SMC simulation) and calculating the reliability indices, the value of x is increased in 5% and a new scenario is proposed.
Once all scenarios have been studied, the analysis of the reliability indices provides useful information about the systems. This information is discussed and some conclusions are drawn about the optimal design and management of the resources for this set of facilities. The proposed method is summarized in Figure 4.
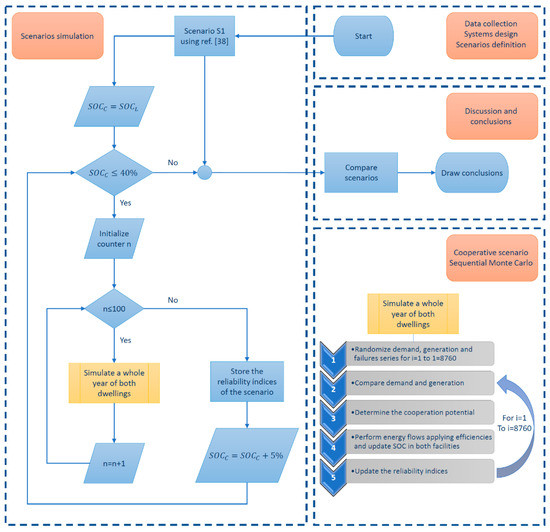
Figure 4.
Stages of the proposed method.
3. Results
The proposed method was applied to two real dwellings located in Valencia (Spain). The hourly demand curves were recorded during 2019 (avoiding the pandemic situation of 2020, as mentioned above). Likewise, a solar photovoltaic generation curve was registered in the GEDERLAB, a real facility next to the dwellings in which the generation and management of various renewable energy sources is studied. The recorded data was randomized swapping nearby days to develop the SMC simulation, so that the demand and generation curves maintained their seasonal patterns, but irregular situations such as a special event in a dwelling or a cloudy day did not match in each simulation. Figure 5 shows the typical patterns of demand for both dwellings and generation in each season of the year in per unit values.
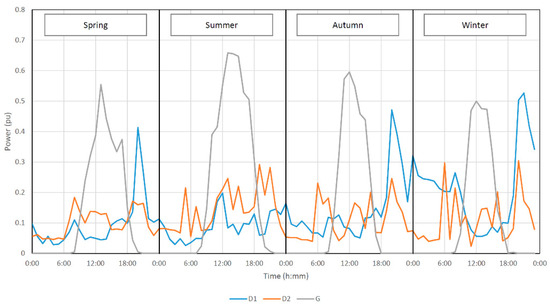
Figure 5.
Demand profile of each dwelling and generation profile for every season in per unit values.
Using the rules explained from Equation (1) to Equation (14), the SMC simulation was carried out. In each simulation, the results of all scenarios were evaluated. The simulation was repeated 100 times, checking that the average indices stabilized in order to analyse the results and draw conclusions.
To simulate the different scenarios, we started from the optimal design of both dwellings shown in Table 1, obtained after analysing the demand and generation of each dwelling using the method described in [38].

Table 1.
Generation, demand and design data for both dwellings.
3.1. Scenario S1
Scenario S1 consists of optimizing the and values of each dwelling, operating independently, to achieve an approximate LOLP of 2.6% in each case. The resulting values are shown in Table 1.
The simulation of 100 years in this situation allows obtaining the stationary values of the parameters shown in Figure 6, which represent the indices expectation. As shown in Figure 6, the design has been adjusted so that both dwellings have a similar LOLP value, although the ENS is not the same due to the differences in the registered demand curves.
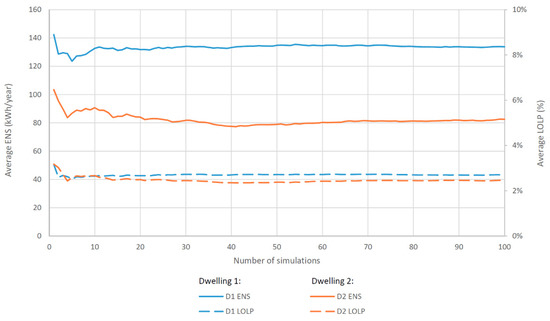
Figure 6.
SMC results in Scenario S1 for the most representative indicators (ENS and LOLP).
Although the radiation curves are identical for both dwellings, since they are neighbouring houses, the registered demand curves are different. For this reason, it is expected that the cooperative strategy can benefit both participants, thus improving the reliability indices. Figure 7 shows the generation and demand profiles obtained for a complete week in both dwellings with the proposed design.
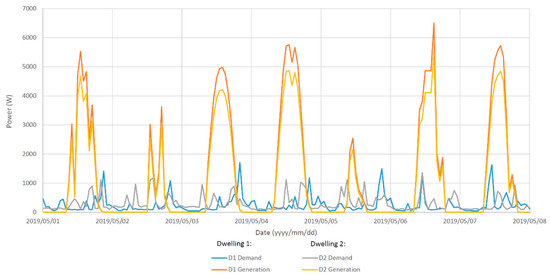
Figure 7.
Generation and demand profiles during a week with the proposed design.
3.2. Scenario S2x
A cooperative strategy is studied in each S2x scenario. Each dwelling supports the other as long as its battery is above . Between this value and (minimum value considered as a limit), the dwelling reserves its energy for its own use. This strategy avoids some interruptions in one of the dwellings, while it allows them to help the other in some periods of time.
With this strategy, it is also possible to take advantage of the energy surplus of one installation to charge the other’s ESS, which would reduce the overall ENU.
The key parameter for the study of this cooperative strategy is the value of . If , then all of the energy available in each dwelling can be shared with the other. This situation can be beneficial in global terms, but if the reliability of each dwelling or the consumption pattern is different, this shared strategy produces unequal benefits. The dwelling with the worst performance is greatly benefited, while the other may have a much lower improvement. This situation seems clearly unfair and it would be rejected by the dwelling with the best starting situation, since it would encourage dwellings to try to design their facilities with fewer resources and then take advantage of others’ resources. Therefore, starting from this shared scenario called S220, the value of will be gradually increased to analyse the improvements obtained in each dwelling and find the best situation for both.
Table 2 shows the global results of both dwellings and the individual results of S220. It is observed that this scenario produces better overall results than S1.

Table 2.
Scenario S1 vs. scenario S220.
As the table shows, there are significant improvements in reliability indices. However, dwelling D2, which was the one with the best initial results, is less benefited than D1. D2 is being more helpful to D1 than the other way around, which means that the situation is not fair, since the ideal scenario would be that both contributed in a similar way to improve the system.
That is why the S230 scenario is simulated, in which every dwelling reserves an energy reserve to supply its own demand, so that it stops relying on the other dwelling when . The results of this scenario compared to scenario S1 are shown in Table 3.

Table 3.
Scenario S1 vs. scenario S230.
In this scenario, the results obtained by both dwellings are very similar. It would not be a good idea to arbitrarily raise the SOC threshold that has been set as a limit to stop sharing resources, that is , since then the support between the dwellings would decrease. For example, setting , scenario S235 is simulated, the results of which are shown in Table 4, compared again with those of scenario S1.

Table 4.
Scenario S1 vs. scenario S235.
As it can be seen, although the total results are very similar to the previous case, dwelling D2 is now the most favoured. Finally, if is further increased to a value of = 40%, the results worsen, as seen in Table 5, where scenario S240 is compared with scenario S1.

Table 5.
Scenario S1 vs. scenario S240.
Therefore, the S230 scenario offers the most balanced results in terms of the improvements obtained by both dwellings. After applying the proposed method, the study was completed with a sensitivity analysis shown in Section 4.
4. Discussion
To see the evolution of the reliability of the dwellings for different values of , a sensitivity analysis was carried out with values between , simulating each of the resulting scenarios. By increasing the value of , the dwellings become more independent and the advantage of cooperation is lost, which is why it has been simulated in the aforementioned interval.
Figure 8 shows the improvement of LOLP in percentage compared to S1 of both dwellings in the simulated scenarios of this sensitivity analysis.
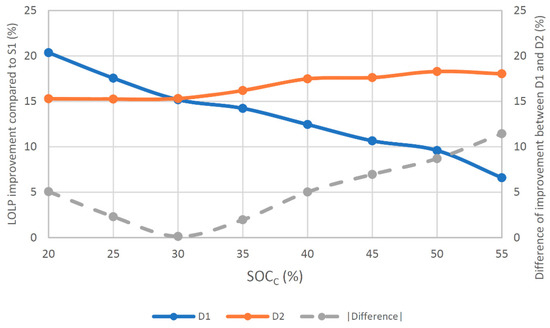
Figure 8.
Improvement in terms of LOLP for each dwelling in scenarios S2x compared to S1.
As depicted in Figure 8, with small values of , D1 improves much more than D2. This difference decreases when increases, and for values close to = 30%, both houses achieve a similar benefit.
The curves represented in Figure 9 show the LOLP of each dwelling in this case (scenario S230), which is shown to be the best of the studied cases, compared to the results of scenario S1.
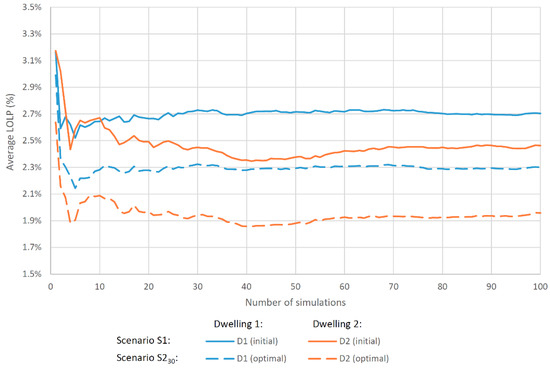
Figure 9.
LOLP of each dwelling in scenarios S1 and S230.
In addition, it should be noted that not only does the cooperative strategy represent an improvement compared to the S1, but it also improves the results of the shared scenario S220, as shown in Figure 10. This analysis solves one of the research gaps identified in the literature, as it proposes a simple cooperative strategy based on the key parameter . With this strategy, the system obtains better results than in other scenarios (shared and isolated), which correspond to other microgrid configurations in the literature (since most studies, such as [34], are exclusively focused on stand-alone). In addition, these results have a substantial impact to be taken into account, since they have been obtained using real data and proposing random failures in the system.
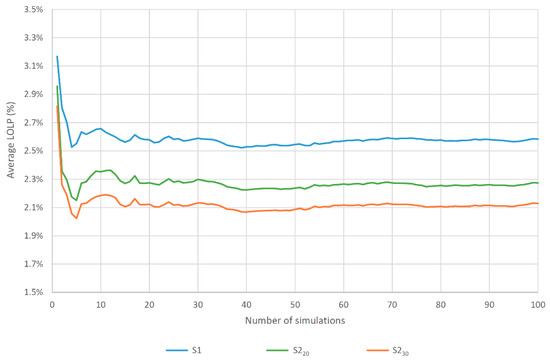
Figure 10.
LOLP of each dwelling in scenarios S1, S220 and S230.
The results obtained in this case study show that for a set of demand and generation curves, the most equitable strategy can be proposed by setting the parameter of at a certain value that can be determined with the proposed method. For this case study, this value was 30%, which made it possible to achieve better reliability values in both dwellings than those obtained without using cooperative strategies, while providing balanced improvements. Compared to most of the literature works (such as [22]), this is one of the key contributions of this study, since the cooperative strategy allows performance optimization and reliability improvements.
In addition to the presented case study, the described method would allow us to obtain an optimal design in different situations. One of the situations that could be addressed with the proposed method would be that of consumers who had generation curves with different patterns. This can take place when the geographical location of the considered consumers receives different radiation levels or when there is a different generation mix in the facilities (for example, including a wind turbine in one of them). The fact of having different generation patterns, in addition to having different load curves, further justifies the use of this cooperative strategy, since there is a greater probability to have one of the dwellings with an energy surplus when the other is in need of additional generation.
A case of special interest to study of this type of strategies is that of Virtual Power Plants (VPPs), since in the set of generation and demand curves aggregated in a VPP there can be a great variety of scenarios that can provide great benefits derived from the use of cooperative strategies.
In the developed case study, one of the implicit benefits obtained when planning the facilities to use cooperative strategies is the net reduction in installation costs due to the optimized use of resources. This has been carefully addressed in this work compared to the literature by adding random faults in the system to simulate the repair times and include their impact on the reliability indices (as opposed to most studies, such as [11]). Since both facilities share resources and they use them cooperatively, it is possible to obtain results similar to those obtained in S1 with a lower amount of installed resources. S1 corresponds to a scenario in which there is no interconnection between the two dwellings, so the cooperative strategy is not needed. For this reason, this scenario has been completed using the method described in [38]. The new proposal allows for the generalization of that method for a set of multiple prosumers in a single microgrid. From the improvement in this method it can be derived that to obtain the same results as in scenario S230 without sharing resources, it would be necessary to install a greater ESS in each facility. In scenario S230, the reliability parameters obtained are an ENS of 106,547 kWh and 66,109 kWh and a LOLP of 2.24% and 2.09% for D1 and D2, respectively. In order to reach these values for both dwellings in S1, the value of would have to be as shown in Table 6. This allows quantifying of the benefits of the proposed method compared to previous studies for the selected case study.

Table 6.
Initial design of batteries for scenario S1 to obtain the same results as in scenario S230.
Finally, together with the economic benefit obtained thanks to the described method, it is worth highlighting the environmental benefit of using fewer resources and needing less support from conventional systems, since in this type of dwellings diesel generators are commonly used to supply energy in the hours in which the SAPV system and the ESS are not able to cover the demand.
5. Conclusions
In this study, a method to analyse and improve the reliability of energy supply in two dwellings with their SAPV system and their ESS when they use a cooperative strategy has been proposed and validated. The method is based on the use of surplus generation and storage of one facility to supply energy to the other facility when needed, fixing a minimum amount of energy to stop cooperating in order to avoid losing energy needed to supply its own demand, defined by means of the key parameter . To test the method, it has been applied to two real neighbouring dwellings, using real generation and demand curves. The algorithm is based on the use of a random SMC simulation to find the stable values of the selected reliability indices. As the simulations show, the results of the cooperative strategy are better than the individual results in terms of reliability, but the improvement in both dwellings can be unequal. The method has proven to be useful to find the most even strategy adjusting the level of the minimum SOC needed to start cooperating.
It is important to note that the data were restricted to 2019 due to the anomalous demand pattern shown during the pandemic situation, but the study can be repeated with any other data. In fact, the method shown in this work could be applied to a larger scale case study, i.e., to two neighbouring communities, with larger demand needs and a greater generation mix. As a future work, the authors propose to explore the application of a strategy such as the one proposed here for virtual power plants (VPP), since this would allow the use of more demand curves and different generation curves for each consumer, leading to higher differences between the analysed scenarios and probably to higher chances to improve the global reliability. Additionally, studying the economic impact of the proposed method is a research line that the authors propose to include in future studies.
Author Contributions
Conceptualization, C.R.-B. and C.R.-P.; Data curation, C.R.-B., E.Q. and G.E.-E.; Formal analysis, C.R.-P.; Funding acquisition, C.R.-P. and G.E.-E.; Investigation, C.R.-B. and C.R.-P.; Methodology, C.R.-B. and C.R.-P.; Project administration, C.R.-P. and G.E.-E.; Resources, G.E.-E.; Software, C.R.-B.; Supervision, C.R.-P.; Validation, C.R.-B., E.Q. and G.E.-E.; Visualization, C.R.-P. and E.Q.; Writing—original draft, C.R.-B. and C.R.-P.; Writing—review and editing, C.R.-B. and G.E.-E. All authors have read and agreed to the published version of the manuscript.
Funding
This work was supported by Conselleria de Educación, Investigación, Cultura y Deporte (Grant No. AICO/2019/001).
Institutional Review Board Statement
Not applicable.
Informed Consent Statement
Not applicable.
Conflicts of Interest
The authors declare no conflict of interest.
Abbreviations
| B | Energy stored in battery at the beginning of the step |
| Energy stored at the end of the step | |
| Intermediate results related to stored energy | |
| Minimum level of energy in the battery to allow cooperating | |
| Minimum accepted level of battery | |
| Maximum battery capacity in kWh | |
| Rated battery capacity | |
| Demanded energy | |
| Dj | Dwelling j, j ∈ {1,2} |
| Energy surplus. If E ≥ 0, there is an energy surplus. If E < 0, there is an energy deficit. | |
| Energy not supplied | |
| Energy not used | |
| ESS | Energy storage system |
| Ey | Annual energy consumption |
| Generated energy | |
| HNU | Hours with energy not used |
| Subscript, referring to each step | |
| Superscript, referring to each participant | |
| LOLP | Loss of load probability index |
| Energy needed to supply the demand and to increase the energy stored to BC | |
| Available energy to be sent to other participant | |
| Maximum demanded power in dwelling j | |
| Rated power installed in the photovoltaic panels | |
| SAPV | Stand-alone photovoltaic system |
| SMC | Sequential Monte Carlo |
| SOC | State of charge |
| Minimum level of state of charge to allow cooperation | |
| Minimum allowed level of state of charge | |
| Maximum allowed level of state of charge | |
| S1 | Scenario 1 (base scenario without sharing resources) |
| S2x | Scenario 2x (cooperative scenario) |
| TTF | Time to failure |
| TTR | Time to repair |
| Intermediate result related to energy to be transferred from user j to user k | |
| Energy received in user j from user k | |
| Usable surplus. If U ≥ 0, the demand is covered. If U < 0, the demand is not covered | |
| VPP | Virtual power plant |
| Efficiency of battery charging | |
| Efficiency of battery discharging | |
| Efficiency of energy transmission | |
| Photovoltaic panel array and battery controller failure rate per year |
References
- Al-Maamary, H.M.S.; Kazem, H.A.; Chaichan, M.T. The impact of oil price fluctuations on common renewable energies in GCC countries. Renew. Sustain. Energy Rev. 2017, 75, 989–1007. [Google Scholar] [CrossRef]
- Lasseter, R.H. Smart Distribution: Coupled Microgrids. Proc. IEEE 2011, 99, 1074–1082. [Google Scholar] [CrossRef]
- Bouffard, F.; Kirschen, D.S. Centralised and distributed electricity systems. Energy Policy 2008, 36, 4504–4508. [Google Scholar] [CrossRef]
- Woldeyohannes, A.D.; Woldemichael, D.E.; Baheta, A.T. Sustainable renewable energy resources utilization in rural areas. Renew. Sustain. Energy Rev. 2016, 66, 1–9. [Google Scholar] [CrossRef]
- Mandelli, S.; Barbieri, J.; Mereu, R.; Colombo, E. Off-grid systems for rural electrification in developing countries: Definitions, classification and a comprehensive literature review. Renew. Sustain. Energy Rev. 2016, 58, 1621–1646. [Google Scholar] [CrossRef]
- Luthander, R.; Widén, J.; Nilsson, D.; Palm, J. Photovoltaic self-consumption in buildings: A review. Appl. Energy 2015, 142, 80–94. [Google Scholar] [CrossRef] [Green Version]
- Evans, A.; Strezov, V.; Evans, T.J. Assessment of utility energy storage options for increased renewable energy penetration. Renew. Sustain. Energy Rev. 2012, 16, 4141–4147. [Google Scholar] [CrossRef]
- Ministerio para la Transición Ecológica. Real Decreto 244/2019, de 5 de Abril, Por el Que se Regulan Las Condiciones Administrativas, Técnicas y Económicas del Autoconsumo de Energía Eléctrica; Ministerio para la Transición Ecológica: Madrid, Spain, 2018. [Google Scholar]
- Stoppato, A.; Cavazzini, G.; Ardizzon, G.; Rossetti, A. A PSO (particle swarm optimization)-based model for the optimal management of a small PV(Photovoltaic)-pump hydro energy storage in a rural dry area. Energy 2014, 76, 168–174. [Google Scholar] [CrossRef]
- Topriska, E.; Kolokotroni, M.; Dehouche, Z.; Wilson, E. Solar hydrogen system for cooking applications: Experimental and numerical study. Renew. Energy 2015, 83, 717–728. [Google Scholar] [CrossRef] [Green Version]
- Bahramirad, S.; Reder, W.; Khodaei, A. Reliability-Constrained Optimal Sizing of Energy Storage System in a Microgrid. IEEE Trans. Smart Grid 2012, 3, 2056–2062. [Google Scholar] [CrossRef]
- Pan, M.-A.; Lau, T.-K.; Tang, Y.; Wu, Y.-C.; Liu, T.; Li, K.; Chen, M.-C.; Lu, X.; Ma, W.; Zhan, C. 16.7%-efficiency ternary blended organic photovoltaic cells with PCBM as the acceptor additive to increase the open-circuit voltage and phase purity. J. Mater. Chem. A 2019, 7, 20713–20722. [Google Scholar] [CrossRef]
- Fisac, M.; Villasevil, F.X.; López, A.M. High-efficiency photovoltaic technology including thermoelectric generation. J. Power Sources 2014, 252, 264–269. [Google Scholar] [CrossRef]
- Zerhouni, F.Z.; Zerhouni, M.H.; Zegrar, M.; Benmessaoud, M.T.; Stambouli, A.B.; Midoun, A. Proposed methods to increase the output efficiency of a photovoltaic (PV) system. Acta Polytech. Hung. 2010, 7, 55–70. [Google Scholar]
- Roldan-Blay, C.; Escrivá-Escrivá, G.; Roldán-Porta, C.; Álvarez-Bel, C. An optimisation algorithm for distributed energy resources management in micro-scale energy hubs. Energy 2017, 132, 126–135. [Google Scholar] [CrossRef]
- Roldán-Blay, C.; Escrivá-Escrivá, G.; Roldán-Porta, C. Improving the benefits of demand response participation in facilities with distributed energy resources. Energy 2018, 169, 710–718. [Google Scholar] [CrossRef]
- Ismail, M.S.; Moghavvemi, M.; Mahlia, T.M.I. Techno-economic analysis of an optimized photovoltaic and diesel generator hybrid power system for remote houses in a tropical climate. Energy Convers. Manag. 2013, 69, 163–173. [Google Scholar] [CrossRef]
- Maheri, A. Multi-objective design optimisation of standalone hybrid wind-PV-diesel systems under uncertainties. Renew. Energy 2014, 66, 650–661. [Google Scholar] [CrossRef] [Green Version]
- Goel, S.; Sharma, R. Performance evaluation of stand alone, grid connected and hybrid renewable energy systems for rural application: A comparative review. Renew. Sustain. Energy Rev. 2017, 78, 1378–1389. [Google Scholar] [CrossRef]
- Ghafoor, A.; Munir, A. Design and economics analysis of an off-grid PV system for household electrification. Renew. Sustain. Energy Rev. 2015, 42, 496–502. [Google Scholar] [CrossRef]
- Maleki, A.; Hajinezhad, A.; Rosen, M.A. Modeling and optimal design of an off-grid hybrid system for electricity generation using various biodiesel fuels: A case study for Davarzan, Iran. Biofuels 2016, 7, 669–712. [Google Scholar] [CrossRef]
- Shin, H.; Hur, J. Optimal Energy Storage Sizing With Battery Augmentation for Renewable-Plus-Storage Power Plants. IEEE Access 2020, 8, 187730–187743. [Google Scholar] [CrossRef]
- Twaha, S.; Ramli, M.A. A review of optimization approaches for hybrid distributed energy generation systems: Off-grid and grid-connected systems. Sustain. Cities Soc. 2018, 41, 320–331. [Google Scholar] [CrossRef]
- Zhou, W.; Lou, C.; Li, Z.; Lu, L.; Yang, H. Current status of research on optimum sizing of stand-alone hybrid solar–wind power generation systems. Appl. Energy 2010, 87, 380–389. [Google Scholar] [CrossRef]
- Cîrstea, S.D.; Moldovan-Teselios, C.; Cîrstea, A.; Turcu, A.C.; Darab, C.P. Evaluating Renewable Energy Sustainability by Composite Index. Sustainability 2018, 10, 811. [Google Scholar] [CrossRef] [Green Version]
- Kung, C.-C.; McCarl, B.A. Sustainable Energy Development under Climate Change. Sustainability 2018, 10, 3269. [Google Scholar] [CrossRef] [Green Version]
- Ntanos, S.; Skordoulis, M.; Kyriakopoulos, G.; Arabatzis, G.; Chalikias, M.; Galatsidas, S.; Batzios, A.; Katsarou, A. Renewable Energy and Economic Growth: Evidence from European Countries. Sustainability 2018, 10, 2626. [Google Scholar] [CrossRef] [Green Version]
- Armeanu, D.Ş.; Vintilă, G.; Gherghina, Ş.C. Does Renewable Energy Drive Sustainable Economic Growth? Multivariate Panel Data Evidence for EU-28 Countries. Energies 2017, 10, 381. [Google Scholar] [CrossRef]
- Bilan, Y.; Streimikiene, D.; Vasylieva, T.; Lyulyov, O.; Pimonenko, T.; Pavlyk, A. Linking between Renewable Energy, CO2 Emissions, and Economic Growth: Challenges for Candidates and Potential Candidates for the EU Membership. Sustainability 2019, 11, 1528. [Google Scholar] [CrossRef] [Green Version]
- Zsiborács, H.; Baranyai, N.H.; Vincze, A.; Zentkó, L.; Birkner, Z.; Máté, K.; Pintér, G. Intermittent Renewable Energy Sources: The Role of Energy Storage in the European Power System of 2040. Electronics 2019, 8, 729. [Google Scholar] [CrossRef] [Green Version]
- Cebotari, S.; Benedek, J. Renewable Energy Project as a Source of Innovation in Rural Communities: Lessons from the Periphery. Sustainability 2017, 9, 509. [Google Scholar] [CrossRef] [Green Version]
- Ali, S.; Jang, C.-M. Optimum Design of Hybrid Renewable Energy System for Sustainable Energy Supply to a Remote Island. Sustainability 2020, 12, 1280. [Google Scholar] [CrossRef] [Green Version]
- Reddy, P.D.P.; Reddy, V.C.V.; Manohar, T.G. Ant Lion optimization algorithm for optimal sizing of renewable energy resources for loss reduction in distribution systems. J. Electr. Syst. Inf. Technol. 2018, 5, 663–680. [Google Scholar]
- Bashir, M.; Sadeh, J. Size optimization of new hybrid stand-alone renewable energy system considering a reliability index. In Proceedings of the 2012 11th International Conference on Environment and Electrical Engineering, Venice, Italy, 18–25 May 2012; pp. 989–994. [Google Scholar]
- Kim, S.-G.; Jung, J.-Y.; Sim, M.K. A Two-Step Approach to Solar Power Generation Prediction Based on Weather Data Using Machine Learning. Sustainability 2019, 11, 1501. [Google Scholar] [CrossRef] [Green Version]
- Hammad, E. Resilient cooperative microgrid networks. IEEE Trans. Ind. Inform. 2019, 16, 1539–1548. [Google Scholar] [CrossRef]
- Wallsgrove, R.; Woo, J.; Lee, J.-H.; Akiba, L. The Emerging Potential of Microgrids in the Transition to 100% Renewable Energy Systems. Energies 2021, 14, 1687. [Google Scholar] [CrossRef]
- Quiles, E.; Roldán-Blay, C.; Escrivá-Escrivá, G.; Roldán-Porta, C. Accurate Sizing of Residential Stand-Alone Photovoltaic Systems Considering System Reliability. Sustainability 2020, 12, 1274. [Google Scholar] [CrossRef] [Green Version]
- Nosratabadi, S.M.; Hooshmand, R.-A.; Gholipour, E. A comprehensive review on microgrid and virtual power plant concepts employed for distributed energy resources scheduling in power systems. Renew. Sustain. Energy Rev. 2017, 67, 341–363. [Google Scholar] [CrossRef]
- Billinton, R.; Jonnavithula, A. Application of sequential monte carlo simulation to evaluation of distributions of composite system indices. IEEE Proc. Gener. Transm. Distrib. 1997, 144, 87–90. [Google Scholar] [CrossRef]
- Billinton, R.; Allan, R.N. Reliability Evaluation of Power Systems; Springer: Boston, MA, USA, 1984. [Google Scholar]
Publisher’s Note: MDPI stays neutral with regard to jurisdictional claims in published maps and institutional affiliations. |
© 2021 by the authors. Licensee MDPI, Basel, Switzerland. This article is an open access article distributed under the terms and conditions of the Creative Commons Attribution (CC BY) license (https://creativecommons.org/licenses/by/4.0/).